Supplementary Figure 1. HOPX is hypermethylated in NPC. (a) Methylation levels of HOPX in Normal (n = 24) and NPC (n = 24) tissues from the
|
|
|
- Brianna Hart
- 6 years ago
- Views:
Transcription
 Bisulfite pyrosequencing analysis of the HOPX promoter region in NPEC (NP69, N2-Tert and N2-Bmi1) and NPC (SUNE1, CNE1, CNE2, HNE1 and HONE1) cell lines. Magenta words: CG site of cg21899596.")
1 Supplementary Figure 1. HOPX is hypermethylated in NPC. (a) Methylation levels of HOPX in Normal (n = 24) and NPC (n = 24) tissues from the genome-wide methylation microarray data. Mean ± s.d.; Student s t-tests. (b) Bisulfite pyrosequencing analysis of the HOPX promoter region in NPEC (NP69, N2-Tert and N2-Bmi1) and NPC (SUNE1, CNE1, CNE2, HNE1 and HONE1) cell lines. Magenta words: CG site of cg These data are representative of three independent experiments.
 Bisulfite pyrosequencing analysis of the HOPX promoter region in NPEC (NP69, N2-Tert and N2-Bmi1) and NPC (SUNE1, CNE1, CNE2, HNE1 and HONE1) cell lines following")
2 Supplementary Figure 2. HOPX is hypermethylated in NPC cells. (a) Bisulfite pyrosequencing analysis of the HOPX promoter region in NPEC (NP69, N2-Tert and N2-Bmi1) and NPC (SUNE1, CNE1, CNE2, HNE1 and HONE1) cell lines following treatment with DAC. Magenta words: CG site of cg These data are representative of three independent experiments.
 Migration ability was measured using a wound healing assay (200 ) (b) and Transwell assay without Matrigel (200 ) (c) in HONE1 cells with the vector or HOPX overexpression.")
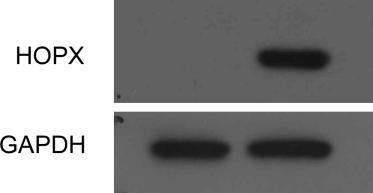
3 Supplementary Figure 3. HOPX suppresses HONE1 cell migration in vitro. (a) The ectopic expression of HOPX in HONE1 cells was confirmed by western blotting. (b,c) Migration ability was measured using a wound healing assay (200 ) (b) and Transwell assay without Matrigel (200 ) (c) in HONE1 cells with the vector or HOPX overexpression. Scale bar: 100 μm; Mean ± s.d.; *, P < 0.01 compared with vector; Student s t-tests. These data are representative of three independent experiments.
 were used to knock down the expression of HOPX in CNE2 and SUNE1 cells with stable HOPX overexpression (CH and SH).")
4 Supplementary Figure 4. Silencing HOPX promotes NPC cell migration in vitro. Control NC, or HOPX-siRNAs (si-1 and si-2) were used to knock down the expression of HOPX in CNE2 and SUNE1 cells with stable HOPX overexpression (CH and SH). (a) The silencing effects of HOPX in CH and SH cells were confirmed by western blotting. (b,c) Wound healing assay (200 ) (b) and Transwell assay without Matrigel (200 ) (c) were used to measure the migration abilities. Scale bar: 100 μm; mean ± s.d.; *, P < 0.01 compared with NC; Student s t-tests. These data are representative of three independent experiments.
 MTT assay was performed to examine the effect of HOPX on cell viability in CNE2 and SUNE1 cells stably overexpressed the vector or HOPX, or N2-Tert and NP69 cells transfected with the control NC")
5 Supplementary Figure 5. HOPX exhibits little effect on NPC cell proliferation in vitro. (a) MTT assay was performed to examine the effect of HOPX on cell viability in CNE2 and SUNE1 cells stably overexpressed the vector or HOPX, or N2-Tert and NP69 cells transfected with the control NC or HOPX-siRNAs (si-1 and si-2). Mean ± s.d.; P > 0.05 compared with vector or NC; Student s t-tests. (b) Colony formation assay was used to examine the effect of HOPX on colonization in CNE2, SUNE1 and HONE1 cells with the vector or HOPX overexpression. Mean ± s.d.; P > 0.05 compared with vector; Student s t-tests. These data are representative of three independent experiments.

6 Supplementary Figure 6. HOPX partially inhibits EMT in NPC cells. (a) Phase contrast images (200 ) of SH cells which were transfected with the control NC or HOPX-siRNAs (si-1 and si-2). SH cells indicated SUNE1 cells with HOPX overexpression. Scale bar: 100 μm. (b) The mrna level of ECADHERIN was identified using a tumor metastasis PCR array in SUNE1 cells stably overexpressed the vector or HOPX. Mean ± s.d.; *, P < 0.01 compared with vector; Student s t-tests. These data are representative of three independent experiments.
 Real time RT-PCR was used to examine the mrna level of EMT-TFs (SNAIL, SLUG, ZEB1, ZEB2, TWIST1 and FOXC2) in CNE2 and SUNE1 cells stably overexpressed the vector or HOPX (a), or N2-Tert and")
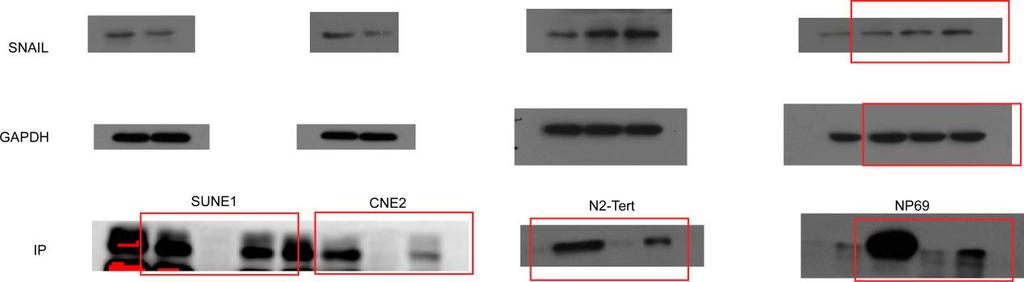
7 Supplementary Figure 7. HOPX suppresses SNAIL expression in NPC. (a,b) Real time RT-PCR was used to examine the mrna level of EMT-TFs (SNAIL, SLUG, ZEB1, ZEB2, TWIST1 and FOXC2) in CNE2 and SUNE1 cells stably overexpressed the vector or HOPX (a), or N2-Tert and NP69 cells transiently expressed control NC or HOPX-siRNAs (si-1 and si-2) (b). Mean ± s.d.; *, P < 0.01 compared with vector or NC; Student s t-tests. (c) ChIP assay using an anti-hopx antibody was performed to pull down HOPX. Western blotting (WB) was conducted to examine HOPX using an anti-hopx Antibody. (d,e) ChIP-PCR assay was conducted to assess the enrichment of HOPX in the promoter regions of SNAIL in CH, SH, N2-Tert and NP69 cells. CH and SH cells indicated CNE2 and SUNE1 cells with HOPX exogenous expression. These data are representative of three independent experiments.
 was conducted to examine HOPX using an anti-hopx Antibody. (b) Western blotting assay was used to assess the expression levels of HDAC2, HOPX and GAPDH.")
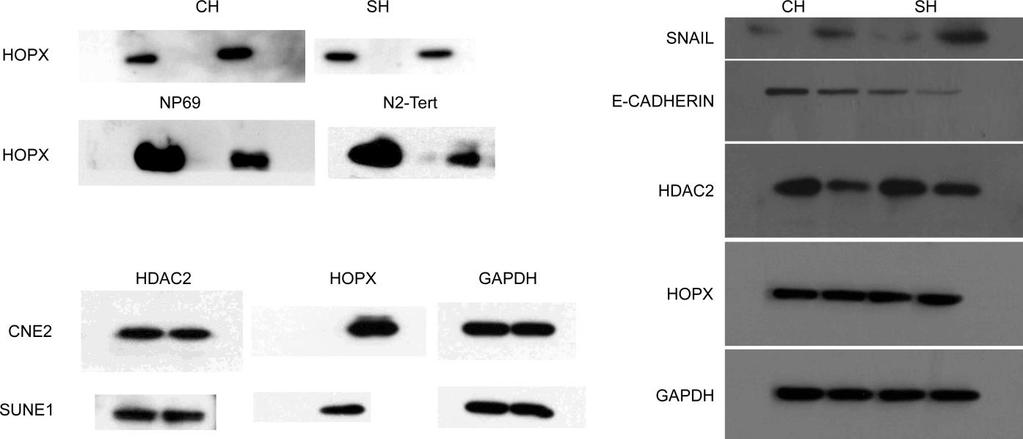
8 Supplementary Figure 8. Silencing HDAC2 reverses the inhibitory effects of HOPX on invasiveness and EMT in NPC. (a) IP assay using anti-hopx antibody was performed to pull down HOPX. Western blotting (WB) was conducted to examine HOPX using an anti-hopx Antibody. (b) Western blotting assay was used to assess the expression levels of HDAC2, HOPX and GAPDH. (c) Transwell assay with Matrigel (200 ) was used to measure the invasive ability of CH and SH cells which were transfected with the control sinc or sihdac2. Scale bar: 100 μm; mean ± s.d.; *, P < 0.01 compared with sinc; Student s t-tests. (d) Western blotting assay was used to examine the expression levels of SNAIL, ECADHERIN, HDAC2, HOPX and GAPDH in CH and SH cells which were transfected with the control sinc or sihdac2. CH and SH cells indicated CNE2 and SUNE1 cells with HOPX exogenous expression. These data are representative of three independent experiments.
 Wild type and mutant SNAIL-luciferase reporters were constructed and transfected with the control N or SRF construct in CNE2 and SUNE1 cells for 24 h.")
9 Supplementary Figure 9. HOPX inhibits SRF-mediated SNAIL transcription in NPC. (a) Wild type and mutant SNAIL-luciferase reporters were constructed and transfected with the control N or SRF construct in CNE2 and SUNE1 cells for 24 h. Luciferase reporter assay was used to detect the luciferase activity. Mean ± s.d.; *, P < 0.01 compared with N-wt; Student s t-tests. (b) Co-IP assay was used to measure the interaction between HOPX and SRF in CNE2 and SUNE1 cells stably overexpressed the vector or HOPX. (c) Western blotting assay was used to assess the expression levels of SRF, HOPX and GAPDH. (d) Wild type and mutant SNAIL-luciferase reporters were constructed and transfected with the vector (V) or HOPX construct in CNE2 and SUNE1 cells for 24 h. Luciferase reporter assay was used to detect the luciferase activity. Mean ± s.d.; *, P < 0.01 compared with V-wt; Student s t-tests. (e) CNE2 and SUNE1 cells were co-transfected with the HOPX and SRF. V and N were used as empty vectors of HOPX and SRF, respectively. Relative SRF and HOPX mrna expressions were measured via real time RT-PCR. Mean ± s.d.; *, P < 0.01 compared with V + N; Student s t-tests. (f) Transwell assay with Matrigel (200 ) was used to measure the invasive ability of CH and SH cells which were transfected with the control N or SRF expression plasmids. Scale bar: 100 μm; mean ± s.d.; *, P < 0.01 compared with N; Student s t-tests. (g) Western blotting assay was used to examine the expression levels of SNAIL, ECADHERIN, SRF, HOPX and GAPDH in CH and SH cells which were transfected with the control N or SRF expression plasmids. CH and SH cells indicated CNE2 and SUNE1 cells with HOPX exogenous expression. These data are representative of three independent experiments.
 Immunofluorescence images (600 ) of HOPX (orange), HDAC2 (magenta) and SRF (cyan) expression in CNE2 and SUNE1 cells stably overexpressed the vector or HOPX.")
10 Supplementary Figure 10. HOPX is co-localized with HDAC2 and SRF in NPC cells. (a) Immunofluorescence images (600 ) of HOPX (orange), HDAC2 (magenta) and SRF (cyan) expression in CNE2 and SUNE1 cells stably overexpressed the vector or HOPX. Scale bar: 100 μm. These data are representative of three independent experiments.
 Representative images (200 ) of the microscopic primary tumor in foot pad stained with H & E. Arrows represent lymphatic vessels. Scale bar: 100 μm.")
11 Supplementary Figure 11. Restoring HOPX expression inhibits NPC cell aggressiveness in vivo. (a) Quantification of the average volumes of the primary foot pad tumors. Mean ± s.d.; P > 0.05 compared with vector; Student s t-tests. (b) Representative images (200 ) of the microscopic primary tumor in foot pad stained with H & E. Arrows represent lymphatic vessels. Scale bar: 100 μm. These data are representative of eight independent experiments (each mouse sample was considered as one independent experiment; three technological replications were repeated in each sample).
12 Supplementary Figure 12. The methylation level of HOPX is positively associated with the SNAIL mrna level in NPC. (a) HOPX methylation levels were determined via bisulfite pyrosequencing, while the SNAIL mrna levels were determined via real time RT-PCR in NPC tissues (n = 24). Statistical analysis was performed using the Pearson s coefficient test. These data are representative of three independent experiments.
13 Supplementary Figure 13. HOPX hypermethylation is associated with poor prognosis in the combined cohort of NPC. All patients in the training and validation cohorts were combined (n = 443). (a-c) Kaplan-Meier analysis was performed to determine the DMFS (a), OS (b) and DFS (c) according to HOPX methylation levels (low methylation vs high methylation) in NPC patients. Adjusted univariate Cox proportional hazard models were used to calculate the HR values and P values.
14 Supplementary Figure 14. HOPX hypermethylation is associated with poor prognosis stratified by TNM stage. (a) DMFS, (b) OS and (c) DFS in NPC patients within TNM stage III-IV (n = 335). Adjusted univariate Cox proportional hazard models were used to calculate the HR values and P values.
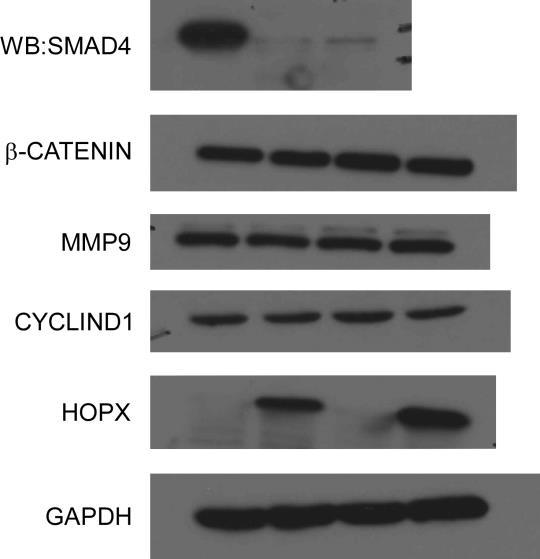
 Co-IP assay was used to measure the interaction between HOPX and SMAD4 in SUNE1 cells with stable HOPX overexpression.")
15 Supplementary Figure 15. HOPX exhibits little effect on the WNT signaling pathway. (a) Co-IP assay was used to measure the interaction between HOPX and SMAD4 in SUNE1 cells with stable HOPX overexpression. (b) Western blotting assay of HOPX, β-catenin, MMP9 and CYCLIND1 expression in CNE2 and SUNE1 cells with vector or HOPX overexpression. These data are representative of three independent experiments.
16 Supplementary Table 1. The top 10 differentially expressed genes between SUNE1 cells with HOPX or vector overexpression using tumor metastasis PCR array. P value is compared with the control using Student s t-tests; genes are ranked by P value. These data are representative of three independent experiments. Gene Functional Gene Grouping Fold change P value CXCL12 Cytokines IL1B Cell Cycle Regulation; Negative Regulation of Cell Proliferation; Cytokines; Apoptosis NME4 Other Genes Related to Metastasis MMP2 Matrix Metalloproteinases EPHB2 Receptors SERPINE1 Other ECM Proteins COL4A2 Other ECM Proteins ECADHERIN Cell to Cell Adhesion SYK CD44 Cell to Cell Adhesion; Other Genes Related to Growth Cell to Cell Adhesion; Transmembrane Receptors
17 Supplementary Table 2. Clinical characteristics of Nasopharyngeal Carcinoma patients according to the HOPX methylation level in the training and validation Cohorts. Training Cohort (n = 255) Validation Cohort (n = 188) Low High Low High Characteristic Methylation Methylation P value * Methylation Methylation P value * Group (%) Group (%) Group (%) Group (%) n=70 n=185 n=77 n=111 Age (mean ± S.D.) < (58.6) 93 (50.3) (45.5) 37 (33.3) (41.4) 92 (49.7) 42 (54.5) 74 (66.7) Sex Female 17 (24.3) 52(28.1) (29.9) 29 (26.1) Male 53 (75.7) 133(71.9) 54 (70.1) 82 (73.9) WHO pathologic type I + II 1 (1.4) 5 (2.7) (10.4) 6 (5.4) III 69 (98.6) 180(97.3) 69(89.6) 105 (94.6) VCA-IgG < 80 9 (12.9) 20(10.8) (71.4) 65 (58.6) (87.2) 165(89.2) 22 (28.6) 46 (41.4) EA-IgG < (22.9) 33(17.8) (31.2) 24 (21.6) (77.2) 152(82.2) 53 (68.8) 87 (78.4) TNM Stage I-II 23 (32.9) 38 (20.5) (27.3) 26 (23.4) III-IV 47 (67.1) 147 (79.5) 56 (72.7) 85(76.6) Relapses or deaths No 57 (81.4) 120 (64.9) (77.9) 67 (60.4) Yes 13 (18.6) 65 (35.1) 17 (22.1) 44 (39.6)
18 Distant metastasis No 63 (90.0) 137 (74.1) (89.6) 82 (73.9) Yes 7 (10.0) 48 (25.9) 8 (10.4) 29 (26.1) Death No 56 (80.0) 114 (61.6) (81.8) 73 (65.8) Yes 14 (20.0) 71 (38.4) 14 (18.2) 38 (34.2) *χ 2 test or Fisher s exact test; TNM, tumor-node-metastasis; VCA-IgA, viral capsid antigen immunoglobulin A; EA-IgA, early antigen immunoglobulin A; All patients were restaged according to the 7 th edition of the AJCC Cancer Staging Manual.
19 Supplementary Table 3. Univariate and multivariate Cox regression analysis of HOPX methylation level and survival. Univariate analysis Multivariate analysis Variable HR 95%CI P value HR 95%CI P value Distant metastasis-free survival Training set HOPX methylation (Low vs High) TNM stage (I-IIvs III-IV) Sex (Female vs Man) Age ( 45 vs > 45 years) < WHO type (I + II vs III) VCA-IgG (< 80 vs 80) EA-IgG (< 10 vs 10) Validation set HOPX methylation (Low vs High) TNM stage (I-II vs III-IV) Sex (Female vs Man) Age ( 45 vs > 45 years) WHO type (I + II vs III) VCA-IgG (< 80 vs 80) EA-IgG (< 10 vs 10) Overall survival Training set HOPX methylation (Low vs High) TNM stage (I-IIvs III-IV) Sex (Female vs Man)
20 Age ( 45 vs > 45 years) < <0.001 WHO type (I + II vs III) VCA-IgG (< 80 vs 80) EA-IgG (< 10 vs 10) Validation set HOPX methylation (Low vs High) TNM stage (I-II vs III-IV) Sex (Female vs Man) Age ( 45 vs > 45 years) WHO type (I + II vs III) VCA-IgG (< 80 vs 80) EA-IgG (< 10 vs 10) Disease-free survival Training set HOPX methylation (Low vs High) TNM stage (I-II vs III-IV) Sex (Female vs Man) Age ( 45 vs > 45 years) < WHO type (I + II vs III) VCA-IgG (< 80 vs 80) EA-IgG (< 10 vs 10) Validation set HOPX methylation (Low vs High) TNM stage (I-II vs III-IV) Sex (Female vs Man) Age ( 45 vs > 45 years)
21 WHO type (I + II vs III) VCA-IgG (< 80 vs 80) EA-IgG (< 10 vs 10) Adjusted multivariate Cox proportional hazard models were used to calculate the HR values and P values, including HOPX methylation level (low vs high), TNM stage (stage I-II vs III-IV), sex (female vs male), age (< 45 vs 45 years), WHO pathological type (I + II vs III), VCA-IgA (< 1:80 vs 1:80) and EA-IgA (< 1:10 vs 1:10). Variables which were significantly associated with survival are presented.
22 Supplementary Table 4. Multivariate Cox regression analysis of HOPX methylation level and survival in the combined cohort. Variable HR 95%CI P value Distant metastasis-free survival HOPX methylation (Low vs High) TNM stage (I-II vs III-IV) Age ( 45 vs > 45 years) <0.001 Overall survival HOPX methylation (Low vs High) TNM stage (I-II vs III-IV) <0.001 Age ( 45 vs > 45 years) <0.001 Disease-free survival HOPX methylation (Low vs High) TNM stage (I-II vs III-IV) Age ( 45 vs > 45 years) Adjusted multivariate Cox proportional hazard models were used to calculate the HR values and P values, including HOPX methylation level (low vs high), TNM stage (stage I-II vs III-IV), sex (female vs male), age (< 45 vs 45 years), WHO pathological type (I + II vs III), VCA-IgA (< 1:80 vs 1:80) and EA-IgA (< 1:10 vs 1:10). Variables which were significantly associated with survival are presented.
23 Supplementary Table 5. Primers used in this study. Gene Sequence (5' to 3') BSP PCR primers HOPX-F HOPX-R GTTCTTAGGGATTTTTTGTAGGAATTG CTTCCTTCACTCCTTCCTTAAAAC(5 Biotin) BSP sequencing primer HOPX GGATTTTTTGTAGGAATTGTAT Real time RT-PCR primers HOPX-F HOPX-R SNAIL-F SNAIL-R SLUG-F SLUG-R ZEB1-F ZEB1-R ZEB2-F ZEB2-R TWIST1-F TWIST1-R FOXC2-F FOXC2-R ECADHERIN-F ECADHERIN-R α-catenin-f α-catenin-r CACCACGCTGTGCCTCAT CCATTTCTGGGTCTCCTCC TAATCCAGAGTTTACCTTCCAGC CTCATCTGACAGGGAGGTCAG CCCTGAAGATGCATATTCGGA CTGCAAATGCTCTGTTGCAG TCACTAGTGTTTACCAGAACAGTG GAACACTGTTCTGGTCAGCA CTACAAGCGCTTGACATCAC TAGCATTTGGTGCTGATCTGTC AGTCTTACGAGGAGCTGCAG CTCTGGAGGACCTGGTAGAG CTTCTACCGGGAGAACAAGC CTCCTTCTCCTTGGACACGT GAAGAGGACCAGGACTTTGAC GTAGTCATAGTCCTGGTCTTTGTC CCTGAGGAGTTGGATGACTC TCCTTTACCTCGGGTAAAGTC
24 VIMENTIN-F ATTCCACTTTGCGTTCAAGG VIMENTIN-R CTTCAGAGAGAGGAAGCCGA FIBRONECTIN-F CACGATGATATGGAGAGCCA FIBRONECTIN-R TATTTGGTGGCCACCATAAGTC SRF-F CACCATCATGACGTCATCCG SRF-R CTATCACAGCCATCTGGTGG sirna sequences sirna-nc-f 5 -UUCUCCGAACGUGUCACGUTT-3 sirna-nc-r 5 -ACGUGACACGUUCGGAGAATT-3 sihopx-1-f 5 -GAAGCUAUGUGUAUCUUCUTT-3 sihopx-1-r 5 -AGAAGAUACACAUAGCUUCTT-3 sihopx-2-f 5 -CCCUAAGUCACUUUCCUUATT-3 sihopx-2-r 5 -UAAGGAAAGUGACUUAGGGTT-3 ChIP-PCR primers SNAIL-1-F AGGAGTCCCCGCCCGGGCTCTCACC SNAIL-1-R GCAGCAGCGCCGCCAACTCCCTTAA SNAIL-2-F GGGGCGTCAGAAGCGCTCAGACCAC SNAIL-2-R GTTCGCTGGCGCAGCGCGGGTCGTC SNAIL-3-F GTGTCCCTTTCCTCGCTTCCTC SNAIL-3-R CGGGACACCTGACCTTCCGAC SNAIL-4-F TTCTGTCCGGGGCTGTGCCCTG SNAIL-4-R CGCACGTGGCTCTCGGCGGCTTG SNAIL-5-F AGTCACCCCGACCCCCTGTCAG SNAIL-5-R CACTCAGAGCCTCTCCCGAAG SNAIL-6-F TCCAAACTCCTACGAGGCCCTG SNAIL-6-R TCCCAGAGGAAGTGAAGAATTA
25 Supplementary Table 6. Antibodies used in this study. Antibody Company Catalog no. Dilution Western blotting GAPDH Santa Cruz sc :1000 HOPX Santa Cruz SC :200 ECADHERIN BD :2000 a-catenin BD :500 VIMENTIN Proteintech AP 1:1000 FIBRONECTIN Proteintech AP 1:500 SNAIL Abcam ab :1000 SRF Proteintech AP 1:800 HDAC2 Proteintech AP 1:1000 SMAD4 Proteintech AP 1:200 β-catenin Proteintech AP 1:500 CYCLIND1 Proteintech Ig 1:500 MMP9 Proteintech AP 1:500 Mouse CST :5000 Rabbit CST :5000 Immunohistochemistry HOPX Santa Cruz SC :100 SNAIL Abcam ab :200 Immunofluorescence SRF Proteintech AP 1:100 HDAC2 Santa Cruz SC :100 HOPX Santa Cruz SC :100 ECADHERIN BD :100 a-catenin BD :100
26 VIMENTIN Proteintech AP 1:100 goat Anti-rabbit, Alexa Fluor Life A : IgG secondary antibody goat Anti-mouse, Alexa Fluor Life A : IgG secondary antibody rabbit Anti-goat, Alexa Fluor Life A : IgG secondary antibody Co-Immunoprecipitation HOPX Santa Cruz SC μg SRF Proteintech AP 3μg HDAC2 Proteintech AP 3μg IgG Proteintech AP 3μg Chromatin Immunoprecipitation HOPX Santa Cruz SC ml per 0.5 ml Protein A/G sepharose beads HDAC2 Abcam ab mg per 5ml Protein A/G sepharose beads H3K9Ac Abcam ab mg per 2ml Protein A/G sepharose beads SRF CST :100 IgG Sigma SLBJ3775V 1:100


27 Supplementary Figure 16. Full unedited western blotting gels for all figures. Full unedited gel for Figure 2e Full unedited gel for Figure 4d,e Full unedited gel for Figure 5c, d and g


28 Full unedited gel for Figure 6c Full unedited gel for Figure 7d Full unedited gel for Supplementary Figure 3a

29 Full unedited gel for Supplementary Figure 4a Full unedited gel for Supplementary Figure 7c Full unedited gel for Supplementary Figure 8a,b,d

30 Full unedited gel for Supplementary Figure 9b,c,g Full unedited gel for Supplementary Figure 15
(a) Significant biological processes (upper panel) and disease biomarkers (lower panel)
 Significant biological processes (upper panel) and disease biomarkers (lower panel)") Supplementary Figure 1. Functional enrichment analyses of secretomic proteins. (a) Significant biological processes (upper panel) and disease biomarkers (lower panel) 2 involved by hrab37-mediated secretory
Supplementary Figure 1. Functional enrichment analyses of secretomic proteins. (a) Significant biological processes (upper panel) and disease biomarkers (lower panel) 2 involved by hrab37-mediated secretory
SUPPLEMENTARY INFORMATION
 DOI: 10.1038/ncb2607 Figure S1 Elf5 loss promotes EMT in mammary epithelium while Elf5 overexpression inhibits TGFβ induced EMT. (a, c) Different confocal slices through the Z stack image. (b, d) 3D rendering
Supplementary Information and Figure legends
 Supplementary Information and Figure legends Table S1. Primers for quantitative RT-PCR Target Sequence (5 -> 3 ) Target Sequence (5 -> 3 ) DAB2IP F:TGGACGATGTGCTCTATGCC R:GGATGGTGATGGTTTGGTAG Snail F:CCTCCCTGTCAGATGAGGAC
Supplementary Figures
 Supplementary Figures Supplementary Figure 1 DOT1L regulates the expression of epithelial and mesenchymal markers. (a) The expression levels and cellular localizations of EMT markers were confirmed by
Supplementary Figure (OH) 22 nanoparticles did not affect cell viability and apoposis. MDA-MB-231, MCF-7, MCF-10A and BT549 cells were
 22 nanoparticles did not affect cell viability and apoposis. MDA-MB-231, MCF-7, MCF-10A and BT549 cells were") Supplementary Figure 1. Gd@C 82 (OH) 22 nanoparticles did not affect cell viability and apoposis. MDA-MB-231, MCF-7, MCF-10A and BT549 cells were treated with PBS, Gd@C 82 (OH) 22, C 60 (OH) 22 or GdCl
Supplementary Figure 1. Gd@C 82 (OH) 22 nanoparticles did not affect cell viability and apoposis. MDA-MB-231, MCF-7, MCF-10A and BT549 cells were treated with PBS, Gd@C 82 (OH) 22, C 60 (OH) 22 or GdCl
Supplementary Figure S1 Expression of mir-181b in EOC (A) Kaplan-Meier
 Kaplan-Meier") Supplementary Figure S1 Expression of mir-181b in EOC (A) Kaplan-Meier curves for progression-free survival (PFS) and overall survival (OS) in a cohort of patients (N=52) with stage III primary ovarian
Supplementary Figure S1 Expression of mir-181b in EOC (A) Kaplan-Meier curves for progression-free survival (PFS) and overall survival (OS) in a cohort of patients (N=52) with stage III primary ovarian
(A) RT-PCR for components of the Shh/Gli pathway in normal fetus cell (MRC-5) and a
 RT-PCR for components of the Shh/Gli pathway in normal fetus cell (MRC-5) and a") Supplementary figure legends Supplementary Figure 1. Expression of Shh signaling components in a panel of gastric cancer. (A) RT-PCR for components of the Shh/Gli pathway in normal fetus cell (MRC-5) and
Supplementary figure legends Supplementary Figure 1. Expression of Shh signaling components in a panel of gastric cancer. (A) RT-PCR for components of the Shh/Gli pathway in normal fetus cell (MRC-5) and
Supplementary Figure 1. Deletion of Smad3 prevents B16F10 melanoma invasion and metastasis in a mouse s.c. tumor model.
 A B16F1 s.c. Lung LN Distant lymph nodes Colon B B16F1 s.c. Supplementary Figure 1. Deletion of Smad3 prevents B16F1 melanoma invasion and metastasis in a mouse s.c. tumor model. Highly invasive growth
An epithelial-to-mesenchymal transition-inducing potential of. granulocyte macrophage colony-stimulating factor in colon. cancer
 An epithelial-to-mesenchymal transition-inducing potential of granulocyte macrophage colony-stimulating factor in colon cancer Yaqiong Chen, Zhi Zhao, Yu Chen, Zhonglin Lv, Xin Ding, Renxi Wang, He Xiao,
Type of file: PDF Size of file: 0 KB Title of file for HTML: Supplementary Information Description: Supplementary Figures
 Type of file: PDF Size of file: 0 KB Title of file for HTML: Supplementary Information Description: Supplementary Figures Supplementary Figure 1 mir-128-3p is highly expressed in chemoresistant, metastatic
Supplementary Figure 1. The CagA-dependent wound healing or transwell migration of gastric cancer cell. AGS cells transfected with vector control or
 Supplementary Figure 1. The CagA-dependent wound healing or transwell migration of gastric cancer cell. AGS cells transfected with vector control or 3xflag-CagA expression vector were wounded using a pipette
Supplemental Figure 1
 Supplemental Figure 1 1a 1c PD-1 MFI fold change 6 5 4 3 2 1 IL-1α IL-2 IL-4 IL-6 IL-1 IL-12 IL-13 IL-15 IL-17 IL-18 IL-21 IL-23 IFN-α Mut Human PD-1 promoter SBE-D 5 -GTCTG- -1.2kb SBE-P -CAGAC- -1.kb
Supplemental Information
 Supplemental Information Tobacco-specific Carcinogen Induces DNA Methyltransferases 1 Accumulation through AKT/GSK3β/βTrCP/hnRNP-U in Mice and Lung Cancer patients Ruo-Kai Lin, 1 Yi-Shuan Hsieh, 2 Pinpin
Supplementary Figure 1. The mir-182 binding site of SMAD7 3 UTR and the. mutated sequence.
 Supplementary Figure 1. The mir-182 binding site of SMAD7 3 UTR and the mutated sequence. 1 Supplementary Figure 2. Expression of mir-182 and SMAD7 in various cell lines. (A) Basal levels of mir-182 expression
SUPPLEMENTARY FIGURES AND TABLE
 SUPPLEMENTARY FIGURES AND TABLE Supplementary Figure S1: Characterization of IRE1α mutants. A. U87-LUC cells were transduced with the lentiviral vector containing the GFP sequence (U87-LUC Tet-ON GFP).
Soft Agar Assay. For each cell pool, 100,000 cells were resuspended in 0.35% (w/v)
") SUPPLEMENTARY MATERIAL AND METHODS Soft Agar Assay. For each cell pool, 100,000 cells were resuspended in 0.35% (w/v) top agar (LONZA, SeaKem LE Agarose cat.5004) and plated onto 0.5% (w/v) basal agar.
SUPPLEMENTARY MATERIAL AND METHODS Soft Agar Assay. For each cell pool, 100,000 cells were resuspended in 0.35% (w/v) top agar (LONZA, SeaKem LE Agarose cat.5004) and plated onto 0.5% (w/v) basal agar.
microrna-200b and microrna-200c promote colorectal cancer cell proliferation via
 Supplementary Materials microrna-200b and microrna-200c promote colorectal cancer cell proliferation via targeting the reversion-inducing cysteine-rich protein with Kazal motifs Supplementary Table 1.
Supplementary Table S1. Tumor samples used for analysis Tumor size (cm) BNG (grade) ERα PR. pn-
 BNG (grade) ERα PR. pn-") Supplementary Table S1. Tumor samples used for analysis Sample# Age Tumor size (cm) pn- Stage Stage BNG (grade) ERα PR HER2 (FISH) Triple negative T1 46 3 N1a III 2 Pos Neg N T2 58 1 N(i-) I 3 Pos Neg
Supplementary Table S1. Tumor samples used for analysis Sample# Age Tumor size (cm) pn- Stage Stage BNG (grade) ERα PR HER2 (FISH) Triple negative T1 46 3 N1a III 2 Pos Neg N T2 58 1 N(i-) I 3 Pos Neg
m 6 A mrna methylation regulates AKT activity to promote the proliferation and tumorigenicity of endometrial cancer
 SUPPLEMENTARY INFORMATION Articles https://doi.org/10.1038/s41556-018-0174-4 In the format provided by the authors and unedited. m 6 A mrna methylation regulates AKT activity to promote the proliferation
Supplementary Information Supplementary Fig. 1. Elevated Usp9x in melanoma and NRAS mutant melanoma cells are dependent on NRAS for 3D growth.
 Supplementary Information Supplementary Fig. 1. Elevated Usp9x in melanoma and NRAS mutant melanoma cells are dependent on NRAS for 3D growth. a. Immunoblot for Usp9x protein in NRAS mutant melanoma cells
Supplementary Figures
 Supplementary Figures Supplementary Figure 1 Correlation between LKB1 and YAP expression in human lung cancer samples. (a) Representative photos showing LKB1 and YAP immunohistochemical staining in human
mir-509-5p and mir-1243 increase the sensitivity to gemcitabine by inhibiting
 mir-509-5p and mir-1243 increase the sensitivity to gemcitabine by inhibiting epithelial-mesenchymal transition in pancreatic cancer Hidekazu Hiramoto, M.D. 1,3, Tomoki Muramatsu, Ph.D. 1, Daisuke Ichikawa,
Table S1. Primer sequences used for qrt-pcr. CACCATTGGCAATGAGCGGTTC AGGTCTTTGCGGATGTCCACGT ACTB AAGTCCATGTGCTGGCAGCACT ATCACCACTCCGAAGTCCGTCT LCOR
 Table S1. Primer sequences used for qrt-pcr. ACTB LCOR KLF6 CTBP1 CDKN1A CDH1 ATF3 PLAU MMP9 TFPI2 CACCATTGGCAATGAGCGGTTC AGGTCTTTGCGGATGTCCACGT AAGTCCATGTGCTGGCAGCACT ATCACCACTCCGAAGTCCGTCT CGGCTGCAGGAAAGTTTACA
Supplementary Fig. S1. Schematic diagram of minigenome segments.
 open reading frame 1565 (segment 5) 47 (-) 3 5 (+) 76 101 125 149 173 197 221 246 287 open reading frame 890 (segment 8) 60 (-) 3 5 (+) 172 Supplementary Fig. S1. Schematic diagram of minigenome segments.
SUPPLEMENTARY INFORMATION
 DOI: 1.138/ncb3355 a S1A8 + cells/ total.1.8.6.4.2 b S1A8/?-Actin c % T-cell proliferation 3 25 2 15 1 5 T cells Supplementary Figure 1 Inter-tumoral heterogeneity of MDSC accumulation in mammary tumor
Supplemental Table S1
 Supplemental Table S. Tumorigenicity and metastatic potential of 44SQ cell subpopulations a Tumorigenicity b Average tumor volume (mm ) c Lung metastasis d CD high /4 8. 8/ CD low /4 6./ a Mice were injected
Supplementary Figure 1.TRIM33 binds β-catenin in the nucleus. a & b, Co-IP of endogenous TRIM33 with β-catenin in HT-29 cells (a) and HEK 293T cells
 and HEK 293T cells") Supplementary Figure 1.TRIM33 binds β-catenin in the nucleus. a & b, Co-IP of endogenous TRIM33 with β-catenin in HT-29 cells (a) and HEK 293T cells (b). TRIM33 was immunoprecipitated, and the amount of
Supplementary Figure 1.TRIM33 binds β-catenin in the nucleus. a & b, Co-IP of endogenous TRIM33 with β-catenin in HT-29 cells (a) and HEK 293T cells (b). TRIM33 was immunoprecipitated, and the amount of
Supplementary Information
 Supplementary Information Supplementary Figure 1. EBV-gB 23-431 mainly exists as trimer in HEK 293FT cells. (a) Western blotting analysis for DSS crosslinked FLAG-gB 23-431. HEK 293FT cells transfected
Epstein-Barr virus driven promoter hypermethylated genes in gastric cancer
 RESEARCH FUND FOR THE CONTROL OF INFECTIOUS DISEASES Epstein-Barr virus driven promoter hypermethylated genes in gastric cancer J Yu *, KF To, QY Liang K e y M e s s a g e s 1. Somatostatin receptor 1
SUPPLEMENTARY FIGURES
 SUPPLEMENTARY FIGURES Figure S1. Clinical significance of ZNF322A overexpression in Caucasian lung cancer patients. (A) Representative immunohistochemistry images of ZNF322A protein expression in tissue
Supplementary Figure 1 IL-27 IL
 Tim-3 Supplementary Figure 1 Tc0 49.5 0.6 Tc1 63.5 0.84 Un 49.8 0.16 35.5 0.16 10 4 61.2 5.53 10 3 64.5 5.66 10 2 10 1 10 0 31 2.22 10 0 10 1 10 2 10 3 10 4 IL-10 28.2 1.69 IL-27 Supplementary Figure 1.
Supplementary Figure 1: si-craf but not si-braf sensitizes tumor cells to radiation.
 Supplementary Figure 1: si-craf but not si-braf sensitizes tumor cells to radiation. (a) Embryonic fibroblasts isolated from wildtype (WT), BRAF -/-, or CRAF -/- mice were irradiated (6 Gy) and DNA damage
Supplementary Fig. 1: ATM is phosphorylated in HER2 breast cancer cell lines. (A) ATM is phosphorylated in SKBR3 cells depending on ATM and HER2
 ATM is phosphorylated in SKBR3 cells depending on ATM and HER2") Supplementary Fig. 1: ATM is phosphorylated in HER2 breast cancer cell lines. (A) ATM is phosphorylated in SKBR3 cells depending on ATM and HER2 activity. Upper panel: Representative histograms for FACS
Supplementary Fig. 1: ATM is phosphorylated in HER2 breast cancer cell lines. (A) ATM is phosphorylated in SKBR3 cells depending on ATM and HER2 activity. Upper panel: Representative histograms for FACS
TRAF6 ubiquitinates TGFβ type I receptor to promote its cleavage and nuclear translocation in cancer
 Supplementary Information TRAF6 ubiquitinates TGFβ type I receptor to promote its cleavage and nuclear translocation in cancer Yabing Mu, Reshma Sundar, Noopur Thakur, Maria Ekman, Shyam Kumar Gudey, Mariya
Cesarini et al., http ://www.jcb.org /cgi /content /full /jcb /DC1
 Supplemental material JCB Cesarini et al., http ://www.jcb.org /cgi /content /full /jcb.201504035 /DC1 THE JOU RNAL OF CELL BIO LOGY Figure S1. Lamin A/C depletion generates two distinct phenotypes in
(a) Schematic diagram of the FS mutation of UVRAG in exon 8 containing the highly instable
 Schematic diagram of the FS mutation of UVRAG in exon 8 containing the highly instable") Supplementary Figure 1. Frameshift (FS) mutation in UVRAG. (a) Schematic diagram of the FS mutation of UVRAG in exon 8 containing the highly instable A 10 DNA repeat, generating a premature stop codon
Supplementary Figure 1. Frameshift (FS) mutation in UVRAG. (a) Schematic diagram of the FS mutation of UVRAG in exon 8 containing the highly instable A 10 DNA repeat, generating a premature stop codon
Supplementary Figure 1. A. Bar graph representing the expression levels of the 19 indicated genes in the microarrays analyses comparing human lung
 Supplementary Figure 1. A. Bar graph representing the expression levels of the 19 indicated genes in the microarrays analyses comparing human lung immortalized broncho-epithelial cells (AALE cells) expressing
supplementary information
 DOI: 10.1038/ncb1875 Figure S1 (a) The 79 surgical specimens from NSCLC patients were analysed by immunohistochemistry with an anti-p53 antibody and control serum (data not shown). The normal bronchi served
Supplementary Figure 1. Characterization of NMuMG-ErbB2 and NIC breast cancer cells expressing shrnas targeting LPP. NMuMG-ErbB2 cells (a) and NIC
 and NIC") Supplementary Figure 1. Characterization of NMuMG-ErbB2 and NIC breast cancer cells expressing shrnas targeting LPP. NMuMG-ErbB2 cells (a) and NIC cells (b) were engineered to stably express either a LucA-shRNA
Supplementary Figure 1. Characterization of NMuMG-ErbB2 and NIC breast cancer cells expressing shrnas targeting LPP. NMuMG-ErbB2 cells (a) and NIC cells (b) were engineered to stably express either a LucA-shRNA
Supplementary Figure 1: Hsp60 / IEC mice are embryonically lethal (A) Light microscopic pictures show mouse embryos at developmental stage E12.
 Light microscopic pictures show mouse embryos at developmental stage E12.") Supplementary Figure 1: Hsp60 / IEC mice are embryonically lethal (A) Light microscopic pictures show mouse embryos at developmental stage E12.5 and E13.5 prepared from uteri of dams and subsequently genotyped.
Supplementary Figure 1: Hsp60 / IEC mice are embryonically lethal (A) Light microscopic pictures show mouse embryos at developmental stage E12.5 and E13.5 prepared from uteri of dams and subsequently genotyped.
Supplementary Figures
 Supplementary Figures Supplementary Figure 1. Confirmation of Dnmt1 conditional knockout out mice. a, Representative images of sorted stem (Lin - CD49f high CD24 + ), luminal (Lin - CD49f low CD24 + )
Figure S1: Effects on haptotaxis are independent of effects on cell velocity A)
") Supplemental Figures Figure S1: Effects on haptotaxis are independent of effects on cell velocity A) Velocity of MV D7 fibroblasts expressing different GFP-tagged Ena/VASP family proteins in the haptotaxis
Supplemental Figures Figure S1: Effects on haptotaxis are independent of effects on cell velocity A) Velocity of MV D7 fibroblasts expressing different GFP-tagged Ena/VASP family proteins in the haptotaxis
Supplementary Fig. 1. GPRC5A post-transcriptionally down-regulates EGFR expression. (a) Plot of the changes in steady state mrna levels versus
 Plot of the changes in steady state mrna levels versus") Supplementary Fig. 1. GPRC5A post-transcriptionally down-regulates EGFR expression. (a) Plot of the changes in steady state mrna levels versus changes in corresponding proteins between wild type and Gprc5a-/-
Supplementary Fig. 1. GPRC5A post-transcriptionally down-regulates EGFR expression. (a) Plot of the changes in steady state mrna levels versus changes in corresponding proteins between wild type and Gprc5a-/-
SUPPLEMENTARY INFORMATION. Supplementary Figures S1-S9. Supplementary Methods
 SUPPLEMENTARY INFORMATION SUMO1 modification of PTEN regulates tumorigenesis by controlling its association with the plasma membrane Jian Huang 1,2#, Jie Yan 1,2#, Jian Zhang 3#, Shiguo Zhu 1, Yanli Wang
Supplementary Materials. for Garmy-Susini, et al, Integrin 4 1 signaling is required for lymphangiogenesis and tumor metastasis
 Supplementary Materials for Garmy-Susini, et al, Integrin 4 1 signaling is required for lymphangiogenesis and tumor metastasis 1 Supplementary Figure Legends Supplementary Figure 1: Integrin expression
Supplementary Figure 1 Cell line TRIB2 status. Supplementary Figure 2 TRIB2 status has no impact on the cell cycle after PI3K inhibition. a. b.
 Supplementary Figure 1 Cell line TRIB2 status. TRIB2 protein expression to determine endogenous expression and to determine the effectiveness of each of our TRIB2 knockdown constructs. Supplementary Figure
PBX3/MEK/ERK1/2/LIN28/let-7b positive feedback loop enhances mesenchymal phenotype to promote glioblastoma migration and invasion
 Xu et al. Journal of Experimental & Clinical Cancer Research (2018) 37:158 https://doi.org/10.1186/s13046-018-0841-0 RESEARCH PBX3/MEK/ERK1/2/LIN28/let-7b positive feedback loop enhances mesenchymal phenotype
Supplementary Figure 1. Expression of CUGBP1 in non-parenchymal liver cells treated with TGF-β
 Supplementary Figures Supplementary Figure 1. Expression of CUGBP1 in non-parenchymal liver cells treated with TGF-β and LPS. Non-parenchymal liver cells were isolated and treated with or without TGF-β
Supplementary Figure 1. Prevalence of U539C and G540A nucleotide and E172K amino acid substitutions among H9N2 viruses. Full-length H9N2 NS
 Supplementary Figure 1. Prevalence of U539C and G540A nucleotide and E172K amino acid substitutions among H9N2 viruses. Full-length H9N2 NS nucleotide sequences (a, b) or amino acid sequences (c) from
Boucher et al NCOMMS B
 1 Supplementary Figure 1 (linked to Figure 1). mvegfr1 constitutively internalizes in endothelial cells. (a) Immunoblot of mflt1 from undifferentiated mouse embryonic stem (ES) cells with indicated genotypes;
SUPPLEMENTARY INFORMATION
 DOI: 10.1038/ncb2566 Figure S1 CDKL5 protein expression pattern and localization in mouse brain. (a) Multiple-tissue western blot from a postnatal day (P) 21 mouse probed with an antibody against CDKL5.
Bmi-1 regulates stem cell-like properties of gastric cancer cells via modulating mirnas
 Wang et al. Journal of Hematology & Oncology (2016) 9:90 DOI 10.1186/s13045-016-0323-9 RESEARCH Bmi-1 regulates stem cell-like properties of gastric cancer cells via modulating mirnas Open Access Xiaofeng
SUPPLEMENTARY INFORMATION
 doi:.38/nature8975 SUPPLEMENTAL TEXT Unique association of HOTAIR with patient outcome To determine whether the expression of other HOX lincrnas in addition to HOTAIR can predict patient outcome, we measured
Supplemental Figure 1
 1 Supplemental Figure 1 Effects of DATE shortening on HGF promoter activity. The HGF promoter region (-1037 to +56) containing wild-type (30As) or truncated DATE (26As, 27As, 28A, 29As) from breast cancer
Supplementary Figure S1 Supplementary Figure S2
 Supplementary Figure S A) The blots shown in Figure B were qualified by using Gel-Pro analyzer software (Rockville, MD, USA). The ratio of LC3II/LC3I to actin was then calculated. The data are represented
Figure S1. Reduction in glomerular mir-146a levels correlate with progression to higher albuminuria in diabetic patients.
 Supplementary Materials Supplementary Figures Figure S1. Reduction in glomerular mir-146a levels correlate with progression to higher albuminuria in diabetic patients. Figure S2. Expression level of podocyte
A. List of selected proteins with high SILAC (H/L) ratios identified in mass
 ratios identified in mass") Supplementary material Figure S1. Interaction between UBL5 and FANCI A. List of selected proteins with high SILAC (H/L) ratios identified in mass spectrometry (MS)-based analysis of UBL5-interacting proteins,
Supplementary material Figure S1. Interaction between UBL5 and FANCI A. List of selected proteins with high SILAC (H/L) ratios identified in mass spectrometry (MS)-based analysis of UBL5-interacting proteins,
Expanded View Figures
 Shao-Ming Shen et al Role of I in MT of cancers MO reports xpanded View igures igure V1. nalysis of the expression of I isoforms in cancer cells and their interaction with PTN. RT PR detection of Ish and
Does EMT Contribute to Radiation Resistance in Human Breast Cancer?
 AD Award Number: W81XWH-10-1-0592 TITLE: Does EMT Contribute to Radiation Resistance in Human Breast Cancer? PRINCIPAL INVESTIGATOR: Anupama Munshi, Ph.D CONTRACTING ORGANIZATION: University of Oklahoma
SUPPLEMENTARY INFORMATION
 DOI: 1.138/ncb222 / b. WB anti- WB anti- ulin Mitotic index (%) 14 1 6 2 T (h) 32 48-1 1 2 3 4 6-1 4 16 22 28 3 33 e. 6 4 2 Time (min) 1-6- 11-1 > 1 % cells Figure S1 depletion leads to mitotic defects
(A) PCR primers (arrows) designed to distinguish wild type (P1+P2), targeted (P1+P2) and excised (P1+P3)14-
 PCR primers (arrows) designed to distinguish wild type (P1+P2), targeted (P1+P2) and excised (P1+P3)14-") 1 Supplemental Figure Legends Figure S1. Mammary tumors of ErbB2 KI mice with 14-3-3σ ablation have elevated ErbB2 transcript levels and cell proliferation (A) PCR primers (arrows) designed to distinguish
1 Supplemental Figure Legends Figure S1. Mammary tumors of ErbB2 KI mice with 14-3-3σ ablation have elevated ErbB2 transcript levels and cell proliferation (A) PCR primers (arrows) designed to distinguish
Supplementary Figure 1 Role of Raf-1 in TLR2-Dectin-1-mediated cytokine expression
 Supplementary Figure 1 Supplementary Figure 1 Role of Raf-1 in TLR2-Dectin-1-mediated cytokine expression. Quantitative real-time PCR of indicated mrnas in DCs stimulated with TLR2-Dectin-1 agonist zymosan
Supplemental Information. Induction of Expansion and Folding. in Human Cerebral Organoids
 Cell Stem Cell, Volume 20 Supplemental Information Induction of Expansion and Folding in Human Cerebral Organoids Yun Li, Julien Muffat, Attya Omer, Irene Bosch, Madeline A. Lancaster, Mriganka Sur, Lee
RAW264.7 cells stably expressing control shrna (Con) or GSK3b-specific shrna (sh-
 or GSK3b-specific shrna (sh-") 1 a b Supplementary Figure 1. Effects of GSK3b knockdown on poly I:C-induced cytokine production. RAW264.7 cells stably expressing control shrna (Con) or GSK3b-specific shrna (sh- GSK3b) were stimulated
1 a b Supplementary Figure 1. Effects of GSK3b knockdown on poly I:C-induced cytokine production. RAW264.7 cells stably expressing control shrna (Con) or GSK3b-specific shrna (sh- GSK3b) were stimulated
Supplementary Figure 1
 Supplementary Figure 1 Supplementary Figure 1. Neither the activation nor suppression of the MAPK pathway affects the ASK1/Vif interaction. (a, b) HEK293 cells were cotransfected with plasmids encoding
ANGPTL2 increases bone metastasis of breast cancer cells through. Tetsuro Masuda, Motoyoshi Endo, Yutaka Yamamoto, Haruki Odagiri, Tsuyoshi
 Masuda et al. Supplementary information for ANGPTL2 increases bone metastasis of breast cancer cells through enhancing CXCR4 signaling Tetsuro Masuda, Motoyoshi Endo, Yutaka Yamamoto, Haruki Odagiri, Tsuyoshi
Supplementary Figure 1 ITGB1 and ITGA11 increase with evidence for heterodimers following HSC activation. (a) Time course of rat HSC activation
 Time course of rat HSC activation") Supplementary Figure 1 ITGB1 and ITGA11 increase with evidence for heterodimers following HSC activation. (a) Time course of rat HSC activation indicated by the detection of -SMA and COL1 (log scale).
Supplementary Figure 1 ITGB1 and ITGA11 increase with evidence for heterodimers following HSC activation. (a) Time course of rat HSC activation indicated by the detection of -SMA and COL1 (log scale).
HIF-inducible mir-191 promotes migration in breast cancer through complex regulation of TGFβ-signaling in hypoxic microenvironment.
 HIF-inducible mir-9 promotes migration in breast cancer through complex regulation of TGFβ-signaling in hypoxic microenvironment. Neha Nagpal, Hafiz M Ahmad, Shibu Chameettachal3, Durai Sundar, Sourabh
Tumor suppressor Spred2 interaction with LC3 promotes autophagosome maturation and induces autophagy-dependent cell death
 www.impactjournals.com/oncotarget/ Oncotarget, Supplementary Materials 2016 Tumor suppressor Spred2 interaction with LC3 promotes autophagosome maturation and induces autophagy-dependent cell death Supplementary
Mitosis. Single Nano Micro Milli Macro. Primary. PCNA expression
 a b c DAPI YFP CC3 DAPI YFP PCNA DAPI YFP ph3 DAPI YFP KI67 e 6 Mitosis f 1 PCNA expression %ph3 + /YFP + n= 63 87 61 3 13 8 n= 15 3 9 1 5 %PCNA+/YFP+ 8 6 Supplementary Figure 1. Proliferation/apoptosis
SUPPLEMENTARY FIGURES
 SUPPLEMENTARY FIGURES Supplementary Figure S1: Fibroblast-induced elongation of cancer cells requires direct contact with living fibroblasts. A. Representative images of HT29-GFP cultured in the presence
Supplementary Figure 1. Baf60c and baf180 are induced during cardiac regeneration in zebrafish. RNA in situ hybridization was performed on paraffin
 Supplementary Figure 1. Baf60c and baf180 are induced during cardiac regeneration in zebrafish. RNA in situ hybridization was performed on paraffin sections from sham-operated adult hearts (a and i) and
Correspondence to: Jun-nian Zheng, * These authors contributed equally to this paper.
 Decreased expression of CHIP leads to increased angiogenesis via VEGF-VEGFR2 pathway and poor prognosis in human renal cell carcinoma Chao Sun 1, 2, 4, *, Hai-long Li 1, 2, *, Hai-rong Chen 6, *, Mei-lin
Supplementary Figure 1
 CD31 FN Supplementary Figure 1 a Multivariate Cox regression analysis of predicting factors for disease-free and overall survival in 435 HNSCC patients b FN staining in whole sections of HNSCC c FN expression
Supporting Information. FADD regulates NF-кB activation and promotes ubiquitination of cflip L to induce. apoptosis
 1 2 Supporting Information 3 4 5 FADD regulates NF-кB activation and promotes ubiquitination of cflip L to induce apoptosis 6 7 Kishu Ranjan and Chandramani Pathak* 8 9 Department of Cell Biology, School
Supplementary information. MARCH8 inhibits HIV-1 infection by reducing virion incorporation of envelope glycoproteins
 Supplementary information inhibits HIV-1 infection by reducing virion incorporation of envelope glycoproteins Takuya Tada, Yanzhao Zhang, Takayoshi Koyama, Minoru Tobiume, Yasuko Tsunetsugu-Yokota, Shoji
Supplementary Figure 1: STAT3 suppresses Kras-induced lung tumorigenesis
 Supplementary Figure 1: STAT3 suppresses Kras-induced lung tumorigenesis (a) Immunohistochemical (IHC) analysis of tyrosine 705 phosphorylation status of STAT3 (P- STAT3) in tumors and stroma (all-time
Nature Medicine doi: /nm.3957
 Supplementary Fig. 1. p38 alternative activation, IL-21 expression, and T helper cell transcription factors in PDAC tissue. (a) Tissue microarrays of pancreatic tissue from 192 patients with pancreatic
HEK293FT cells were transiently transfected with reporters, N3-ICD construct and
 Supplementary Information Luciferase reporter assay HEK293FT cells were transiently transfected with reporters, N3-ICD construct and increased amounts of wild type or kinase inactive EGFR. Transfections
Cancer Biology Course. Invasion and Metastasis
 Cancer Biology Course Invasion and Metastasis 2016 Lu-Hai Wang NHRI Cancer metastasis Major problem: main reason for killing cancer patients, without it cancer can be cured or controlled. Challenging questions:
SREBP-2 promotes stem cell-like properties and metastasis by transcriptional activation of c-myc in prostate cancer
 SREBP-2 promotes stem cell-like properties and metastasis by transcriptional activation of c-myc in prostate cancer Supplementary Material Supplementary Methods Supplementary References Supplementary Figure
Supplementary Information
 Supplementary Information Supplementary Figure 1. Effect of mir mimics and anti-mirs on DTPs a, Representative fluorescence microscopy images of GFP vector control or mir mimicexpressing parental and DTP
MicroRNA 98 suppresses cell growth and invasion of retinoblastoma via targeting the IGF1R/k Ras/Raf/MEK/ERK signaling pathway
 INTERNATIONAL JOURNAL OF ONCOLOGY 54: 807-820, 2019 MicroRNA 98 suppresses cell growth and invasion of retinoblastoma via targeting the IGF1R/k Ras/Raf/MEK/ERK signaling pathway LONG GUO 1, YU BAI 2, SHUZHE
PID1 increases chemotherapy-induced apoptosis in medulloblastoma and glioblastoma cells in a manner that involves NFκB
 SUPPLEMENTARY FIGURES: PID1 increases chemotherapy-induced apoptosis in medulloblastoma and glioblastoma cells in a manner that involves NFκB Jingying Xu, Xiuhai Ren, Anup Singh Pathania, G. Esteban Fernandez,
Neocortex Zbtb20 / NFIA / Sox9
 Neocortex / NFIA / Sox9 Supplementary Figure 1. Expression of, NFIA, and Sox9 in the mouse neocortex at. The lower panels are higher magnification views of the oxed area. Arrowheads indicate triple-positive
Supplementary Figure 1. SA-β-Gal positive senescent cells in various cancer tissues. Representative frozen sections of breast, thyroid, colon and
 Supplementary Figure 1. SA-β-Gal positive senescent cells in various cancer tissues. Representative frozen sections of breast, thyroid, colon and stomach cancer were stained with SA-β-Gal and nuclear fast
Name Animal source Vendor Cat # Dilutions
 Supplementary data Table S1. Primary and Secondary antibody sources Devi et al, TXNIP in mitophagy A. Primary Antibodies Name Animal source Vendor Cat # Dilutions 1. TXNIP mouse MBL KO205-2 1:2000 (WB)
Supplementary Figure 1. DNA methylation of the adiponectin promoter R1, Pparg2, and Tnfa promoter in adipocytes is not affected by obesity.
 Supplementary Figure 1. DNA methylation of the adiponectin promoter R1, Pparg2, and Tnfa promoter in adipocytes is not affected by obesity. (a) Relative amounts of adiponectin, Ppar 2, C/ebp, and Tnf mrna
Supplementary Materials for
 www.sciencesignaling.org/cgi/content/full/8/364/ra18/dc1 Supplementary Materials for The tyrosine phosphatase (Pez) inhibits metastasis by altering protein trafficking Leila Belle, Naveid Ali, Ana Lonic,
RNA extraction, RT-PCR and real-time PCR. Total RNA were extracted using
 Supplementary Information Materials and Methods RNA extraction, RT-PCR and real-time PCR. Total RNA were extracted using Trizol reagent (Invitrogen,Carlsbad, CA) according to the manufacturer's instructions.
Nature Medicine: doi: /nm.4322
 1 2 3 4 5 6 7 8 9 10 11 Supplementary Figure 1. Predicted RNA structure of 3 UTR and sequence alignment of deleted nucleotides. (a) Predicted RNA secondary structure of ZIKV 3 UTR. The stem-loop structure
Supplementary Figure 1:
 Supplementary Figure 1: (A) Whole aortic cross-sections stained with Hematoxylin and Eosin (H&E), 7 days after porcine-pancreatic-elastase (PPE)-induced AAA compared to untreated, healthy control aortas
Supplementary Figures
 Supplementary Figures Supplementary Figure 1 Characterization of stable expression of GlucB and sshbira in the CT26 cell line (a) Live cell imaging of stable CT26 cells expressing green fluorescent protein
IKKa restoration via EZH2 suppression induces nasopharyngeal carcinoma differentiation
 Received Oct 3 Accepted 4 Mar 4 Published 7 Apr 4 DOI:.38/ncomms466 IKKa restoration via suppression induces nasopharyngeal carcinoma differentiation Min Yan,, Yan Zhang,,, Bin He,, Jin Xiang, Zi-feng
Recombinant Protein Expression Retroviral system
 Recombinant Protein Expression Retroviral system Viruses Contains genome DNA or RNA Genome encased in a protein coat or capsid. Some viruses have membrane covering protein coat enveloped virus Ø Essential
Supplemental Information. NRF2 Is a Major Target of ARF. in p53-independent Tumor Suppression
 Molecular Cell, Volume 68 Supplemental Information NRF2 Is a Major Target of ARF in p53-independent Tumor Suppression Delin Chen, Omid Tavana, Bo Chu, Luke Erber, Yue Chen, Richard Baer, and Wei Gu Figure
SUPPLEMENTARY INFORMATION
 DOI:.38/ncb3399 a b c d FSP DAPI 5mm mm 5mm 5mm e Correspond to melanoma in-situ Figure a DCT FSP- f MITF mm mm MlanaA melanoma in-situ DCT 5mm FSP- mm mm mm mm mm g melanoma in-situ MITF MlanaA mm mm
Supplementary Figure 1. SC35M polymerase activity in the presence of Bat or SC35M NP encoded from the phw2000 rescue plasmid.
 1 2 3 4 5 6 7 8 9 10 11 12 13 14 15 16 17 18 19 20 21 22 23 24 25 26 27 Supplementary Figure 1. SC35M polymerase activity in the presence of Bat or SC35M NP encoded from the phw2000 rescue plasmid. HEK293T
Cellular Physiology and Biochemistry
 Original Paper 2015 The Author(s). 2015 Published The Author(s) by S. Karger AG, Basel Published online: November 27, 2015 www.karger.com/cpb Published by S. Karger AG, Basel 2194 1421-9778/15/0376-2194$39.50/0
Supplementary Figure 1. EC-specific Deletion of Snail1 Does Not Affect EC Apoptosis. (a,b) Cryo-sections of WT (a) and Snail1 LOF (b) embryos at
 Cryo-sections of WT (a) and Snail1 LOF (b) embryos at") Supplementary Figure 1. EC-specific Deletion of Snail1 Does Not Affect EC Apoptosis. (a,b) Cryo-sections of WT (a) and Snail1 LOF (b) embryos at E10.5 were double-stained for TUNEL (red) and PECAM-1 (green).
Supplementary Figure 1. EC-specific Deletion of Snail1 Does Not Affect EC Apoptosis. (a,b) Cryo-sections of WT (a) and Snail1 LOF (b) embryos at E10.5 were double-stained for TUNEL (red) and PECAM-1 (green).