This thesis is available at Iowa Research Online:
|
|
|
- Alexandra Rodgers
- 5 years ago
- Views:
Transcription


1 University of Iowa Iowa Research Online Theses and Dissertations Spring 2012 Effectiveness of Mi PasteTM, Mi Paste PlusTM, and Topex RenewTM in remineralization and visible reduction of white spot lesions after orthodontic treatment - a clinical study Eric Radcliff Shell University of Iowa Copyright 2012 Eric Radcliff Shell This thesis is available at Iowa Research Online: Recommended Citation Shell, Eric Radcliff. "Effectiveness of Mi PasteTM, Mi Paste PlusTM, and Topex RenewTM in remineralization and visible reduction of white spot lesions after orthodontic treatment - a clinical study." MS (Master of Science) thesis, University of Iowa, Follow this and additional works at: Part of the Orthodontics and Orthodontology Commons
2 EFFECTIVENESS OF MI PASTE TM, MI PASTE PLUS TM, AND TOPEX RENEW TM IN REMINERALIZATION AND VISIBLE REDUCTION OF WHITE SPOT LESIONS AFTER ORTHODONTIC TREATMENT A CLINICAL STUDY by Eric Radcliff Shell A thesis submitted in partial fulfillment of the requirements for the Master of Science degree in Orthodontics in the Graduate College of The University of Iowa May 2012 Thesis Supervisor: Professor Robert N. Staley
3 Graduate College The University of Iowa Iowa City, Iowa CERTIFICATE OF APPROVAL MASTER'S THESIS This is to certify that the Master's thesis of Eric Radcliff Shell has been approved by the Examining Committee for the thesis requirement for the Master of Science degree in Orthodontics at the May 2012 graduation. Thesis Committee: Robert N. Staley, Thesis Supervisor Clayton Parks James Wefel Fang Qian Thomas Southard
4 To my loving and supportive wife Toni To my new daughter Raegann ii
5 ACKNOWLEDGMENTS Drs. Robert Staley, Clayton Parks, James Wefel, and Fang Qian agreed to serve on my thesis committee and have provided input and support throughout this project. Jeff Harless also helped me to understand the quantitative light-induced fluorescence hardware and software, as well as image analysis software. I would like to thank all of them. Additional thanks go to Dr. Qian for performing all statistical analysis for the research project. Dr. Sarah Clark completed the initial pilot project which my research continued, and was also very helpful and supportive in helping me understand her research and providing insight for my continuing project. Thank you Dr. Clark. I also give thanks to all faculty in the Department of Orthodontics for giving me the opportunity to become an orthodontist and passing on their considerable knowledge. To my fellow residents, thank you for helping me realize what a great future lies ahead for the profession of orthodontics. Lastly, I give my most sincere and deepest thanks to my wife Toni Jean Ocheltree Shell. She is the only one who really understands when and how this journey began, and how much effort it has been to complete the journey. She has been there through everything, and worked far too hard herself along the way. She is an excellent wife and mother. Thanks for everything Toni! iii
6 TABLE OF CONTENTS LIST OF TABLES LIST OF FIGURES ix xvii INTRODUCTION 1 Study Objective 3 LITERATURE REVIEW 4 Development of a White Spot Lesion 4 White Spot Lesions in Orthodontic Patients 6 Methods During Orthodontic Treatment to Decrease Demineralization and White Spot Lesion Formation 8 Mechanism of Action of Fluoride 10 Fluoride Dentifrice 11 Mechanism of Action of Casein Phosphopeptides 12 Casein Phosphopeptide-Amorphous Calcium Phosphate (CPP-ACP) 13 Quantitative Light-induced Fluorescence (QLF) 17 MATERIALS AND METHODS 22 Sample 22 Patient Inclusion Criteria 22 Clinical Procedure 23 Measurement of Data 27 Statistical Analysis of Lesion Area Changes in Intraoral Photographs 29 Statistical Analysis of Fluorescence Changes in QLF Images 30 Statistical Analysis of Intraobserver and Interobserver Reliability 31 RESULTS 32 Statistical Analysis of Reliability of Intra- and Inter-Examiner Measurements of Lesion Areas 32 Tooth #6 32 Tooth #7 33 Tooth #8 34 Tooth #9 35 Tooth #10 37 Tooth #11 38 Antimere Teeth #6 and #11 40 Antimere Teeth #7 and #10 40 iv
7 Antimere Teeth #8 and #9 41 For all teeth 43 Statistical Analysis of Lesion Area Changes in Intraoral Photographs 44 Comparisons of Lesion Area Among the Five Groups at Baseline 45 Comparison For Each Tooth 45 Tooth #6 45 Tooth #7 45 Tooth #8 46 Tooth #9 47 Tooth #10 47 Tooth #11 49 Comparison for Antimere Teeth 49 Antimere Teeth #6 and #11 49 Antimere Teeth #7 and #10 50 Antimere teeth #8 and #9 50 Comparison For All Teeth #6 - #11 51 Comparisons of Lesion Area Among the Five Groups at 3-Month Follow-Up 53 Comparison For Each Tooth 53 Tooth #6 53 Tooth #7 54 Tooth #8 54 Tooth #9 55 Tooth #10 55 Tooth #11 56 Comparison For Antimere Teeth 57 Antimere teeth #6 and #11 57 Antimere teeth #7 and #10 58 Antimere teeth #8 and #9 58 Comparison for All Teeth #6 - #11 60 Comparisons of Lesion Area Changes Among the Five Groups at 3-Month Follow-up 61 Comparison For Each Tooth 61 Tooth #6 61 Tooth #7 62 Tooth #8 62 Tooth #9 63 Tooth #10 64 Tooth #11 65 Comparison For Antimere Teeth 66 Antimere Teeth #6 and #11 66 Antimere Teeth #7 and #10 67 Antimere Teeth #8 and #9 67 Comparison For All Teeth #6 - #11 69 Comparisons of Change in Lesion Area from Baseline to 3-Month Follow-up Within Each Treatment Group 71 v
8 Within Control Group 71 For Each Tooth 71 For Antimere Teeth 71 For All Teeth 71 Within Treat Office Group 72 For Each Tooth 72 For Antimere Teeth 74 For All Teeth 75 Within Treat Paste Group 75 For Each Tooth 75 For Antimere Teeth 75 For All Teeth 76 Within Treat Plus Group 77 For Each Tooth 77 For Antimere Teeth 79 For All Teeth 80 Within Treat Topex Group 80 For Each Tooth 80 For Antimere Teeth 80 For All Teeth 81 Statistical Analysis of Fluorescence Changes in QLF Images 82 Comparisons of Fluorescence Change Values Among the Five Groups at Baseline 83 For Each Tooth 83 Tooth #6 83 Tooth #7 85 Tooth #8 85 Tooth #9 86 Tooth #10 88 Tooth #11 88 For Antimere Teeth 89 For Antimere Teeth #6 and #11 89 For Antimere Teeth #7 and #10 90 For Antimere Teeth #8 and #9 91 For All Teeth #6 - #11 92 Comparisons of Fluorescence Change Values Among the Five Groups at 3-Month Follow-Up 93 For each tooth 93 Tooth #6 93 Tooth #7 93 Tooth #8 96 Tooth #9 96 Tooth #10 97 Tooth #11 98 For Antimere Teeth 98 Antimere Teeth #6 and #11 98 vi
9 Antimere teeth #7 and # Antimere teeth #8 and #9 100 For all teeth #6 - # Comparisons of Fluorescence Change Values Among the Five Groups from Baseline to 3-Month Follow-Up 102 For each tooth 102 Tooth #6 102 Tooth #7 103 Tooth #8 103 Tooth #9 104 Tooth # Tooth # For Antimere Teeth 107 Antimere Teeth #6 and # Antimere Teeth #7 and # Antimere Teeth #8 and #9 109 For All Teeth #6 - # Comparisons of Fluorescence Change Values Between Baseline and 3-Month Follow-Up Within Each Treatment Group 110 Within Control Group 110 For Each Tooth 110 For Antimere Teeth 111 For All Teeth #6 - # Within Treat Office Group 114 For Each Tooth #6 to # For Antimere Teeth 114 For All Teeth #6 - # Within Treat Paste Group 115 For Each Tooth #6 - # For Antimere Teeth 117 For All Teeth #6 - # Within Treat Plus Group 119 For Each Tooth #6 - # For Antimere Teeth 119 For All Teeth #6 - # Within Treat Topex Group 121 For Each Tooth #6 - # For Antimere Teeth 123 For All Teeth #6 - # DISCUSSION 125 Discussion of Sample and Patient Inclusion Criteria 125 Discussion of Clinical Procedure 126 Discussion of Measurement of Data and Statistical Analysis 127 vii
10 Discussion of Results for Statistical Analysis of Reliability of Intra- and Inter-Examiner Measurements of Lesion Areas 128 Discussion of Results for Comparison, Among Groups, of Lesion Areas at Baseline 128 Discussion of Results for Comparison, Among Groups, of Lesion Areas and Lesion Area Changes at 3-Months Follow-Up 129 Discussion of Results for Comparison of Lesion Area Changes, Within Groups, at 3-Months Follow-Up 130 Discussion of Results for Comparison, Among Groups, of Fluorescence Decrease at Baseline 130 Discussion of Results for Comparison, Among Groups, of Fluorescence Decrease and Fluorescence Decrease Changes in Lesion Areas at 3-Months Follow-Up 131 Discussion of Results for Comparison of Fluorescence Decrease and Fluorescence Decrease Changes in Lesion, Within Groups, at 3-Months Follow-Up 131 Discussion of Sources of Potential Error and Limitations of the Study 132 Discussion of Clinical Application 133 Discussion of Potential Future Projects 133 SUMMARY AND CONCLUSIONS 137 REFERENCES 139 viii
11 LIST OF TABLES Table 1. Table 2. Table 3. Table 4. Table 5. Table 6. Table 7. Table 8. Table 9. Table 10. Table 11. Table 12. Table 13. Table 14. Table 15. Descriptive statistics of measurement differences for intraand inter-examiner for tooth #6. 33 Descriptive statistics of measurement differences for intraand inter-examiner for tooth #7. 35 Descriptive statistics of measurement differences for intraand inter-examiner for tooth #8. 36 Descriptive statistics of measurement differences for intraand inter-examiner for tooth #9. 37 Descriptive statistics of measurement differences for intraand inter-examiner for tooth # Descriptive statistics of measurement differences for intraand inter-examiner for tooth # Descriptive statistics of measurement differences for intraand inter-examiner for antimere teeth #6 and # Descriptive statistics of measurement differences for intraand inter-examiner for antimere teeth #7 and # Descriptive statistics of measurement differences for intraand inter-examiner for antimere teeth #8 and #9. 43 Descriptive statistics of measurement differences for intraand inter-examiner for all teeth. 44 Descriptive statistics of lesion area for tooth #6 at baseline, all groups. 46 Descriptive statistics of lesion area for tooth #7 at baseline, all groups. 46 Descriptive statistics of lesion area for tooth #8 at baseline, all groups. 47 Descriptive statistics of lesion area for tooth #9 at baseline, all groups. 48 Descriptive statistics of lesion area for tooth #10 at baseline, all groups. 48 ix
12 Table 16. Descriptive statistics of lesion area for tooth #11 at baseline, all groups. 49 Table 17. Descriptive statistics of lesion area for antimere teeth #6 and #11 at baseline, all groups. 50 Table 18. Descriptive statistics of lesion area for antimere teeth #7 and #10 at baseline, all groups. 51 Table 19. Descriptive statistics of lesion area for antimere teeth #8 and #9 at baseline, all groups. 52 Table 20. Table 21. Table 22. Table 23. Table 24. Table 25. Table 26. Descriptive statistics of lesion area for all teeth #6 - #11 at baseline, all groups. 52 Descriptive statistics of lesion area for tooth #6 at 3 months, all groups. 53 Descriptive statistics of lesion area for tooth #7 at 3 months, all groups. 54 Descriptive statistics of lesion area for tooth #8 at 3 months, all groups. 55 Descriptive statistics of lesion area for tooth #9 at 3 months, all groups. 56 Descriptive statistics of lesion area for tooth #10 at 3 months, all groups. 56 Descriptive statistics of lesion area for tooth #11 at3 months, all groups. 57 Table 27. Descriptive statistics of lesion area for antimere teeth #6 and #11 at 3 months, all groups. 58 Table 28. Descriptive statistics of lesion area for antimere teeth #7 and #10 at 3 months, all groups. 59 Table 29. Descriptive statistics of lesion area for antimere teeth #8 and #9 at 3 months, all groups. 59 Table 30. Descriptive statistics of lesion area for all teeth #6 - #11 at 3 months, all groups. 60 x
13 Table 31. Descriptive statistics of lesion area changes for tooth #6 at 3 months, all groups. 61 Table 32. Descriptive statistics of lesion area changes for tooth #7 at 3 months, all groups. 62 Table 33. Descriptive statistics of lesion area changes for tooth #8 at 3 months, all groups. 63 Table 34. Descriptive statistics of lesion area changes for tooth #9 at 3 months, all groups. 64 Table 35. Descriptive statistics of lesion area changes for tooth #10 at 3 months, all groups. 65 Table 36. Descriptive statistics of lesion area changes for tooth #11 at 3 months, all groups. 66 Table 37. Table 38. Table 39. Table 40. Table 41. Table 42. Table 43. Table 44. Table 45. Descriptive statistics of lesion area changes for antimere teeth #6 and #11 at 3 months, all groups. 67 Descriptive statistics of lesion area changes for antimere teeth #7 and #10 at 3 months, all groups. 68 Mean difference in lesion area changes between baseline and 3-month follow-up. 68 Descriptive statistics of lesion area changes for antimere teeth #8 and #9 at 3 months, all groups. 69 Descriptive statistics of lesion area changes for all teeth #6 - #11 at 3 months, all groups. 70 Mean difference in lesion area changes between baseline and 3-month follow-up. 70 Descriptive statistics of lesion area changes for each tooth #6 - #11 at 3 months, Control group. 72 Descriptive statistics of lesion area changes for antimere teeth at 3 months, Control group. 73 Descriptive statistics of lesion area changes for all teeth #6 - #11 at 3 months, Control group. 73 xi
14 Table 46. Table 47. Descriptive statistics of lesion area changes for each tooth #6 - #11 at 3 months, Treat Office group. 74 Descriptive statistics of lesion area changes for antimere teeth at 3 months, Treat Office group. 76 Table 48. Descriptive statistics of lesion area changes for all teeth #6 and #11at 3 months, Treat Office group. 76 Table 49. Descriptive statistics of lesion area changes for all teeth #6 and #11at 3 months, Treat Paste group. 77 Table 50. Descriptive statistics of lesion area changes for all teeth #6 and #11at 3 months, Treat Paste group. 78 Table 51. Descriptive statistics of lesion area changes for all teeth #6 and #11at 3 months, Treat Paste group. 78 Table 52. Table 53. Table 54. Table 55. Table 56. Table 57. Descriptive statistics of lesion area changes for each tooth #6 - #11 at 3 months, Treat Plus group. 79 Descriptive statistics of lesion area changes for antimere teeth at 3 months, Treat Plus group. 81 Descriptive statistics of lesion area changes for all teeth #6 - #11at 3 months, Treat Plus group. 81 Descriptive statistics of lesion area changes for each tooth #6 - #11 at 3 months, Treat Topex group. 82 Descriptive statistics of lesion area changes for antimere teeth at 3 months, Treat Topex group. 83 Descriptive statistics of lesion area changes for all teeth #6 - #11 at 3 months, Treat Topex group. 84 Table 58. Descriptive statistics of fluorescence changes for tooth #6 at baseline, all groups. 84 Table 59. Descriptive statistics of fluorescence changes for tooth #7 at baseline, all groups. 85 Table 60. Descriptive statistics of fluorescence changes for tooth #8 at baseline, all groups. 86 xii
15 Table 61. Table 62. Descriptive statistics of fluorescence changes for tooth #9 at baseline, all groups. 87 Mean fluorescence change values of tooth 9 for five experimental groups. 87 Table 63. Descriptive statistics of fluorescence changes for tooth #10 at baseline, all groups. 88 Table 64. Descriptive statistics of fluorescence changes for tooth #11 at baseline, all groups. 89 Table 65. Table 66. Table 67. Descriptive statistics of fluorescence changes for antimere teeth #6 and #11 at baseline, all groups. 90 Descriptive statistics of fluorescence changes for antimere teeth #7 and #10 at baseline, all groups. 91 Descriptive statistics of fluorescence changes for antimere teeth #8 and #9 at baseline, all groups. 92 Table 68. Mean fluorescence change values of antimere teeth #8 and #9 for five experimental groups. 92 Table 69. Table 70. Descriptive statistics of fluorescence changes for all teeth #6 - #11 at baseline, all groups. 94 Mean fluorescence change values of all teeth for five experimental groups. 94 Table 71. Descriptive statistics of fluorescence changes for tooth #6 at 3 months, all groups. 95 Table 72. Descriptive statistics of fluorescence changes for tooth #7 at 3 months, all groups. 95 Table 73. Descriptive statistics of fluorescence changes for tooth #8 at 3 months, all groups. 96 Table 74. Descriptive statistics of fluorescence changes for tooth #9 at 3 months, all groups. 97 Table 75. Descriptive statistics of fluorescence changes for tooth #10 at 3 months, all groups. 98 xiii
16 Table 76. Descriptive statistics of fluorescence changes for tooth #10 at 3 months, all groups. 99 Table 77. Table 78. Table 79. Table 80. Descriptive statistics of fluorescence changes for antimere teeth #6 and #11 at 3 months, all groups. 99 Descriptive statistics of fluorescence changes for antimere teeth #7 and #10 at 3 months, all groups. 100 Descriptive statistics of fluorescence changes for antimere teeth #7 and #10 at 3 months, all groups. 101 Descriptive statistics of fluorescence changes for all teeth #6 - #11 at 3 months, all groups. 102 Table 81. Descriptive statistics of fluorescence change for tooth #6 from baseline to 3-month follow-up, all groups. 104 Table 82. Descriptive statistics of fluorescence change for tooth #7 from baseline to 3-month follow-up, all groups. 104 Table 83. Descriptive statistics of fluorescence change for tooth #8 from baseline to 3-month follow-up, all groups. 105 Table 84. Descriptive statistics of fluorescence change for tooth #9 from baseline to 3-month follow-up, all groups. 106 Table 85. Descriptive statistics of fluorescence change for tooth #10 from baseline to 3-month follow-up, all groups. 106 Table 86. Descriptive statistics of fluorescence change for tooth #11 from baseline to 3-month follow-up, all groups. 108 Table 87. Table 88. Table 89. Table 90. Descriptive statistics of fluorescence change for antimere teeth #6 and #11 from baseline to 3-month follow-up, all groups. 108 Descriptive statistics of fluorescence change for antimere teeth #7 and #10 from baseline to 3-month follow-up, all groups. 109 Descriptive statistics of fluorescence change for antimere teeth #8 and #9 from baseline to 3-month follow-up, all groups. 111 Descriptive statistics of fluorescence change for all teeth #6 - #11 from baseline to 3-month follow-up, all groups. 111 xiv
17 Table 91. Table 92. Table 93. Table 94. Table 95. Table 96. Table 97. Table 98. Table 99. Table 100. Table 101. Table 102. Table 103. Descriptive statistics of fluorescence change for each tooth from #6 - #11 from baseline to 3-month follow-up, Control Group. 112 Descriptive statistics of fluorescence change for antimere teeth from baseline to 3-month follow-up, Control Group. 113 Descriptive statistics of fluorescence change for all teeth #6 - #11 from baseline to 3-month follow-up, Control Group. 113 Descriptive statistics of fluorescence change for each tooth from #6 - #11 from baseline to 3-month follow-up, Treat Office Group. 115 Descriptive statistics of fluorescence change for antimere teeth from baseline to 3-month follow-up, Treat Office Group. 116 Descriptive statistics of fluorescence change for all teeth #6 - #11 from baseline to 3-month follow-up, Treat Office Group. 116 Descriptive statistics of fluorescence change for each tooth from #6 - #11 from baseline to 3-month follow-up, Treat Paste Group. 117 Descriptive statistics of fluorescence change for antimere teeth from baseline to 3-month follow-up, Treat Paste Group. 118 Descriptive statistics of fluorescence change for all teeth from #6 - #11 from baseline to 3-month follow-up, Treat Paste Group. 119 Descriptive statistics of fluorescence change for each tooth from #6 - #11 from baseline to 3-month follow-up, Treat Plus Group. 120 Descriptive statistics of fluorescence change for antimere teeth from baseline to 3-month follow-up, Treat Plus Group. 121 Descriptive statistics of fluorescence change for all teeth from #6 - #11from baseline to 3-month follow-up, Treat Plus Group. 121 Descriptive statistics of fluorescence change for each tooth from #6 - #11 from baseline to 3-month follow-up, Treat Topex Group. 122 xv
18 Table 104. Table 105. Descriptive statistics of fluorescence change for antimere teeth from baseline to 3-month follow-up, Treat Topex Group. 123 Descriptive statistics of fluorescence change for all teeth from #6 - #11 from baseline to 3-month follow-up, Treat Topex Group. 124 xvi
19 LIST OF FIGURES Figure 1. Figure 2. Example of white spot lesions (WSL) developed during orthodontic treatment. 2 Diagram illustrating the process of demineralization and remineralization. 5 Figure 3. ImageJ photo. 28 Figure 4. Figure 5. Photographic images illustrating typical remineralization effects observed in all treatments and the control. 135 QLF images illustrating typical lessening in the amount of fluorescence decrease observed in all treatment groups and in the control group. 136 xvii
20 1 INTRODUCTION Orthodontic treatment has many benefits including the improvement of a patient s dental and facial esthetics. However, the ideal esthetic outcome can be compromised by the development of demineralization around the appliances during orthodontic treatment. Upon removal of appliances at the completion of treatment, the patient may exhibit straight, yet blemished teeth. These white, opaque areas of demineralization are evidence of a loss of calcified tooth structure and are termed white spot lesions (Figure 1). If left untreated, further decalcification may cause these early lesions to develop into cavitations that will require permanent restoration (Mitchell, 1992). Enamel demineralization associated with fixed orthodontic appliances has been observed for years and continues to be a problem even with advances in materials and techniques (Farhadian et al., 2008). Topical fluoride application has historically been the most common method to prevent development of white spot lesions around orthodontic appliances. Stratemann and Shannon (1974) reported a study using a stannous fluoride gel. While 58% of the control group exhibited decalcification, in comparison, only 2% of the subjects using the fluoride gel exhibited decalcification. A 25% reduction in the incidence of white spot lesions (Geiger et al., 1992) was reported in another study that used a neutral sodium fluoride rinse. More recently, a 40% decrease in the depth of demineralization was reported by Farhadian et al. (2008) when observing the depth among teeth treated with fluoride varnish compared to untreated controls. The results of these studies are promising. However, the majority of topical fluoride protocols rely on strict patient compliance, which can often be difficult to attain. The patients that are least likely to comply with required topical fluoride protocols are, unfortunately, the same patients with the poor oral hygiene that could benefit the most from these fluoride preventive measures.
.")
.")
21 2 Recently, two products have been reported to prevent and even reverse white spot lesions. The first is Recaldent, which is a complex of casein phosphopeptides and amorphous calcium phosphate (CPP-ACP). Casein phosphopeptides (CPP) are products of milk protein casein and are thought to have the ability to increase the level of calcium phosphate in dental plaque, depressing the demineralization process while boosting the remineralization process (Reynolds, 1998). Recaldent is the active ingredient in MI Paste and MI Paste Plus, which are preventive treatment products marketed by GC America (Alsip, Illinois) to provide a wide variety of benefits, including strengthening tooth enamel, reducing tooth sensitivity, enhancing remineralization, and preventing demineralization. The second product is NovaMin, which is a bioactive glass available material made up of calcium, sodium, phosphorus, and silica to make a chemical compound named calcium sodiumphosphosilicate. When in contact with the water in saliva NovaMin forms a crystalline hydroxyl-carbonate apatite product that is identical to that of the tooth. NovaMin has shown some benefit in preventing and remineralizing white spot lesions (Alaudin and Fontana, 2007; Jahm, 2010). NovaMin also has desensitizing and anti-microbial characteristics. NovaMin is currently marketed in a prescription fluoride (5000 ppm) toothpaste product called Topex Renew, which is marketed by Sultan Healthcare, Hackensack, NJ. Figure 1. Example of white spot lesions (WSL) developed during orthodontic treatment.
22 3 Study Objective The objective of this study was to evaluate the effectiveness of MI Paste (GC America, Alsip, Illinois), MI Paste Plus (GC America, Alsip, Illinois), and Topex Renew (Sultan Healthcare, Hackensack, NJ) in increasing remineralization and improving the esthetic appearance of white spot lesions in patients after treatment with fixed orthodontic appliances. In addition, at-home only versus in-office and at-home treatment protocols were evaluated. Specific inclusion criteria had to be met by each patient in order for them to be included in the study. Those patients who were eligible and choose to participate in the study either underwent treatment for 3 months, using one of three at-home applications, either MI Paste, MI Paste Plus, and Topex Renew ; were included in the three month control group; or underwent a separate treatment protocol consisting of four in-office MI Paste Plus TM treatments, as well as three months of at-home MI Paste Plus TM applications. Initial and final photographs were made, and the areas of the white spot lesions were measured and changes in area were analyzed. Quantitative light-induced fluorescence (QLF) was also used to evaluate the remineralization effects immediately after orthodontic treatment and 3 months posttreatment.
23 4 LITERATURE REVIEW Development of a White Spot Lesion Affecting nearly 90% of youth and 95% of adults within the United States (García-Godoy et al., 2008), dental caries is one of the most prevalent chronic diseases in adults and children (Featherstone, 2000). Dental caries is a preventable disease, however, and is governed in a multi-factorial manner that involves bacteria (dental plaque), susceptible teeth (the host), and carbohydrates (the diet) (Keyes et al., 1963). A dynamic demineralization-remineralization process occurs at the surface of each tooth in the oral environment, involving these many factors. During tooth eruption into the oral cavity, teeth are immediately covered by an acquired enamel pellicle, consisting of an acellular base layer of protective proteins, which is continually present and immediately reforms after disruption from tooth brushing or professional prophylactic cleaning. The enamel pellicle serves as the base on which dental plaque builds (García-Godoy et al., 2008). Bacteria bind to the enamel pellicle, forming dental plaque, and as the plaque matures, additional bacteria adhere. In total, over 600 different bacteria colonize dental plaque, with anaerobic, aerobic, and facultative anaerobic organisms coexisting (Marsh, 2006). Fermentable carbohydrates are metabolized by acidogenic bacteria within the dental plaque, producing acid. The ph surrounding the teeth is depressed by the produced acid, and once the ph passes a critical level (ph = 5.5), the acid has the potential to diffuse into enamel and dissolve calcium phosphate (Featherstone, 2000). Less-soluble phases of dicalcium phosphate dihydrate (CaHPO 4 2H 2 O) and fluoridated hydroxyapatite (Ca 5 ( PO4 ) 3 (OH) x F (1-x) ) precipitate out of the enamel surface and enter saliva during demineralization. Demineralization continues as long as the oral ph remains acidic, until equilibrium is reached between the enamel and the oral environment (Margolis et al., 1990).
24 5 Remineralization of the tooth surface can begin once the oral ph rises above the critical level and normalizes. The minerals calcium and phosphate are both naturally present in saliva, and along with any fluoride present, diffuse into the enamel and remineralize crystalline structures in demineralized areas. If fluoride is available and incorporated, fluoridated hydroxyapatite and fluorapatite are the constituents of the structures that are remineralized. Remineralized areas with fluoride present are much more resistant to acid attack than the original hydroxyapatite (Selwitz et al., 2007). Demineralization and remineralization processes occur many times throughout the day when acid or dietary sugars that bacteria convert to acid are introduced. In health, periods of remineralization are equal to, or exceed, periods of demineralization and will not result in demineralization or carious lesions. However, if the multi-factorial disease process is not kept in balance and the oral environment becomes acidic more often than not, demineralization rather than remineralization primarily occurs and the lesion will progress and eventually become a frank cavitation (Featherstone, 2000). Figure 2 shows the demineralization and remineralization cycle. Figure 2. Diagram illustrating the process of demineralization and remineralization.
25 6 The white spot lesion is the initial clinical presentation of dental caries in enamel. The white spot lesion is an area of demineralized enamel that usually develops because of prolonged plaque accumulation and acid exposure (Guzman-Armstrong, 2010). The opaque white appearance of the white spot lesion, in contrast to the surrounding enamel, is a result of the loss of subsurface enamel, which causes the loss of enamel translucency (Zero, 1999). When plaque accumulates and aciduric bacteria colonize and metabolize sugar into acid, active white spot lesions are produced over time. If left untreated, the white spot lesion can progress into a cavitated carious lesion. Being a multifactorial disease process, the patient s modifying factors can also impact the development of white spot lesions. The relevant factors include medical, dental, and medication history; diet; levels of calcium, phosphate, and bicarbonate in saliva; fluoride levels; and genetic susceptibility (Chalmers, 2006; Mount, 2005). To develop into a white spot lesion, a continuous process of enamel demineralization and remineralization occurs, with demineralization predominating, that can progress from initial demineralization, to noncavitated white spot lesions. If the lesion progresses further, it will finally cavitate (Fejerskov, 2003). White Spot Lesions in Orthodontic Patients Published literature shows wide variation in the prevalence of demineralization and white spot development during fixed orthodontic treatment. Gorelick et al. (1982) observed that, at debanding, 49.6% of patients showed white spot formation on at least one tooth, while Zachrisson et al. (1971) reported that 89% of patients developed white spot lesions. In addition to wide variation between studies, Sudjalim et al. (2006) reported a wide variation within their study, with overall prevalence of white spot lesions ranging widely between 2% and 96%. Variation in incidence geographically, or a different definition of a white spot lesion between studies, may be some explanations for the differences in reported prevalence. However prevalent, it is agreed upon that
26 7 demineralization and the development of white spot lesions is a problem during orthodontic treatment; and it is further established that white spot lesions may persist for years. The resulting dentition shows permanent, and unaesthetic, results with the potential of degrading to cavitated lesions, which would require placement of permanent restorations (Øgaard, 1989; Sudjalim et al., 2006). Some features of fixed orthodontic appliances increase the risk for demineralization and white spot lesion formation. Orthodontic appliances create areas for plaque accumulation and make plaque removal during tooth cleaning challenging. Self-cleansing mechanisms of saliva and oral musculature, which normally naturally occur, are limited by the irregular surfaces of brackets, bands, and wires (Guzman- Armstrong, 2010), which leads to increased plaque retention and subsequent demineralization and formation of white spot lesions. Risk factors in the multifactorial caries process, such as patients lacking fluoride supplementation (Ogaard et al., 1988), patients with poor oral hygiene (Zachrisson et al,. 1971), and patients with high Streptococcus mutans bacterial counts (Ogaard, 1989) are compounded due to the difficulty of effective daily cleaning around fixed appliances. Therefore, patients are at a higher risk for enamel demineralization and white spot lesion formation. Unfortunately, the white spot lesion development severity is not completely apparent until after fixed orthodontic appliances are removed. After removal of appliances, white and opaque demarcations on the labial surface of the teeth around the sites of previously adhered brackets and bands may be evident. Enamel directly beneath the fixed appliances often retains its original translucency, such that the white spot lesions often outline the previous appliances locations. These white demarcations of decalcification are unesthetic and detract from the smile and final orthodontic result of straight teeth and good occlusion. These white spot lesions most often occur on maxillary anterior teeth, the teeth most important in a typical attractive smile, so they pose a significant esthetic problem (Gorelick et al., 1982).
27 8 Methods During Orthodontic Treatment to Decrease Demineralization and White Spot Lesion Formation A number of possibly suitable agents and therapies can be used to help prevent white spot lesion formation in orthodontic patients. For instance, depending on the patient s risk factors, fluoride toothpastes, gels, varnishes, and mouth rinses; antimicrobials; xylitol gum; diet counseling; and casein derivatives (Guzman-Armstrong, 2010) are all possibilities that can be tailored to individual patients. These agents, and others, will be discussed below. Good oral hygiene is the first critical component in preventing demineralization, and reinforcing proper oral hygiene throughout orthodontic treatment has been shown to be effective in reducing demineralization (Artun et al., 1986). Exhaustive tooth brushing, daily flossing, and routine prophylactic cleanings will minimize the amount of dental plaque, thereby decreasing the probability of developing areas of decalcification and subsequent white spot lesions (Øgaard, 1989). Decreasing the amount of Streptococcus mutans relative to the other bacteria in the oral cavity and plaque has been shown to reduce the caries process (van Houte, 1994). Chlorhexidine is an antimicrobial agent that has been shown effective at reducing levels of Streptococcus mutans (Ribeiro, 2007). Therefore, a before bedtime protocol utilizing a chlorhexidine rinse, gel, or varnish may assist in preventing demineralization and white spot lesion formation. However, a drawback of the chlorhexidine products is their tendency to stain the teeth. Xylitol gum has been shown to be effective as a caries preventive agent, by reducing the amount of Streptococcus mutans. Xylitol is a polyol, which is a type of carbohydrate. However, xylitol is a substrate that is not able to be metabolized by Streptococcus mutans, and can also be used as a low-calorie sugar substitute. Therefore, xylitol is noncariogenic and also appears to have antimicrobial properties that help to inhibit the attachment of Streptococcus mutans to the teeth, decreasing the bacterial
28 9 count. Makinen et al (1995) showed that the systematic use of xylitol chewing gum can significantly reduce the risk of caries. Finally, the consumption of chewing gum also has the effect of stimulating increased production of saliva. This stimulated saliva contains more calcium and phosphate ionic concentrations when compared to non-stimulated saliva, which helps promote decreased demineralization and increased remineralization. Next, increasing topical fluoride levels in the oral cavity is a fundamental method to minimize the risk of decalcification and white spot lesion formation. Fluoride can be introduced via dentifrice, mouth rinses, foams, gels, varnishes, bonding agents, cements, and even elastomers. Several of these delivery systems are intended for home use, and therefore rely on patient cooperation, which is essential for these products to have a significant positive effect. For instance, Geiger et al. (1992) reported that patients who were more compliant with using a sodium fluoride mouth rinse had fewer white spot lesions, however, only 42% of patients studied were compliant with rinsing with the sodium fluoride mouth rinse at least every other day. It is difficult to have a high percentage of patients willing and able to follow hygiene instruction for an extended period of time. Due to the unpredictability of patient compliance during treatment, orthodontists have attempted non-compliant preventive treatments. These include the use of fluoride-containing bracket adhesive and resinmodified glass ionomer cements. The ability to release, take up, and re-release fluoride over time is an advantage over traditional composite resins; however, due to decreased handling ability and a possibly lower bond strength long-term, the use of these glass ionomer adhesives has not become wide-spread (Ashcraft et al., 1997; Vorhies et al., 1998). Another technique not reliant on patient compliance involves the placement of light-cured sealants on the labial surface adjacent to bonded brackets. In an in vitro study by Frazier et al. (1996) 80% of sealed teeth exhibited no signs of demineralization whereas all untreated controls exhibited demineralization. Fluoride-releasing elastomeric modules have also been developed but have yet to be proven to have significant
29 10 preventive value (Wiltshire, 1999; Miura et al., 2007). Finally, a fluoride varnish containing high amounts of fluoride can be applied at office visits at least twice per year (Schmit et al., 2002; Todd et al., 1999; Ashcraft et al., 1997; Vorhies et al., 1998). Mechanism of Action of Fluoride Many of the agents and techniques to reduce demineralization and white spot lesion formation involve fluoride, since fluoride has the ability to aid in the prevention of dental caries. There are three principal mechanisms of action of topical fluoride. The first is inhibition of bacterial metabolism. The second is to inhibit demineralization, while the third is to enhance remineralization (Featherstone, 2000). In the first mechanism of action, acidulated fluoride ions in the form HF are able to cross the cell wall and membrane of cariogenic bacteria, such as Streptococcus mutans, which is the key to the ability of topical fluoride to inhibit bacterial metabolism (Whitford et al., 1977; Van Loveren et al., 1990). HF dissociates once inside the cell, which acidifies the cell and inhibits cell enzyme activity with the fluoride ion F -. One enzyme that is affected by such inhibitory activity is enolase, which is an enzyme involved in carbohydrate metabolism. This inhibition limits the cariogenic potential of the cell, because if carbohydrate metabolism is inhibited, acid production by the cell will also be inhibited (Featherstone, 2000). Fluoride also protects the enamel surface from demineralization during an acid attack, which is the second important mechanism of action. When topical fluoride is available in plaque and when the fluid ph drops below the critical level of 5.5, fluoride will travel, along with the acid, into the subsurface layer of enamel. Once there, fluoride will absorb to the crystalline surface of carbonated hydroxyapatite (CAP), which protects the hydroxyapatite from being dissolved (Featherstone, 2000). Even low levels of fluoride surrounding the enamel during an acid attack are able to provide this inhibition of demineralization.
30 11 Lastly, fluoride s third mechanism of action of fluoride to reduce demineralization is to actually enhance the opposite remineralization process, and in addition, produce remineralized enamel that is more resistant to future demineralization. Following an acid attack, when the ph rises above 5.5, available calcium and phosphate are attracted into the crystal structure by the presence of absorbed fluoride. Calcium and phosphate ions are required for the remineralization process, and fluoride enhances the process. Calcium, phosphate, and fluoride are able to create a new crystalline structure between hydroxyapatite (HAP) and fluorapatite (FAP), which is stronger and more acidresistant than the previous structure (Featherstone, 2000; Moreno et al., 1977; ten Cate et al., 1991). Fluoride Dentifrice The most common method of topical fluoride delivery worldwide is fluoride dentifrice, which is recognized as a major factor in reducing caries in many developed countries (Zero, 2006). A systematic review of fifty-four published studies by Twetman et al. (2003), and a meta-analysis of seventy studies by Marinho et al. (2003) concluded that evidence was clear that fluoridated toothpastes are effective in preventing dental caries. There are a variety of fluoride concentrations in dentifrice, ranging from low (below 600 ppm) to high (5000 ppm), with the majority between ppm. High fluoride concentration dentifrices are generally intended for those with a high caries risk, while dentifrices with a low concentration are intended for patients under the age of six (Ammari, 2003). Twetman et al. (2003) reported a superior preventive effect when toothpastes containing 1,500 ppm fluoride were compared to those containing 1,000 ppm fluoride. There are a variety of fluoride sources in dentifrice. These sources include stannous fluoride (SnF 2 ), monofluorophosphate (MFP), and sodium fluoride (NaF). In
31 12 the United States, the majority of dentifrice included either the NaF or MFP forms (Zero, 2006). Few studies demonstrate increased efficacy of dentifrice with high 5000 ppm fluoride levels, such as PreviDent 5000 Plus (Colgate-Palmolive Co., New York City, NY, USA), over dentifrices with traditional fluoride levels of 1,100 ppm. One study which does exist (Baysan et al., 2001) compared the ability of two fluoridated dentifrices to reverse the primary lesions of root caries. One dentifrice contained 5,000 ppm of fluoride (PreviDent 5000 Plus ), and the other dentifrice contained only 1,100 ppm (Winterfresh Gel ). The study concluded that the 5,000 ppm fluoride dentifrice was significantly better at preventing the lesions than the 1,100 ppm fluoride dentifrice. Mechanism of Action of Casein Phosphopeptides Anticariogenic properties have been demonstrated by dairy products, including milk, milk concentrates, powders, and cheeses (Reynolds et al., 1981; Rosen et al., 1984; Harper et al., 1986, 1987; Krobicka et al., 1987; Silva et al., 1987). Casein, calcium, and phosphate have been shown to be the components responsible for this significant attribute, using in vitro, animal, and in situ caries models (Schweigert et al., 1946, Shaw, 1950; Bavetta et al., 1957; Holloway et al., 1961, Reynolds et al., 1984, 1987, 1989; Reynolds, 1987). Caseinate, which is a soluble form of casein, was found to possess anticariogenic potential in rats. However, the amount of this casein form which was required for effective caries control was found to be quite high, and as such, is not ideal for commercial use (Reynolds et al., 1984). Research then revealed that caseinate s ability to prevent subsurface enamel demineralization was not destroyed by digesting caseinate with trypsin (Reynolds, 1989). Tryptic peptides thus formed were shown to be incorporated, along with elevated concentrations of calcium and phosphate, within dental plaque (Reynolds, 1998). Casein phosphopeptides (CPP) are the major tryptic peptides associated with casein s
32 13 anticariogenic nature. Through multiple phosphoseryl residues, CPP has the unique ability to stabilize calcium phosphate, through multiple phosphoseryl residues, in a CPPamorphous calcium phosphate (ACP) complex (Azarpazhooh et al., 2008). Casein Phosphopeptide-Amorphous Calcium Phosphate (CPP-ACP) The University of Melbourne (Australia), and the Victorian Dairy Industry Authority (Abbotsford, Australia) have patented the CPP-ACP complex. Exclusive manufacturing and marketing rights for CPP-ACP have been retained by Bonlac Foods Limited, which is an Australian company owned by 2,300 dairy farmers in Victoria and Tasmania. Bonlac foods owns the trademark Recaldent (Azarpazhooh et al., 2008). Anticariogenic activity has been exhibited by CPP-ACP complexes in laboratory, animal, and human in situ caries models (Morgan et al., 2008; Oshiro et al., 2007; Ramlingam et al., 2005; Reynolds et al., 1987, 1991, 1995, 1997, 1998, 1999, 2003; Shen et al., 2001). CPP-ACP localizes amorphous calcium phosphate at the tooth surface. Here, CPP-ACP buffers free calcium and phosphate ion activity during an acid challenge, and also maintains a state where calcium and phosphate ions are supersaturated on the enamel surface, which is believed to be the mechanism behind CPP-ACP s anticariogenic properties (ElSayad, 2009). A decrease in demineralization results during a cariogenic challenge, and later, there is an increase in the subsequent remineralization of the enamel (Azarpazhooh et al., 2008; Reynolds, 1987, 1991, Pulido et al., 2008). CPP-ACP has been shown to incorporate well into the salivary pellicle, another important mechanism, thereby reducing the adherence of cariogenic bacteria, specifically S. sobrinus and S. mutans (Schupbach, 1996). In addition to reducing the amount of acid-producing bacteria within dental plaque, the incorporation of CPP-ACP within dental plaque is able to provide a reservoir of additional bio-available calcium and phosphate ions from its supersaturated state. Acidic challenges are buffered by these ions, which also aid in
33 14 rebuilding enamel structure (Aimutis, 2004). Similar to remineralization in the presence of fluoride, research shows that enamel remineralized by CPP-ACP is relatively more acid-resistant than normal tooth enamel (Yengopal, 2009). Sugar-free xylitol or sorbitolbased chewing gum is the most commonly tested and used method of CPP-ACP application in the human oral environment. Some other agents include milk, mouth rinses, lozenges, and dental cream/ MI Paste /Tooth Mousse (Yengopal, 2009). Adolescent subjects chewing a sugar-free gum containing 54 mg CPP-ACP were compared to subjects chewing identical gum without CPP-ACP, in terms of the progression and regress (Morgan et al., 2008). The gum containing CPP-ACP significantly slowed progression and enhanced regression of the lesions relative to the control group over a 24 month period. Also, gum containing 18.8 mg and 56.4 mg of the CPP-ACP nanocomplexes, chewed for 20 minutes four times per day for 14 days, increased enamel subsurface remineralization by 102% and 152%, respectively, relative to control sugar-free gum (Cai et al, 2007). While using a 2% CPP-ACP mouth rinse, calcium and inorganic phosphate levels increased 118% and 57% respectively, in a randomized, controlled trial (Reynolds et al., 2003). Increased calcium and phosphate ions within dental plaque was consistent with the proposed anticariogenic mechanism of CPP-ACP, due to maintaining the supersaturated state of ions associated with remineralization on the surface of enamel. The same study also found that mouth rinses containing ACP without CPP did not exhibit the same increased calcium and inorganic phosphate levels. Importantly, this demonstrates that CPP is essential in stabilizing and delivering ACP to the enamel surface (Reynolds et al., 2003). Currently, CPP-ACP (Recaldent ) is commercially available in the United States in two forms. The first is the sugar-free gum, Trident White (Cadbury North America, Parsippany, NJ) The second are the two pastes MI Paste and MI Paste Plus. MI Paste Plus contains 900 ppm fluoride in addition to Recaldent. Both pastes are
34 15 marketed by GC America (Alsip, IL, USA). The FDA has approved MI Paste for use primarily as an abrasive prophylactic paste, secondarily as treatment for dentin hypersensitivity, and thirdly for dry mouth. Therefore, its application as a caries prevention and remineralization agent is considered off-label. Outside the United States, MI Paste and MI Paste Plus are marketed as GC Tooth Mousse and Tooth Mousse Plus in other countries by GC Europe N.V. (Leuven, Belgium) (Azarpazhooh et al., 2008). Quality studies involving commercially-available MI Paste and MI Paste Plus (or Tooth Mousse TM and Tooth Mousse Plus TM ) are limited, although several articles have been published on the evidence of CPP-ACP as an anti-caries agent in its pure form. GC Corporation funded the majority of reviews, which are found only as abstracts presented at International Association for Dental Research (IADR) conferences (Paterson, 2008; Sakaguchi, 2005, 2006; Sato, 2003). Whether or not incorporation into the form of a paste alters its effective ability is unclear, although CPP-ACP is the main active ingredient in these products (5-10% w/v). Tooth Mousse was shown to have the ability to prevent the formation of caries in a bovine tooth model, according to an IADR abstract (Sato et al., 2003). This study used Knoop Hardness measurements to evaluate treatment groups, and found that those treated with Tooth Mousse displayed significantly less hardness reduction compared to a placebo paste and to a fluoridated paste. Also, Sakaguchi et al., (2005) found that MI Paste prevented acid-inducted demineralization in bovine tooth enamel when compared with a placebo paste, a 900 ppm fluoride paste, and water. In this study, samples were analyzed using quantitative lightinduced fluorescence (QLF) images as well as x-ray CT. The research determined that MI Paste displayed a significant protective effect by preventing enamel demineralization. In a later study (Sakaguchi et al., 2006) CPP-ACP with fluoride was described as having a synergistic effect in remineralizing bovine teeth subsurface enamel lesions. The combination of CPP-ACP and fluoride is found in Tooth Mousse Plus or
35 16 MI Paste Plus. In the study, Tooth Mousse Plus was compared with Tooth Mousse, a placebo containing no CPP-ACP or fluoride, and a paste containing 950 ppm fluoride. Tooth Mousse Plus (Tooth Mousse with 900 ppm fluoride) was determined to possess a greater remineralization potential than the added effects of the Tooth Mousse and the 950 ppm fluoridated paste groups. Again, each author reference list contains GC Corporation as a contributor. Conversely, when studies are not associated with GC Corporation, the results tend to be less conclusive. To start, a study assessing remineralization of subsurface enamel lesions using extracted human teeth examined MI Paste, MI Paste with Crest toothpaste, Crest toothpaste alone, and PreviDent 5000 Plus. The study did not observe any significant differences between the groups except for the PreviDent 5000 Plus treatment group (Eberle, 2006). Additionally, a more recent study examining if MI Paste held the ability to prevent artificial carious lesion progression in human enamel found no significant effect of the paste (Pulido et al., 2008). The study was trying to determine the difference between MI Paste, 1100 ppm NaF, or a combined application of both products, and no significant differences were detected by the study. On the other hand, a third study examined the resistance of stripped enamel to demineralization (Guilio et al., 2009), and reported greater demineralization resistance in teeth coated with Tooth Mousse than the control group. A fourth study was conducted over 12 weeks, to determine if white spot lesions had regressed or stabilized after using a remineralizing cream (Tooth Mousse TM ) containing 10% w/v CPP-ACP (Bailey et al., 2009). In the clinical trial, 92% of white spot lesions had regressed or stabilized after using Tooth Mousse TM, and there were significantly more (31%) post-orthodontic white spot lesions regressed with the Tooth Mousse TM, when compared with an identical cream not containing CPP-ACP. Lastly, Reynolds et al. (2003, 2008) determined that CPP-ACP promotes remineralization of enamel subsurface lesions, which restored the white opaque appearance of the lesions to translucency, even in the presence of fluoride.
36 17 There are only a couple of studies examining dentifrice with CPP-ACP. A dentifrice formulation containing 2% CPP-ACP nanocomplexes and 1100 ppm F (CPP- ACPF) was shown to be 2.6 times superior to a 1100 ppm fluoride only dentifrice when used to remineralize enamel subsurface lesions in situ (Reynolds et al., 2008). It was also determined that remineralized areas were more resistant to acid challenge, and that the CPP-ACP nanocomplexes and fluoride in the dentifrice resulted in significantly greater incorporation of fluoride into the subsurface enamel as fluorapatite. These results support the idea that CPP is an excellent delivery vehicle to co-localize bioavailable calcium, fluoride, and phosphate ions at the tooth surface to enhance remineralization of subsurface enamel lesions with fluorapatite (Reynolds, 2009). Quantitative Light-induced Fluorescence (QLF) Mineral loss and area in early enamel carious lesions can be assessed by the quantitative light-induced fluorescence (QLF) imaging method, which provides a fluorescent image of a smooth surface carious lesion when the lesion is visibly accessible. QLF imaging is non-destructive and can be used for longitudinal assessment of carious lesion change (Van der Veen, 2000). Angmar-Mansson (2001) determined that QLF imaging could be used for quantitative monitoring of mineral changes in enamel lesions, either regression or progression, over just a time period of a few months (Angmar- Mansson, 2001). Fluorescent light is the basis for QLF imaging, and the fluorescent light is induced by either visible or near-ultraviolet radiation. The QLF system used includes a computer with the proprietary software installed, and the fluorescent intraoral camera. A 35 W arc lamp produces white light, which is then filtered through a violet-blue bandpass filter. This results in a peak intensity of 370 nm with an 80 nm bandwidth, which is used for imaging. The intraoral camera handpiece contains a miniature CCD sensor to capture images, and has a 540 nm yellow transmitting filter positioned ahead of the CCD to filter
37 18 out backscattered and reflected light (Harless, 2002). Imaging involves capturing a series of images of the lesions at different timepoints, with the first image in the series being a baseline for all later image changes. Intraoral images are captured by manually pressing a pedal with the operator s foot. Alternatively, for subsequent series images, the image can be captured automatically when the image is equivalent enough in orientation to the baseline image. On-screen guidance exists for manipulating and analyzing images once captured (Angmar-Mansson, 2001) There is an uncertainty regarding the cause of the decreased fluorescence of incipient lesions. The generally accepted explanation is that the light scattering in the lesion, which is much stronger than in sound enamel, causes the light path in the lesion to be much shorter than in sound enamel, thus the light absorption per volume is much smaller in the lesion and thus the fluorescence is less strong (Nakata, 2009). This causes the tooth image of the demineralized lesion to be darker than the sound enamel area (Wu, 2010). A second explanation is that the light scattering in the lesion is a barrier for excited light to reach the underlying fluorescing dentin, and a barrier for fluorescent light from dentin to reach the surface (Angmar-Mansson, 2001). Due to the noticeable difference in fluorescent intensity, QLF imaging has the ability to detect early carious lesions sooner than optical or radiographic diagnostic methods, and may be able to assess the severity of early lesions (Nakata, 2009). The QLF software computes lesion size and depth by reconstruction of a fluorescence level, which is less than 100% at the site of the lesion, to a fluorescence level equal to surrounding sound enamel, which is assumed to be 100% (Adeyemi, 2006). The software digitizes the fluorescent image of the lesion and quantifies the fluorescence loss in comparison to surrounding sound enamel by placement of a user defined patch. The borders of the patch are placed on surrounding sound enamel and the lesion is reconstructed by the software, such that the fluorescence in the lesion mimics the fluorescence in the outline of the patch (Mattousch, 2007). The fluorescence decrease is
38 19 expressed as a calculated percent difference between the actual and reconstructed fluorescence in the patch. The program can calculate the fluorescence loss, lesion area, and a combined product of fluorescence loss and area, and compare the values between successive time points. (Angmar-Mansson, 2001, Adeyemi, 2006). The equipment capabilities and operator skill are two components that affect the accuracy of any measurement, including QLF imaging. Ideally, equipment may be able to compensate for any deficiencies in the operator. With the QLF equipment, the operator adjusts the camera to view the region of interest on a monitor screen, and the light guide is attached to the camera, requiring no separate adjustment. The camera amplifier is automatically adjusted and an image can be grabbed and stored by pressing a foot pedal. All these factors reduce errors and help ensure accuracy. One shortcoming of QLF imaging is the need for repeatable and controlled lighting conditions (Adeyemi, 2006). Since the QLF imaging techniques rely on transmitted and reflected visible spectrum light, ambient light can affect results, and the equipment manufacturers suggest the product be used in darkness. In in vitro experiments, achieving this may be reasonable, but with live clinical subjects in an in vivo setting, such a setting may not be practicable or desirable. Many potential issues surround the use of QLF imaging in an area that is too darkened, including safety and comfort levels of both operators and patients (Pretty, 2002). While complete darkness may not be achievable, researchers found that dim room lighting, just sufficient for writing of notes, observation of operators and patients, and proper identification and utilization of equipment, did not significantly affect results (Pretty, 2002). A second issue is moisture content of the oral cavity, which can significantly affect results. In dry teeth, light scattering is increased due to the greater refractive index of dry versus wet enamel. Teeth can be easily dried completely in an in vitro benchtop setting, but with live patients there are varying levels of intraoral moisture. Drying time
39 20 must be long enough to dry the teeth sufficiently, and the drying time must be consistent from subject to subject and time point to time point (Wu, 2010). Another potential source of error is that images at later time points must be acquired as identical to the baseline images as possible (Romane, 2005). Imaging geometry, including pitch and yaw, significantly affect analysis results (Ando et al., 2004). Some, but not all, positioning errors are correctable with software tools. Reference points that are seen on subsequent images, such as a cusp tip or gingival margin, are used and assist for correction due to geometry changes. These tools can rotate images, zoom them in or out, and move them left and right, but cannot correct differences in pitch and yaw. Therefore, to minimize errors in acquiring successive images, video-repositioning is included in the QLF software. This software displays both the baseline image and a live image simultaneously, and provides a gauge indicating the percent to which their orientations correlate. When the correlation reaches a certain percent, 95% for instance, the software can automatically capture the image and store it (Kuhnisch, 2004). When the correlation level is reached, the software can also be set to allow manual capture. Manual capture is subject to operator interpretation, but researchers found no significant improvement of the automatic capture technique versus the manual technique in image capture or the results of image analysis (Romane, 2005). A last issue is the subjective placement and definition of the analysis patch (Pretty, 2002). This placement could vary in respect to the size of the patch, centering of the patch, and which points along the patch border should be excluded from reconstruction during analysis. If lesions lie close to unsound enamel or enamel with defects, some border points must be excluded, as is the case if part of the patch border is on another anatomical feature, such as gingiva. The patch can be stretched from a circular to an elliptical shape, and the orientation of the ellipse can be changed, but lesions that are shapes other than round or elliptical are more difficult to easily patch (Pretty, 2001)
40 21 Research has tested the in vivo repeatability and reproducibility of QLF. Three operators tested the process by capturing images of 15 incipient smooth surface lesions in vivo, and performing the analytical techniques as well on the images of the 15 in vivo incipient smooth surface lesions. Interexaminer and intraexaminer reliabilities were calculated with correlation coefficients, r, between 0.95 and 0.99 for the image capturing stage. The intraclass correlation coefficient, r, was determined to be between 0.93 and 0.99 for all three operators during the analytical stage. Interexaminer reliability for this stage showed an interclass correlation coefficient, r, between 0.95 and Therefore, the research determined that repeatability and reproducibility of the QLF method in vivo is excellent (Angmar-Mansson, 2001). Another study determined repeatability and reproducibility were also high during in vitro research (Adeyemi, 2006). In vivo research assessing the QLF method for measuring mineralization changes in natural enamel lesions on smooth surfaces was conducted in a 12-month study monitoring remineralization of carious lesions. The lesions had developed around orthodontic brackets during fixed appliance therapy. After removal of the orthodontic brackets and bands had revealed active carious lesions, caries preventive measures were intensified. The QLF method was used to monitor the carious lesions, starting immediately after removal of the orthodontic brackets and proceeding once a month thereafter. During the 1-year follow-up period, the lesion areas decreased, and the lost enamel fluorescence was partly regained at the same time, demonstrating remineralization. The research determined that QLF is appropriate for in vivo monitoring of incipient enamel lesion mineralization changes, and also concluded that QLF imaging is useful for the evaluation of preventive measures in caries-susceptible individuals, such as orthodontic patients (Mattousch, 2007).
41 22 MATERIALS AND METHODS The study protocol was reviewed and approved by the Institutional Review Board (ID# ) at the University of Iowa. Sample A total of 30 subject participants aged 12 to 22 years were enrolled in this clinical study. All study participants were recruited from the patient pool recently treated with fixed edgewise orthodontic appliances in the Department of Orthodontics at the University of Iowa, College of Dentistry. The sample was comprised of 6 control subjects and 24 treatment subjects. The 24 treatment subjects were divided into 4 groups of 6 subjects each. All 30 subjects were Caucasian, 18 were female and 12 were male. The control group (Control group) used OTC 1100 ppm fluoride toothpaste. The four treatment groups were three that used one of three at-home applications, either MI Paste (Treat Paste group), MI Paste Plus (Treat Plus group), and Topex Renew (Treat Topex group); and one that underwent a separate treatment protocol consisting of four in-office MI Paste Plus TM treatments, as well as three months of at-home MI Paste Plus TM applications (Treat Office group). Patient Inclusion Criteria The patients must have been age 12 years or older, been in good general health with no proven or suspected bovine milk protein allergy and/or with a sensitivity or allergy to benzoate preservatives, since treatment products are manufactured with bovine milk proteins and hydroxybenzoate. Patients were enrolled at either the deband/debond appointment or the Hawley retainer delivery appointment. Patients must have had a treatment period with fixed orthodontic appliances of at least 1 year. Patients must have possessed at least 1 clinically visible white spot lesion on the facial surface of a maxillary
42 23 anterior tooth. Patients must not have undergone any type of previous remineralization/demineralization regimen. Patients must not have had more than 2 failed appointments during orthodontic treatment. The patient could not have undergone a consent debond (informed consent debond before orthodontic therapy is complete). Finally, the patient must have underwent the informed consent process for this project, and had an informed consent form signed by the participant. For those patients under 18 years, the informed consent form must have been signed, in addition, by their parents or guardians. Clinical Procedure Thirty patients were enrolled based on the inclusion criteria and were assigned to the treatment and control groups (n=6 per group). The control and MI Paste Plus In Office treatment groups were filled first, one patient assigned to each group in an alternating manner until filled both groups were filled as evenly as possible. The groups using only at-home protocols with MI Paste, MI Paste Plus, Topex Renew were then filled in an alternating manner, with one patient being assigned to each group until both groups were filled as evenly as possible. All subjects were either enrolled at the deband appointment or when they returned for the next appointment to receive Hawley retainers. The retainer delivery appointment is typically 2-4 weeks after the deband appointment. At time of enrollment, intraoral and QLF imaging photographs were obtained for all subjects as a baseline. Intraoral photographs consisted of five intra-oral views of the six maxillary anterior teeth made at a higher magnification than standard photographs. A standard intra-oral photographic camera was utilized and the photos were taken in a light controlled environment with a pre-set photographic protocol of camera settings. Each photograph was made with the same Nikon D1X/105mm/SB29 camera. The focal distance and magnification ratio were standardized at 1:2 and the aperture maintained at
43 24 an f equal to 40. The first photo was centered on the maxillary central incisors, the second and third on the right and left lateral incisors, and the remaining two on the right and left canines. Initial QLF images were made of the facial surface of all six maxillary anterior teeth. QLF images were captured using an intraoral fluorescence camera (Inspektor TM Pro) on a personal computer using the image capturing software (QLF Patient version ). Each image was centered on its respective tooth. The subjects teeth were dried for 30 seconds with a light air spray before imaging, which was also applied during imaging to keep the teeth dry and prevent any fogging of the mirrors in the QLF handpiece. Two banks of overhead fluorescent lighting are available in the QLF imaging room. The bank directly over the QLF equipment was turned off for all subjects to reduce ambient lighting. The bank of lights opposite the QLF equipment was left on to provide enough light to operate the equipment sufficiently. Once the photographs and QLF images were made, the Treat Office group started their first round of the in-office MI Paste Plus TM application. Appropriate isolation was achieved with cheek retractors. A 35% phosphoric acid etch was applied to only the white spot lesions for 1 minute. The etch was rinsed off thoroughly after 1 minute. A small amount of MI Paste Plus TM was applied directly onto the WSL with an application swab. The MI Paste Plus TM was left undisturbed for 5 minutes. After the 5 minutes had expired, the patient was instructed to use their tongue to spread the remaining paste throughout the mouth. The patient was requested to avoid expectoration for an additional 1-2 minutes. The patient was then advised not to eat or drink for 30 minutes following application. They were instructed to return every three weeks for their in-office MI Paste Plus TM applications. The Control, Treat Paste, Treat Plus, Treat Office, and Treat Topex groups were all given identical oral hygiene instruction and a 6.4 oz tube of cavity protection 1100 ppm fluoride toothpaste (either Colgate or Crest depending on patient preference) to use
44 25 during morning and evening brushing for the three months of the study. The groups were advised to take all medicines and drink any water they anticipated needing for the night before brushing. They were then instructed to brush with a soft toothbrush both morning and night with the toothpaste provided. The patients were instructed to expectorate thoroughly after brushing, but were instructed not to rinse. They were encouraged to floss once daily prior to brushing. If enrolled at the deband appointment, they were given their invisible retainers along with full time wear instructions. All groups, including the Treat Office group, were instructed to return for final photographs and QLF imaging at the end of the three month period. The treatment groups were given additional instructions for their at-home application of the selected treatment product, which was provided for the patient, and these instructions were as follows. Each patient applied a pea-sized amount of the paste to the facial surface of the maxillary six teeth with a clean dry finger. The patient immediately inserted their invisible retainer which remained in place overnight, and patients were instructed to not remove the retainer and to make every effort to not drink until the next morning. In the morning when the trays are removed from all treatment groups, the patients were informed they may expectorate, rinse, and complete their regular morning brush. Patients were instructed that their invisible retainers should be rinsed, brushed and reinserted for full time daily wear. Patients in the treatment groups were also given an at-home diary card. The card restated at-home treatment product application instructions and oral hygiene guidance in detail. The card also contained a log grid where the patient was instructed to write how many hours the retainer was worn overnight. A separate section was made available for comments. For patients in the Treat Office group, retainers were checked and an in-office application of MI Paste Plus TM was completed on each 3 week visit until the 3 month study was completed. MI Paste Plus TM application at each 3 week visit was identical to the initial visit. Appropriate isolation was achieved with cheek retractors. A 35%
45 26 phosphoric acid etch was applied to only the white spot lesions for 1 minute. The etch was rinsed off thoroughly after 1 minute. A small amount of MI Paste Plus TM was applied directly onto the WSL with an application swab. The MI Paste Plus TM was left undisturbed for 5 minutes. After the 5 minutes had expired, the patient was instructed to use their tongue to spread the remaining paste throughout the mouth. The patient was requested to avoid expectoration for an additional 1-2 minutes. The patient was then advised not to eat or drink for 30 minutes following application. At the conclusion of the 3 month study, patients in all groups returned for final intraoral and QLF imaging photographs. Diary cards were collected from all patients. Intraoral photographs consisted of five intra-oral views of the six maxillary anterior teeth made at a higher magnification than standard photographs. A standard intra-oral photographic camera was utilized and the photos were taken in a light controlled environment with a pre-set photographic protocol of camera settings. Each photograph was made with the same Nikon D1X/105mm/SB29 camera. The focal distance and magnification ratio were standardized at 1:2 and the aperture maintained at an f equal to 40. The first photo was centered on the maxillary central incisors, the second and third on the right and left lateral incisors, and the remaining two on the right and left canines. Initial baseline intraoral photographs were examined before final intraoral photographs were taken to ensure that photographs were oriented as closely as possible to the baseline photographs. QLF images were made of the facial surface of all six maxillary anterior teeth. Each image was centered on its respective tooth. QLF images were captured using an intraoral fluorescence camera (Inspektor TM Pro) on a personal computer using the image capturing software (QLF Patient version ). The subjects teeth were dried for 30 seconds with a light air spray before imaging, which was also applied during imaging to keep the teeth dry and prevent any fogging of the mirrors in the QLF handpiece. Two banks of overhead fluorescent lighting are available in the QLF imaging room. The bank
46 27 directly over the QLF equipment was turned off for all subjects to reduce ambient lighting. The bank of lights opposite the QLF equipment was left on to provide enough light to operate the equipment sufficiently. To help ensure that the images of the teeth were captured using the same camera position and from the same angle, the software s video-repositioning features were used. The video-repositioning feature displayed the baseline and live image simultaneously and computed their correlation based on similar geometry of the fluorescence intensities. Correlation is computed as a percentage, and the software provides a visual bar that rises to 100% with a line that can be set for the minimum acceptable correlation, which was 95% for this experiment. Images were captured manually by pressing the foot pedal of the QLF equipment when the follow-up image was at least 95% correlated to the baseline image. Measurement of Data The effectiveness of each treatment and the control in remineralization of white spot lesions was quantitatively measured in two ways. The first was measuring the area in square mm from the initial and final intraoral photographs, and then calculating the decrease in visible lesion area. The second was measuring the fluorescence loss in percent loss from QLF initial and final images, and then calculating the decrease in fluorescence loss. Each intraoral photograph was analyzed using the NIH ImageJ software. To measure white spot lesion area, images must be calibrated such that a number of pixels equals a certain distance. From the record models made at the debond appointment, actual mesial/distal measurements were made for each of the six maxillary anterior teeth with Mitutoyo Absolute Digimatic calipers. The distance measured was the widest mesial/distal distance, which generally occurred at the contact point if the tooth was in contact. If the tooth was not in contact or an adjacent tooth was not present, the distance was measured to what would be the contact point if the tooth was in contact. These

47 28 measurements were used to calibrate the photographic image in order to be able to measure the white spot lesions accurately. Using ImageJ, a precise tracing of the outline of each white spot lesion could be made, as shown in Figure 3. ImageJ could then calculate an accurate area, even when white spot lesion outline was very irregular. White spot lesion area was calculated for both the initial and final intraoral photographs, and change in lesion area was calculated by subtracting the final lesion area from the initial lesion area. All lesions were traced and areas computed two times by the primary observer, and one time by a secondary observer. This allowed calculation of intraobserver and interobserver reliability for the study. Figure 3. ImageJ photo.
48 29 The QLF imaging software computed the percentage of fluorescence loss in the white spot lesion area for both initial and final images. All positioning errors correctable with software tools were adjusted before analysis began. Reference points such as a cusp tip, gingival margin, crown width, or crown height were used to assist in correction of geometry errors. Correcting tools included the ability to rotate images, zoom them in or out, and move them left and right. After baseline and follow-up images were matched as closely as possible, a patch was selected. Patches were changed from circular to elliptical when needed, and oriented such that the patch placed was the smallest that could be placed over the entire white spot lesion. This process was easy with small circular lesions, but more challenging with the larger U-shaped lesions that typically appear around fixed appliances. After the patch was placed, if any points on the border of the patch needed to be excluded from reconstruction, then was then done. Most commonly, this occurred when the white spot lesion continued all the way to the edge of gingiva. In this case, border points directly adjacent to the gingiva, which typically were very dark and not fluorescent, were excluded from reconstruction, such that the reconstruction occurred only using sound enamel fluorescent in other parts of the patch border. The QLF software then reconstructed the lesions on the baseline and follow-up images, and compute the fluorescence change between initial and final appointment Statistical Analysis of Lesion Area Changes in Intraoral Photographs Univariate descriptive statistics were used to describe individual variables in this section of the study. One-way ANOVA was performed to assess the treatment effect on lesion area at baseline and at 3-month follow-up. The post-hoc Tukey s HSD (Honestly Significant Difference) test was used for the multiple pairwise comparisons to determine which pairs of groups differed. The same analysis procedures were used to evaluate the
49 30 change in lesion area between baseline and 3-month follow-up among the treatment groups. Because of the lack of normality under some conditions, rank (or log) transformation was conducted. Subsequently, one-way ANOVA based on rank transformed data (i.e., equivalent to non-parametric Kruskal-Wallis test), followed by the post-hoc Bonferroni test, was used to detect differences among five experimental groups. The Shapiro-Wilks test was applied to verify the assumption of normality. The paired-sample t-test and the nonparametric Wilcoxon signed-rank test (i.e. an analog of the paired-sample t-test when the normality assumption was violated) were used to assess the difference in lesion area between baseline and 3-month follow-up under different conditions. A p-value of less than 0.05 was used as a criterion for statistical significance, and 0.05<p<0.10 was used as a criterion for marginal significance. SAS for Windows (v9.3, SAS Institute Inc, Cary, NC, USA) was used for data analysis. Statistical Analysis of Fluorescence Changes in QLF Images Univariate descriptive statistics were used to describe individual variable in this section of the study. One-way ANOVA was performed to assess the treatment effect on fluorescence change values at baseline and 3-month follow-up. The post-hoc Tukey s HSD (Honestly Significant Difference) test was used for the multiple pairwise comparisons to determine which pairs of groups differ. The same analysis procedures were used to evaluate the change in fluorescence change values between baseline and 3- month follow-up among the treatment groups. Because of the lack of normality under some conditions, rank transformation was conducted. Subsequently, one-way ANOVA based on rank-transformed data (i.e., equivalent to non-parametric Kruskal-Wallis test), followed by the post-hoc Bonferroni
50 31 test, was used to detect the differences among five experimental groups. The Shapiro- Wilks test was applied to verify assumption of normality. The paired-sample t-test and nonparametric Wilcoxon signed-rank test were used to assess the differences in change in fluorescence change values from baseline to 3- month follow-up within each treatment group. All tests employed a 0.05 level of statistical significance. SAS for Windows (v9.3, SAS Institute Inc, Cary, NC, USA) was used for the data analysis. Statistical Analysis of Intraobserver and Interobserver Reliability The paired samples t-test was used to assess the mean differences between pairs of measurements on intraoral photographs for intra- and inter-examiner. Additionally, intraclass correlation coefficients were computed as a measure of agreement between two measurements which were taken either by a single evaluator or two evaluators on the same tooth for each subject. The following is an approximate guide for interpreting an agreement between two measurements that corresponds to an intraclass and interclass correlation coefficient: 1) 1= perfect agreement 2) 0.8=strong agreement 3) 0.5=moderate agreement 4) 0.2=weak agreement 5) 0=no agreement. All tests employed a 0.05 level of statistical significance. SAS for Windows (v9.3, SAS Institute Inc, Cary, NC, USA) was used for the data analysis.
51 32 RESULTS Statistical Analysis of Reliability of Intra- and Inter-Examiner Measurements of Lesion Areas A total of 30 subjects were selected and randomly divided into 5 groups (n=6/per group. Each subjects had 6 teeth measured, except for two patients who were missing one lateral incisor each, who had 5 teeth measured. Therefore, a total of 178 teeth were examined. Of the 178 teeth, two measurements (baseline vs. 3-month) were obtained from each tooth on the same patient. Moreover, each patient s teeth were evaluated by two examiners. To eliminate possible bias, examiner A took two measurements on each tooth in two sessions with an interval of 7 days and examiner B only took one measurement. Therefore, 3 measurements were obtained on each tooth from same subject. The intra- and inter-examiner measurement reliability was assessed for each tooth, for antimere teeth, and for all teeth. Tooth #6 Based on the paired samples t-test, intra-examiner duplicate measurements for examiner A showed no significant differences (p=0.4245), whereas inter-examiner differences (i.e. differences between measurements made by examiner A and examiner B) were also not statistically significant (p= for 1 st measurements of examiner A vs. measurements of examiner B, and p= for 2nd measurements of examiner A vs. measurements of examiner B, respectively). The mean differences between any two measurements are summarized in Table 1. Additionally, intra- and inter-class correlation coefficients were computed to assess intra- and inter-observer agreement in measurements of lesion areas. The correlation coefficient between duplicate measurements for examiner A (intra-examiner)
52 33 was r = The corresponding values between measurements examined by examiners A and B (inter-examiner) were r = 0.95 and r=0.95 for 1 st or 2 nd measurements of examiner A vs. measurements of examiner B, respectively. Correlation coefficient of 0.95 indicated a strong agreement between two measurements with a single evaluator and with two evaluators. Table 1: Descriptive statistics of measurement differences for intra- and inter-examiner for tooth #6. Variable N Mean Std Dev Minimum Maximum P-value Lesion Area Lesion Area Lesion Area Lesion Lesion Lesion Note: Lesion Area 1 = 1 st measurements of Examiner A Lesion Area 2 = 2 nd measurements of Examiner A Lesion Area 3 = Measurements of Examiner B Lesion 12 = 1 st measurements of Examiner A minus 2 nd measurements of Examiner A Lesion 13 = 1 st measurements of Examiner A minus measurements of Examiner B Lesion 23 = 2 nd measurements of Examiner A minus measurements of Examiner B Tooth #7 Based on the paired samples t-test, intra-examiner duplicate measurements for examiner A showed significant differences (p=0.0045), whereas inter-examiner differences (i.e. differences between measurements made by examiner A and examiner
53 34 B) were not statistically significant (p= for 1 st measurements of examiner A vs. measurements of examiner B. However, the second measurements of examiner A vs. measurements of examiner B showed significant differences (p=0.0038). The mean differences between any two measurements are summarized in Table 2. Additionally, intra- and inter-class correlation coefficients were computed to assess intra- and inter-observer agreement in measurements of lesion areas. The correlation coefficient between duplicate measurements for examiner A (intra-examiner) was r = The corresponding values between measurements examined by A and B (inter-examiner) were r = 0.97 and r=0.96 for 1 st or 2 nd measurements of examiner A vs. examiner B, respectively. Correlation coefficients of 0.96 and 0.97 indicated a strong agreement between two measurements with a single evaluator and with two evaluators. Tooth #8 Based on the paired samples t-test, intra-examiner duplicate measurements for examiner A showed no significant differences (p=0.7881), whereas inter-examiner differences (i.e. differences between measurements made by examiner A and examiner B) were also not statistically significant (p= for 1 st measurements of examiner A vs. measurements of examiner B, and p= for 2nd measurements of examiner A vs. measurements of examiner B, respectively). The mean differences between any two measurements are summarized in Table 3. Additionally, intra- and inter-class correlation coefficients were computed to assess intra- and inter-observer agreement in measurements of lesion areas. The correlation coefficient between duplicate measurements for examiner A (intra-examiner) was r = The corresponding values between measurements examined by A and B (inter-examiner) were r = and r=0.94 for 1 st or 2 nd measurements of examiner A vs. examiner B, respectively. Correlation coefficients of 0.94 indicated a strong agreement between two measurements with a single evaluator and with two evaluators.
54 35 Table 2: Descriptive statistics of measurement differences for intra- and inter-examiner for tooth #7. Variable N Mean Std Dev Minimum Maximum P-value Lesion Area Lesion Area Lesion Area Lesion ** Lesion Lesion ** Note: ** = Significantly different (a paired-sample t-test) Lesion Area 1 = 1 st measurements of Examiner A Lesion Area 2 = 2 nd measurements of Examiner A Lesion Area 3 = Measurements of Examiner B Lesion 12 = 1 st measurements of Examiner A minus 2 nd measurements of Examiner A Lesion 13 = 1 st measurements of Examiner A minus measurements of Examiner B Lesion 23 = 2 nd measurements of Examiner A minus measurements of Examiner B Tooth #9 Based on the paired samples t-test, intra-examiner duplicate measurements for examiner A showed no significant differences (p=0.8012), whereas inter-examiner differences (i.e. differences between measurements made by examiner A and examiner B) were also not statistically significant (p= for 1 st measurements of examiner A vs. measurements of examiner B, and p= for 2nd measurements of examiner A vs. measurements of examiner B, respectively). The mean differences between any two measurements are summarized in Table 4.
55 36 Table 3: Descriptive statistics of measurement differences for intra- and inter-examiner for tooth #8. Variable N Mean Std Dev Minimum Maximum P-Value Lesion Area Lesion Area Lesion Area Lesion Lesion Lesion Note: Lesion Area 1 = 1 st measurements of Examiner A Lesion Area 2 = 2 nd measurements of Examiner A Lesion Area 3 = Measurements of Examiner B Lesion 12 = 1 st measurements of Examiner A minus 2 nd measurements of Examiner A Lesion 13 = 1 st measurements of Examiner A minus measurements of Examiner B Lesion 23 = 2 nd measurements of Examiner A minus measurements of Examiner B Additionally, intra- and inter-class correlation coefficients were computed to assess intra- and inter-observer agreement in measurements of lesion areas for tooth #9. The correlation coefficient between duplicate measurements for examiner A (intraexaminer) was r = The corresponding values between measurements examined by A and B (inter-examiner) were r = and r=0.92 for 1 st or 2 nd measurements of examiner A vs. examiner B, respectively. Correlation coefficients of 0.92 indicated a strong agreement between two measurements with a single evaluator and with two evaluators.
56 37 Table 4: Descriptive statistics of measurement differences for intra- and inter-examiner for tooth #9. Variable N Mean Std Dev Minimum Maximum P-value Lesion Area Lesion Area Lesion Area Lesion Lesion Lesion Note: Lesion Area 1 = 1 st measurements of Examiner A Lesion Area 2 = 2 nd measurements of Examiner A Lesion Area 3 = Measurements of Examiner B Lesion 12 = 1 st measurements of Examiner A minus 2 nd measurements of Examiner A Lesion 13 = 1 st measurements of Examiner A minus measurements of Examiner B Lesion 23 = 2 nd measurements of Examiner A minus measurements of Examiner B Tooth #10 Based on the paired samples t-test, intra-examiner duplicate measurements for examiner A showed no significant differences (p=0.2449), whereas inter-examiner differences (i.e. differences between measurements made by examiner A and examiner B) were also not statistically significant (p= for 1 st measurements of examiner A vs. measurements of examiner B, and p= for 2nd measurements of examiner A vs. measurements of examiner B, respectively). The mean differences between any two measurements are summarized in Table 5. Additionally, intra- and inter-class correlation coefficients were computed to assess intra- and inter-observer agreement in measurements of lesion areas. The correlation coefficient between duplicate measurements for examiner A (intra-examiner)
57 38 was r = The corresponding values between measurements examined by A and B (inter-examiner) were r = and r=0.95 for 1 st or 2 nd measurements of examiner A vs. examiner B, respectively. Correlation coefficients of 0.95 indicated a strong agreement between two measurements with a single evaluator and with two evaluators. Table 5: Descriptive statistics of measurement differences for intra- and inter-examiner for tooth #10. Variable N Mean Std Dev Minimum Maximum P-value Lesion Area Lesion Area Lesion Area Lesion Lesion Lesion Note: Lesion Area 1 = 1 st measurements of Examiner A Lesion Area 2 = 2 nd measurements of Examiner A Lesion Area 3 = Measurements of Examiner B Lesion 12 = 1 st measurements of Examiner A minus 2 nd measurements of Examiner A Lesion 13 = 1 st measurements of Examiner A minus measurements of Examiner B Lesion 23 = 2 nd measurements of Examiner A minus measurements of Examiner B Tooth #11 Based on the paired samples t-test, intra-examiner duplicate measurements for examiner A showed no significant differences (p=0.9713), whereas inter-examiner differences (i.e. differences between measurements made by examiner A and examiner B) were also not statistically significant (p= for 1 st measurements of examiner A
58 39 vs. measurements of examiner B, and p= for 2nd measurements of examiner A vs. measurements of examiner B, respectively). The mean differences between any two measurements are summarized in Table 6. Additionally, intra- and inter-class correlation coefficients were computed to assess intra- and inter-observer agreement in measurements of lesion areas. The correlation coefficient between duplicate measurements for examiner A (intra-examiner) was r = The corresponding values between measurements examined by A and B (inter-examiner) were r = 0.89 and r=0.89 for 1 st or 2 nd measurements of examiner A vs. examiner B, respectively. Correlation coefficient of 0.89 indicated a strong agreement between two measurements with a single evaluator and with two evaluators. Table 6: Descriptive statistics of measurement differences for intra- and inter-examiner for tooth #11. Variable N Mean Std Dev Minimum Maximum P-value Lesion Area Lesion Area Lesion Area Lesion Lesion Lesion Note: Lesion Area 1 = 1 st measurements of Examiner A Lesion Area 2 = 2 nd measurements of Examiner A Lesion Area 3 = Measurements of Examiner B Lesion 12 = 1 st measurements of Examiner A minus 2 nd measurements of Examiner A Lesion 13 = 1 st measurements of Examiner A minus measurements of Examiner B Lesion 23 = 2 nd measurements of Examiner A minus measurements of Examiner B
59 40 Antimere Teeth #6 and #11 Based on the paired samples t-test, intra-examiner duplicate measurements for examiner A showed no significant differently (p=0.4773), whereas inter-examiner differences (i.e. differences between measurements made by examiner A and examiner B) were also not statistically significant (p= for 1 st measurements of examiner A vs. measurements of examiner B, and p= for 2nd measurements of examiner A vs. measurements of examiner B, respectively). The mean differences between any two measurements are summarized in Table 7. Additionally, intra- and inter-class correlation coefficients were computed to assess intra- and inter-observer agreement in measurements of lesion areas. The correlation coefficient between duplicate measurements for examiner A (intra-examiner) was r = The corresponding values between measurements examined by A and B (inter-examiner) were r = 0.92 and r=0.92 for 1 st or 2 nd measurements of examiner A vs. examiner B, respectively. Correlation coefficients of 0.92 indicated a strong agreement between two measurements with a single evaluator and with two evaluators. Antimere Teeth #7 and #10 Based on the paired samples t-test, intra-examiner duplicate measurements for examiner A showed no significant differently (p=0.0980), whereas inter-examiner differences (i.e. differences between measurements made by examiner A and examiner B) were also not statistically significant (p= for 1 st measurements of examiner A vs. measurements of examiner B, and p= for 2nd measurements of examiner A vs. measurements of examiner B, respectively). The mean differences between any two measurements are summarized in Table 8. Additionally, intra- and inter-class correlation coefficients were computed to assess intra- and inter-observer agreement in measurements of lesion areas. The correlation coefficient between duplicate measurements for examiner A (intra-examiner)
60 41 Table 7: Descriptive statistics of measurement differences for intra- and inter-examiner for antimere teeth #6 and #11. Variable N Mean Std Dev Minimum Maximum P-value Lesion Area Lesion Area Lesion Area Lesion Lesion Lesion Note: Lesion Area 1 = 1 st measurements of Examiner A Lesion Area 2 = 2 nd measurements of Examiner A Lesion Area 3 = Measurements of Examiner B Lesion 12 = 1 st measurements of Examiner A minus 2 nd measurements of Examiner A Lesion 13 = 1 st measurements of Examiner A minus measurements of Examiner B Lesion 23 = 2 nd measurements of Examiner A minus measurements of Examiner B was r = The corresponding values between measurements examined by A and B (inter-examiner) were r = 0.96 and r=0.96 for 1 st or 2 nd measurements of examiner A vs. examiner B, respectively. Correlation coefficients of 0.96 indicated a strong agreement between two measurements with a single evaluator and with two evaluators. Antimere Teeth #8 and #9 Based on the paired samples t-test, intra-examiner duplicate measurements for examiner A showed no significant differently (p=0.7109), whereas inter-examiner differences (i.e. differences between measurements made by examiner A and examiner B) were also not statistically significant (p= for 1 st measurements of examiner A vs. measurements of examiner B, and p= for 2nd measurements of examiner A vs.
61 42 Table 8: Descriptive statistics of measurement differences for intra- and inter-examiner for antimere teeth #7 and #10. Variable N Mean Std Dev Minimum Maximum P-value Lesion Area Lesion Area Lesion Area Lesion Lesion Lesion Note: Lesion Area 1 = 1 st measurements of Examiner A Lesion Area 2 = 2 nd measurements of Examiner A Lesion Area 3 = Measurements of Examiner B Lesion 12 = 1 st measurements of Examiner A minus 2 nd measurements of Examiner A Lesion 13 = 1 st measurements of Examiner A minus measurements of Examiner B Lesion 23 = 2 nd measurements of Examiner A minus measurements of Examiner B measurements of examiner B, respectively). The mean differences between the two measurements are summarized in Table 1. The mean differences between any two measurements are summarized in Table 9. Additionally, intra- and inter-class correlation coefficients were computed to assess intra- and inter-observer agreement in measurements of lesion areas. The correlation coefficient between duplicate measurements for examiner A (intra-examiner) was r = The corresponding values between measurements examined by A and B (inter-examiner) were r = 0.93 and r=0.93 for 1 st or 2 nd measurements of examiner A vs. examiner B, respectively. Correlation coefficients of 0.93 indicated a strong agreement between two measurements with a single evaluator and with two evaluators.
62 43 Table 9: Descriptive statistics of measurement differences for intra- and inter-examiner for antimere teeth #8 and #9. Variable N Mean Std Dev Minimum Maximum P-value Lesion Area Lesion Area Lesion Area Lesion Lesion Lesion Note: Lesion Area 1 = 1 st measurements of Examiner A Lesion Area 2 = 2 nd measurements of Examiner A Lesion Area 3 = Measurements of Examiner B Lesion 12 = 1 st measurements of Examiner A minus 2 nd measurements of Examiner A Lesion 13 = 1 st measurements of Examiner A minus measurements of Examiner B Lesion 23 = 2 nd measurements of Examiner A minus measurements of Examiner B For all teeth Based on the paired samples t-test, intra-examiner duplicate measurements for examiner A showed no significant differently (p=0.1069), whereas inter-examiner differences (i.e. differences between measurements made by examiner A and examiner B) were also not statistically significant (p= for 1 st measurements of examiner A vs. measurements of examiner B, and p= for 2nd measurements of examiner A vs. measurements of examiner B, respectively). The mean differences between the two measurements are summarized in Table 10. Additionally, intra- and inter-class correlation coefficients were computed to assess intra- and inter-observer agreement in measurements of lesion areas. The correlation coefficient between duplicate measurements for examiner A (intra-examiner)
63 44 was r = The corresponding values between measurements examined by A and B (inter-examiner) were r = 0.93 and r=0.93 for 1 st or 2 nd measurements of examiner A vs. examiner B, respectively. Correlation coefficients of 0.93 indicated a strong agreement between two measurements with a single evaluator and with two evaluators. Table 10: Descriptive statistics of measurement differences for intra- and inter-examiner for all teeth. Variable N Mean Std Dev Minimum Maximum P-value Lesion Area Lesion Area Lesion Area Lesion Lesion Lesion Note: Lesion Area 1 = 1 st measurements of Examiner A Lesion Area 2 = 2 nd measurements of Examiner A Lesion Area 3 = Measurements of Examiner B Lesion 12 = 1 st measurements of Examiner A minus 2 nd measurements of Examiner A Lesion 13 = 1 st measurements of Examiner A minus measurements of Examiner B Lesion 23 = 2 nd measurements of Examiner A minus measurements of Examiner B Statistical Analysis of Lesion Area Changes in Intraoral Photographs A total of 30 subjects aged 12 to 22 years (mean age: 16.1±2.3 year) were selected and divided into 5 groups (n=6/per group), including 18 females and 12 males. The five groups were the Control, Treat Office, Treat Paste, Treat Plus, and Treat Topex groups previously defined. Each subject had 6 teeth measured, except for two patients
64 45 who were missing one lateral incisor each, who had 5 teeth measured. Therefore, a total of 178 teeth were examined. Of the 178 teeth, two measurements were obtained from each tooth of the same patient at baseline and at 3-month follow-up, therefore, a total of 356 measurements were included in the study. An average of the two measurements of lesion area from examiner A on the same tooth for the same patient was used for the statistical analysis. Comparisons of Lesion Area Among the Five Groups at Baseline Comparison For Each Tooth Tooth #6 Since the normality assumption was valid (p=0.1811, Shapiro-Wilk test), one-way ANOVA was conducted. Results of one-way ANOVA revealed no significant effect for the type of treatments on lesion area for tooth 6 at baseline (F(4, 25)=0.55; p=0.7026). The data indicated there was no significant difference in lesion area among five groups at baseline for tooth 6 (Table 11). Tooth #7 Since the normality assumption was valid (p=0.8079, Shapiro-Wilk test), one-way ANOVA was conducted. Results of one-way ANOVA revealed no significant effect for the type of treatments on lesion area for tooth 7 at baseline (F(4, 25)=2.03; p=0.1206). The data indicated there was no significant difference in lesion area among five groups at baseline for tooth 7 (Table 12).
65 46 Table 11: Descriptive statistics of lesion area for tooth #6 at baseline, all groups. Tooth #6 Control Lesion Area Baseline Tooth #6 Treat Office Lesion Area Baseline Tooth #6 Treat Paste Lesion Area Baseline Tooth #6 Treat Plus Lesion Area Baseline Tooth #6 Treat Topex Lesion Area Baseline Table 12: Descriptive statistics of lesion area for tooth #7 at baseline, all groups. Tooth #7 Control Lesion Area Baseline Tooth #7 Treat Office Lesion Area Baseline Tooth #7 Treat Paste Lesion Area Baseline Tooth #7 Treat Plus Lesion Area Baseline Tooth #7 Treat Topex Lesion Area Baseline Tooth #8 Since the normality assumption was valid (p=0.1164, Shapiro-Wilk test), one-way ANOVA was conducted. Results of one-way ANOVA revealed no significant effect for the type of treatments on lesion area for tooth 8 at baseline (F(4, 25)=0.37; p=0.8288).
66 47 The data indicated there was no significant difference in lesion area among five groups at baseline for tooth 8 (Table 13). Table 13: Descriptive statistics of lesion area for tooth #8 at baseline, all groups. Tooth #8 Control Lesion Area Baseline Tooth #8 Treat Office Lesion Area Baseline Tooth #8 Treat Paste Lesion Area Baseline Tooth #8 Treat Plus Lesion Area Baseline Tooth #8 Treat Topex Lesion Area Baseline Tooth #9 Since the normality assumption was valid (p=0.4829, Shapiro-Wilk test), one-way ANOVA was conducted. Results of one-way ANOVA revealed no significant effect for the type of treatments on lesion area for tooth 9 at baseline (F(4, 25)=1.10; p=0.3792). The data indicated there was no significant difference in lesion area among five groups at baseline for tooth 9 (Table 14). Tooth #10 Since the normality assumption was valid (p=0.2045; Shapiro-Wilk test), one-way ANOVA was conducted. Results of one-way ANOVA revealed no significant effect for the type of treatments on lesion area for tooth 10 at baseline (F(4, 23)=0.02; p=0.9994).
67 48 The data indicated there was no significant difference in lesion area among five groups at baseline for tooth 10 (Table 15). Table 14: Descriptive statistics of lesion area for tooth #9 at baseline, all groups. Tooth #9 Control Lesion Area Baseline Tooth #9 Treat Office Lesion Area Baseline Tooth #9 Treat Paste Lesion Area Baseline Tooth #9 Treat Plus Lesion Area Baseline Tooth #9 Treat Topex Lesion Area Baseline Table 15: Descriptive statistics of lesion area for tooth #10 at baseline, all groups. Tooth #10 Control Lesion Area Baseline Tooth #10 Treat Office Lesion Area Baseline Tooth #10 Treat Paste Lesion Area Baseline Tooth #10 Treat Plus Lesion Area Baseline Tooth #10 Treat Topex Lesion Area Baseline
68 49 Tooth #11 Since the normality assumption was valid (p=0.3837; Shapiro-Wilk test), one-way ANOVA was conducted. Results of one-way ANOVA revealed no significant effect for the type of treatments on lesion area for tooth 11 at baseline (F(4, 25)=1.09; p=0.3822). The data indicated there was no significant difference in lesion area among five groups at baseline for tooth 11 (Table 16). Table 16: Descriptive statistics of lesion area for tooth #11 at baseline, all groups. Tooth #11 Control Lesion Area Baseline Tooth #11 Treat Office Lesion Area Baseline Tooth #11 Treat Paste Lesion Area Baseline Tooth #11 Treat Plus Lesion Area Baseline Tooth #11 Treat Topex Lesion Area Baseline Comparison for Antimere Teeth Antimere Teeth #6 and #11 Since the normality assumption was valid (p=0.0886, Shapiro-Wilk test), one-way ANOVA was conducted. Results of one-way ANOVA revealed no significant effect for the type of treatments on lesion area for antimere teeth 6 and 11 at baseline (F(4,
69 50 55)=1.10; p=0.3647). The data indicated there was no significant difference in lesion area among five groups at baseline for antimere teeth 6 and 11 (Table 17). Table 17: Descriptive statistics of lesion area for antimere teeth #6 and #11 at baseline, all groups. Control Group Lesion Area Baseline Treat Office Group Lesion Area Baseline Treat Paste Group Lesion Area Baseline Treat Plus Group Lesion Area Baseline Treat Topex Group Lesion Area Baseline Antimere Teeth #7 and #10 Since the normality assumption was valid (p=0.2729, Shapiro-Wilk test), one-way ANOVA was conducted. Results of one-way ANOVA revealed no significant effect for the type of treatments on lesion area for antimere teeth 7 and 10 at baseline (F(4, 53)=0.76; p=0.5538). The data indicated there was no significant difference in lesion area among five groups at baseline for antimere teeth 7 and 10 (Table 18). Antimere teeth #8 and #9 Because of the lack of normality (p=0.0164, Shapiro-Wilk test), rank transformation of measured lesion area was conducted. Therefore, one-way ANOVA
70 51 Table 18: Descriptive statistics of lesion area for antimere teeth #7 and #10 at baseline, all groups. Control Group Lesion Area Baseline Treat Office Group Lesion Area Baseline Treat Paste Group Lesion Area Baseline Treat Plus Group Lesion Area Baseline Treat Topex Group Lesion Area Baseline based on ranked data was performed. Note that log-transformation was conducted, but the log transformed data were still not normally distributed (p=0.002, Shapiro-Wilk test). Results of one-way ANOVA on ranked data revealed no significant effect for the type of treatments on lesion area for antimere teeth 8 and 9 at baseline (F(4, 55)=1.16; p=0.3392). The data indicated there was no significant difference in lesion area among five groups at baseline for antimere teeth 8 and 9 (Table 19). Comparison For All Teeth #6 - #11 Because of the lack of normality (p<0.0001, Shapiro-Wilk test), rank transformation of measured lesion area was conducted. Therefore, one-way ANOVA based on ranked data was performed. Note that log-transformation was conducted, but the transformed data were still not normally distributed (p<0.0001, Shapiro-Wilk test). Results of one-way ANOVA on ranked data revealed no significant effect for the type of treatments on lesion area for all of teeth at baseline (F(4, 173)=1.43; p=0.2246).
71 52 The data indicated there was no significant difference in lesion area among five groups at baseline (Table 20). Table 19: Descriptive statistics of lesion area for antimere teeth #8 and #9 at baseline, all groups. Control Group Lesion Area Baseline Treat Office Group Lesion Area Baseline Treat Paste Group Lesion Area Baseline Treat Plus Group Lesion Area Baseline Treat Topex Group Lesion Area Baseline Table 20: Descriptive statistics of lesion area for all teeth #6 - #11 at baseline, all groups. Control Group Lesion Area Baseline Treat Office Group Lesion Area Baseline Treat Paste Group Lesion Area Baseline Treat Plus Group Lesion Area Baseline Treat Topex Group Lesion Area Baseline
72 53 Comparisons of Lesion Area Among the Five Groups at 3-Month Follow-Up Comparison For Each Tooth Tooth #6 Because of the lack of normality (p=0.0168, Shapiro-Wilk test), log transformation of measured lesion area was conducted. After log transformation, the data were normally distributed (p=0.1029, Shapiro-Wilk test). Therefore, one-way ANOVA based on log transformed data was performed. Results of one-way ANOVA revealed no significant effect for the type of treatments on lesion area for tooth 6 at 3-month follow-up (F(4, 25)=0.48; p=0.7534). The data indicated there was no significant difference in lesion area among five groups at 3-month follow-up for tooth 6 (Table 21). Table 21: Descriptive statistics of lesion area for tooth #6 at 3 months, all groups. Tooth #6 Control Lesion Area at 3 months Tooth #6 Treat Office Lesion Area at 3 months Tooth #6 Treat Paste Lesion Area at 3 months Tooth #6 Treat Plus Lesion Area at 3 months Tooth #6 Treat Topex Lesion Area at 3 months
73 54 Tooth #7 Since the normality assumption was valid (p=0.3118, Shapiro-Wilk test), one-way ANOVA was conducted. Results of one-way ANOVA revealed no significant effect for the type of treatments on lesion area for tooth 7 at 3-month follow-up (F(4, 25)=1.84; p=0.1527). The data indicated there was no significant difference in lesion area among five groups at 3-month follow-up for tooth 7(Table 22). Table 22: Descriptive statistics of lesion area for tooth #7 at 3 months, all groups. Tooth #7 Control Lesion Area at 3 months Tooth #7 Treat Office Lesion Area at 3 months Tooth #7 Treat Paste Lesion Area at 3 months Tooth #7 Treat Plus Lesion Area at 3 months Tooth #7 Treat Topex Lesion Area at 3 months Tooth #8 Since the normality assumption was valid (p=0.0918, Shapiro-Wilk test), one-way ANOVA was conducted. Results of one-way ANOVA revealed no significant effect for the type of treatments on lesion area for tooth 8 at 3-month follow-up (F(4, 25)=0.50; p=0.7394). The data indicated there was no significant difference in lesion area among five groups at 3-month follow-up for tooth 8 (Table 23).
74 55 Table 23: Descriptive statistics of lesion area for tooth #8 at 3 months, all groups. Tooth #8 Control Lesion Area at 3 months Tooth #8 Treat Office Lesion Area at 3 months Tooth #8 Treat Paste Lesion Area at 3 months Tooth #8 Treat Plus Lesion Area at 3 months Tooth #8 Treat Topex Lesion Area at 3 months Tooth #9 Since the normality assumption was valid (p=0.1125, Shapiro-Wilk test), one-way ANOVA was conducted. Results of one-way ANOVA revealed no significant effect for the type of treatments on lesion area for tooth 9 at 3-month follow-up (F(4, 25)=1.01; p=0.4212). The data indicated there was no significant difference in lesion area among five groups at 3-month follow-up for tooth 9 (Table 24). Tooth #10 Since the normality assumption was valid (p=0.1377, Shapiro-Wilk test), one-way ANOVA was conducted. Results of one-way ANOVA revealed no significant effect for the type of treatments on lesion area for tooth 10 at 3-month follow-up (F(4, 23)=0.25; p=0.9038). The data indicated there was no significant difference in lesion area among five groups at 3-month follow-up for tooth 10 (Table 25).
75 56 Table 24: Descriptive statistics of lesion area for tooth #9 at 3 months, all groups. Tooth #9 Control Lesion Area at 3 months Tooth #9 Treat Office Lesion Area at 3 months Tooth #9 Treat Paste Lesion Area at 3 months Tooth #9 Treat Plus Lesion Area at 3 months Tooth #9 Treat Topex Lesion Area at 3 months Table 25: Descriptive statistics of lesion area for tooth #10 at 3 months, all groups. Tooth #10 Control Lesion Area at 3 months Tooth #10 Treat Office Lesion Area at 3 months Tooth #10 Treat Paste Lesion Area at 3 months Tooth #10 Treat Plus Lesion Area at 3 months Tooth #10 Treat Topex Lesion Area at 3 months Tooth #11 Since the normality assumption was valid (p=0.0923, Shapiro-Wilk test), one-way ANOVA was conducted. Results of one-way ANOVA revealed no significant effect for the type of treatments on lesion area for tooth 11 at 3-month follow-up (F(4, 25)=0.29;
76 57 p=0.8801). The data indicated there was no significant difference in lesion area among five groups at 3-month follow-up for tooth 11 (Table 26). Table 26: Descriptive statistics of lesion area for tooth #11 at 3 months, all groups. Tooth #11 Control Lesion Area at 3 months Tooth #11 Treat Office Lesion Area at 3 months Tooth #11 Treat Paste Lesion Area at 3 months Tooth #11 Treat Plus Lesion Area at 3 months Tooth #11 Treat Topex Lesion Area at 3 months Comparison For Antimere Teeth Antimere teeth #6 and #11 Because of the lack of normality (p=0.0009, Shapiro-Wilk test), rank transformation of measured lesion area was conducted. Therefore, one-way ANOVA based on ranked data was performed. Note that log-transformation was conducted, but the transformed data were still not normally distributed (p=0.0039; Shapiro-Wilk test). Results of one-way ANOVA on ranked data revealed no significant effect for the type of treatments on lesion area for antimere teeth 6 and 11 at 3-month follow-up (F(4, 55)=0.68; p=0.6102). The data indicated there was no significant difference in lesion area among five groups at 3-month follow-up for antimere teeth 6 and 11 (Table 27).
77 58 Table 27: Descriptive statistics of lesion area for antimere teeth #6 and #11 at 3 months, all groups. Control Group Lesion Area at 3 months Treat Office Group Lesion Area at 3 months Treat Paste Group Lesion Area at 3 months Treat Plus Group Lesion Area at 3 months Treat Topex Group Lesion Area at 3 months Antimere teeth #7 and #10 Since the normality assumption is valid (p=0.1082, Shapiro-Wilk test), one-way ANOVA was conducted. Results of one-way ANOVA revealed no significant effect for the type of treatments on lesion area for antimere teeth 7 and 10 at 3-month follow-up (F(4, 53)=1.11; p=0.3608). The data indicated there was no significant difference in lesion area among five groups at 3-month follow-up for antimere teeth 7 and 10 (Table 28). Antimere teeth #8 and #9 Because of the lack of normality (p=0.0055, Shapiro-Wilk test), rank transformation of measured lesion area was conducted. Therefore, one-way ANOVA based on ranked data was performed. Note that log-transformation was conducted, but the transformed data were still not normally distributed (p=0.0264; Shapiro-Wilk test). Results of one-way ANOVA on ranked data revealed no significant effect for the type of treatments on lesion area for antimere teeth 8 and 9 at 3-month follow-up (F(4,
78 59 55)=0.75; p=0.5621). The data indicated there was no significant difference in lesion area among five groups at 3-month follow-up for antimere teeth 8 and 9 (Table 29). Table 28: Descriptive statistics of lesion area for antimere teeth #7 and #10 at 3 months, all groups. Control Group Lesion Area at 3 months Treat Office Group Lesion Area at 3 months Treat Paste Group Lesion Area at 3 months Treat Plus Group Lesion Area at 3 months Treat Topex Group Lesion Area at 3 months Table 29: Descriptive statistics of lesion area for antimere teeth #8 and #9 at 3 months, all groups. Control Group Lesion Area at 3 months Treat Office Group Lesion Area at 3 months Treat Paste Group Lesion Area at 3 months Treat Plus Group Lesion Area at 3 months Treat Topex Group Lesion Area at 3 months
79 60 Comparison for All Teeth #6 - #11 When comparing all teeth #6 - #11, because of the lack of normality (p<0.0001, Shapiro-Wilk test), rank transformation of measured lesion area was conducted. Therefore, one-way ANOVA based on ranked data was performed. Note that logtransformation was conducted, but the log transformed data were still not normally distributed (p<0.0001; Shapiro-Wilk test). Results of one-way ANOVA on ranked data revealed no significant effect for the type of treatments on lesion area for all teeth #6 - #11 at the 3-month follow-up appointment (F(4, 173)=0.70; p=0.5933). The data indicated there was no significant difference in lesion area among five groups at 3-month follow-up for all teeth #6 - #11 (Table 30). Table 30: Descriptive statistics of lesion area for all teeth #6 - #11 at 3 months, all groups. Control Group Lesion Area at 3 months Treat Office Group Lesion Area at 3 months Treat Paste Group Lesion Area at 3 months Treat Plus Group Lesion Area at 3 months Treat Topex Group Lesion Area at 3 months
80 61 Comparisons of Lesion Area Changes Among the Five Groups at 3-Month Follow-up Comparison For Each Tooth Tooth #6 Because of the lack of normality (p<0.0001, Shapiro-Wilk test), rank transformation was conducted. Therefore, one-way ANOVA based on ranked data was performed. Note that log-transformation was not conducted due to a negative value obtained from measurements (i.e. lesion area measured at baseline was less than the lesion area measured at 3-month follow-up). Results of one-way ANOVA on ranked data revealed no significant effect for the type of treatments on the change lesion area from baseline to 3-months at follow-up for tooth 6 (F(4, 25)=1.15; p=0.3551). The data indicated there was no significant difference in lesion area between baseline and 3-month follow-up among five treatment groups for tooth 6 (Table 31). Table 31: Descriptive statistics of lesion area changes for tooth #6 at 3 months, all groups. Tooth #6 Control Area Change at 3 Months Tooth #6 Treat Office Area Change at 3 Months Tooth #6 Treat Paste Area Change at 3 Months Tooth #6 Treat Plus Area Change at 3 Months Tooth #6 Treat Topex Area Change at 3 Months
81 62 Tooth #7 Because of the lack of normality (p=0.0256, Shapiro-Wilk test), log transformation was conducted. The data were normally distributed after log transformation (p=0.1151; Shapiro-Wilk test). Therefore, one-way ANOVA based on logged data was performed. Results of one-way ANOVA revealed no significant effect for the type of treatments on the change in lesion area from baseline to 3-months at follow-up for tooth 7 (F(4, 25)=1.46; p=0.2437). The data indicated there was no significant difference in lesion area between baseline and 3-month follow-up among five treatment groups for tooth 7 (Table 32). Table 32: Descriptive statistics of lesion area changes for tooth #7 at 3 months, all groups. Tooth #7 Control Area Change at 3 Months Tooth #7 Treat Office Area Change at 3 Months Tooth #7 Treat Paste Area Change at 3 Months Tooth #7 Treat Plus Area Change at 3 Months Tooth #7 Treat Topex Area Change at 3 Months Tooth #8 Because of the lack of normality (p=0.0004, Shapiro-Wilk test), log transformation was conducted. The data were normally distributed after log
82 63 transformation (p=0.6846; Shapiro-Wilk test). Therefore, one-way ANOVA based on logged data was performed. Results of one-way ANOVA revealed no significant effect for the type of treatments on the change in lesion area from baseline to 3-months at follow-up for tooth 8 (F(4, 25)=0.85; p=0.5076). The data indicated there was no significant difference in lesion area between baseline and 3-month follow-up among five treatment groups for tooth 8 (Table 33). Table 33: Descriptive statistics of lesion area changes for tooth #8 at 3 months, all groups. Tooth #8 Control Area Change at 3 Months Tooth #8 Treat Office Area Change at 3 Months Tooth #8 Treat Paste Area Change at 3 Months Tooth #8 Treat Plus Area Change at 3 Months Tooth #8 Treat Topex Area Change at 3 Months Tooth #9 Because of the lack of normality (p<0.0001, Shapiro-Wilk test), log transformation was conducted. The data were normally distributed after log transformation (p=0.7585; Shapiro-Wilk test). Therefore, one-way ANOVA based on logged data was performed.
83 64 Results of one-way ANOVA revealed no significant effect for the type of treatments on the change in lesion area from baseline to 3-months at follow-up for tooth 9 (F(4, 25)=1.34; p=0.2814). The data indicated there was no significant difference in lesion area between baseline and 3-month follow-up among five treatment groups for tooth 9 (Table 34). Table 34: Descriptive statistics of lesion area changes for tooth #9 at 3 months, all groups. Tooth #9 Control Area Change at 3 Months Tooth #9 Treat Office Area Change at 3 Months Tooth #9 Treat Paste Area Change at 3 Months Tooth #9 Treat Plus Area Change at 3 Months Tooth #9 Treat Topex Area Change at 3 Months Tooth #10 Because of the lack of normality (p=0.0058, Shapiro-Wilk test), log transformation was conducted. The data were normally distributed after log transformation (p=0.3130; Shapiro-Wilk test). Therefore, one-way ANOVA based on logged data was performed. Results of one-way ANOVA revealed no significant effect for the type of treatments on the change in lesion area from baseline to 3-months at follow-up for tooth 10 (F(4, 23)=1.46; p=0.2458). The data indicated there was no significant difference in
84 65 lesion area between baseline and 3-month follow-up among five treatment groups for tooth 10 (Table 35). Table 35: Descriptive statistics of lesion area changes for tooth #10 at 3 months, all groups. Tooth #10 Control Area Change at 3 Months Tooth #10 Treat Office Area Change at 3 Months Tooth #10 Treat Paste Area Change at 3 Months Tooth #10 Treat Plus Area Change at 3 Months Tooth #10 Treat Topex Area Change at 3 Months Tooth #11 Because of the lack of normality (p=0.0030, Shapiro-Wilk test), rank transformation was conducted. Therefore, one-way ANOVA based on ranked data was performed. Note that log-transformation was conducted, but the log transformed data were still not normally distributed (p=0.0132; Shapiro-Wilk test). Results of one-way ANOVA on ranked data revealed no significant effect for the type of treatments on the change in lesion area from baseline to 3-months at follow-up for tooth 11 (F(4, 25)=1.85; p=0.1511). The data indicated there was no significant difference in lesion area between baseline and 3-month follow-up among five treatment groups for tooth 11 (Table 36).
85 66 Table 36: Descriptive statistics of lesion area changes for tooth #11 at 3 months, all groups. Tooth #11 Control Area Change at 3 Months Tooth #11 Treat Office Area Change at 3 Months Tooth #11 Treat Paste Area Change at 3 Months Tooth #11 Treat Plus Area Change at 3 Months Tooth #11 Treat Topex Area Change at 3 Months Comparison For Antimere Teeth Antimere Teeth #6 and #11 Because of the lack of normality (p<0.0001, Shapiro-Wilk test), log transformation was conducted. The data were normally distributed after log transformation (p=0.5832; Shapiro-Wilk test). Therefore, one-way ANOVA based on logged data was performed. Results of one-way ANOVA based on ranked data revealed no significant effect for the type of treatments on the change in lesion area from baseline to 3-months at follow-up for antimere teeth 6 and 11 (F(4, 54)=2.21; p=0.0798). The data indicated there was no significant difference in lesion area between baseline and 3-month followup among five treatment groups for antimere teeth 6 and 11 (Table 37).
86 67 Table 37: Descriptive statistics of lesion area changes for antimere teeth #6 and #11 at 3 months, all groups. Control Group Area Change at 3 months Treat Office Group Area Change at 3 months Treat Paste Group Area Change at 3 months Treat Plus Group Area Change at 3 months Treat Topex Group Area Change at 3 months Antimere Teeth #7 and #10 Because of the lack of normality (p<0.0001, Shapiro-Wilk test), rank transformation was conducted. Note that log-transformation was conducted, but the log transformed data were still not normally distributed (p=0.0066; Shapiro-Wilk test). Results of one-way ANOVA on ranked data revealed a significant effect for the type of treatments on the change in lesion area from baseline to 3-months for antimere teeth 7 and 10 (F(4, 53)=2.72; p=0.0389). The post-hoc Bonferrorni test indicated that mean difference in lesion area from baseline to 3-month follow-up for Control and Treat Plus were significantly lower than those observed in Treat Office and Treat Topex. No significant differences were found among Treat Office, Treat Topex and Treat Paste as well as among Treat Paste, Control, and Treat Plus. Table 38 provides descriptive statistics and Table 39 provides detailed results from the post-hoc Bonferroni test. Antimere Teeth #8 and #9 Because of the lack of normality (p<0.0001, Shapiro-Wilk test), log transformation was conducted. The data were normally distributed after log
87 68 Table 38: Descriptive statistics of lesion area changes for antimere teeth #7 and #10 at 3 months, all groups. Control Group Area Change at 3 months Treat Office Group Area Change at 3 months Treat Paste Group Area Change at 3 months Treat Plus Group Area Change at 3 months Treat Topex Group Area Change at 3 months Table 39: Mean difference in lesion area changes between baseline and 3-month follow-up. Experimental groups N Mean difference in lesion area changes Group (mean ranking scores) comparisons** Treat Office (39.33) A Treat Topex (36.09) A Treat Paste (26.33) A B Control (23.17) B Treat Plus (22.55) B Note: ** = Means with the same letter are not significantly different using post-hoc Bonferroni test (P>0.05). transformation (p=0.9995; Shapiro-Wilk test). Therefore, one-way ANOVA based on logged data was performed. Results of one-way ANOVA revealed no significant effect for the type of treatments on the change in lesion area from baseline to 3-months at follow-up for
88 69 antimere teeth 8 and 9 (F(4, 55)=0.83; p=0.5106). The data indicated there was no significant difference in lesion area between baseline and 3-month follow-up among five treatment groups for antimere teeth 8 and 9 (Table 40). Table 40: Descriptive statistics of lesion area changes for antimere teeth #8 and #9 at 3 months, all groups. Control Group Area Change at 3 months Treat Office Group Area Change at 3 months Treat Paste Group Area Change at 3 months Treat Plus Group Area Change at 3 months Treat Topex Group Area Change at 3 months Comparison For All Teeth #6 - #11 Because of the lack of normality (p<0.0001, Shapiro-Wilk test), rank transformation was conducted. Therefore, one-way ANOVA based on ranked data was performed. Note that log-transformation was conducted, but the log transformed data were still not normally distributed (p=0.0036; Shapiro-Wilk test). Results of one-way ANOVA on ranked data revealed a significant effect for the type of treatments on the change in lesion area from baseline to 3-months at follow-up for all teeth (F(4, 173)=4.87; p=0.0010). The post-hoc Bonferrorni test indicated that mean difference in lesion area between baseline and 3-month follow-up for Treat Office and Treat Topex were significantly greater than those observed in Treat Plus, Control and
89 70 Treat Paste. No significant differences were found among Treat Office and Treat Topex as well as among Treat Plus, Control, and Treat Paste. Table 41 provides descriptive statistics while Table 42 provides detailed results from the post-hoc Bonferroni test. Table 41: Descriptive statistics of lesion area changes for all teeth #6 - #11 at 3 months, all groups. Control Group Area Change at 3 months Treat Office Group Area Change at 3 months Treat Paste Group Area Change at 3 months Treat Plus Group Area Change at 3 months Treat Topex Group Area Change at 3 months Table 42: Mean difference in lesion area changes between baseline and 3-month follow-up. Experimental groups N Mean difference in lesion area between baseline and 3-month follow-up (mean ranking scores) Treat Office (109.47) A Treat Topex (108.89) A Treat Plus (81.97) B Control (75.39) B Treat Paste (72.11) B Group comparisons** Note: ** = Means with the same letter are not significantly different using post-hoc Bonferroni test (P>0.05).
90 71 Comparisons of Change in Lesion Area from Baseline to 3-Month Follow-up Within Each Treatment Group Within Control Group For Each Tooth The data showed that there was a significant difference in lesion area between baseline and 3-month follow-up for tooth 6, tooth 7, tooth 9, tooth 10 and tooth 11 within control group (p<0.05 for each instance). The mean lesion area at baseline was significantly greater than that observed at 3-month follow-up for each of those cases, and mean difference in lesion area between baseline and 3-month follow-up are summarized in Table 43. Moreover, the data showed there was a marginally significant difference in lesion area between baseline and 3-month follow-up for tooth 8 (p=0.0515). For Antimere Teeth There were significant differences in lesion area between baseline and 3-month follow-up for antimere teeth 6 and 11, antimere teeth 7 and 10, and antimere teeth 8 and 9 within control group (p<0.05 for each instance). The mean lesion area at baseline was significantly greater than that observed at 3-month follow-up for each of those cases, and mean difference in lesion area between baseline and 3-month follow-up are summarized in Table 44. For All Teeth The data showed that there was a significant difference in lesion area between baseline and 3-month follow-up for all teeth (p<0.0001). The mean lesion area at baseline was significantly greater than that observed at 3-month follow-up, and mean difference between baseline and 3-month follow-up are summarized in Table 45.
91 72 Table 43: Descriptive statistics of lesion area changes for each tooth #6 - #11 at 3 months, Control group. Tooth #6 Lesion Area Baseline Lesion Area at 3 months Area Change at 3 months Tooth #7 Lesion Area Baseline Lesion Area at 3 months Area Change at 3 months Tooth #8 Lesion Area Baseline Lesion Area at 3 months Area Change at 3 months Tooth #9 Lesion Area Baseline Lesion Area at 3 months Area Change at 3 months Tooth #10 Lesion Area Baseline Lesion Area at 3 months Area Change at 3 months Tooth #11 Lesion Area Baseline Lesion Area at 3 months Area Change at 3 months Within Treat Office Group For Each Tooth The data showed that there was a significant difference in lesion area between baseline and 3-month follow-up for tooth 6, tooth 7, tooth 8, tooth 9, tooth 10 and tooth 11 within Treat Office group (p<0.05 for each instance). The mean lesion area at baseline
92 73 was significantly greater than that observed at 3-month follow-up for each of those cases, and mean difference in lesion area between baseline and 3-month follow-up are summarized in Table 46. Table 44: Descriptive statistics of lesion area changes for antimere teeth at 3 months, Control group. Teeth #6 and #11 Lesion Area Baseline Lesion Area at 3 months Area Change at 3 months Teeth #7 and #10 Lesion Area Baseline Lesion Area at 3 months Area Change at 3 months Teeth #8 and #9 Lesion Area Baseline Lesion Area at 3 months Area Change at 3 months Table 45: Descriptive statistics of lesion area changes for all teeth #6 - #11 at 3 months, Control group. Teeth #6 - #11 Lesion Area Baseline Lesion Area at 3 months Area Change at 3 months
93 74 Table 46: Descriptive statistics of lesion area changes for each tooth #6 - #11 at 3 months, Treat Office group. Tooth #6 Lesion Area Baseline Lesion Area at 3 months Area Change at 3 months Tooth #7 Lesion Area Baseline Lesion Area at 3 months Area Change at 3 months Tooth #8 Lesion Area Baseline Lesion Area at 3 months Area Change at 3 months Tooth #9 Lesion Area Baseline Lesion Area at 3 months Area Change at 3 months Tooth #10 Lesion Area Baseline Lesion Area at 3 months Area Change at 3 months Tooth #11 Lesion Area Baseline Lesion Area at 3 months Area Change at 3 months For Antimere Teeth There were significant differences in lesion area between baseline and 3-month follow-up for antimere teeth 6 and 11, antimere teeth 7 and 10, and antimere teeth 8 and 9 within Treat Office group (p<0.05 for each instance). The mean lesion area at baseline was significantly greater than that observed at 3-month follow-up for each of those cases,
94 75 and mean difference in lesion area between baseline and 3-month follow-up are summarized in Table 47. For All Teeth The data showed that there was a significant difference in lesion area between baseline and 3-month follow-up for all teeth (p<0.0001). The mean lesion area at baseline was significantly greater than that observed at 3-month follow-up, and mean difference between baseline and 3-month follow-up are summarized in Table 48. Within Treat Paste Group For Each Tooth The data showed that there was a significant difference in lesion area between baseline and 3-month follow-up for tooth 6, tooth 8, tooth 9, tooth 10, and tooth 11 within Treat Paste group (p<0.05 for each instance). The mean lesion area at baseline was significantly greater than that observed at 3-month follow-up for each of those cases, and mean difference in lesion area between baseline and 3-month follow-up are summarized in Table 49. Moreover, there were marginally significant difference was found between baseline and 3-month follow-up for tooth 7 (p=0.0765). For Antimere Teeth There were significant differences in lesion area between baseline and 3-month follow-up for antimere teeth 6 and 11, antimere teeth 7 and 10, and antimere teeth 8 and 9 within Treat Paste group (p<0.05 for each instance). The mean lesion area at baseline was significantly greater than that observed at 3-month follow-up for each of those cases, and mean difference in lesion area between baseline and 3-month follow-up are summarized in Table 50.
95 76 For All Teeth The data showed that there was a significant difference in lesion area between baseline and 3-month follow-up for all teeth (p<0.0001). The mean lesion area at baseline was significantly greater than that observed at 3-month follow-up, and mean difference in lesion area between baseline and 3-month follow-up are summarized in Table 51. Table 47: Descriptive statistics of lesion area changes for antimere teeth at 3 months, Treat Office group. Teeth #6 and #11 Lesion Area Baseline Lesion Area at 3 months Area Change at 3 months Teeth #7 and #10 Lesion Area Baseline Lesion Area at 3 months Area Change at 3 months Teeth #8 and #9 Lesion Area Baseline Lesion Area at 3 months Area Change at 3 months Table 48: Descriptive statistics of lesion area changes for all teeth #6 and #11at 3 months, Treat Office group. Teeth #6 - #11 Lesion Area Baseline Lesion Area at 3 months Area Change at 3 months
96 77 Table 49: Descriptive statistics of lesion area changes for all teeth #6 and #11at 3 months, Treat Paste group. Tooth #6 Lesion Area Baseline Lesion Area at 3 months Area Change at 3 months Tooth #7 Lesion Area Baseline Lesion Area at 3 months Area Change at 3 months Tooth #8 Lesion Area Baseline Lesion Area at 3 months Area Change at 3 months Tooth #9 Lesion Area Baseline Lesion Area at 3 months Area Change at 3 months Tooth #10 Lesion Area Baseline Lesion Area at 3 months Area Change at 3 months Tooth #11 Lesion Area Baseline Lesion Area at 3 months Area Change at 3 months Within Treat Plus Group For Each Tooth The data showed that there was a significant difference in lesion area between baseline and 3-month follow-up for tooth 7, tooth 8, tooth 9, and tooth 11 within Treat Plus group (p<0.05 for each instance). The mean lesion area at baseline was significantly
97 78 greater than that observed at 3-month follow-up for each of those cases, and mean differences in lesion area between baseline and 3-month follow-up are summarized in Table 52. Moreover, there were marginally significant differences were found between baseline and 3-month follow-up for tooth 6 (p=0.0625), and tooth 10 (p=0.0757). Table 50: Descriptive statistics of lesion area changes for all teeth #6 and #11 at 3 months, Treat Paste group. Teeth #6 and #11 Lesion Area Baseline Lesion Area at 3 months Area Change at 3 months Teeth #7 and #10 Lesion Area Baseline Lesion Area at 3 months Area Change at 3 months Teeth #8 and #9 Lesion Area Baseline Lesion Area at 3 months Area Change at 3 months Table 51: Descriptive statistics of lesion area changes for all teeth #6 and #11at 3 months, Treat Paste group. Teeth #6 - #11 Lesion Area Baseline Lesion Area at 3 months Area Change at 3 months
98 79 Table 52: Descriptive statistics of lesion area changes for each tooth #6 - #11 at 3 months, Treat Plus group. Tooth #6 Lesion Area Baseline Lesion Area at 3 months Area Change at 3 months Tooth #7 Lesion Area Baseline Lesion Area at 3 months Area Change at 3 months Tooth #8 Lesion Area Baseline Lesion Area at 3 months Area Change at 3 months Tooth #9 Lesion Area Baseline Lesion Area at 3 months Area Change at 3 months Tooth #10 Lesion Area Baseline Lesion Area at 3 months Area Change at 3 months Tooth #11 Lesion Area Baseline Lesion Area at 3 months Area Change at 3 months For Antimere Teeth There were significant differences in lesion area between baseline and 3-month follow-up for antimere teeth 6 and 11, antimere teeth 7 and 10, and antimere teeth 8 and 9 within Treat Plus group (p<0.05 for each instance). The mean lesion area at baseline was significantly greater than that observed at 3-month follow-up for each of those cases, and
99 80 mean difference in lesion area between baseline and 3-month follow-up are summarized in Table 53. For All Teeth The data showed that there was a significant difference in lesion area between baseline and 3-month follow-up for all teeth (p<0.0001). The mean lesion area at baseline was significantly greater than that observed at 3-month follow-up, and mean difference between baseline and 3-month follow-up are summarized in Table 54. Within Treat Topex Group For Each Tooth The data showed that there was a significant difference in lesion area between baseline and 3-month follow-up for tooth 6, tooth 7, tooth 8, tooth 9, and tooth 11 within Treat Topex group (p<0.05 for each instance). The mean lesion area at baseline was significantly greater than that observed at 3-month follow-up for each of those cases, and mean changes in lesion area from baseline to 3-month follow-up are summarized in Table 55. However, no significant difference was found between baseline and 3-month followup for tooth 10 (p=0.1085). For Antimere Teeth There were significant differences in lesion area between baseline and 3-month follow-up for antimere teeth 6 and 11, antimere teeth 7 and 10, and antimere teeth 8 and 9 within Treat Topex group (p<0.05 for each instance). The mean lesion area at baseline was significantly greater than that observed at 3-month follow-up for each of those cases, and mean difference in lesion area between baseline and 3-month follow-up are summarized in Table 56.
100 81 Table 53: Descriptive statistics of lesion area changes for antimere teeth at 3 months, Treat Plus group. Teeth # 6 and #11 Lesion Area Baseline Lesion Area at 3 months Area Change at 3 months Teeth #7 and #10 Lesion Area Baseline Lesion Area at 3 months Area Change at 3 months Teeth #8 and #9 Lesion Area Baseline Lesion Area at 3 months Area Change at 3 months Table 54: Descriptive statistics of lesion area changes for all teeth #6 - #11at 3 months, Treat Plus group. Teeth #6 - #11 Lesion Area Baseline Lesion Area at 3 months Area Change at 3 months For All Teeth The data showed that there was a significant difference in lesion area between baseline and 3-month follow-up for all teeth (p<0.0001). The mean lesion area at baseline was significantly greater than that observed at 3-month follow-up, and mean difference in lesion area between baseline and 3-month follow-up are summarized in Table 57.
101 82 Table 55: Descriptive statistics of lesion area changes for each tooth #6 - #11 at 3 months, Treat Topex group. Tooth #6 Lesion Area Baseline Lesion Area at 3 months Area Change at 3 months Tooth #7 Lesion Area Baseline Lesion Area at 3 months Area Change at 3 months Tooth #8 Lesion Area Baseline Lesion Area at 3 months Area Change at 3 months Tooth #9 Lesion Area Baseline Lesion Area at 3 months Area Change at 3 months Tooth #10 Lesion Area Baseline Lesion Area at 3 months Area Change at 3 months Tooth #11 Lesion Area Baseline Lesion Area at 3 months Area Change at 3 months Statistical Analysis of Fluorescence Changes in QLF Images A total of 30 subjects were selected and randomly divided into 5 groups (n=6/per group). Each subjects had 6 teeth measured, except for two subjects who were missing one lateral incisor each, and had 5 teeth examined. Therefore, a total of 178 teeth were examined. Of the 178 teeth, two measurements (baseline vs. 3-month) were obtained
102 83 from each tooth of the same patient, therefore, a total of 360 measurements were included in the study. Table 56: Descriptive statistics of lesion area changes for antimere teeth at 3 months, Treat Topex group. Teeth # 6 and #11 Lesion Area Baseline Lesion Area at 3 months Area Change at 3 months Teeth #7 and #10 Lesion Area Baseline Lesion Area at 3 months Area Change at 3 months Teeth #8 and #9 Lesion Area Baseline Lesion Area at 3 months Area Change at 3 months Comparisons of Fluorescence Change Values Among the Five Groups at Baseline For Each Tooth Tooth #6 Because of the lack of normality (p=0.0335, Shapiro-Wilk test), rank transformation of measured fluorescence change values was conducted. Therefore, oneway ANOVA based on ranked data was performed. Note that log-transformation was not conducted due to the negative values obtained from measurements.
103 84 Table 57: Descriptive statistics of lesion area changes for all teeth #6 - #11 at 3 months, Treat Topex group. Lesion Area Baseline Lesion Area at 3 months Area Change at 3 months The results of one-way ANOVA on ranked data for tooth #6 revealed no significant effect for the type of treatments on fluorescence change values for tooth #6 at baseline (F(4, 25)=1.89; p=0.1435). Therefore, the data indicated that there was no significant difference in fluorescence change values among the five groups for tooth #6 (Table 58). Table 58: Descriptive statistics of fluorescence changes for tooth #6 at baseline, all groups. Tooth # 6 Control Fluorescence Baseline Tooth #6 Treat Office Fluorescence Baseline Tooth #6 Treat Paste Fluorescence Baseline Tooth #6 Treat Plus Fluorescence Baseline Tooth #6 Treat Topex Fluorescence Baseline
104 85 Tooth #7 Since the normality assumption is valid (p=0.0903, Shapiro-Wilk test), one-way ANOVA was conducted. Results of one-way ANOVA revealed no significant effect for the type of treatments on fluorescence change values for tooth 7 at baseline (F(4, 25)=0.61; p=0.6626). The data indicated there was no significant difference in fluorescence change values among five groups (Table 59). Table 59: Descriptive statistics of fluorescence changes for tooth #7 at baseline, all groups. Tooth #7 Control Fluorescence Baseline Tooth #7 Treat Office Fluorescence Baseline Tooth #7 Treat Paste Fluorescence Baseline Tooth #7 Treat Plus Fluorescence Baseline Tooth #7 Treat Topex Fluorescence Baseline Tooth #8 Because of the lack of normality (p=0.0007, Shapiro-Wilk test), rank transformation of measured fluorescence change values was conducted. Therefore, oneway ANOVA based on ranked data was performed. Note that log-transformation was not conducted due to the negative values obtained from measurements.
105 86 Results of one-way ANOVA on ranked data revealed no significant effect for the type of treatments on fluorescence change values for tooth 8 at baseline (F(4, 25)=0.66; p=0.6286). The data indicated there was no significant difference in fluorescence change values among five groups (Table 60). Table 60: Descriptive statistics of fluorescence changes for tooth #8 at baseline, all groups. Tooth #8 Control Fluorescence Baseline Tooth #8 Treat Office Fluorescence Baseline Tooth #8 Treat Paste Fluorescence Baseline Tooth #8 Treat Plus Fluorescence Baseline Tooth #8 Treat Topex Fluorescence Baseline Tooth #9 Because of the lack of normality (p<0.0001, Shapiro-Wilk test), rank transformation of measured fluorescence change values was conducted. Therefore, oneway ANOVA based on ranked data was performed. Note that log-transformation was not conducted due to the negative values obtained from measurements. Results of one-way ANOVA on ranked data revealed a significant effect for the type of treatments on fluorescence change values for tooth 9 at baseline (F(4, 25)=4.73; p=0.0056). The post-hoc Bonferrorni test indicated that mean fluorescence change was significantly greater (in negative values) for Treat Paste than those observed for Treat
106 87 Office and Control. No significant differences were found among Treat Office, Control, Treat Topex and Treat Plus, and among Treat Topex, Treat Plus and Treat Paste. Table 61 provides descriptive statistics, and Table 62 provides detailed results from the posthoc Bonferroni test. Table 61: Descriptive statistics of fluorescence changes for tooth #9 at baseline, all groups. Tooth #9 Control Fluorescence Baseline Tooth #9 Treat Office Fluorescence Baseline Tooth #9 Treat Paste Fluorescence Baseline Tooth #9 Treat Plus Fluorescence Baseline Tooth #9 Treat Topex Fluorescence Baseline Table 62: Mean fluorescence change values of tooth 9 for five experimental groups Experimental Groups N Mean F values Group (mean ranking scores) Comparisons** Treat Office (21.17) A Control (20.00) A Treat Topex (17.67) A B Treat Plus (13.08) A B Treat Paste (5.58) B Note: ** = Means with the same letter are not significantly different using post-hoc Bonferroni test (P>0.05).
107 88 Tooth #10 Because of the lack of normality (p<0.0001, Shapiro-Wilk test), rank transformation of measured fluorescence change values was conducted. Therefore, oneway ANOVA based on ranked data was performed. Note that log-transformation was not conducted due to the negative values obtained from measurements. Results of one-way ANOVA on ranked data revealed no significant effect for the type of treatments on fluorescence change values for tooth 10 at baseline (F(4, 23)=0.72; p=0.5851). The data indicated there was no significant difference in fluorescence change values among five groups (Table 63). Table 63: Descriptive statistics of fluorescence changes for tooth #10 at baseline, all groups. Tooth #10 Control Fluorescence Baseline Tooth #10 Treat Office Fluorescence Baseline Tooth #10 Treat Paste Fluorescence Baseline Tooth #10 Treat Plus Fluorescence Baseline Tooth #10 Treat Topex Fluorescence Baseline Tooth #11 Because of the lack of normality (p=0.0409, Shapiro-Wilk test), rank transformation of measured fluorescence change values was conducted. Therefore, one-
108 89 way ANOVA based on ranked data was performed. Note that log-transformation was not conducted due to the negative values obtained from measurements. Results of one-way ANOVA on ranked data revealed no significant effect for the type of treatments on fluorescence change values for tooth 11 at baseline (F(4, 25)=1.05; p=0.4021). The data indicated there was no significant difference in fluorescence change values among five groups (Table 64). Table 64: Descriptive statistics of fluorescence changes for tooth #11 at baseline, all groups. Tooth #11 Control Fluorescence Baseline Tooth #11 Treat Office Fluorescence Baseline Tooth #11 Treat Paste Fluorescence Baseline Tooth #11 Treat Plus Fluorescence Baseline Tooth #11 Treat Topex Fluorescence Baseline For Antimere Teeth For Antimere Teeth #6 and #11 Because of the lack of normality (p=0.0001, Shapiro-Wilk test), rank transformation of measured fluorescence change values was conducted. Therefore, oneway ANOVA based on ranked data was performed. Note that log-transformation was not conducted due to the negative values obtained from measurements.
109 90 Results of one-way ANOVA on ranked data revealed no significant effect for the type of treatments on fluorescence change values for antimere teeth 6 and 11 at baseline (F(4, 55)=2.38; p=0.0628). The data indicated there was no significant difference in fluorescence change values among for antimere teeth #6 and #11 (Table 65). Table 65: Descriptive statistics of fluorescence changes for antimere teeth #6 and #11 at baseline, all groups. Control Group Fluorescence Baseline Treat Office Group Fluorescence Baseline Treat Paste Group Fluorescence Baseline Treat Plus Group Fluorescence Baseline Treat Topex Group Fluorescence Baseline For Antimere Teeth #7 and #10 Because of the lack of normality (p<0.0001, Shapiro-Wilk test), rank transformation of measured fluorescence change values was conducted. Therefore, oneway ANOVA based on ranked data was performed. Note that log-transformation was not conducted due to the negative values obtained from measurements. Results of one-way ANOVA on ranked data revealed no significant effect for the type of treatments on fluorescence change values for antimere teeth 7 and 10 at baseline (F(4, 53)=0.36; p=0.8347). The data indicated there was no significant difference in fluorescence change values among for antimere teeth #7 and #10 (Table 66).
110 91 Table 66: Descriptive statistics of fluorescence changes for antimere teeth #7 and #10 at baseline, all groups. Group=Control Fluorescence Baseline Treat Office Group Fluorescence Baseline Treat Paste Group Fluorescence Baseline Treat Plus Group Fluorescence Baseline Treat Topex Group Fluorescence Baseline For Antimere Teeth #8 and #9 Because of the lack of normality (p<0.0001, Shapiro-Wilk test), rank transformation of measured fluorescence change values was conducted. Therefore, oneway ANOVA based on ranked data was performed. Note that log-transformation was not conducted due to the negative values obtained from measurements. Results of one-way ANOVA on ranked data revealed a significant effect for the type of treatments on fluorescence change values for antimere teeth 8 and 9 at baseline (F(4, 55)=3.32; p=0.0167). The post-hoc Bonferrorni test indicated that mean fluorescence change was significantly greater in negative for Treat Paste than those observed for Treat Office and Control. No significant differences were found among Treat Office, Control, Treat Topex and Treat Plus, and among Treat Topex, Treat Plus and Treat Paste. Table 67 provides descriptive statistics and Table 68 provides detailed results from the post-hoc Bonferroni test.
111 92 Table 67: Descriptive statistics of fluorescence changes for antimere teeth #8 and #9 at baseline, all groups. Control Group Fluorescence Baseline Treat Office Group Fluorescence Baseline Treat Paste Group Fluorescence Baseline Treat Plus Group Fluorescence Baseline Treat Topex Group Fluorescence Baseline Table 68: Mean fluorescence change values of antimere teeth #8 and #9 for five experimental groups Experimental Groups N Mean F values Group (mean ranking scores) Comparisons** Treat Office (39.50) A Control (38.00) A Treat Topex (29.67) A B Treat Plus (26.58) A B Treat Paste (18.75) B Note: ** = Means with the same letter are not significantly different using post-hoc Bonferroni test (P>0.05). For All Teeth #6 - #11 Because of the lack of normality (p<0.0001, Shapiro-Wilk test), rank transformation of measured fluorescence change values was conducted. Therefore, one-
112 93 way ANOVA based on ranked data was performed. Note that log-transformation was not conducted due to the negative values obtained from measurements. Results of one-way ANOVA on ranked data revealed a significant effect for the type of treatments on fluorescence change values for all teeth at baseline (F(4, 173)=3.45; p=0.0097). The post-hoc Bonferrorni test indicated that mean fluorescence change was significantly greater in negative for Treat Paste than that observed for Treat Office. No significant differences were found among Treat Office, Treat Topex, Control and Treat Plus, and among Treat Topex, Control, Treat Plus and Treat Paste. Table 69 provides descriptive statistics, and Table 70 provides detailed results from the post-hoc Bonferroni test. Comparisons of Fluorescence Change Values Among the Five Groups at 3-Month Follow-Up For each tooth Tooth #6 Since the normality assumption is valid (p=0.5308, Shapiro-Wilk test), one-way ANOVA was conducted. Results of one-way ANOVA revealed no significant effect for the type of treatments on fluorescence change values for tooth 6 (F(4, 25)=1.10; p=0.3766). The data indicated there was no significant difference in fluorescence change values among five groups for tooth 6 at 3-month follow-up (Table 71). Tooth #7 Because of the lack of normality (p=0.0442, Shapiro-Wilk test), rank transformation of measured fluorescence change values was conducted. Therefore, one-
113 94 Table 69: Descriptive statistics of fluorescence changes for all teeth #6 - #11 at baseline, all groups. Control Group Fluorescence Baseline Treat Office Group Fluorescence Baseline Treat Paste Group Fluorescence Baseline Treat Plus Group Fluorescence Baseline Treat Topex Group Fluorescence Baseline Table 70: Mean fluorescence change values of all teeth for five experimental groups Experimental Groups N Mean F values Group (mean ranking scores) Comparisons** Treat Office (107.08) A Treat Topex (99.49) A B Control (88.25) A B Treat Plus (86.80) A B Treat Paste (66.08) B Note: ** = means with the same letter are not significantly different using post-hoc Bonferroni test (P>0.05). way ANOVA based on ranked data was performed. Note that log-transformation was not conducted due to the negative values obtained from measurements. Results of one-way ANOVA on ranked data revealed no significant effect for the type of treatments on fluorescence change values for tooth 7 (F(4, 25)=0.59; p=0.6732).
114 95 Table 71: Descriptive statistics of fluorescence changes for tooth #6 at 3 months, all groups. Tooth # 6 Control Fluorescence at 3 months Tooth #6 Treat Office Fluorescence at 3 months Tooth #6 Treat Paste Fluorescence at 3 months Tooth #6 Treat Plus Fluorescence at 3 months Tooth #6 Treat Topex Fluorescence at 3 months Table 72: Descriptive statistics of fluorescence changes for tooth #7 at 3 months, all groups. Tooth #7 Control Fluorescence at 3 months Tooth #7 Treat Office Fluorescence at 3 months Tooth #7 Treat Paste Fluorescence at 3 months Tooth #7 Treat Plus Fluorescence at 3 months Tooth #7 Treat Topex Fluorescence at 3 months The data indicated there was no significant difference in fluorescence change values among five groups for tooth 7 at 3-month follow-up (Table 72).
115 96 Tooth #8 Because of the lack of normality (p=0.0022, Shapiro-Wilk test), rank transformation of measured fluorescence change values was conducted. Therefore, oneway ANOVA based on ranked data was performed. Note that log-transformation was not conducted due to the negative values obtained from measurements. Results of one-way ANOVA on ranked data revealed no significant effect for the type of treatments on fluorescence change values for tooth 8 (F(4, 25)=0.76; p=0.5642). The data indicated there was no significant difference in fluorescence change values among five groups for tooth 8 at 3-month follow-up (Table 73). Table 73: Descriptive statistics of fluorescence changes for tooth #8 at 3 months, all groups. Tooth #8 Control Fluorescence at 3 months Tooth #8 Treat Office Fluorescence at 3 months Tooth #8 Treat Paste Fluorescence at 3 months Tooth #8 Treat Plus Fluorescence at 3 months Tooth #8 Treat Topex Fluorescence at 3 months Tooth #9 Because of the lack of normality (p=0.0007, Shapiro-Wilk test), rank transformation of measured fluorescence change values was conducted. Therefore, one-
116 97 way ANOVA based on ranked data was performed. Note that log-transformation was not conducted due to the negative values obtained from measurements. Results of one-way ANOVA on ranked data revealed no significant effect for the type of treatments on fluorescence change values for tooth 9 (F(4, 25)=1.92; p=0.1378). The data indicated there was no significant difference in fluorescence change values among five groups for tooth 9 at 3-month follow-up (Table 74). Table 74: Descriptive statistics of fluorescence changes for tooth #9 at 3 months, all groups. Variable N Mean Std Dev Minimum Maximum Median Tooth #9 Control Fluorescence at 3 months Tooth #9 Treat Office Fluorescence at 3 months Tooth #9 Treat Paste Fluorescence at 3 months Tooth #9 Treat Plus Fluorescence at 3 months Tooth #9 Treat Topex Fluorescence at 3 months Tooth #10 Since the normality assumption is valid (p=0.7891, Shapiro-Wilk test), one-way ANOVA was conducted. Results of one-way ANOVA revealed no significant effect for the type of treatments on fluorescence change values for tooth 10 (F(4, 23)=1.01; p=0.4207). The data indicated there was no significant difference in fluorescence change values among five groups for tooth 10 at 3-month follow-up (Table 75).
117 98 Tooth #11 Since the normality assumption is valid (p=0.3283, Shapiro-Wilk test), one-way ANOVA was conducted. Results of one-way ANOVA revealed no significant effect for the type of treatments on fluorescence change values for tooth 11 (F(4, 25)=1.38; p=0.2707). The data indicated there was no significant difference in fluorescence change values among five groups for tooth 11 at 3-month follow-up (Table 76). Table 75: Descriptive statistics of fluorescence changes for tooth #10 at 3 months, all groups. Variable N Mean Std Dev Minimum Maximum Median Tooth #10 Control Fluorescence at 3 months Tooth #10 Treat Office Fluorescence at 3 months Tooth #10 Treat Paste Fluorescence at 3 months Tooth #10 Treat Plus Fluorescence at 3 months Tooth #10 Treat Topex Fluorescence at 3 months For Antimere Teeth Antimere Teeth #6 and #11 Since the normality assumption is valid (p=0.0523, Shapiro-Wilk test), one-way ANOVA was conducted. Results of one-way ANOVA revealed no significant effect for the type of treatments on fluorescence change values for antimere teeth #6 and #11 (F(4, 55)=2.21; p=0.0802). The data indicated there was no significant difference in
118 99 fluorescence change values among five groups for antimere teeth #6 and #11 at 3-month follow-up (Table 77). Table 76: Descriptive statistics of fluorescence changes for tooth #10 at 3 months, all groups. Variable N Mean Std Dev Minimum Maximum Median Tooth #11 Control Fluorescence at 3 months Tooth #11 Treat Office Fluorescence at 3 months Tooth #11 Treat Paste Fluorescence at 3 months Tooth #11 Treat Plus Fluorescence at 3 months Tooth #11 Treat Topex Fluorescence at 3 months Table 77: Descriptive statistics of fluorescence changes for antimere teeth #6 and #11 at 3 months, all groups. Control Group Fluorescence at 3 months Treat Office Group Fluorescence at 3 months Treat Paste Group Fluorescence at 3 months Treat Plus Group Fluorescence at 3 months Treat Topex Group Fluorescence at 3 months
119 100 Antimere teeth #7 and #10 Because of the lack of normality (p=0.0084, Shapiro-Wilk test), rank transformation of measured fluorescence change values was conducted. Therefore, oneway ANOVA based on ranked data was performed. Note that log-transformation was not conducted due to the negative values obtained from measurements. Results of one-way ANOVA on ranked data revealed no significant effect for the type of treatments on fluorescence change values for antimere teeth 7 and 10 (F(4, 53)=0.38; p=0.8230). The data indicated there was no significant difference in fluorescence change values among five groups for antimere teeth #7 and #10 at 3-month follow-up (Table 78). Table 78: Descriptive statistics of fluorescence changes for antimere teeth #7 and #10 at 3 months, all groups. Group=Control Fluorescence at 3 months Treat Office Group Fluorescence at 3 months Treat Paste Group Fluorescence at 3 months Treat Plus Group Fluorescence at 3 months Treat Topex Group Fluorescence at 3 months Antimere teeth #8 and #9 Because of the lack of normality (p<0.0001, Shapiro-Wilk test), rank transformation of measured fluorescence change values was conducted. Therefore, one-
120 101 way ANOVA based on ranked data was performed. Note that log-transformation was not conducted due to the negative values obtained from measurements. Results of one-way ANOVA on ranked data revealed no significant effect for the type of treatments on fluorescence change values for antimere teeth 8 and 9 (F(4, 55)=2.19; p=0.0817). The data indicated there was no significant difference in fluorescence change values among five groups for antimere teeth #8 and #9 at 3-month follow-up (Table 79). Table 79: Descriptive statistics of fluorescence changes for antimere teeth #7 and #10 at 3 months, all groups. Control Group Fluorescence at 3 months Treat Office Group Fluorescence at 3 months Treat Paste Group Fluorescence at 3 months Treat Plus Group Fluorescence at 3 months Treat Topex Group Fluorescence at 3 months For all teeth #6 - #11 Because of the lack of normality (p<0.0001, Shapiro-Wilk test), rank transformation of measured fluorescence change values was conducted. Therefore, oneway ANOVA based on ranked data was performed. Note that log-transformation was not conducted due to the negative values obtained from measurements.
121 102 Results of one-way ANOVA on ranked data revealed no significant effect for the type of treatments on fluorescence change values for all teeth (F(4, 173)=1.28; p=0.2814). The data indicated there was no significant difference in fluorescence change values among five groups for all teeth at 3-month follow-up (Table 80). Table 80: Descriptive statistics of fluorescence changes for all teeth #6 - #11 at 3 months, all groups. Control Group Fluorescence at 3 months Treat Office Group Fluorescence at 3 months Treat Paste Group Fluorescence at 3 months Treat Plus Group Fluorescence at 3 months Treat Topex Group Fluorescence at 3 months Comparisons of Fluorescence Change Values Among the Five Groups from Baseline to 3-Month Follow-Up For each tooth Tooth #6 Because of the lack of normality (p=0.0059, Shapiro-Wilk test), rank transformation measured fluorescence change values was conducted. Therefore, one-way ANOVA based on ranked data was performed. Note that log-transformation was not conducted due to the negative values obtained from measurements.
122 103 Results of one-way ANOVA on ranked data revealed no significant effect for the type of treatments on the change in fluorescence change values from baseline to 3- months at follow-up for tooth 6 (F(4, 25)=0.35; p=0.8425). The data indicated there was no significant difference in change in fluorescence change values between baseline to 3- month follow-up among five treatment groups (Table 81). Tooth #7 Since the normality assumption is valid (p=0.5306, Shapiro-Wilk test), one-way ANOVA was conducted. Results of one-way revealed no significant effect for the type of treatments on the change in fluorescence change values from baseline to 3-months at follow-up for tooth 7 (F(4, 25)=1.43; p=0.2525). The data indicated there was no significant difference in change in fluorescence change values between baseline to 3- month follow-up among five treatment groups (Table 82). Tooth #8 Because of the lack of normality (p=0.0164, Shapiro-Wilk test), rank transformation of measured fluorescence change values was conducted. Therefore, oneway ANOVA based on ranked data was performed. Note that log-transformation was not conducted due to the negative values obtained from measurements. Results of one-way ANOVA on ranked data revealed no significant effect for the type of treatments on the change in fluorescence change values from baseline to 3- months at follow-up for tooth 8 (F(4, 25)=0.47; p=0.7589). The data indicated there was no significant difference in change in fluorescence change values between baseline to 3- month follow-up among five treatment groups (Table 83).
123 104 Table 81: Descriptive statistics of fluorescence change for tooth #6 from baseline to 3- month follow-up, all groups. Tooth # 6 Control Fluorescence Change Tooth #6 Treat Office Fluorescence Change Tooth #6 Treat Paste Fluorescence Change Tooth #6 Treat Plus Fluorescence Change Tooth #6 Treat Topex Fluorescence Change Table 82: Descriptive statistics of fluorescence change for tooth #7 from baseline to 3- month follow-up, all groups. Tooth #7 Control Fluorescence Change Tooth #7 Treat Office Fluorescence Change Tooth #7 Treat Paste Fluorescence Change Tooth #7 Treat Plus Fluorescence Change Tooth #7 Treat Topex Fluorescence Change Tooth #9 Because of the lack of normality (p=0.0005, Shapiro-Wilk test), rank transformation of measured fluorescence change values was conducted. Therefore, one-
124 105 Table 83: Descriptive statistics of fluorescence change for tooth #8 from baseline to 3- month follow-up, all groups. Tooth #8 Control Fluorescence Change Tooth #8 Treat Office Fluorescence Change Tooth #8 Treat Paste Fluorescence Change Tooth #8 Treat Plus Fluorescence Change Tooth #8 Treat Topex Fluorescence Change way ANOVA based on ranked data was performed. Note that log-transformation was not conducted due to the negative values obtained from measurements. Results of one-way ANOVA on ranked data revealed no significant effect for the type of treatments on the change in fluorescence change values from baseline to 3- months at follow-up for tooth 9 (F(4, 25)=1.36; p=0.2752). The data indicated there was no significant difference in change in fluorescence change values between baseline to 3- month follow-up among five treatment groups (Table 84). Tooth #10 Because of the lack of normality (p<0.0001, Shapiro-Wilk test), rank transformation of measured fluorescence change values was conducted. Therefore, oneway ANOVA based on ranked data was performed. Note that log-transformation was not conducted due to the negative values obtained from measurements. Results of one-way ANOVA on ranked data revealed no significant effect for the type of treatments on the change in fluorescence change values from baseline to 3-
125 106 months at follow-up for tooth 10 (F(4, 23)=0.77; p=0.5536). The data indicated there was no significant difference in change in fluorescence change values between baseline to 3-month follow-up among five treatment groups (Table 85). Table 84: Descriptive statistics of fluorescence change for tooth #9 from baseline to 3- month follow-up, all groups. Tooth #9 Control Fluorescence Change Tooth #9 Treat Office Fluorescence Change Tooth #9 Treat Paste Fluorescence Change Tooth #9 Treat Plus Fluorescence Change Tooth #9 Treat Topex Fluorescence Change Table 85: Descriptive statistics of fluorescence change for tooth #10 from baseline to 3- month follow-up, all groups. Tooth #10 Control Fluorescence Change Tooth #10 Treat Office Fluorescence Change Tooth #10 Treat Paste Fluorescence Change Tooth #10 Treat Plus Fluorescence Change Tooth #10 Treat Topex Fluorescence Change
126 107 Tooth #11 Because of the lack of normality (p=0.0174, Shapiro-Wilk test), rank transformation of measured fluorescence change values was conducted. Therefore, oneway ANOVA based on ranked data was performed. Note that log-transformation was not conducted due to the negative values obtained from measurements. Results of one-way ANOVA on ranked data revealed no significant effect for the type of treatments on the change in fluorescence change values from baseline to 3- months at follow-up for tooth 11 (F(4, 25)=1.00; p=0.4255). The data indicated there was no significant difference in change in fluorescence change values between baseline to 3-month follow-up among five treatment groups (Table 86). For Antimere Teeth Antimere Teeth #6 and #11 Because of the lack of normality (p<0.0001, Shapiro-Wilk test), rank transformation of measured fluorescence change values was conducted. Therefore, oneway ANOVA based on ranked data was performed. Note that log-transformation was not conducted due to the negative values obtained from measurements. Results of one-way ANOVA on ranked data revealed no significant effect for the type of treatments on the change in fluorescence change values from baseline to 3- months at follow-up for antimere teeth #6 and #11 (F(4, 55)=0.47; p=0.7550). The data indicated there was no significant difference in change in fluorescence change values between baseline to 3-month follow-up among five treatment groups (Table 87). Antimere Teeth #7 and #10 Because of the lack of normality (p<0.0001, Shapiro-Wilk test), rank transformation of measured fluorescence change values was conducted. Therefore, one-
127 108 Table 86: Descriptive statistics of fluorescence change for tooth #11 from baseline to 3- month follow-up, all groups. Tooth #11 Control Fluorescence Change Tooth #11 Treat Office Fluorescence Change Tooth #11 Treat Paste Fluorescence Change Tooth #11 Treat Plus Fluorescence Change Tooth #11 Treat Topex Fluorescence Change Table 87: Descriptive statistics of fluorescence change for antimere teeth #6 and #11 from baseline to 3-month follow-up, all groups. Control Group Fluorescence Change Treat Office Group Fluorescence Change Treat Paste Group Fluorescence Change Treat Plus Group Fluorescence Change Treat Topex Group Fluorescence Change way ANOVA based on ranked data was performed. Note that log-transformation was not conducted due to the negative values obtained from measurements. Results of one-way ANOVA on ranked data revealed no significant effect for the type of treatments on the change in fluorescence change values from baseline to 3-
128 109 months at follow-up for antimere teeth #7 and #10 (F(4, 53)=1.26; p=0.2958). The data indicated there was no significant difference in change in fluorescence change values between baseline to 3-month follow-up among five treatment groups (Table 88). Table 88: Descriptive statistics of fluorescence change for antimere teeth #7 and #10 from baseline to 3-month follow-up, all groups. Group=Control Fluorescence Change Treat Office Group Fluorescence Change Treat Paste Group Fluorescence Change Treat Plus Group Fluorescence Change Treat Topex Group Fluorescence Change Antimere Teeth #8 and #9 Because of the lack of normality (p<0.0001, Shapiro-Wilk test), rank transformation of measured fluorescence change values was conducted. Therefore, oneway ANOVA based on ranked data was performed. Note that log-transformation was not conducted due to the negative values obtained from measurements. Results of one-way ANOVA on ranked data revealed no significant effect for the type of treatments on the change in fluorescence change values from baseline to 3- months at follow-up for antimere teeth #8 and #9 (F(4, 55)=0.52; p=0.7232). The data indicated there was no significant difference in change in fluorescence change values between baseline to 3-month follow-up among five treatment groups (Table 89).
129 110 For All Teeth #6 - #11 Because of the lack of normality (p<0.0001, Shapiro-Wilk test), rank transformation of measured fluorescence change values was conducted. Therefore, oneway ANOVA based on ranked data was performed. Note that log-transformation was not conducted due to the negative values obtained from measurements. Results of one-way ANOVA on ranked data revealed no significant effect for the type of treatments on the change in fluorescence change values from baseline to 3- months at follow-up for all teeth (F(4, 173)=2.06; p=0.0875). The data indicated there was no significant difference in change in fluorescence change values between baseline to 3-month follow-up among five treatment groups (Table 90). Comparisons of Fluorescence Change Values Between Baseline and 3-Month Follow-Up Within Each Treatment Group Within Control Group For Each Tooth The data showed that there was a significant difference in fluorescence change values between baseline and 3-month follow-up for tooth #6, tooth #9, tooth #10 and tooth 11 within control group (p<0.05 for each instance). The fluorescence change value at baseline was significantly greater (in negative) than that observed at 3-month followup for each of those cases, and mean changes from baseline to 3-month follow-up are summarized in Table 91. However, no significant differences in fluorescence change values were found between baseline and 3-month follow-up for tooth #7(p=0.0895) and tooth#8 (p=0.0825).
130 111 Table 89: Descriptive statistics of fluorescence change for antimere teeth #8 and #9 from baseline to 3-month follow-up, all groups. Control Group Fluorescence Change Treat Office Group Fluorescence Change Treat Paste Group Fluorescence Change Treat Plus Group Fluorescence Change Treat Topex Group Fluorescence Change Table 90: Descriptive statistics of fluorescence change for all teeth #6 - #11 from baseline to 3-month follow-up, all groups. Control Group Fluorescence Change Treat Office Group Fluorescence Change Treat Paste Group Fluorescence Change Treat Plus Group Fluorescence Change Treat Topex Group Fluorescence Change For Antimere Teeth There were significant differences in fluorescence change values between baseline and 3-month follow-up for antimere teeth #6 and #11, antimere teeth #7 and #10, and antimere teeth #8 and #9 within control group (p<0.05 for each instance). The
131 112 fluorescence change value at baseline was significantly greater (in negative) than that observed at 3-month follow-up for each of those cases, and mean changes from baseline to 3-month follow-up are summarized in Table 92. Table 91: Descriptive statistics of fluorescence change for each tooth from #6 - #11 from baseline to 3-month follow-up, Control Group. Tooth #6 Fluorescence Baseline Fluorescence at 3 months Fluorescence Change Tooth #7 Fluorescence Baseline Fluorescence at 3 months Fluorescence Change Tooth #8 Fluorescence Baseline Fluorescence at 3 months Fluorescence Change Tooth #9 Fluorescence Baseline Fluorescence at 3 months Fluorescence Change Tooth #10 Fluorescence Baseline Fluorescence at 3 months Fluorescence Change Tooth #11 Fluorescence Baseline Fluorescence at 3 months Fluorescence Change
132 113 Table 92: Descriptive statistics of fluorescence change for antimere teeth from baseline to 3-month follow-up, Control Group. Teeth # 6 and #11 Fluorescence Baseline Fluorescence at 3 months Fluorescence Change Teeth #7 and #10 Fluorescence Baseline Fluorescence at 3 months Fluorescence Change Teeth #8 and #9 Fluorescence Baseline Fluorescence at 3 months Fluorescence Change For All Teeth #6 - #11 The data showed that there was a significant difference in fluorescence change values between baseline and 3-month follow-up for all teeth (p<0.0001). The fluorescence change value at baseline was significantly greater (in negative) than that observed at 3-month follow-up, and mean changes from baseline to 3-month follow-up are summarized in Table 93. Table 93: Descriptive statistics of fluorescence change for all teeth #6 - #11 from baseline to 3-month follow-up, Control Group. Control Group Fluorescence Baseline Fluorescence at 3 months Fluorescence Change
133 114 Within Treat Office Group For Each Tooth #6 to #11 The data showed that there was a significant difference in fluorescence change values between baseline and 3-month follow-up for tooth #6, tooth#7, tooth #8, tooth #10 and tooth #11 within Treat Office group (p<0.05 for each instance). The fluorescence change value at baseline was significantly greater (in negative) than that observed at 3- month follow-up for each of those cases, and mean changes from baseline to 3-month follow-up are summarized in Table 94. However, no significant difference in fluorescence change values was found between baseline and 3-month follow-up for tooth #9 (p=0.1478), For Antimere Teeth There were significant differences in fluorescence change values between baseline and 3-month follow-up for antimere teeth #6 and #11, antimere teeth #7 and #10, and antimere teeth #8 and #9 within Treat Office group (p<0.05 for each instance). The fluorescence change value at baseline was significantly greater (in negative) than that observed at 3-month follow-up for each of those cases, and mean changes from baseline to 3-month follow-up are summarized in Table 95. For All Teeth #6 - #11 The data showed that there was a significant difference in fluorescence change values between baseline and 3-month follow-up for all teeth (p<0.0001). The fluorescence change value at baseline was significantly greater (in negative) than that observed at 3-month follow-up, and mean changes from baseline to 3-month follow-up are summarized in Table 96.
134 115 Table 94: Descriptive statistics of fluorescence change for each tooth from #6 - #11 from baseline to 3-month follow-up, Treat Office Group. Tooth #6 Fluorescence Baseline Fluorescence at 3 months Fluorescence Change Tooth #7 Fluorescence Baseline Fluorescence at 3 months Fluorescence Change Tooth #8 Fluorescence Baseline Fluorescence at 3 months Fluorescence Change Tooth #9 Fluorescence Baseline Fluorescence at 3 months Fluorescence Change Tooth #10 Fluorescence Baseline Fluorescence at 3 months Fluorescence Change Tooth #11 Fluorescence Baseline Fluorescence at 3 months Fluorescence Change Within Treat Paste Group For Each Tooth #6 - #11 The data showed that there was a significant difference in fluorescence change values between baseline and 3-month follow-up for tooth#7, tooth #9, and tooth #11 within Treat Paste group (p<0.05 for each instance). The fluorescence change value at
135 116 Table 95: Descriptive statistics of fluorescence change for antimere teeth from baseline to 3-month follow-up, Treat Office Group. Teeth #6 and #11 Fluorescence Baseline Fluorescence at 3 months Fluorescence Change Teeth #7 and #10 Fluorescence Baseline Fluorescence at 3 months Fluorescence Change Teeth #8 and #9 Fluorescence Baseline Fluorescence at 3 months Fluorescence Change Table 96: Descriptive statistics of fluorescence change for all teeth #6 - #11 from baseline to 3-month follow-up, Treat Office Group. Treat Office Group Fluorescence Baseline Fluorescence at 3 months Fluorescence Change baseline was significantly greater (in negative) than that observed at 3-month follow-up for each of those cases, and mean changes from baseline to 3-month follow-up are summarized in Table 97. However, no significant differences in fluorescence change values were found between baseline and 3-month follow-up for tooth #6 (p=0.0838), tooth #8 (p=0.0703), and tooth#10 (p=0.0561).
136 117 Table 97: Descriptive statistics of fluorescence change for each tooth from #6 - #11 from baseline to 3-month follow-up, Treat Paste Group. Tooth #6 Fluorescence Baseline Fluorescence at 3 months Fluorescence Change Tooth #7 Fluorescence Baseline Fluorescence at 3 months Fluorescence Change Tooth #8 Fluorescence Baseline Fluorescence at 3 months Fluorescence Change Tooth #9 Fluorescence Baseline Fluorescence at 3 months Fluorescence Change Tooth #10 Fluorescence Baseline Fluorescence at 3 months Fluorescence Change Tooth #11 Fluorescence Baseline Fluorescence at 3 months Fluorescence Change For Antimere Teeth There were significant differences in fluorescence change values between baseline and 3-month follow-up for antimere teeth #6 and #11, antimere teeth #7 and #10, and antimere teeth #8 and #9 within Treat Paste group (p<0.05 for each instance). The fluorescence change value at baseline was significantly greater (in negative) than that
137 118 observed at 3-month follow-up for each of those cases, and mean changes from baseline to 3-month follow-up are summarized in Table 98. Table 98: Descriptive statistics of fluorescence change for antimere teeth from baseline to 3-month follow-up, Treat Paste Group. Teeth #6 and #11 Fluorescence Baseline Fluorescence at 3 months Fluorescence Change Teeth #7 and #10 Fluorescence Baseline Fluorescence at 3 months Fluorescence Change Teeth #8 and #9 Fluorescence Baseline Fluorescence at 3 months Fluorescence Change For All Teeth #6 - #11 The data for all teeth #6 - #11 showed that there was a significant difference in fluorescence change values between baseline and 3-month follow-up for all teeth #6 - #11 (p<0.0001). The fluorescence change value at baseline for teeth #6 - #11 was significantly greater (in negative) than that observed at 3-month follow-up for teeth #6 - #11, and mean changes from baseline to 3-month follow-up for teeth #6 - #11 are summarized in Table 99.
138 119 Table 99: Descriptive statistics of fluorescence change for all teeth from #6 - #11 from baseline to 3-month follow-up, Treat Paste Group. Treat Paste Group Fluorescence Baseline Fluorescence at 3 months Fluorescence Change Within Treat Plus Group For Each Tooth #6 - #11 The data showed that there was a significant difference in fluorescence change values between baseline and 3-month follow-up for tooth #6, tooth#7, tooth #8, tooth #9, and tooth #10 within Treat Plus group (p<0.05 for each instance). The fluorescence change value at baseline was significantly greater (in negative) than that observed at 3- month follow-up for each of those cases, and mean changes from baseline to 3-month follow-up are summarized in Table 100. However, no significant differences in fluorescence change values was found between baseline and 3-month follow-up for tooth #11 (p=0.0634). For Antimere Teeth There were significant differences in fluorescence change values between baseline and 3-month follow-up for antimere teeth #6 and #11, antimere teeth #7 and #10, and antimere teeth #8 and #9 within Treat Plus group (p<0.05 for each instance). The fluorescence change value at baseline was significantly greater (in negative) than that observed at 3-month follow-up for each of those cases, and mean changes from baseline to 3-month follow-up are summarized in Table 101.
139 120 Table 100: Descriptive statistics of fluorescence change for each tooth from #6 - #11 from baseline to 3-month follow-up, Treat Plus Group. Tooth #6 Fluorescence Baseline Fluorescence at 3 months Fluorescence Change Tooth #7 Fluorescence Baseline Fluorescence at 3 months Fluorescence Change Tooth #8 Fluorescence Baseline Fluorescence at 3 months Fluorescence Change Tooth #9 Fluorescence Baseline Fluorescence at 3 months Fluorescence Change Tooth #10 Fluorescence Baseline Fluorescence at 3 months Fluorescence Change Tooth #11 Fluorescence Baseline Fluorescence at 3 months Fluorescence Change For All Teeth #6 - #11 The data showed that there was a significant difference in fluorescence change values between baseline and 3-month follow-up for all teeth (p<0.0001). The fluorescence change value at baseline was significantly greater (in negative) than that observed at 3-month follow-up, and mean changes from baseline to 3-month follow-up are summarized in Table 102.
140 121 Table 101: Descriptive statistics of fluorescence change for antimere teeth from baseline to 3-month follow-up, Treat Plus Group. Teeth #6 and #11 Fluorescence Baseline Fluorescence at 3 months Fluorescence Change Teeth #7 and #10 Fluorescence Baseline Fluorescence at 3 months Fluorescence Change Teeth #8 and #9 Fluorescence Baseline Fluorescence at 3 months Fluorescence Change Table 102: Descriptive statistics of fluorescence change for all teeth from #6 - #11from baseline to 3-month follow-up, Treat Plus Group. Treat Plus Group Fluorescence Baseline Fluorescence at 3 months Fluorescence Change Within Treat Topex Group For Each Tooth #6 - #11 The data showed that there was a significant difference in fluorescence change values between baseline and 3-month follow-up for tooth=6, tooth#7, and tooth #9
141 122 (p<0.05 for each instance). The fluorescence change value at baseline was significantly greater (in negative) than that observed at 3-month follow-up for each of those cases, and mean changes from baseline to 3-month follow-up are summarized in Table 103. However, no significant differences in fluorescence change values were found between baseline and 3-month follow-up for tooth #8 (p=0.0611), tooth#10 (p=0.0625), and tooth #11 (p=0.0621). Table 103: Descriptive statistics of fluorescence change for each tooth from #6 - #11 from baseline to 3-month follow-up, Treat Topex Group. Tooth #6 Fluorescence Baseline Fluorescence at 3 months Fluorescence Change Tooth #7 Fluorescence Baseline Fluorescence at 3 months Fluorescence Change Tooth #8 Fluorescence Baseline Fluorescence at 3 months Fluorescence Change Tooth #9 Fluorescence Baseline Fluorescence at 3 months Fluorescence Change Tooth #10 Fluorescence Baseline Fluorescence at 3 months Fluorescence Change Tooth #11 Fluorescence Baseline Fluorescence at 3 months Fluorescence Change
142 123 For Antimere Teeth There were significant differences in fluorescence change values between baseline and 3-month follow-up for antimere teeth #6 and #11, antimere teeth #7 and #10, and antimere teeth #8 and #9 within Treat Topex group (p<0.05 for each instance). The fluorescence change value at baseline was significantly greater (in negative) than that observed at 3-month follow-up for each of those cases, and mean changes from baseline to 3-month follow-up are summarized in Table 104. Table 104: Descriptive statistics of fluorescence change for antimere teeth from baseline to 3-month follow-up, Treat Topex Group. Teeth #6 and #11 Fluorescence Baseline Fluorescence at 3 months Fluorescence Change Teeth #7 and #10 Fluorescence Baseline Fluorescence at 3 months Fluorescence Change Teeth #8 and #9 Fluorescence Baseline Fluorescence at 3 months Fluorescence Change For All Teeth #6 - #11 The data showed that there was a significant difference in fluorescence change values between baseline and 3-month follow-up for all teeth (p<0.0001). The fluorescence change value at baseline was significantly greater (in negative) than that
143 124 observed at 3-month follow-up, and mean changes from baseline to 3-month follow-up are summarized in Table 105. Table 105: Descriptive statistics of fluorescence change for all teeth from #6 - #11 from baseline to 3-month follow-up, Treat Topex Group. Treat Topex Group Fluorescence Baseline Fluorescence at 3 months Fluorescence Change
144 125 DISCUSSION Discussion of Sample and Patient Inclusion Criteria First, the decision to limit patient inclusion to 12 years or older was beneficial, since it provided patients with a better ability to comply with the at home treatment protocol. Next, it was also appropriate to not include patients with known allergies to bovine milk products or benzoate preservatives, since some treatment products included these ingredients. No patients screened reported such allergies, and fortunately, no unknown allergies were reported by patients or clinically detected. Including only patients who had been in treatment for at least a year ensured that decalcification and white spot formation were indeed due to the temporary placement of appliances, and not a longer term process. This helped insure that control and treatment effects over the 3 month study period targeted decalcification caused by orthodontic treatment. Not including patients that had started another remineralization treatment either during or after orthodontic therapy ensured that observed effects were due to the treatments studied. The decision to mandate at least one white spot lesion of a facial surface of maxillary anterior teeth was appropriate, since it helped ensure the lesion was orthodontically related and was easily accessible for examination. Also, the maxillary anterior teeth are considered the esthetic zone of a patient s smile, and thus the most important teeth to target. All patients had an area of decalcification and visible white spot formation to examine on all teeth, although there was a wide range in areas and severity of white spots from patient to patient. The decision to not include patients undergoing a consent deband or patients that had missed multiple appointments during orthodontic treatment was appropriate, since it
145 126 helped ensure that patients would return to complete the study. Some patients were difficult to appoint for the 3-month follow-up visit, but were successfully appointed with effort. The inclusion criteria allowed a sample size of 30 patients, with a distribution of 6 patients in each experimental group, beneficial from a statistical standpoint. Two patients were both missing the lateral incisor #10, so those two patients only had five teeth to examine instead of 6. Therefore, those two experimental groups, the Treat Plus group and Treat Topex groups, had 35 teeth in total to examine, instead of 36. A larger sample size would of course improve the study, but would require collection of patients over many years, given the rate of patient enrollment for the study. Patients were enrolled from those debanded by any resident at the University of Iowa Department of Orthodontics. Discussion of Clinical Procedure Enrolling patients either at the deband appointment or at the delivery of Hawley retainers was appropriate given clinic operating conditions. As many patients as possible were enrolled at the deband appointment. Since different residents were debanding the patients to be enrolled and different clinic times had sometimes been allotted, it was sometimes not possible to enroll patients at the deband appointment. In those cases, patients had to be enrolled when the Hawley retainers were delivered, typically 2-4 weeks after deband. Ideally, all patients would be enrolled at deband. This is when the gathering of plaque and challenge in cleaning, which is presented by the fixed appliances, is first removed. It was felt that since this was not always operationally possible, that enrolling at the delivery of Hawley retainers would be an acceptable alternative that would minimally affect study results Standardizing the camera settings and photo orientations for intraoral pictures eliminated most error in comparing baseline and 3-month follow-up pictures.
146 127 Standardizing QLF imaging conditions, settings, and orientations was similarly beneficial in reducing error, as was the software which gave visual indicators to match QLF Images within 95 percent of baseline. However, it was subjectively felt that it was harder to match orientations of QLF images. There are many more factors for the operator to juggle, including drying the teeth; minimizing patient, operator, and handpiece movement; minimizing fogging of the mirror in the QLF handpiece; capturing instance at ideal time with footpedal; etc. Also, QLF imaging took place in a laboratory setting that was equipped more for benchtop experiments, rather than clinical procedures with patients. This caused some difficulty due to setup of furniture, chairs, and the QLF computer, in terms of ergonomics and patient comfort. Standardizing applications of in-office MI Paste Plus was under clinical control and appropriate, but ensuring compliance with at-home was more challenging. Giving the same detailed oral and written instructions to each patient upon enrollment was an effort to standardized application across patient and treatment groups, as was the distribution and collection of at-home diary cards, which all patients returned. All these actions were appropriate, but obtaining patient cooperation and proper product use is a difficult issue in this type of clinical trial. Discussion of Measurement of Data and Statistical Analysis Measuring white spot lesion areas with the ImageJ software was an appropriate technique. Using digital calipers to measure mesial/distal widths from final casts allowed a precise calibration of photos in ImageJ, since the measurements could be taken from the same orientation as in the photographs. The ability to trace the outlines of the white spots for analysis in the program allowed even the most convoluted white spot lesions to be analyzed.
147 128 As previously discussed, obtaining successive QLF images at the same orientation as the baseline image is somewhat challenging. Fortunately, these tools allowed correction of all errors except for pitch, yaw, and different levels of base fluorescence. Different levels of base fluorescence seem to occur when the handpiece is at different distances from the subject tooth. Although some of these types of errors no doubt exist in the data, the standardization procedures used minimized these types of errors. Discussion of Results for Statistical Analysis of Reliability of Intra- and Inter-Examiner Measurements of Lesion Areas When examining each tooth separately, only tooth #7 showed that intra-examiner duplicate measurements were significantly different, and only tooth #7 also showed an inter-examiner significant difference, and only for one of the measurements of the first examiner. Additionally, all intra- and inter-class correlation coefficients were between.89 to.97, indicating strong agreement of measurements. Also, when considering antimere teeth and all teeth in the study, there were no significant findings for duplicate measures of the first examiner, or between examiners, and all intra- and inter-class correlation coefficients were between.92 to.96, again indicating strong agreement of measurements. Despite the one significant finding for tooth #7, this statistical analysis indicates a high level of reproducibility for the technique of measuring white spot lesion areas with the ImageJ software. Discussion of Results for Comparison, Among Groups, of Lesion Areas at Baseline In comparing white spot lesion area at baseline, no significant difference was found between the control and treatment groups for any one tooth, for antimere teeth, and
148 129 for all teeth. This indicates that the random assigning of patients to each group produced groups with similar characteristics at baseline in respect to lesion areas. Discussion of Results for Comparison, Among Groups, of Lesion Areas and Lesion Area Changes at 3-Months Follow-Up In comparing white spot lesion area at 3-month follow-up, no significant difference was found between the control and treatment groups for any one tooth, for antimere teeth, and for all teeth. However, when comparing changes in white spot lesion areas, a significant difference was found when examining antimere lateral incisors #7 and #10. The post-hoc Bonferroni test indicated that the Treat Topex and Treat Office groups had significantly greater reductions in mean white spot lesion areas that the Control or Treat Plus groups. The Treat Paste group was not significantly different than either the Treat Topex or Treat Office grouping, or the Control and Treat Plus grouping, since its mean decrease in white spot area was intermediate between the other two groupings. When examining all teeth #6 - #11, a similar significant difference was found. In this case, the Treat Topex and Treat Office groups had significantly greater reductions in mean white spot lesion than either the Control, Treat Plus, or additionally, compared to the previous finding, the Treat Paste group. This is the major finding from this clinical study. Unfortunately, the significant difference was not found when examining any tooth individually, or when examining other antimere pairs other than #7 and #10. However, we can say that when examining teeth #7 and #10, or when examining all teeth #6 - #11, an at-home only treatment with Topex Renew, or an in-office and at-home combination treatment with MI Paste Plus, is more effective at reducing visible white spot lesion area than non-prescription strength fluoride toothpaste alone, or at-home only treatment with MI Paste Plus (and MI Paste in the case of all teeth).
149 130 Discussion of Results for Comparison of Lesion Area Changes, Within Groups, at 3-Months Follow-Up Within the Control group, there was a significant reduction in white spot lesion area over the 3 month study for each tooth (marginal on tooth #8), for all antimere pairs, and for all teeth. Within the Treat Office group, there was a significant reduction in white spot lesion area over the 3 month study for each tooth, for all antimere pairs, and for all teeth. Within the Treat Paste group, there was a significant reduction in white spot lesion area over the 3 month study for each tooth (marginal on tooth #7), for all antimere pairs, and for all teeth. Within the Treat Plus group, there was a significant reduction in white spot lesion area over the 3 month study for each tooth (marginal on teeth #6 and #10), for all antimere pairs, and for all teeth. Within the Treat Topex group, there was a significant reduction in white spot lesion area over the 3 month study for each tooth except tooth #10, for all antimere pairs, and for all teeth. These results indicate that all treatments, and even the control situation, will in most cases cause significant reductions in white spot areas over the course of 3 months after removal of fixed orthodontic appliances. Discussion of Results for Comparison, Among Groups, of Fluorescence Decrease at Baseline In comparing fluorescence decrease in white spots area at baseline, a significant difference was found on tooth #9, and also on antimere teeth #8 and #9, where the Treat Office and Control groups displayed significantly lower initial fluorescence decreases than the Treat Paste group. Treat Topex and Treat Plus groups were not significantly different than any other group. In examining all teeth, the Treat Office group was significantly different from only the Treat Paste group. Treat Topex, Control, and Treat Plus groups were not significantly different from any other group. No significant difference was found between the control and treatment groups for any other individual
150 131 teeth, or for other antimere pairs. This indicates that the random assigning of patients to each group produced groups with similar characteristics at baseline in respect to fluorescence decrease in white spot lesion areas, with the exception of the Treat Office group, and to a lesser extent, the Control group, where random assigning of patients led to these groups have a lower initial fluorescence decrease in some situations. Discussion of Results for Comparison, Among Groups, of Fluorescence Decrease and Fluorescence Decrease Changes in Lesion Areas at 3-Months Follow-Up In comparing fluorescence decrease and fluorescence decrease changes of white spot lesion areas at 3 months follow-up, no significant difference was found between the control and treatment groups for any one tooth, for antimere teeth, and for all teeth. This indicates that no treatment or the control was more effective at lessening fluorescence decrease during the 3 month study. Discussion of Results for Comparison of Fluorescence Decrease and Fluorescence Decrease Changes in Lesion, Within Groups, at 3-Months Follow-Up Within the Control group, there was a significant reduction in the fluorescence decrease of the lesion area over the 3 month study for each tooth except for teeth #7 and #8, for all antimere pairs, and for all teeth. Within the Treat Office group, there was a significant reduction in the fluorescence decrease of the lesion area over the 3 month study for each tooth except for tooth #9, for all antimere pairs, and for all teeth. Within the Treat Paste group, there was a significant reduction in the fluorescence decrease of the lesion area over the 3 month study for each tooth except for teeth #6, #8, and #10, for all antimere pairs, and for all teeth. Within the Treat Plus group, there was a significant reduction in the fluorescence decrease of the lesion area over the 3 month study for each tooth except for tooth #11, for all antimere pairs, and for all teeth. Within the Treat
151 132 Topex group, there was a significant reduction in the fluorescence decrease of the lesion area over the 3 month study for each tooth except teeth #8, #10, and #11, for all antimere pairs, and for all teeth. These results indicate that except for isolated teeth in each group, all treatments, and even the control situation, will in most cases cause significant reductions in the fluorescence decrease of the lesion area over the course of 3 months after removal of fixed orthodontic appliances. Discussion of Sources of Potential Error and Limitations of the Study The following sources of potential error have already been discussed and are summarized as follows. First, two patients were both missing the lateral incisor #10, so those two patients only had five teeth to examine instead of 6, and one patient each were in the Treat Plus group and Treat Topex groups, which therefore had 35 teeth in total to examine, instead of 36. Second, a larger sample size would of course improve the study, but would require collection of patients over many years, given the rate of patient enrollment for the study. Third, despite giving detailed oral and written instructions, and collecting an at-home diary card, it is unknown how much patients truly complied with proper use of each treatment material. This unknown cooperation could significantly affect the study. All patients appeared to comply with treatments, but these patients often have had a poor history of compliance with hygiene and elastics during orthodontic treatment, so there is necessary doubt about compliance that cannot be eliminated in this type of study. Fourth, QLF images were again sometimes challenging to orient, due to patient and operator interaction and equipment. Lastly, all patients would be ideally be enrolled at deband. A last source of error that is difficult to quantify is caused by reduction of hyperplastic gingiva after fixed orthodontic appliances are removed. On some teeth, it
152 133 was possible that the initial white spot lesion extended under gingiva, where it could not be analyzed either visibly on intraoral photographs or on QLF imaging. During the 3 month study, it is possible that gingiva receded, revealing a larger white spot area. At the same time, white spot area is often decreasing. Depending on the degree of both of these factors, the gingival border of lesions at 3 months could be measured as more extensive than the initial border, even though it was decreasing, or the decrease in area could be calculated as decreasing less than it actually did. Teeth with white spots directly adjacent to gingiva existed in all groups, and with the random assigning of patients, any such errors should be distributed evenly. Therefore, study results should remain valid. If future studies are conducted, retraction cord or another method could be used to determine if a white spot lesion extended under hyperplastic gingiva. Discussion of Clinical Application The results of this study provide information that could be applied clinically. First, the control and all treatment groups in general showed significant decreases in visible white spot areas and in the amount of fluorescence decrease in lesions, as shown in Figure 4 and Figure 5. This is helpful information to inform patients, in that there is often substantial improvement in white spot lesions after orthodontic treatment despite treatment or lack thereof. Second, although fluorescence results showed no significant differences between treatments, clinically visible results indicate that treatment with either an all at-home regimen of Topex Renew, or treatment with a combination in-office and at-home MI Paste Plus TM, may be more beneficial in reducing visible white spot lesions than other treatments. Discussion of Potential Future Projects Future projects could test the same variables with a larger sample size. A larger sample size would help reduce the effects on results of any non-compliant patients.
153 134 Secondly, since a combination in-office and at-home treatment with MI Paste Plus TM is significantly different than using MI Paste Plus TM only at home, experiments could be designed to test whether in-office treatments combined with at-home use would enhance the results for another treatment, such as Topex Renew. Third, perhaps treatments could be combined, for instance in-office MI Paste Plus with at home use of Topex Renew. Finally, some patients who completed the 3 month study and reported back to the clinic even later for retention checks seemed to have continued improvement, at least subjectively. A study lasting a longer period of time could be beneficial, although this is difficult under the time constraints of a residency program. These are just a few ideas that could be tested, and there are surely many more, in order to reduce the degree of white spots after orthodontic treatment.
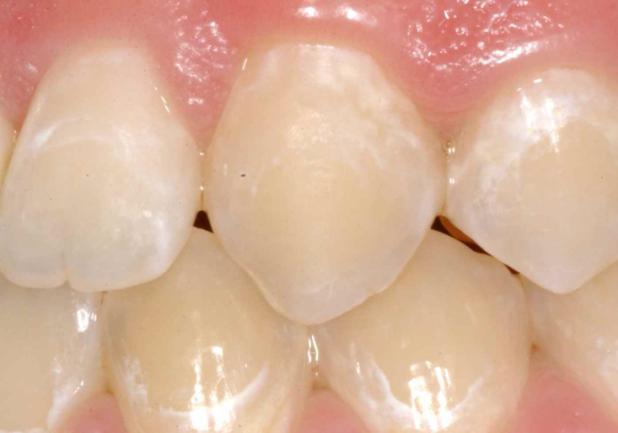
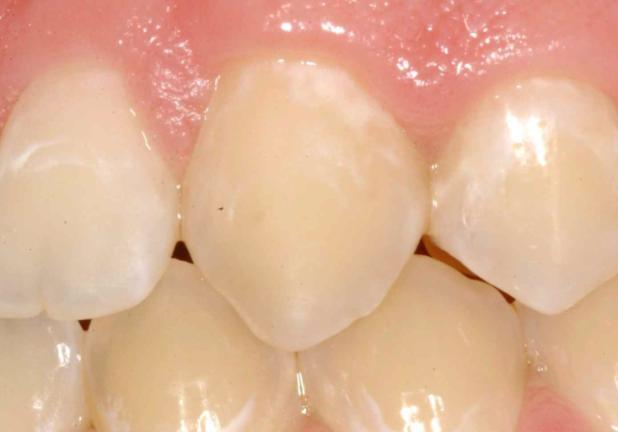
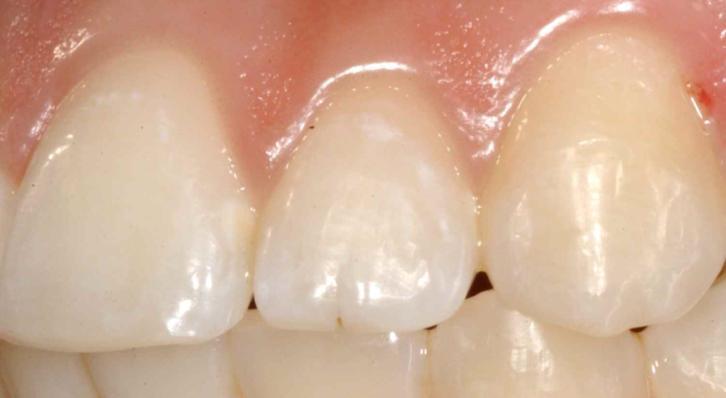
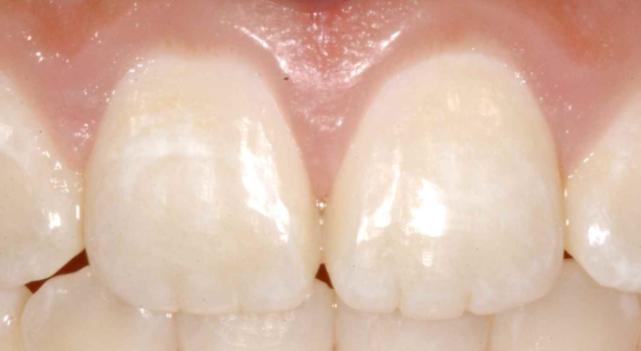
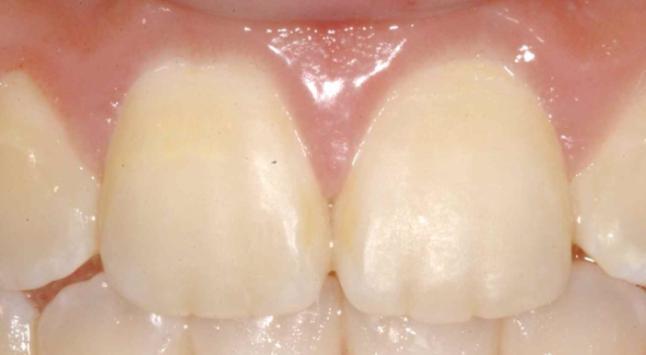
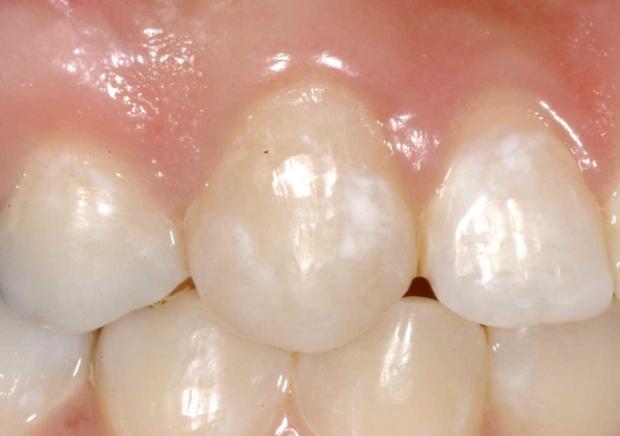
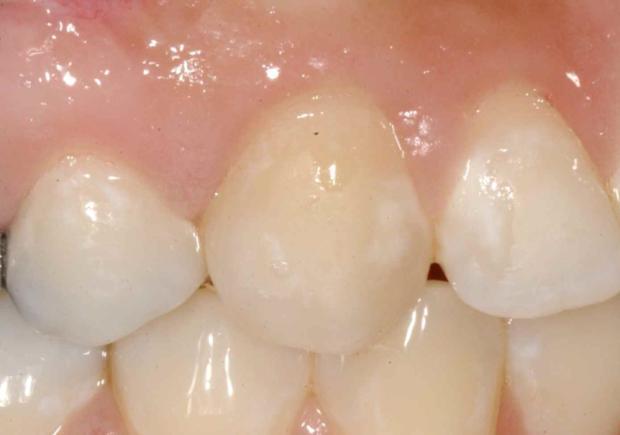
154 Figure 4. Photographic images illustrating typical remineralization effects observed in all treatments and the control. 135


155 Figure 5. QLF images illustrating typical lessening in the amount of fluorescence decrease observed in all treatment groups and in the control group. 136
Remineralization effectiveness of MI Paste Plus - a clinical pilot study
 University of Iowa Iowa Research Online Theses and Dissertations Spring 2011 Remineralization effectiveness of MI Paste Plus - a clinical pilot study Sarah Elizabeth Clark University of Iowa Copyright
Innovative Dental Therapies for the Aging Population
 Innovative Dental Therapies for the Aging Population By Daniel H Ward DDS 1080 Polaris Pkwy Ste 130 Columbus OH 43240 614-430-8990 dward@columbus.rr.com US Population is Aging 1970-28 million>60 14% of
Chapter 14 Outline. Chapter 14: Hygiene-Related Oral Disorders. Dental Caries. Dental Caries. Prevention. Hygiene-Related Oral Disorders
 Chapter 14 Outline Chapter 14: Hygiene-Related Oral Disorders Hygiene-Related Oral Disorders Dental caries Prevention Gingivitis Prevention Tooth hypersensitivity Pathophysiology Treatment 2 Hygiene-Related
Linking Research to Clinical Practice
 Prevention of Root Caries Denise M. Bowen, RDH, MS Linking Research to Clinical Practice The purpose of Linking Research to Clinical Practice is to present evidence based information to clinical dental
GC Tooth Mousse Plus for Orthodontics. Helps keep you smiling. Made from milk
 GC Tooth Mousse Plus for Orthodontics Helps keep you smiling Made from milk Prevention Daily application of GC Tooth Mousse Plus with RECALDENT (CPP-ACP) throughout the full course of orthodontic treatment
Iowa Research Online. University of Iowa. Andre Correia Jham University of Iowa. Theses and Dissertations. Spring 2010
 University of Iowa Iowa Research Online Theses and Dissertations Spring 2010 The efficacy of Novamin powered technology Oravive and TopexRenew, Crest and Prevident 5000 Plus in preventing enamel demineralization
Restorative treatment The history of dental caries management consisted of many restorations placed as well as many teeth removed and prosthetic
 Restorative treatment The history of dental caries management consisted of many restorations placed as well as many teeth removed and prosthetic replacements provided. Paradigm shift towards a medical
Tooth Mousse. Plus from GC. and MI Paste. Remineralising protective crèmes with triple the benefit: Strengthen. Protect. Replenish.
 Tooth Mousse and MI Paste Plus from GC. Remineralising protective crèmes with triple the benefit: Strengthen. Protect. Replenish. A healthy balance in the mouth, inhibit demineralisation of dentin and
CAries Management By Risk Assessment"(CAMBRA) - a must in preventive dentistry
 - a must in preventive dentistry") CAries Management By Risk Assessment"(CAMBRA) - a must in preventive dentistry Nanda Kishor KM* *MDS, Reader, Department of Conservative and Endodontics Pacific Dental College, Udaipur, Rajasthan, India
CAries Management By Risk Assessment"(CAMBRA) - a must in preventive dentistry Nanda Kishor KM* *MDS, Reader, Department of Conservative and Endodontics Pacific Dental College, Udaipur, Rajasthan, India
GC Tooth Mousse Plus. Made from milk. Perfect for teeth.
 GC Tooth GC Tooth Made from milk. Perfect for teeth. 1 We all brush our teeth everyday. But people who really want to care for their teeth are discovering the many benefits that come from moussing their
Management of ECC and Minimally Invasive Dentistry
 Management of ECC and Minimally Invasive Dentistry Ranbir Singh DMD MPH NYU-Lutheran Phoenix Pgy1 Pediatric Dental Resident Phoenix ECC Management Management of dental caries includes identification of
Copyright and Acknowledgements. Caries Management Course Module: Topical Therapies. Disclaimer 3/31/2015
 Caries Management Course Module: Topical Therapies Robert S Jones DDS PhD Assistant Professor Division of Pediatric Dentistry University of Minnesota Copyright and Acknowledgements This work is protected
Prevention of white spot lesions in orthodontic practice: a contemporary review
 REVIEW Australian Dental Journal 2006;51:(4):284-289 Prevention of white spot lesions in orthodontic practice: a contemporary review TR Sudjalim,* MG Woods, DJ Manton Abstract The development of white
Oral health education for caries prevention
 Oral health education for caries prevention Objective Understand the fundamentals that inform oral health education programmes. Understand how to segment oral health information for preventive purposes
The 4Cs in Solving the Caries Puzzle
 The 4Cs in Solving the Caries Puzzle CAMBRA Caries Detection & Assesment System (ICDAS) Case-based protocol Calcium/Phosphate & Fluoride Objectives: Engaging in this program, the participant will be able
Effect of Three Different Remineralizing Agents on Enamel Caries Formation An in vitro Study
 KATHMANDU UNIVERSITY MEDICAL JOURNAL Effect of Three Different Remineralizing Agents on Enamel Caries Formation An in vitro Study Sathe N, 1 Chakradhar Raju RVS, 1 Chandrasekhar V 2 Department of Conservative
Linking Research to Clinical Practice
 Linking Research to Clinical Practice Non Fluoride Caries Preventive Agents Denise M. Bowen, RDH, MS The purpose of Linking Research to Clinical Practice is to present evidence based information to clinical
Effect of addition of Fluoride on Enamel remineralization potential of CCP-ACP and Novamin: A comparative Study
 ENDODONTOLOGY Volume: 27 Issue 2 December 2015 ORIGINAL RESEARCH Effect of addition of Fluoride on Enamel remineralization potential of Sai Kalyan S. 1, Wagle Rahul 2, Chandki rita 3, Byakod Praveen 4,
Dental caries prevention. Preventive programs for children 5DM
 Dental caries prevention Preventive programs for children 5DM Definition of Terms Preventive dentistry: usage of all the means to achieve and maintain the optimal oral health prevention of dental caries,
Uses of Fluoride in Dental Practices
 Uses of Fluoride in Dental Practices BY: Sulafa El-Samarrai Preventive &pedodontic department General Mechanisms of Action in Caries Reduction 1-Increase enamel resistance or reduction in enamel solubility
MI Varnish The ultimate fluoride varnish
 MI Varnish The ultimate fluoride varnish GC introduces MI Varnish, the first fluoride varnish with RECALDENT (CPP-ACP) MI Varnish is a 5% NaF varnish enhanced with 2% RECALDENT (CPP-ACP) to give an exceptional
White Spot Lesions: A Hygiene Perspective in the Orthodontic Practice. 16 MAY 2016 // hygienetown.com. clinical orthodontics // feature
 White Spot Lesions: A Hygiene Perspective in the Orthodontic Practice by Miranda Valenzuela, RDH Miranda Valenzuela, RDH, graduated in 2006 with an associate degree in dental hygiene, and has received
Sealants First! Prioritizing Prevention through Same Day Sealants
 Sealants First! Prioritizing Prevention through Same Day Sealants Candace Owen, RDH, MS, MPH NNOHA Education Director Janine Musheno, DMD Project HOME Dental Director 2018 NNOHA Annual Conference Stephen
Fluor Protector S. The protective fluoride varnish. Superior protection against dental caries and erosion
 Fluor Protector S The protective fluoride varnish Superior protection against dental caries and erosion Fluor Protector S The strong fluoride varnish In order to stay healthy and look good, teeth need
EFFECT OF ACIDULATED PHOSPHATE FLUORIDE GEL ON THE PREVENTION OF WHITE SPOT LESIONS IN PATIENTS UNDERGOING ACTIVE ORTHODONTIC TREATMENT.
 EFFECT OF ACIDULATED PHOSPHATE FLUORIDE GEL ON THE PREVENTION OF WHITE SPOT LESIONS IN PATIENTS UNDERGOING ACTIVE ORTHODONTIC TREATMENT A Thesis by CORNEIL KIMBERLY HUTTO FRETTY Submitted to the Office
Health Promotion and Disease Prevention are the Foundation of Community Based Health Care
 Health Promotion and Disease Prevention are the Foundation of Community Based Health Care Joan I. Gluch, RDH, Ph.D. Director of Community Health Associate Dean for Academic Policies Renewed Perspective
Fluor Protector Overview
 Fluor Protector Overview Superior protection against dental caries and erosion Fluoride Clinically proven Fluoride varnish Features and mechanism of action Application Intensive care gel Risks to teeth
The 21 st Century vision on. caries management, now brought into your. daily practice
 The 21 st Century vision on caries management, now brought into your daily practice Minimum Intervention A 21 st century vision on Patient Caries Management The concept of minimal intervention dentistry
Saliva. Introduction. Salivary Flow. Saliva and the Plaque Biofilm. The Minerals in Saliva
 Saliva Introduction Saliva is like a bloodstream to the mouth. As does blood, saliva helps build and maintain the health of the soft and hard tissues. Saliva removes waste products and provides disease-fighting
JIOS ABSTRACT. Received on: 7/9/13 Accepted after Revision: 21/9/13
 JIOS Clinical Evaluation of Enamel Demineralization during Orthodontic Treatment: An in vivo 10.5005/jp-journals-10021-1251 Study using GC Tooth Mousse Plus Original Research Clinical Evaluation of Enamel
riva helping you help your patients
 riva helping you help your patients what is a glass ionomer? how will a dentist benefit from using glass ionomers? how will a patient benefit from their glass ionomer? Glass ionomer is the generic name
Fluoridens 133 Fluorosilicic acid 136 Fluorosis, see Dental fluorosis Foams 118 acute toxicity 71, 122 clinical efficacy 122 Free saliva 149, 150
 Subject Index Abrasive systems, dentifrices 123 Absorption 23, 24, 38, 78 Accidental poisonings 66, 67, 69, 70, see also Acute toxicity Acid-base status, see also ph metabolism effects 28, 29 toxicity
EFFICACY OF AMORPHOUS CALCIUM PHOSPHATE, G.C. TOOTH MOUSSE AND GLUMA DESENSITIZER IN TREATING DENTIN HYPERSENSITIVITY : A RANDOMIZED CLINICAL TRIAL
 Original Article International Journal of Dental and Health Sciences Volume 01,Issue 02 EFFICACY OF AMORPHOUS CALCIUM PHOSPHATE, G.C. TOOTH MOUSSE AND GLUMA DESENSITIZER IN TREATING DENTIN HYPERSENSITIVITY
FRANK OSEI-BONSU UGDS/KBTH
 FRANK OSEI-BONSU UGDS/KBTH Definition Introduction G. V. Black s concept of Restoration New classification of Caries Principles & Concept of MID Conclusion An approach to the management of dental caries
Title:Is there a place for Tooth Mousse(R) in the prevention and treatment of early dental caries? A systematic review.
 in the prevention and treatment of early dental caries? A systematic review.") Author's response to reviews Title:Is there a place for Tooth Mousse(R) in the prevention and treatment of early dental caries? A systematic review. Authors: Sarah L Raphael (sarah.raphael@sydney.edu.au)
Author's response to reviews Title:Is there a place for Tooth Mousse(R) in the prevention and treatment of early dental caries? A systematic review. Authors: Sarah L Raphael (sarah.raphael@sydney.edu.au)
Caries Clinical Guidelines. Low Caries Risk
 Caries Clinical Guidelines Clinical guidelines Low Caries Risk at LOW RISK for future dental caries. Your patient does not show any disease indicators or factors that predict dental caries in the immediate
Comparative Evaluation of Two Remineralizing Agents on Enamel around Orthodontic /jp-journals
 JIOS Comparative Evaluation of Two Remineralizing Agents on Enamel around Orthodontic 10.5005/jp-journals-10021-1267 Brackets: An in vitro Study Original article Comparative Evaluation of Two Remineralizing
Tooth hypersensitivity and Dental erosion DR. KÁROLY BARTHA
 Tooth hypersensitivity and Dental erosion DR. KÁROLY BARTHA 2 Why Is Erosion an Issue Now? Changing dietary habits Higher consumption of acidic beverages (colas, sport drinks) Higher incidence of xerostomia
Root Surface Protection Simple. Effective. Important.
 GC Fuji VII / Fuji VII EP Root Surface Protection Simple. Effective. Important. Brush up your painting skills and help your patients Q&A Prof. Laurie Walsh University of Queensland lifestyle factors (frequency
Casein is the predominant
 CLINICAL PRACTICE CRITICAL REVIEW Clinical efficacy of casein derivatives A systematic review of the literature Amir Azarpazhooh, DDS, MSc; Hardy Limeback, BSc, PhD, DDS Casein is the predominant phosphoprotein
Examination and Treatment Protocols for Dental Caries and Inflammatory Periodontal Disease
 Examination and Treatment Protocols for Dental Caries and Inflammatory Periodontal Disease Dental Caries The current understanding of the caries process supports the shift in caries management from a restorative-only
IJCPD INTRODUCTION ABSTRACT /jp-journals
 IJCPD Reshma Rajan et al RESEARCH ARTICLE 10.5005/jp-journals-10005-1281 A Polarized Light Microscopic Study to Comparatively evaluate Four Remineralizing Agents on Enamel viz CPP-ACPF, ReminPro, SHY-NM
Comparative Analysis of Remineralizing Potential of Three Commercially Available Agents- An in Vitro Study
 IOSR Journal of Dental and Medical Sciences (IOSR-JDMS) e-issn: 2279-0853, p-issn: 2279-0861.Volume 16, Issue 2 Ver. III (February. 2017), PP 01-05 www.iosrjournals.org Comparative Analysis of Remineralizing
MODULE 15: ORAL HEALTH ACROSS THE LIFESPAN
 MODULE 15: ORAL HEALTH ACROSS THE LIFESPAN Oral Health Across the Lifespan MODULE 15: ORAL HEALTH ACROSS THE LIFESPAN Part 4: Oral Health and Older Adults Mark Wolff DDS, PhD Healthy People 2020 Objectives
Iowa Research Online. University of Iowa. Tanner Jay Clark University of Iowa. Theses and Dissertations. Spring Copyright 2010 Tanner Jay Clark
 University of Iowa Iowa Research Online Theses and Dissertations Spring 2010 The efficacy of ProSeal, SeLECT Defense, OrthoCoat, and Biscover LV resin sealants on the prevention of enamel demineralization
In vitro comparison of microabrasion, CPP-ACP, CPP-ACFP and combination therapies on the remineralization of white spot lesions
 Nova Southeastern University NSUWorks College of Dental Medicine Student Theses, Dissertations and Capstones College of Dental Medicine 1-1-2014 In vitro comparison of microabrasion, CPP-ACP, CPP-ACFP
stabilisation and surface protection
 Guiding the way to caries stabilisation and surface protection Fissure sealing MI restorations Pulp capping Hypersensitivity Protection Caries stabilisation Fuji Triage from GC. Temporary restorations
Topical versus systemic fluoride: which is more effective in preventing dental caries in high risk population?
 Boston University OpenBU Theses & Dissertations http://open.bu.edu Boston University Theses & Dissertations 2013 Topical versus systemic fluoride: which is more effective in preventing dental caries in
Overview: The health care provider explores the health behaviors and preventive measures that enhance children s oral health.
 Lesson 5: Prevention Overview: The health care provider explores the health behaviors and preventive measures that enhance children s oral health. Goals: The health care provider will be able to describe:
CARIES STABILIZATION AND TEMPORARY RESTORATION
 CARIES STABILIZATION AND TEMPORARY RESTORATION LEARNING OUTCOMES Justify the importance of caries stabilisation procedure in operative care. List and discuss the methods to stabilise caries ( include preventive
Minimal Intervention in Pediatric Dentistry
 10.5005/jp-journals-10026-1059 Sachin Gunda, Narendra Varma REVIEW ARTICLE Sachin Gunda, Narendra Varma ABSTRACT Dental caries is an infectious disease, identifying the risk factors and controlling them
OMNII Oral Pharmaceuticals
 Fluoride Varnish in a Pediatric Practice Created by W. Edward Gonzalez D.M.D. OMNII Oral Pharmaceuticals The Preventive Care Consultants OMNII Firsts In Dentistry OMNII Gel PerioMed white & brite FlossRx
Fluoride Release Rate from an Orthodontic Sealant and Its Clinical Implications
 Original Article Fluoride Release Rate from an Orthodontic Sealant and Its Clinical Implications Manal M. Soliman a ; Samir E. Bishara b ; James Wefel c ; Judi Heilman d ; John J. Warren e ABSTRACT The
OliNano Seal Professional prophylaxis for long-term protection
 Professional prophylaxis for long-term protection NEW The patented formula of silicone polymer NANO Technology General information Dental health is one of the main factors to maintain overall health, and
Effect of Casein Phosphopeptide amorphous Calcium. and Calcium Sodium Phosphosilicate
 IJCPD ORIGINAL ARTICLE Effect of CPP-ACP 10.5005/jp-journals-10005-1447 and Calcium Sodium Phosphosilicate Effect of Casein Phosphopeptide amorphous Calcium Phosphate and Calcium Sodium Phosphosilicate
Comparison of the Effect of Recaldent and Xylitol on the Amounts of Salivary Streptococcus Mutans
 Novelty in Biomedicine Original Article Comparison of the Effect of Recaldent and Xylitol on the Amounts of Salivary Streptococcus Mutans Shila Emamieh 1, Hossein Goudarzi 2, Alireza Akbarzadeh-Baghban
CARIES RISK ASSESSMENT FORM FOR AGE 0 TO 5 YEARS Instructions on reverse Patient Name: I.D. # Age Date Initial/baseline exam date Recall/POE date
 CARIES RISK ASSESSMENT FORM FOR AGE 0 TO 5 YEARS Instructions on reverse Patient Name: I.D. # Age Date Initial/baseline exam date Recall/POE date Respond to each question in sections 1, 2, and 3 with a
DENTAL CLINICS OF NORTH AMERICA. Emmiam. Incipient and Hidden Caries. GUEST EDITOR Daniel W. Boston, DMD. October 2005 Volume49 Number4
 DENTAL CLINICS OF NORTH AMERICA Incipient and Hidden Caries GUEST EDITOR Daniel W. Boston, DMD October 2005 Volume49 Number4 Emmiam An Imprint of Elsevier, Inc. PHILADELPHIA LONDON TORONTO MONTREAL SYDNEY
RISK FACTORS BY AGE (Wandera et al. 2000)
") RISK ASSESSMENT Stacey Lubetsky DMD ST. BARNABAS HOSPITAL RISK ASSESSMENT The primary thrust of early risk assessment is to screen for parent-infant groups who are at risk of ECC and would benefit from
RISK ASSESSMENT Stacey Lubetsky DMD ST. BARNABAS HOSPITAL RISK ASSESSMENT The primary thrust of early risk assessment is to screen for parent-infant groups who are at risk of ECC and would benefit from
Pamela P. Lombardo, D.D.S. Proposed Orthodontic Treatment
 Pamela P. Lombardo, D.D.S. Proposed Orthodontic Treatment : Patient Name: Responsible Party: Length of Treatment months Treatment Plan Total $ Less Initial Payment $ Less Estimated Insurance $ Balance
Food, Nutrition & Dental Health Summary
 By Liz Pearson, RD www.lizpearson.com Food, Nutrition & Dental Health Summary Canadian Health Measures Survey (2007 to 2009) 57% of 6 11 year olds have or have had a cavity 59% of 12 19 year olds have
Index. , 66 Novamin, 66 TCP ACP. , 66 Bisphenol A (BPA), 114, 119 Byzantium diet, 87, 89
, 114, 119 Byzantium diet, 87, 89") A Acidulated phosphate fluoride (APF), 61 Adolescence aesthetic disturbance, 169 172 enamel carious lesions, orthodontic patients, 168 172 physical and sexual maturation, 168 Adulthood, 171 174 Advanced
A Acidulated phosphate fluoride (APF), 61 Adolescence aesthetic disturbance, 169 172 enamel carious lesions, orthodontic patients, 168 172 physical and sexual maturation, 168 Adulthood, 171 174 Advanced
The Changing Face of Dental Hygiene Practice: Expert clinician, skilled motivator and preventive specialist
 The Changing Face of Dental Hygiene Practice: Expert clinician, skilled motivator and preventive specialist Speaker: Lil Caperila, RDH, BSDH, M.Ed. Lcaperila@premusa.com Course Outline: MODULE 1: Changing
DEPOSITS. Dentalelle Tutoring 1
 DEPOSITS Dentalelle Tutoring WWW.DENTALELLE.COM 1 PH SCALE WWW.DENTALELLE.COM 2 DENTAL CARIES Dental caries is a dynamic process that involves a susceptible tooth, cariogenic bacteria in dental plaque
2 during treatment... how to technique. How to handle white spot lesions associated with orthodontic treatment. Issue
 Issue 17 2013 How to handle white spot lesions associated with orthodontic treatment. 1 background... It is well recognised that the placement of fixed orthodontic appliances increases a patient s risk
Get in front of the 8 ball with the new Fuji VIII GP. The first auto-cure, resin reinforced glass ionomer restorative
 Get in front of the 8 ball with the new Fuji VIII GP The first auto-cure, resin reinforced glass ionomer restorative 8 reasons to choose Fuji VIII GP Auto-cure, resin reinforced glass ionomer restorative
Quantum Dental Technologies
 Quantum Dental Technologies Shining a new light on Dentistry Stephen H. Abrams, DDS Telephone: (416) 785-4547 748 Briar Hill Avenue Facsimile: (416) 785-7301 Toronto, Ontario Facsimile: (416) 265-6795
Fuji VII Fuji VII EP. For all-round protection
 Fuji VII Fuji VII EP For all-round protection Fuji VII and Fuji VII EP are purpose designed for: Protection of erupting molars Increasing rates of enamel hypomineralisation and childhood caries have amplified
Seniors Oral Care
 For information about oral health care, please contact the Ontario Dental Association at 416-922-3900 or visit www.youroralhealth.ca The Ontario Dental Association gratefully acknowledges UBC ELDERS Education,
Less is More-Incorporating Minimally Invasive Techniques into your Office Treatment Protocols
 Less is More-Incorporating Minimally Invasive Techniques into your Office Treatment Protocols By Daniel H Ward DDS 1080 Polaris Pkwy Ste 130 Columbus OH 43240 dward@columbus.rr.com September 27, 2015 Minimally
Management of initial caries lesions: Iowa survey
 University of Iowa Iowa Research Online Theses and Dissertations Spring 2017 Management of initial caries lesions: Iowa survey Amira Elgreatly University of Iowa Copyright 2017 Amira Elgreatly This thesis
Casein Phosphopeptide- Amorphous Calcium Phosphate (CPP-ACP): An adjuvant for Caries prevention
: An adjuvant for Caries prevention") Casein Phosphopeptide- Amorphous Calcium Phosphate (CPP-ACP): An adjuvant for Caries prevention Adarsh Kumar 1, Preeti 2, Sheetal 3, Ankita Piplani 4 1-Associate Professor, Department of Public Health
Casein Phosphopeptide- Amorphous Calcium Phosphate (CPP-ACP): An adjuvant for Caries prevention Adarsh Kumar 1, Preeti 2, Sheetal 3, Ankita Piplani 4 1-Associate Professor, Department of Public Health
Early Childhood Caries (ECC) KEVIN ZIMMERMAN DMD
 KEVIN ZIMMERMAN DMD") Early Childhood Caries (ECC) KEVIN ZIMMERMAN DMD What Is Early Childhood Caries? Early Childhood Caries (ECC) is a transmissible infectious process that affects children younger than age 6 and results
Early Childhood Caries (ECC) KEVIN ZIMMERMAN DMD What Is Early Childhood Caries? Early Childhood Caries (ECC) is a transmissible infectious process that affects children younger than age 6 and results
BioCoat Featuring SmartCap Technology
 R R Breakthrough! BioCoat Featuring SmartCap Technology The only bioactive pit and fissure sealant that provides relentless protection through daily release of fluoride, calcium and phosphate ions. Bioactive
Bacterial Plaque and Its Relation to Dental Diseases. As a hygienist it is important to stress the importance of good oral hygiene and
 Melissa Rudzinski Preventive Dentistry Shaunda Clark November 2013 Bacterial Plaque and Its Relation to Dental Diseases As a hygienist it is important to stress the importance of good oral hygiene and
Remineralisation of Enamel Subsurface Lesions with Casein Phosphopeptide - Amorphous Calcium Phosphate in Patients with Fixed Orthodontic Appliances
 BALKAN JOURNAL OF STOMATOLOGY ISSN 1107-1141 STOMATOLOGICAL SOCIETY Remineralisation of Enamel Subsurface Lesions with Casein Phosphopeptide - Amorphous Calcium Phosphate in Patients with Fixed Orthodontic
The Future of Dentistry Now in Your Hands Changes everything you know about traditional Composites, Glass Ionomers and RMGIs
 The Future of Dentistry Now in Your Hands Changes everything you know about traditional Composites, Glass Ionomers and RMGIs PULPDENT BioACTIVE Products for ProACTIVE Dentistry Advances in dental materials
We are IntechOpen, the world s leading publisher of Open Access books Built by scientists, for scientists. International authors and editors
 We are IntechOpen, the world s leading publisher of Open Access books Built by scientists, for scientists 3,350 108,000 1.7 M Open access books available International authors and editors Downloads Our
Margherita Fontana, DDS, PhD. University of Michigan School of Dentistry Department of Cariology, Restorative Sciences and Endodontics
 Margherita Fontana, DDS, PhD University of Michigan School of Dentistry Department of Cariology, Restorative Sciences and Endodontics Personalized Caries Management If evidence is limited, what can be
Diet and dental caries
 Prevention-- 5 th class Lect 1 1 Diet and dental caries The role diet and nutrition in the etiology and pathogenesis of caries may be viewed as systemic (nutrition) and local effect (diet) In general,
SmartCrown. The Cavity Fighting SmartCrown. Patient Education Booklet. SmartCrown.com Toll Free Local
 The Cavity Fighting SmartCrown SmartCrown Ca2+ SmartCrown.com Patient Education Booklet www.smartcrown.com support@smartcrown.com 800.255.2839 Toll Free 801.281.4012 Local 801.281.4022 Fax F- PO43- Origin
Silver Diamine Fluoride
 Silver Diamine Fluoride Introduction Dental caries is a multifactorial disease that results from an imbalance between pathological and protective factors. Common non-operative treatments for incipient
FIVE THINGS YOU NEED TO KNOW ABOUT GLASS IONOMERS
 FIVE THINGS YOU NEED TO KNOW ABOUT GLASS IONOMERS FIVE THINGS YOU NEED TO KNOW ABOUT GLASS IONOMERS Glass Ionomers Solve Clinicians Quandaries Amalgam fillings have been around for almost two centuries,
2012 Ph.D. APPLIED EXAM Department of Biostatistics University of Washington
 2012 Ph.D. APPLIED EXAM Department of Biostatistics University of Washington Background Dental caries is an infectious, transmissible bacterial disease that is a common childhood condition in the United
PERINATAL CARE AND ORAL HEALTH
 PERINATAL CARE AND ORAL HEALTH Lakshmi Mallavarapu, DDS Terry Reilly Health Services Boise, Idaho CE objectives Recognize the necessity of Oral Care during Perinatal Period Examine and assess teeth and
EVALUATION OF COLOR CHANGE IN WHITE SPOT LESIONS OF ENAMEL FLUOROSIS USING A RESIN INFILTRATE
 EVALUATION OF COLOR CHANGE IN WHITE SPOT LESIONS OF ENAMEL FLUOROSIS USING A RESIN INFILTRATE Monisha Singhal PG STUDENT DEPARTMENT OF PEDODONTICS & PREVENTIVE DENTISTRY CHANDRA DENTAL COLLEGE & HOSPITAL
Caries Risk Assessment and Prevention
 Caries Risk Assessment and Prevention Introduction of the disease, prevalence and global impact Dental caries is the most common dental disease that requires restorative treatment. In 2010, the Global
A Modern Paradigm for Caries Management, Part 1:
 A Modern Paradigm for Caries Management, Part 1: Diagnosis and Treatment Authored by Steven Steinberg, DDS Upon successful completion of this CE activity 1 CE credit hour may be awarded Course No. 86.1
Everyday Relief. Everyday Protection.
 Everyday Relief. Everyday Protection. CLINICAL RESULTS ON BACK! A Targeted Approach to Practice Building! Treats Sensitivity Soothes & Moisturizes Dry Mouth Tissues Helps to Prevent Caries & Gingivitis
The Cavity Fighting ProActive Crown
 The Cavity Fighting ProActive Crown Powered by Ketac Nano Patient Education Booklet www.proactivedentist.com support@proactivedentist.com 800.255.2839 Toll Free 801.281.4012 Local 801.281.4022 Fax Origin
Effects of miswak and nano calcium carbonate toothpastes on the hardness of demineralized human tooth surfaces
 Journal of Physics: Conference Series PAPER OPEN ACCESS Effects of miswak and nano calcium carbonate toothpastes on the hardness of demineralized human tooth surfaces To cite this article: F Dianti et
Anthology of Applications Professor Laurie Walsh University of Queensland
 Anthology of Applications Professor Laurie Walsh University of Queensland 02 INTRODUCTION GC Tooth Mousse and MI Paste Plus are based on Recaldent (CPP-ACP) technology. The same technology can be put into
journal of dentistry 41s (2013) s35 s41 Available online at journal homepage:
 s35 s41 Available online at journal homepage:") Available online at www.sciencedirect.com journal homepage: www.intl.elsevierhealth.com/journals/jden Comparing the efficacy of a dentifrice containing 1.5% arginine and 1450 ppm fluoride to a dentifrice
Available online at www.sciencedirect.com journal homepage: www.intl.elsevierhealth.com/journals/jden Comparing the efficacy of a dentifrice containing 1.5% arginine and 1450 ppm fluoride to a dentifrice
Molar Hypomin. A silent epidemic damaging. 1 in 6 children s teeth
 A silent epidemic damaging * 1 in 6 children s teeth Q&A Prof. David John Manton BDSc MDSc PhD FRACDS FICD FADI Elsdon Storey Chair of Child Dental Health Melbourne Dental School, University of Melbourne
BioCoat Featuring SmartCap Technology
 new! BioCoat Featuring SmartCap Technology Premier s new bioactive pit and fissure sealant provides relentless protection, outstanding adhesion and extended fluoride release. Bioactive Release - Uptake
Caries Prevention and Management: A Medical Approach. Peter Milgrom, DDS
 Caries Prevention and Management: A Medical Approach Peter Milgrom, DDS Minimally Invasive Treatments Infection control Tissue preservation Hand instruments Adhesive materials such as GI Allow for pulpal
Is there any clinical evidence?
 Current treatment objectives Anticariogenic capacity of restorative materials in paediatric dentistry: in vitro evidence vs. clinical efficiency Prof. Lisa Papagianoulis Restoration with minimal intervention
Ivoclar Vivadent. Professional Care Program. Oral health management A system of solutions
 Ivoclar Vivadent Professional Care Program Oral health management A system of solutions Ivoclar Vivadent Oral health management Contents CRT Bacteria Makes bacteria visible CRT Bacteria healthy mouth healthy
Use of Fluoride Products for Young Patients at High Risk of Dental Caries
 Peer-Reviewed and Indexed of Continuing Education in Dentistry Use of Fluoride Products for Young Patients at High Risk of Dental Caries Theodore P. Croll, DDS; and Joel H. Berg, DDS, MS SEPTEMBER 2014
Effect of Three Different Remineralizing Agents on White Spot Lesions; AnIn Vitro Comparative Study
 Original Article Effect of Three Different Remineralizing Agents on White Spot Lesions; AnIn Vitro Comparative Study S. Tahmasbi 1, M. Adhami 2, A. Valian 3, R. Hamedi 4. 1 Assistant Professor, Department