Identified proteins interacting with TMBIM1 by mass spectrometry
|
|
|
- Benedict Neal
- 5 years ago
- Views:
Transcription
1 Supplementary Information Journal: Nature Medicine Article Title: Corresponding Author: A novel multivesicular body regulator TMBIM1 protects against non-alcoholic fatty liver disease in mice and monkeys by targeting TLR4 for lysosomal degradation Hongliang Li Supplementary Item & Number Supplementary Figure 1 Supplementary Figure 2 Supplementary Figure 3 Supplementary Figure 4 Supplementary Figure 5 Supplementary Figure 6 Supplementary Figure 7 Supplementary Figure 8 Supplementary Figure 9 Supplementary Figure 10 Supplementary Figure 11 - Figure 25 Supplementary Table 1 Supplementary Table 2 Supplementary Table 3 Supplementary Table 4 Supplementary Table 5 Title or Caption Tmbim1 deletion exacerbates metabolic abnormalities and hepatic steatosis Tmbim1 deletion directly exacerbates hepatocyte inflammation Tmbim1 attenuates metabolic disorders and hepatic steatosis TMBIM1 promotes TLR4 protein degradation The exacerbating function of Tmbim1 deletion in NAFLD requires TLR4 hyper-activation TMBIM1 inhibits NAFLD development dependent on TLR4 degradation TMBIM1 promotes lysosomal degradation of TLR4 by facilitating MVB formation The function of Tmbim1 is dependent on its ubiquitination AAV8-mediated hepatic Tmbim1 overexpression alleviates hepatic steatosis and related metabolic disorders in ob/ob mice Effects of AAV8-mediated hepatic TMBIM1 overexpression on pathophysiological characteristics of monkeys Original uncropped gels of representative Western blot images The clinical information and histologic features of subjects included in this study Primers for qpcr detection Primers for mouse generation Primers for plasmid construction Identified proteins interacting with TMBIM1 by mass spectrometry

2 Supplementary Figure 1. Tmbim1 deletion exacerbates metabolic abnormalities and hepatic steatosis. (a) Schematic representation of the targeting strategy to generate Tmbim1 conditional
3 allele. Two single-guide RNA (sgrna) target sites (oval) in intron 2 and intron 3 were designed. The targeting construct consists of two loxp sites (thick black arrow) surrounding exon 3 flanked by 2 homology arms. (b) In vitro Cre/loxP-mediated recombination of Tmbim1 conditional allele. The genomic DNA of 3 founder mice (#5, #23 and #28) were incubated with Cre recombinase. Upon Cre-dependent excision, primers Tmbim1-P1 and Tmbim1-P2 detect deletion products, whereas Tmbim1-P3 and Tmbim1-P4 detect circular molecule. The position of each primer is shown in (a). (c) PCR-based genotyping of wild-type (+/+), Tmbim1 loxp/+ (Fl/+) and Tmbim1 loxp/loxp (Fl/Fl). The wild-type (WT) allele yields an amplicon of 128 bp, whereas the floxed allele yields an amplicon of 193 bp. (d) Representative Western blot showing protein expression of Tmbim1 in the livers, muscles, fats and hearts of Tmbim1 loxp/loxp (Tmbim1-Flox) and hepatocyte-specific Tmbim1-knockout (Tmbim1-HepKO) mice. (e) Intraperitoneal glucose tolerance test (GTT) (left), insulin tolerance test (ITT) (middle) and pyruvate tolerance test (PTT) (right) were performed on Tmbim1-Flox and Tmbim1-HepKO mice after high fat diet (HFD) administration for 22 weeks (For each test, n = 16 in each group). (f) Left panel, representative Western blot showing phosphorylated and total Irs1, Akt and Gsk3β expression levels in the livers of Tmbim1-Flox and Tmbim1-HepKO mice that were fed a NCD or HFD for 24 weeks and received intraperitoneal insulin treatment. Right panel, the protein levels were normalized to (n = 3 in each group without insulin injection, n = 9 in each group with insulin injection). n = 3 Western blot in total. (g) Representative Periodic acid-schiff (PAS)-stained images of livers samples from Tmbim1-Flox and Tmbim1-HepKO mice after 24 weeks of HFD consumption (n = 8 in each group). Scale bar, 50 μm. (h) The glycogen content levels in livers of Tmbim1-Flox and Tmbim1-HepKO mice after 24 weeks of HFD or NCD consumption (n = 12 in NCD group, n = 16 in HFD group). (i) Pepck, G6pc and Pgc1-α mrna expression levels in livers of mice in the indicated groups as measured by qpcr analyses (n = 4 in each group). Gene expression was normalized to -encoding gene Actb mrna levels. (j) The body weight of Tmbim1-Flox and Tmbim1-HepKO mice fed either an NCD or HFD for 24 weeks (n = 12 in each NCD group, n = 16 in HFD group). (k) Hepatic triglyceride (TG) and non-esterified fatty acid (NEFA) contents of mice in the indicated groups (n = 12 in each NCD group, n = 16 in HFD group). (l) qpcr analysis of Tnf-α, Il-1β, Il-6, Ccl2, Ccl5, Cxcl2, Cxcl9 and Cxcl10 expression levels in liver samples from Tmbim1-Flox and Tmbim1-HepKO mice after 4 weeks of NCD or HFD consumption (n = 4 mice in each group). Gene expression was normalized to -encoding gene Actb mrna levels. (m) Left panel, the representative immunofluorescence images of Cd68-(upper) and Mac1-(bottom) positive cell infiltration in liver samples of Tmbim1-Flox and Tmbim1-HepKO mice at 4 weeks after HFD consumption. Right panel, quantification of the total number of positive cells in 10 high power fields (HPF) for each group (n = 6 in each group). Scale bars, 20 μm. (n) Serum Tnf-α, Il-1β, Il-6, Ccl2 and Il-10 levels in Tmbim1-Flox and Tmbim1-HepKO mice fed a NCD or HFD for 4 weeks (n = 12 in each NCD group, n = 16 in HFD group). (o) Representative hematoxylin and eosin (H&E; left) and Cd68 immunohistochemistry (right) staining of white adipose tissue sections from Tmbim1-Flox and Tmbim1-HepKO mice after HFD consumption for 4 or 24 weeks (n = 8 in each group). Scale bar, 100 μm. (p) qpcr analysis of Tnf-α, Il-1β, Il-6, Ccl2,
4 Ccl5, Cxcl2, Cxcl9 and Cxcl10 expression levels in white adipose tissue samples from Tmbim1-Flox and Tmbim1-HepKO mice after 4 (left) or 24 (right) weeks of NCD or HFD consumption (n = 4 in each group). Gene expression was normalized to -encoding gene Actb mrna levels. For statistical plots, data are mean s.e.m; *P < 0.05; **P < 0.01; n.s. indicates no significant difference; by 2-tailed Student s t-test (e,f,i,m); by one-way ANOVA with Bonferroni post hoc analysis (h,j-l,n,p).
 The representative immunofluorescence images of anti-hnf4-stained primary hepatocytes")
5 Supplementary Figure 2. Tmbim1 deletion directly exacerbates hepatocyte inflammation. (a) The representative immunofluorescence images of anti-hnf4-stained primary hepatocytes (left) and
6 anti-cd68-stained primary hepatic inflammatory cells (right). Scale bar, 20 μm. (b,c) qpcr analysis for expression levels of inflammation-related genes in isolated primary hepatocytes (b) and Cd68-positive cells (c) from mice in the indicated groups after HFD consumption for 20 weeks. Gene expression was normalized to 18S rrna levels. (d) qpcr analysis of TNF-α, IL-1β, IL-6, IL-8 and CCL2 expression levels in L02 cells with knockdown of TMBIM1 after LPS (1 μg ml -1 ) treatment for indicated time points. Gene expression was normalized to 18S rrna levels. (e) The concentrations of IL-1β and CXCL10 in the medium of L02 cells with knockdown of TMBIM1 after LPS (1 μg ml -1 ) treatment. (f) The concentrations of Tnf-α, Ccl2 and Cxcl10 in the culture medium of primary hepatocytes that were isolated from Tmbim1-Flox and Tmbim1-HepKO mice. The hepatocytes were first challenged by PA (0.4 mm) for 12 h followed by incubated with fresh DMEM without palmitate for an additional 12 h. The medium was then collected for ELISA assay. (g) qpcr analysis of Tnf-α, Il-1β and Il-6 expression levels in Raw264.7 cells incubated with culture medium from (f). Gene expression was normalized to 18S rrna levels. n.d. indicates not detected. (h) Release of Tnf-α, Ccl2 and Cxcl10 from Raw264.7 cells incubated with the medium from (f). For a-g, n = 4 independent experiments. (i) Representative TUNEL staining images of liver sections from Tmbim1-Flox and Tmbim1-HepKO mice after HFD consumption for 4 weeks (n = 6 in each group). Scale bar, 20 μm. (j) Serum levels of ALT and AST of Tmbim1-Flox and Tmbim1-HepKO mice fed a NCD or HFD for 4 weeks (n = 12 in each NCD group, n = 16 in each HFD group). For statistical plots, data are mean s.e.m; *P < 0.05; **P < 0.01; n.s. indicates no significant difference; by one-way ANOVA with Bonferroni post hoc analysis (b,c,j); by 2-tailed Student s t-test (d-h)

7
 Representative Western blot showing protein expression of Tmbim1 in the livers, muscles,")
8 Supplementary Figure 3. Tmbim1 attenuates metabolic disorders and hepatic steatosis. (a) Representative Western blot showing protein expression of Tmbim1 in the livers, muscles, fats or
9 hearts of WT and hepatocyte-specific Tmbim1-transgenic (Tmbim1-HepTg) mice (n = 3 in each group). n = 3 Western blot in total. (b) Fasting blood glucose levels (left) and fasting serum insulin levels (right) in WT and Tmbim1-HepTg mice fed either a NCD or HFD for 0 or 24 weeks (n = 10 in each NCD group, n = 12 in each HFD group). (c) The blood glucose levels of mice in the indicated groups subjected to intraperitoneal glucose tolerance test (GTT) (left), insulin tolerance test (ITT) (middle) and pyruvate tolerance test (PTT) (right) after HFD administration for 22 weeks (For each test, n = 10 in each group). (d) Left panel, representative Western blot showing phosphorylated and total Irs1, Akt and Gsk3β expression levels in the livers of WT and Tmbim1-HepTg mice that were fed a HFD for 24 weeks. Right panel, the protein levels were normalized to (n = 3 in each group without insulin injection, n = 9 in each group with insulin injection). (e) Representative Periodic acid-schiff (PAS)-stained images of liver samples from WT and Tmbim1-HepTg mice after 24 weeks of HFD consumption (n = 8 in each group). Scale bar, 50 μm. (f) The glycogen content levels in livers of WT and Tmbim1-HepTg mice after 24 weeks of NCD or HFD consumption (n = 10 in each NCD group, n = 12 in each HFD group). (g) Pepck, G6pc and Pgc1-α mrna expression levels in livers of mice in the indicated groups as measured by qpcr analyses (n = 4 mice in each group). Gene expression was normalized to -encoding gene Actb mrna levels. (h) The body weight of WT and Tmbim1-HepTg mice fed either an NCD or HFD for 24 weeks (n = 10 in each NC group, n = 12 in each HFD group). (i) The ratio of liver weight to body weight (LW/BW; %) of WT and Tmbim1-HepTg mice fed either an NCD or HFD for 24 weeks (n = 10 in each NCD group, n = 12 in each HFD group). (j) Left panel, representative 18-fluoro-6-deoxy-D-glucose (FDG)-positron emission tomography (PET) images of WT and Tmbim1-HepTg mice after HFD consumption for 24 weeks. Right panel, quantitation of liver FDG uptake as indicated by standardized uptake value (SUV) (n = 8 in each group at each time points). SUV was calculated by dividing the mean FDG activity by the injected dose and the animal weight. Scale bar, 10 mm. (k) Representative hematoxylin and eosin (H&E; left) and oil red O (right) staining of liver sections from WT and Tmbim1-HepTg mice after HFD consumption (n = 8 in each group). Scale bar, 50 μm. (l) Hepatic TG and NEFA contents of mice in the indicated groups (n = 10 in each NCD group, n = 12 in each HFD group). (m) qpcr analysis of Tnf-α, Il-1β, Il-6, Ccl2, Ccl5, Cxcl2, Cxcl9 and Cxcl10 expression levels in liver samples from WT and Tmbim1-HepTg mice after 4 (upper) or 24 (bottom) weeks of NCD or HFD consumption (n = 4 in each group). Gene expression was normalized to -encoding gene Actb mrna levels. (n) The representative immunofluorescence images of Cd68- and Mac1-positive cell infiltration in liver samples of WT and Tmbim1-HepTg mice at 4 (upper) or 24 (bottom) week after HFD consumption. Bottom panel, quantification of the total number of positive cells in 10 high power fields (HPF) for each group (n = 6 in each group). Scale bars, 20 μm. (o) Upper panel, representative Western blot of phosphorylated and total Ikkβ, Iκbα and p in liver samples from WT and Tmbim1-HepTg mice after 24 weeks of either NCD or HFD consumption. Bottom panel, protein levels were normalized to (n = 3 Western blot in total for each protein band; n = 6 mice for each group). (p) Serum Tnf-α, Il-1β, Il-6, Ccl2 and Il-10 levels in WT and Tmbim1-HepTg mice fed a NCD or HFD for 4 (upper) or 24 (bottom) weeks (n = 10 in
10 each NCD group, n = 12 in each HFD group). (q) Representative hematoxylin and eosin (H&E; left) and Cd68 immunohistochemistry (right) staining of liver sections from WT and Tmbim1-HepTg mice after HFD consumption for 4 (upper) or 24 (bottom) weeks (n = 8 in each group). Scale bar, 100 μm. (r) qpcr analysis of Tnf-α, Il-1β, Il-6, Ccl2, Ccl5, Cxcl2, Cxcl9 and Cxcl10 expression levels in white adipose tissue (WAT) samples from WT and Tmbim1-HepTg mice after 4 (upper) or 24 (bottom) weeks of NCD or HFD consumption (n = 4 mice in each group). Gene expression was normalized to -encoding gene Actb mrna levels. (s) Left panel, representative TUNEL staining images of liver sections from WT and Tmbim1-HepTg mice after HFD consumption after 4 or 24 weeks (n = 6 in each group). Scale bar, 20 μm. Right panel, quantitative percentage of TUNEL-positive cells in 24W groups. White arrows highlight positive cells. (t) Serum levels of ALT and AST of WT and Tmbim1-HepTg mice fed a NCD or HFD for 4 (left) or 24 (right) weeks (n = 10 in each NCD group, n = 12 in each HFD group). For statistical plots, data are mean s.e.m; *P < 0.05; **P < 0.01; n.s. indicates no significant difference; by one-way ANOVA with Bonferroni post hoc analysis (b,f,h,i,l,m,p,r,t); by 2-tailed Student s t-test (c,d,g,j,n,o,s).

11
12 Supplementary Figure 4. TMBIM1 promotes TLR4 protein degradation. (a) qpcr analysis of the expression of the indicated genes in liver samples from Tmbim1-Flox and Tmbim1-HepKO mice after 24 weeks of HFD consumption (n = 4 mice in each group). (b) qpcr analysis of the expression of the indicated genes in liver samples from WT and Tmbim1-HepTg mice after 24 weeks of HFD consumption (n = 4 mice in each group). For a and b, gene expression was normalized to -encoding gene Actb mrna levels. (c) qpcr analysis of Tlr4 expression before and after LPS (2 µg ml -1 ) treatments in primary hepatocytes isolated from Tmbim1-Flox and Tmbim1-HepKO mice (left) or from WT and Tmbim1-HepTg (right) mice. The results represent three independent experiments. (d) qpcr analysis of TLR4 expression before and after LPS (100 ng ml -1 ) treatments in 293-TLR4 cells with TMBIM1 knockdown (left) or overexpression (right). For c and d, gene expression was normalized to 18S rrna levels. The results represent three independent experiments. (e) Representative Western blot of Tlr4 expression in liver samples from WT and Tmbim1-HepTg mice after 24 weeks of either NCD or HFD consumption (n = 8 in each group). (f) Representative Western blot of Tlr4 expression before and after LPS (2 µg ml -1 ) treatments of primary hepatocytes isolated from Tmbim1-Flox or Tmbim1-HepKO mice and from WT or Tmbim1-HepTg mice. (g) Representative Western blot of TLR4 expression before and after LPS (100 ng ml -1 ) treatments of 293-TLR4 cells with TMBIM1 knockdown (upper) or overexpression (bottom) in the presence of cycloheximide (50 µg ml -1 ). (h) Representative Western blot of p-erk1/2, p-jnk1/2, p-p38, p-iκbα and Iκbα in primary hepatocytes isolated from Tmbim1-Flox or Tmbim1-HepKO mice and treated
13 with LPS (2 µg ml -1 ) for the indicated time points. (i,j) Representative Western blot of p-erk1/2, p-jnk1/2, p-p38, p-iκbα and IκBα after LPS (100 ng ml -1 ) treatment for the indicated time points of 293-TLR4 cells with either knockdown (i) or overexpression (j) of TMBIM1. (k) qpcr analysis of Tnf-α, Il-1β, Il-6 and Cox-2 expression levels in primary hepatocytes isolated from Tmbim1-Flox or Tmbim1-HepKO mice and treated with LPS (2 µg ml -1 ) for the indicated time points. The results represent three independent experiments. Gene expression was normalized to 18S rrna levels. (l,m) qpcr analysis of TNF-α, IL-8, CCL2 and COX-2 expression levels in 293-TLR4 cells with knockdown (l) or overexpression (m) of TMBIM1 after LPS (100 ng ml -1 ) treatment for indicated time points. The results represent three independent experiments. Gene expression was normalized to 18S rrna levels. (n) The NF- B luciferase activity in 293T cells and 293-TLR4 cells after LPS (100 ng ml -1 ) treatment for 6 h. For f-n, the results represent three independent experiments. For statistical plots, data are mean s.e.m; *P < 0.05; **P < 0.01; n.s. indicates no significant difference; by 2-tailed Student s t-test.

14 Supplementary Figure 5. The exacerbating function of Tmbim1 deletion in NAFLD requires TLR4 hyper-activation. (a) Schematic representation of the targeting strategy to generate Tlr4
15 conditional allele. Two sgrna target sites (oval) in intron 1 and intron 2 were designed. The targeting construct consists of two loxp sites (thick black arrow) surrounding exon 2 flanked by 2 homology arms. (b) In vitro Cre/loxP-mediated recombination of Tlr4 conditional allele. The genomic DNA of 2 founder mice were incubated with Cre recombinase. Upon Cre-dependent excision, primers TLR4-P1 and TLR4-P2 detect deletion products, whereas TLR4-P3 and TLR4-P4 detect circular molecule. The position of each primer is shown in (a). (c) PCR-based genotyping of wild-type (+/+), Tlr4 loxp/+ (Fl/+) and Tlr4 loxp/loxp (Fl/Fl). The WT allele yields an amplicon of 191 bp, whereas the floxed allele yields an amplicon of 258 bp. (d) Representative Western blot of Tmbim1 and Tlr4 expression in the liver samples of indicated group fed a HFD for 0 (upper) or 24 (bottom) weeks (n = 6 in each group). n = 3 Western blot in total. (e) The blood glucose levels of mice in the indicated groups subjected to intraperitoneal glucose tolerance test (GTT) and insulin tolerance test (ITT) at 22 weeks of HFD administration (For each test, n = 10 in each group). *P < 0.05 between Tmbim1-HepKO HFD and Flox HFD group; ## P < 0.01 between DKO HFD group and Tmbim1-HepKO group; (f) Left panel, representative Western blot of phosphorylated and total Irs1 and Akt levels in the livers of the indicated groups that received intraperitoneal insulin treatment. Right panel, protein levels were normalized to (n = 6 in each group). n = 3 Western blot. (g) The body weight of indicated groups fed a HFD for 24 weeks (n = 10 in each group). (h) The ratio of liver weight to body weight (LW/BW; %) of indicated groups fed a HFD for 24 weeks (n = 10 in each group). (i) Hepatic TG and NEFA contents of mice in the indicated groups (n = 10 in each group). (j) Serum Tnf-α, Il-1β, Il-6 and Ccl2 levels in the indicated groups fed a HFD for 24 weeks (n = 10 in each group). (k) Representative TUNEL staining images of liver sections from indicated mice after 24 weeks of HFD consumption (n = 6 in each group). White arrows highlight positive cells. Scale bar, 20 μm. (l) Serum levels of ALT and AST of mice in the indicated groups (n = 10 in each group). For statistical plots, data are mean s.e.m; *P < 0.05; **P < 0.01; n.s. indicates no significant difference; by one-way ANOVA with Bonferroni post hoc analysis (e-l).
 Representative Western blot of Tmbim1 and Tlr4 expression in the liver samples of indicated groups (n = 6 in each group).")
16 Supplementary Figure 6. TMBIM1 inhibits NAFLD development dependent on TLR4 degradation. (a) Representative Western blot of Tmbim1 and Tlr4 expression in the liver samples of indicated groups (n = 6 in each group). (b) The body weight of indicated groups at 24 weeks of HFD feeding (n = 10 in each group). (c) The ratio of liver weight to body weight (LW/BW; %) of
17 indicated groups at 24 weeks of HFD feeding (n = 10 in each group). (d) Representative TUNEL staining images of liver sections from indicated groups after 24 weeks of HFD consumption (n = 6 in each group). White arrows highlight positive cells. Scale bar, 20 μm. (e) Serum levels of ALT and AST of indicated groups at 24 weeks of HFD feeding (n = 10 in each group). (f) Representative Western blot of HA-TMBIM1, FLAG-TLR4, constitutively active TLR4, p-erk1/2, p-jnk1/2, p-p38, p-iκbα and IκBα in L02 cells transfected with the indicated plasmid after PA (0.4 mm) treatment. catlr4 indicates constitutively active TLR4, with deletion of extracellular portion of TLR4 (aa 1-620). (g) Representative Western blot showing phosphorylated and total IRS1 and AKT expression levels in insulin stimulated L02 cells transfected with the indicated plasmid after PA (0.4 mm) treatment. (h) qpcr analysis of TNF-α, IL-6 and CCL2 expression levels in L02 cells transfected with the indicated plasmid after PA (0.4 mm) treatment. Gene expression was normalized to 18S rrna levels. For f-h, n = 3 independent experiments. For all statistical blot, data are mean s.e.m; *P < 0.05; **P < 0.01; n.s. indicates no significant difference; by one-way ANOVA with Bonferroni post hoc analysis (b,c,e); by 2-tailed Student s t-test (h).

18 Supplementary Figure 7. TMBIM1 promotes lysosomal degradation of TLR4 by facilitating MVB formation. (a) Representative Western blot of TLR4 expression before and after LPS (1 µg
19 ml -1 ) treatments for 2 h in Huh7 cells with TMBIM1 knockdown or overexpression in the presence of cycloheximide (50 µg ml -1 ). (b) Representative confocal microscopy images showing LPS-Cy5 distribution in Huh7 cells infected with empty vector or TMBIM1 lentivirus. Red indicate LPS-Cy5, green indicate lysotracker. Scale bar, 20 μm. (c) Representative confocal microscopy images showing colocalization of TMBIM1 (green) and TSG101 (red) in HeLa cells infected with lentivirus expressing GFP-TMBIM1 and Cherry-TSG101. Scale bar, 20 μm. (d) Co-immunoprecipitation assay showing the interaction of TMBIM1 with HRS in 293T cells after transfection with HA-HRS and FLAG-TMBIM1 plasmid. (e) Representative confocal microscopy images showing colocalization of TMBIM1 (green) and HRS (red) in HeLa cells infected with lentivirus expressing GFP-TMBIM1 and HRS-Cherry. Scale bar, 20 μm. (f) Co-immunoprecipitation assay in 293T cells transfected with the indicated combinations of HA-HRS, FLAG-TSG101 or Myc-TMBIM1 showing HRS co-immunoprecipitates more TGS101 with TMBIM1 overexpression (highlighted by red arrow). (g) Representative Western blot of total and phosphorylated epidermal growth factor receptor (EGFR) levels in Hela cells with TMBIM1 knockdown after EGF treatment (100 ng ml -1 ) for the indicated time points. (h) Representative Western blot of TLR4 expression before and after LPS (100 ng ml -1 ) treatments of 293-TLR4 cells for 2 h with overexpression of GFP, TMBIM1 or TMBIM1 ΔPSAP in the presence of cycloheximide (50 µg ml -1 ). The TMBIM1 PSAP indicates TMBIM1 with deletion of the PSAP motif. Anti-FLAG signal indicates expression of FLAG-TMBIM1 or FLAG-TMBIM1 PSAP. (i) Western blot of p-erk1/2, p-jnk1/2, p-p38, p-i B and I B levels after LPS (100 ng ml -1 ) treatment of 293-TLR4 cells with overexpression of GFP, TMBIM1 or TMBIM1 ΔPSAP. (j) qpcr analysis of TNF- IL-8 and CCL2 levels after LPS (100 ng ml -1 ) treatment of 293-TLR4 cells with overexpression of GFP, TMBIM1 or TMBIM1 ΔPSAP. Gene expression was normalized to 18S rrna levels. For a-j, the results represent three independent experiments. (k) Left panel, representative transmission electron microscopy (TEM) images showing multivesicular bodies (MVBs) and intraluminal vesicles (ILVs) in WT MEF infected with empty vector control or Tmbim1 ΔPSAP lentivirus. MVBs are highlighted by red arrowheads. Right panel, (upper) quantification of MVB numbers in 30 fields per condition. Each dot represents the number of MVBs per section; (bottom) quantification of ILV numbers per MVB. Each dot represents the number of ILVs per MVB (n = 30). Scale bar, 2 μm. (l) Representative Western blot showing the protein expression of Tlr4, p-erk1/2, p-jnk1/2, p-p38, p-i b and I b in the liver samples of WT, Tmbim1-HepTg and Tmbim1 ΔPSAP -HepTg mice after 24 weeks of HFD consumption (n = 6 in each group). n = 3 Western blot. (m) Hepatic TG and NEFA contents of WT, Tmbim1-HepTg and Tmbim1 ΔPSAP -HepTg mice after 24 weeks of HFD consumption (n = 10 in WT and Tmbim1 ΔPSAP -HepTg mice, n = 12 in Tmbim1-HepTg mice). Data are mean s.e.m; **P < 0.01; n.s. indicates no significant difference; by one-way ANOVA with Bonferroni post hoc analysis (j,m); by 2-tailed Student s t-test (k).

20

21 Supplementary Figure 8. The function of Tmbim1 is dependent on its ubiquitination. (a) HA-Ub was cotransfected with His-Tmbim1, His-Tmbim1 (4KR) or His-Tmbim1 (7KR) in 293T cells as indicated. His-tagged Tmbim1 was pulled down with Ni-NTA beads and subjected to immunoblotting against HA-tag to detect ubiquitinated Tmbim1. 4KR indicate the 4 sites mutation of Tmbim1 (K91, K126, K211 and K275). 7KR indicates that all 7 lysine sites were mutated to arginine. (b) Co-immunoprecipitation assays showing the interaction of Tmbim1/Tmbim1 ΔUb with Tsg101 in 293T cells transfected with the indicated plasmid. (c) Representative colocalization images (yellow) of Tmbim1/Tmbim1 ΔUb (green) and LAMP2 (red) in HeLa cells infected with lentivirus expressing GFP-Tmbim1 or GFP-Tmbim1 ΔUb. Scale bar, 20 μm. Tmbim1 ΔUb indicates Tmbim1 with 4 ubiquitination sites (K91, K126, K211 and K275) mutated. (d) Coomassie Brilliant Blue-stained gel of the GST-Tmbim1 fusion protein (amino acids 1-94) purified from E. coli with glutathione-sepharose beads. (e) Silver-stained gel of a pull-down from cell lysates using GST-Tmbim1 (amino acids 1-94). (f) Co-immunoprecipitation assays showing the interaction of Tmbim1 with Nedd4 in 293T cells after transfection with indicated plasmids. (g) His-tagged Tmbim1 and HA-Ub were cotransfected into 293T cells infected with either shgfp or shnedd4l lentivirus as indicated. His-tagged Tmbim1 was pulled down with Ni-NTA beads and subjected to immunoblotting against HA-tag to detect ubiquitinated Tmbim1. (h) The interaction domains of Nedd4l with Tmbim1 were explored using WT and mutated Nedd4l expression constructs based on co-immunoprecipitation assays. Nedd4l(C2), Nedd4l(WW) and Nedd4l(HECT) indicate the C2, WW and HECT domain of Nedd4l, respectively. Nedd4l( C2) and Nedd4l( HECT) indicate Nedd4l with C2 and HECT domain deletion, respectively. (i) Representative confocal microscopy images showing the colocalization (yellow) of Tmbim1 (green) and Nedd4l (red) in HeLa cells infected with lentivirus expressing GFP-Tmbim1 and Nedd4l-Cherry. Scale bar, 20 μm. (j) Representative Western blot of TLR4 expression before and after LPS (100 ng ml -1 ) treatments of 293-TLR4 cells for 2 h with overexpression of GFP, Tmbim1 or Tmbim1 ΔUb in the presence of cycloheximide (50 µg ml -1 ). Anti-FLAG signal indicates expression of FLAG-TMBIM1 or FLAG-Tmbim1 ΔUb. (k) Representative Western blot of p-erk1/2, p-jnk1/2, p-p38, p-i B and I B after LPS (100 ng
22 ml -1 ) treatment for indicated time points of 293-TLR4 cells with overexpression of GFP, Tmbim1 or Tmbim1 ΔUb. (l) qpcr analysis of TNF-α, IL-8 and CCL2 after LPS (100 ng ml -1 ) treatment of 293-TLR4 cells with overexpression of GFP, Tmbim1 or Tmbim1 ΔUb. Gene expression was normalized to 18S rrna levels. For a-l, n = 3 independent experiments. (m) Left panel, representative transmission electron microscopy (TEM) images showing MVBs and ILVs in WT MEF infected with empty vector control or Tmbim1 ΔUb lentivirus. MVBs are highlighted by red arrowheads. Right panel, (upper) quantification of MVB numbers in 30 fields per condition. Each dot represents the number of MVBs per section;(bottom) quantification of ILV numbers per MVB. Each dot represents the number of ILVs per MVB (n = 30). Scale bar, 2 μm. (n) Representative Western blot showing the expression of Tlr4, p-erk1/2, p-jnk1/2, p-p38, p-i b and I b in liver samples of WT, Tmbim1-HepTg and Tmbim1 ΔUb -HepTg mice after 24 weeks of HFD consumption (n = 6 in each group). (o) Hepatic TG and NEFA contents of WT, Tmbim1-HepTg and Tmbim1 ΔUb -HepTg mice after 24 weeks of HFD consumption (n = 10 in WT and Tmbim1 ΔUb -HepTg mice, n = 12 in Tmbim1-HepTg mice). For statistical plots, data are mean s.e.m; *P < 0.05; **P < 0.01; n.s. indicates no significant difference; by one-way ANOVA with Bonferroni post hoc analysis (l,o); by 2-tailed Student s t-test (m).
 Fluorescence images of liver sections from ob/ob mice after injection with saline, AAV8-Control or AAV8-Tmbim1 via the tail vein. Scale bar, 50 μm.")
23 Supplementary Figure 9. AAV8-mediated hepatic Tmbim1 overexpression alleviates hepatic steatosis and related metabolic disorders in ob/ob mice. (a) Fluorescence images of liver sections from ob/ob mice after injection with saline, AAV8-Control or AAV8-Tmbim1 via the tail vein. Scale bar, 50 μm. (b) Representative Western blot showing Tmbim1 expression (as indicated by FLAG antibody) in livers of ob/ob mice after injections of saline, AAV8-Control or AAV8-Tmbim1 via the tail vein (For a,b, n = 6 samples per group). (c,d) fasting blood glucose (c) and fasting serum insulin (d) levels in ob/ob mice injected with either AAV8-Control or AAV8-Tmbim1 (For c,d, n = 10 in
24 AAV8-Control and n = 14 in AAV8-Tmbim1). (e,f) The blood glucose levels in ob/ob mice injected with AAV8-Control or AAV8-Tmbim1 subjected to glucose tolerance test (GTT; e) and insulin tolerance test (ITT; f). (n = 10 in each group). (g) Left panel, representative Western blot showing phosphorylated and total Irs1 and Akt expression levels in liver samples of AAV8-Control or AAV8-Tmbim1-infected ob/ob mice (n = 2 in each group without insulin injection, n = 6 in each group with insulin injection). n = 2 Western blot in total. Right panel, protein levels were normalized to. (h) Representative PAS-stained images of liver samples from AAV8-Control or AAV8-Tmbim1-infected ob/ob mice (n = 8 in each group). Scale bar, 50 μm. (i) Pepck and G6pc mrna expression levels in liver samples of AAV8-Control or AAV8-Tmbim1-infected ob/ob mice (n = 4 mice in each group). Gene expression was normalized to -encoding gene Actb mrna levels. (j) Body weight of ob/ob mice injected with either AAV8-Control or AAV8-Tmbim1 (n = 10 in AAV8-Control and n = 14 in AAV8-Tmbim1). (k) The ratio of liver weight to body weight (%) of ob/ob mice injected with either AAV8-Control or AAV8-Tmbim1 (n = 10 in AAV8-Control and n = 14 in AAV8-Tmbim1). (l) Representative H&E (upper) and oil red O (bottom) staining images of liver sections from AAV8-Control or AAV8-Tmbim1-infected ob/ob mice (n = 8 in each group). Scale bar, 50 μm. (m) Hepatic TG and NEFA contents of AAV8-Control or AAV8-Tmbim1-infected ob/ob mice (n = 10 in AAV8-Control and n = 14 in AAV8-Tmbim1). (n) qpcr analysis of Tnf-α, Il-1β, Il-6 and Ccl2 expression levels in liver samples of AAV8-Control or AAV8-Tmbim1- infected ob/ob mice (n = 4 in each group). Gene expression was normalized to -encoding gene Actb mrna levels. Throughout, data are mean s.e.m.; *P < 0.05; ** P < 0.01; the statistical significance was determined by 2-tailed Student s t-test.

25
 Representative images of H&E (left), oil red O (middle) and Sirius red (right) staining on liver sections from monkeys of healthy controls or predisposed to metabolic syndrome (MetS).")
26 Supplementary Figure 10. Effects of AAV8-mediated hepatic TMBIM1 overexpression on pathophysiological characteristics of monkeys. (a) Representative images of H&E (left), oil red O (middle) and Sirius red (right) staining on liver sections from monkeys of healthy controls or predisposed to metabolic syndrome (MetS). Scale bar, 100 m. (b,c) qpcr analysis of indicated inflammation-related (b) and fibrosis-related (c) genes in the livers from MetS-predisposed monkeys and healthy controls before HFD consumption. Gene expression was normalized to -encoding gene Actb mrna levels. For a-c, n = 6 mice per group. (d) Fluorescence images of liver sections from monkeys injected with saline, AAV8-Control or AAV8-TMBIM1 via the portal vein. Scale bar, 50 μm. (e) Representative Western blot showing TMBIM1 overexpression (as indicated by FLAG antibody) in the livers of monkeys injected with AAV8-Control or AAV8-TMBIM1 via the portal vein. (f) Body weights of monkeys infected with either AAV8-Control or AAV8-TMBIM1 from 0 to 32 weeks after the initiation of HFD consumption. Body weights were measured every 4 weeks. (g-j) The body mass index (BMI; g), waist circumference (h), calorie intake (i) and blood pressure (j) of monkeys infected with AAV8-Control or AAV-TMBIM1 at indicated weeks after the initiation of
27 HFD consumption. (k) Schematic images for the regulatory mechanisms of TMBIM1 on metabolic disorders and hepatic steatosis. For d-j, n = 10 in the AAV8-Control group, and n = 8 in the AAV8-TMBIM1 group. For statistical plots, data are mean ± s.e.m.; *P < 0.05; **P < 0.01; n.s. indicates no significance; the statistical significance was determined by 2-tailed Student s t-test.


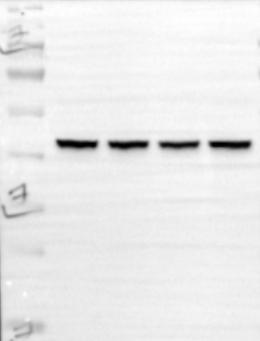
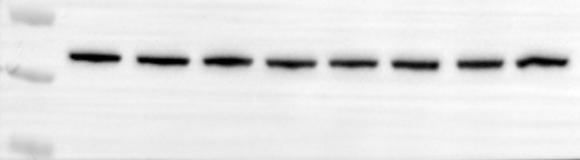
28 Western blots for Fig.1 d HFD 0W 8W 16W 24W e ob/ob 4W 8W 12W 16W Tmbim1 34 kda Tmbim1 34 kda f Nonsteatosis Simple steatosis NASH TMBIM1 34 kda 15 Supplementary Figure 11. Original uncropped gels of representative Western blot images shown in Figure 1. Letters correspond to the order in the main Figures. Black arrows indicate the bands shown in Figure 1.


29 Western blots for Fig.2 g NCD HFD NCD HFD Flox HepKO Flox HepKO Flox HepKO Flox HepKO p-ikkβ 87 kda Ikkβ 87 kda p-p kda p kda p-iκbα 40 kda Iκbα 39 kda Supplementary Figure 12. Original uncropped gels of representative Western blot images shown in Figure 2. Letters correspond to the order in the main Figures. Black arrows indicate the bands shown in Figure 2.


30 Western blots for Fig.3 c NCD HFD Flox HepKO Flox HepKO Tlr4 110 kda d Nonsteatosis Simple steatosis NASH TLR4 110 kda 1 1 Supplementary Figure 13. Original uncropped gels of representative Western blot images shown in Figure 3. Letters correspond to the order in the main Figures. Black arrows indicate the bands shown in Figure 3.


")


31 Western blots for Fig.4 a Lysate IP:FLAG TLR4-HA + + FLAG-TMBIM HA FLAG HA FLAG e FLAG HA FLAG Control FLAG-TMBIM1 FLAG-TMBIM1( PSAP) FLAG-TMBIM1(AAGA) Lysate IP:FLAG HA-TSG101 HA f Lysate IP:FLAG Control HA-TSG101 HA-TSG101(UEV) HA-TSG101( UEV) FLAG-TMBIM FLAG HA FLAG HA Supplementary Figure 14. Original uncropped gels of representative Western blot images shown in Figure 4. Letters correspond to the order in the main Figures. Black arrows indicate the bands shown in Figure 4.


")


32 a b c Ni-NTA pulldown Western blots for Fig.5 IP:His Lysate HA-Ub His-Tmbim HA His d His 140 HA 115 His His-Tmbim1 Ub - - His-Tmbim1 HA-Hrs HA 1 80 HA-Ub-K HA-Ub-K HA-Ub His-Tmbim HA Ni-NTA pulldown His e IP:FLAG Lysate HA-Nedd4l FLAG-Tmbim1 HA FLAG HA FLAG Ni-NTA pulldown HA His His-Tmbim1 His-Tmbim1(7KR) His-Tmbim1(K91 Only) His-Tmbim1(K99 Only) His-Tmbim1(K126 Only) His-Tmbim1(K187 Only) His-Tmbim1(K211 Only) His-Tmbim1(K242 Only) His-Tmbim1(K275 Only) HA-Ub

 - - - - - + Ni-NTA pulldown")


33 Western blots for Fig.5 f FLAG-Nedd FLAG-Nedd4(C854S) FLAG-Nedd4l FLAG-Nedd4l(C943S) Ni-NTA pulldown Lysate His-Tmbim HA His FLAG HA-Ub g FLAG-Tmbim1 FLAG-Tmbim1( PPPY) FLAG-Tmbim1(Y10A) IP:FLAG Lysate HA-Nedd4l HA FLAG HA FLAG Supplementary Figure 15. Original uncropped gels of representative Western blot images shown in Figure 5. Letters correspond to the order in the main Figures. Black arrows indicate the bands shown in Figure 5.


34 Western blots for Fig.6 c Healthy MetS-pre MetS Tmbim1 34 kda Supplementary Figure 16. Original uncropped gels of representative Western blot images shown in Figure 6. Letters correspond to the order in the main Figures. Black arrows indicate the bands shown in Figure 6.

 HepKO p-irs1")


35 Western blots for Supplementary Fig.1 d Liver Muscle Fat Heart f HFD (24W) Flox HepkO f Flox HFD(24W) HepKO p-irs1 Tyr kda Irs1 180 kda p-akt Ser kda Tmbim1 34 kda Insulin Akt 60 kda p-gsk3β 46 kda Gsk3β 46 kda Insulin Supplementary Figure 15. Original uncropped gels of representative Western blot images shown in Supplementary Fig 1. Letters correspond to the order in the main Figures. Black arrows indicate the bands shown in Supplementary Fig 1.


36 Western blots for Supplementary Fig.3 a Liver Muscle Fat Heart d HFD (24W) WT HepTg Tmbim1 34 kda Akt 60 kda p-gsk3β 46 kda Gsk3β 46 kda d WT HFD(24W) HepTg p-irs1 Tyr kda Insulin Irs1 180 kda p-akt Ser kda Insulin


37 o NCD HFD NCD HFD WT HepTg WT HepTg WT HepTg WT HepTg p-ikkβ 87 kda Ikkβ 87 kda p-iκbα 40 kda Iκbα 39 kda p-p kda p kda Supplementary Figure 18. Original uncropped gels of representative Western blot images shown in Supplementary Fig 3. Letters correspond to the order in the main Figures. Black arrows indicate the bands shown in Supplementary Fig 3.


 WT HepTg")


 TLR4 110")
38 Western blots for Supplementary Fig.4 e NCD HFD f 0 60 (min) WT HepTg WT HepTg LPS Tlr4 110 kda Tlr4 110 kda g shgfp shtmbim1 f LPS (min) Tlr4 110 kda LPS (h) TLR4 110 kda TMBIM1 34 kda

 TLR4")


 p-p38")


")


39 g GFP TMBIM1 LPS (h) TLR4 110 kda TMBIM1 34 kda h LPS Flox Tmbim1- HepKO (min) p-p38 43 kda p-iκbα 40 kda Iκbα 39 kda h Flox Tmbim1- HepKO i shgfp shtmbim1 LPS (min) p-erk1/2 42,44 kda p-jnk1/2 46,54 kda LPS (min) p-erk1/2 42,44kDa p-jnk1/2 46,54kDa

")


40 i shgfp shtmbim1 j LPS (min) GFP TMBIM1 p-p38 43 kda LPS (min) p-jnk1/2 46,54 kda p-iκbα 40 kda IκBα 39 kda TMBIM1 34 kda p-p38 43 kda p-iκbα 40 kda IκBα 39 kda TMBIM1 34 kda j LPS GFP TMBIM (min) p-erk1/2 42,44 kda Supplementary Figure 19. Original uncropped gels of representative Western blot images shown in Supplementary Fig 4. Letters correspond to the order in the main Figures. Black arrows indicate the bands shown in Supplementary Fig 4.


 140 1")


41 Western blots for Supplementary Fig.5 d Flox HFD (0W) Tmbim1 -HepKO Tlr4 -HepKO DKO f HFD (24W) Tmbim1 34 kda Tlr4 110 kda p-irs1 Tyr kda Irs1 180 kda Flox HFD (24W) Tmbim1 -HepKO Tlr4 -HepKO DKO Tmbim1 34 kda Tlr4 110 kda Insulin p-akt Ser kda Akt 60 kda 140 1
42 Supplementary Figure 20. Original uncropped gels of representative Western blot images shown in Supplementary Fig 5. Letters correspond to the order in the main Figures. Black arrows indicate the bands shown in Supplementary Fig 5.


43 Western blots for Supplementary Fig.6 a AAV8-Control AAV8-TLR4 f PA WT HepTg WT HepTg f PA Tmbim1 34 kda Tlr4 110 kda p-erk1/2 42,44 kda p-jnk1/2 46,54 kda p-p38 43 kda p-iκbα 40 kda FLAG- TLR4 FLAGcaTLR HA-TMBIM IκBα 39 kda


44 g PA PA p-irs1 Tyr kda IRS1 180 kda Insulin p-akt Ser kda AKT 60 kda Supplementary Figure 21. Original uncropped gels of representative Western blot images shown in Supplementary Fig 6. Letters correspond to the order in the main Figures. Black arrows indicate the bands shown in Supplementary Fig 6.


45 Western blots for Supplementary Fig.7 a d LPS TLR4 110 kda LPS TLR4 110 kda HA-HRS FLAG-TMBIM1 HA TMBIM1 34 kda TMBIM1 34 kda IP:FLAG Lysate FLAG HA FLAG


46 f Lysate IP:HA Myc-TMBIM1 - - HA-HRS - + FLAG-TSG FLAG HA FLAG Myc HA g h EGF shgfp LPS shtmbim (min) - + EGFR 175 kda p-egfr 175 kda TMBIM1 34 kda TLR4 110 kda FLAG

 Tmbim1 -HepTg")


47 i LPS GFP TMBIM1 TMBIM1 PSAP (min) l WT HFD(24W) Tmbim1 -HepTg Tmbim1 PSAP -HepTg p-erk1/2 42,44 kda Tlr4 110 kda p-jnk1/2 46,54 kda p-p38 43 kda p-iκbα 40 kda IκBα 39 kda p-erk1/2 42,44 kda p-jnk1/2 46,54 kda p-p38 43 kda p-iκbα 40 kda Iκbα 39 kda Supplementary Figure 22. Original uncropped gels of representative Western blot images shown in Supplementary Fig 7. Letters correspond to the order in the main Figures. Black arrows indicate the bands shown in Supplementary Fig 7.


48 Western blots for Supplementary Fig.8 a b f His-Tmbim1(4KR) His-Tmbim1(7KR) Ni-NTA pulldown g His-Tmbim1 HA His HA-Ub IP:FLAG Lysate FLAG-Tmbim1 Ub FLAG-Tmbim1 HA-Tsg101 + HA FLAG HA FLAG Lysate IP:FLAG HA-Nedd4 FLAG-Tmbim1 HA FLAG HA FLAG shgfp shnedd4l His-Tmbim1 HA-Ub shgfp shnedd4l His-Tmbim1 HA-Ub Ni-NTA pulldown HA His Lysate NEDD4L

 HA-Nedd4l( C2)")
 j 140 1 140 1")


49 h IP:HA FLAG-Tmbim FLAG HA Control HA-Nedd4l HA-NEedd4l(C2) HA-Nedd4l( C2) HA-Nedd4l(WW) HA-Nedd4l( HECT) HA-Nedd4l(HECT) j LPS - + TLR4 110 kda Lysate FLAG HA FLAG k GFP Tmbim1 Tmbim1 Ub GFP Tmbim1 Tmbim1 Ub LPS (min) LPS (min) 40 p-erk1/2 42,44 kda 1 p-p38 43 kda p-jnk1/2 46,54 kda 1 p-iκbα 40 kda


 Tmbim1 -HepTg Tmbim1 Ub")


50 k HFD(24W) LPS GFP Tmbim1 Tmbim1 Ub (min) IκBα 39 kda WT Tmbim1 -HepTg Tmbim1 Ub -HepTg p-p38 43 kda p-iκbα 40 kda n WT HFD(24W) Tmbim1 -HepTg Tmbim1 Ub -HepTg Tlr4 110 kda Iκbα 39 kda p-erk1/2 42,44 kda 1 1 p-jnk1/2 46,54 kda Supplementary Figure 23. Original uncropped gels of representative Western blot images shown in Supplementary Fig 8. Letters correspond to the order in the main Figures. Black arrows indicate the bands shown in Supplementary Fig 8.


51 Western blots for Supplementary Fig.9 b g AAV8- Control AAV8- Tmbim AAV8- Control AAV8- Tmbim1 FLAG p-irs1 Tyr kda Irs1 180 kda p-akt Ser kda Akt 60 kda Insulin Supplementary Figure 24. Original uncropped gels of representative Western blot images shown in Supplementary Fig 9. Letters correspond to the order in the main Figures. Black arrows indicate the bands shown in Supplementary Fig 9.


52 Western blots for Supplementary Fig.10 e AAV8- Control AAV8- TMBIM1 FLAG Supplementary Figure 25. Original uncropped gels of representative Western blot images shown in Supplementary Fig 10. Letters correspond to the order in the main Figures. Black arrows indicate the bands shown in Supplementary Fig 10.
53 Supplementary Table 1. The clinical information and histologic features of subjects included in this study. Non-steatosis Simple steatosis NASH All (n) Male 21 (.6%) 26 (76.5%) 24 (64.9%) Age (years) 30.3± ± ±12.4 BMI (kg/m 2 ) 22.2± ± ±2.5 AST (U/L) 17.5± ± ±12.8 ALT (U/L) 33± ± ±18.5 Cholesterol (mg/dl) 128± ± ±30 Triglycerides (mg/dl) 137.1± ± ±30.7 HDL (mg/dl).4± ± ±10.2 LDL (mg/dl) 83.8± ± ±25.4 FBG (mg/dl) 80.5± ± ±10.6 Steatosis grade (0/1/2/3) 32/0/0/0 0/28/6/0 0/5/13/19 Lobular inflammation (0/1/2/3) 32/0/0/0 25/9/0/0 3/7/15/12 Ballooning (0/1/2) 32/0/0 34/0/0 7/15/15 Fibrosis (0/1) 32/0 34/0 16/21 Data are expressed as mean s.d. in this table. BMI, body mass index; AST, aspartate amino transferase; ALT, alanine amino transferase; HDL, high-density lipoprotein; LDL, low-density lipoprotein; FBG, fasting blood glucose.
54 Supplementary Table 2. Primers for qpcr detection. Mice Gene Sequence5'---3' Tmbim1 F CCCCACCTCCCTATGAGGAC R AGGGTAGGCGGGATAACCAC 18S rrna F GTAACCCGTTGAACCCCATT R CCATCCAATCGGTAGTAGCG Actb F GTGACGTTGACATCCGTAAAGA R GCCGGACTCATCGTACTCC Pepck F TGCCCCAGGCAGTGAGGAAGTT R GTCAGTGAGAGCCAGCCAACAGT G6Pc F TCTGTCCCGGATCTACCTTG R GCTGGCAAAGGGTGTAGTGT Pgc1-α F AAGCCACAAAGACGTCCCTGCT R TGAGCATGTTGCGACTGCGGTT Tlr4 F TCAGCAAAGTCCCTGATGACA R CCTGGGGAAAAACTCTGGATAG Cox-2 F GTCAAAACCGTGGGGAATGTA R GGGTGGGCTTCAGCAGTAA Jun F ATGGAGTCTCAGGAGCGGAT R GCTGCGTTAGCATGAGTTGG Il-1β F CCGTGGACCTTCCAGGATGA R GGGAACGTCACACACCAGCA Il-6 F AGTTGCCTTCTTGGGACTGA R TCCACGATTTCCCAGAGAAC Il-12α F CAATCACGCTACCTCCTCTTTT R CAGCAGTGCAGGAATAATGTTTC Il-12β F AGACCCTGCCCATTGAACTG R GAAGCTGGTGCTGTAGTTCTCATATT Tnf-α F CATCTTCTCAAAATTCGAGTGACAA R TGGGAGTAGACAAGGTACAACCC Ccl2 F TTGGCTCAGCCAGATGCA R CCTACTCATTGGGATCATCTTGC Ccl3 F ATTCCACGCCAATTCATCGT R CTATGCAGGTGGCAGGAATGT
55 Ccl4 F CTCCAAGCCAGCTGTGGTAT R CTGAACGTGAGGAGCAAGGA Ccl5 F TCGTGCCCACGTCAAGGAGTATTT R ACTAGAGCAAGCAATGACAGGGAA Cxcl2 F CGCCCAGACAGAAGTCATAGCCAC R ACAGCGAGGCACATCAGGTACGA Cxcl9 F GGAGTTCGAGGAACCCTAGTG R GGGATTTGTAGTGGATCGTGC Cxcl10 F GCCCACGTGTTGAGATCATTGCCA R AGGCTCTCTGCTGTCCATCCATCG Non-human primates Gene Sequence5'---3' Tmbim1 F ACTGCGGTGGTATCCATTTC R AAGCACAATTCCCAGGACAC Actb F ATGATGATATCGCCGCGCTC R CCTCGTCGCCCACATATGAA Il-2 F ACTCACCAGGATGCTCACATT R AGCACTTCCTCCAGAGGTTT Il-4 F CTTTGCCCACGGACACAACT R GGCAGCAAGGATGTCCGTTA Il-6 F ATGAGGACACTTGCCTGGTG R GCTGGCATTTGTGGTTGGTT Il-1β F TTGGGCCTCAAGGCAAAGAA R TGCTTGAGAGGTGCTGATGT Tnf- F TCCAACCATGTGCTCCTCAC R TCGGGCAGATTGATCTCAGC Ccl2 F GCAAGTGTCCCAAAGAAGCTG R TCCTGAACCCACTTCTGCTTG Col1a1 F GTGCTCCTGGTATTGCTGGT R TCCTTGAACACCAACAGGGC Col1a2 F CATCCCAGCCAAGAACTGGT R TGGCTGCCAGCATTGATAGT Col3a1 F TTCGACTTCTCTCCAGCCGA
56 R TCCACTGGCCTGATCCATGT Timp1 F GGACGGACTCTTGCACATCA R GTGCATTCCTCACAGCCAAC Serpine1 F ATGGCAGCACTGTCTCTGTG R TAGGGCAGTTCCAGGATGTC Tgf- 1 F GCCCAACATCTGCAAAGCTC R GAAGTTGGCATGGTAGCCCT Ctgf F AGACCTGTGCCTGCCATTAC R ACGCCATGTCTCCGTACATC Acta1 F ATGTGCGACGAAGACGAGAC R ATGATGCCGTGCTCGATAGG Acta2 F TCCGGAGCGCAAATACTCTG R CCCGGCTTCATCGTATTCCT Human Gene Sequence5'---3' TMBIM1 F GACGGGCACCATTTCCAGTAT R GGTGAAGTCCACCTTGGTCTGA 18S rrna F AATTGACGGAAGGGCACCACCAG R TAAGAACGGCCATGCACCACCAC TNF-α F CCTCTCTCTAATCAGCCCTCTG R GAGGACCTGGGAGTAGATGAG IL-6 F CCAGGAGCCCAGCTATGAAC R CCCAGGGAGAAGGCAACTG IL-8 F CTAGGACAAGAGCCAGGAAGAA R GGGGTGGAAAGGTTTGGAGTA CCL2 F GTCTCTGCCGCCCTTCTG R ACTTGCTGCTGGTGATTCTTCT TLR4 F GCAATGGATCAAGGACCAGAG R CAGCCAGCAAGAAGCATCAG COX-2 F TGAAACCCACTCCAAACACAG R GGGCAATCATCAGGCACAG IL-1β F CCTGCGTGTTGAAAGATGATAA R CTGCTTGAGAGGTGCTGATGTA
57 Supplementary Table 3. Primers for mouse generation. Primer name Tmbim1-P1 Tmbim1-P2 Tmbim1-P3 Tmbim1-P4 Tmbim1-P5 Tmbim1-P6 Tmbim1-P7 Tlr4-P1 Tlr4-P2 Tlr4-P3 Tlr4-P4 Tlr4-P5 Tlr4-P6 Tlr4-P7 Sequence 5'---3' CAGCCAGTTCCACTCCCTAA CACTTTCTGCCCTCCTCTTG GCTGTTAGGACAGGAGCAGG CGGTCATCCCATTCTCCAGG AGCTTGGCGTAATCATGGTC CAATACGCAAACCGCCTCTC AGGTGAGAAAGAGCTGTGCTG TGAAATTAAGGTTTTCAGACTTGAG TTGGGGAGAAACCGTCACTG ATCTGAGCTTCAACCCCTTG TCCCAAAATACCTGCCATTC AGCTTGGCGTAATCATGGTC CAATACGCAAACCGCCTCTC CACACCCATCCTTCTCCATT
58 Supplementary Table 4. Primers for plasmid construction. Plasmids Reference name sequence Species FLAG-TMBI M1 NM_ Mouse FLAG-TMBI M1 (Y10A) NM_ Mouse FLAG-TMBI M1 ( PSAP) NM_ Mouse FLAG-TMBI M1 ( PPPY) NM_ Mouse FLAG-TMBI M1 (AAGA) NM_ Mouse HA-TMBIM1 NM_ Human His-TMBIM1 NM_ Mouse Myc-TMBIM1 NM_ Mouse GST-TMBIM1 (1-94aa) NM_ Mouse FLAG-NEDD 4 NM_ Mouse HA-NEDD4 NM_ Mouse FLAG-NEDD NM_ L 6.1 Mouse Sequence5'---3' F: CAAGGATGACGATGACAAGGGTACCATGTCCAATCCC AGTGCCCCAC R: CTGAGGAGTGAATTCCTCGAGTCAGTCTCTACTTCCT ACGAGC F: CAAGGATGACGATGACAAGGGTACCATGTCCAATCCC AGTGCCC R: TCAGTCTCTACTTCCTACGAGCTGG F: CAAGGATGACGATGACAAGGGTACCATGTCCAATCCT CCCTATGAGGACCAC R: CTGAGGAGTGAATTCCTCGAGTCAGTCTCTACTTCCT ACGAGC F: TCCCAGTGCCGAGGACCACAACCCCCTG R: TGTGGTCCTCGGCACTGGGATTGGACAT F: CAAGGATGACGATGACAAGGGTACCATGTCCAATGCC GCTGGCGCAC R: CTGAGGAGTGAATTCCTCGAGTCAGTCTCTACTTCCT ACGAGC F: TAGTCCAGTGTGGTGGAATTATGTCCAACCCCAGCGC CCC R: TGCTGGATATCTGCAGAATTTTAATTGCGATCCCCCAT CA F: CGCGGATCCTCAGTCTCTACTTCCTACGAGC R: CCGGAATTCTCAGTCTCTACTTCCTACGAGC F: CGCGGATCCATGTCCAATCCCAGTGCCCC R: CCGCTCGAGTCAGTCTCTACTTCCTACGA F: CCGCGTGGATCCCCGGAATTCATGTCCAATCCCAGTG CCC R: CTCGAGTCGACCCGGGAATTTCAATGTCGAACTTTCC GGTCATC F: CAAGGATGACGATGACAAGGGTACCATGAGCTCGGA CATGGCAGC R: CTGAGGAGTGAATTCCTCGAGCTAATCAACGCCATCA AAGC F: TAGTCCAGTGTGGTGGAATTATGAGCTCGGACATGGC AG R: TGCTGGATATCTGCAGAATTCTAATCAACGCCATCAA AGCC F: GATGACGATGACAAGGGTACCATGGCGACCGGGCTT GGG R: CTGAGGAGTGAATTCCTCGAGTTAATCCACACCTTCG
59 HA-NEDD4L HA-NEDD4L( C2) HA-NEDD4L ( C2) HA-NEDD4L (WW) HA-NEDD4L ( HECT) HA-NEDD4L (HECT) AAGCCT F: TAGTCCAGTGTGGTGGAATTATGGCGACCGGGCTTGG NM_ G Mouse 6.1 R: TGCTGGATATCTGCAGAATTTTAATCCACACCTTCGAA GCCT F: TAGTCCAGTGTGGTGGAATTATGGCGACCGGGCTTGG NM_ G Mouse 6.1 R: TGCTGGATATCTGCAGAATTTTAAGGGGGGAGCTCCT CCTG F: TAGTCCAGTGTGGTGGAATTATGCCTCCCCTGCCGCC NM_ AGGATG Mouse 6.1 R: TGCTGGATATCTGCAGAATTTTAATCCACACCTTCGA AGCCT F: TAGTCCAGTGTGGTGGAATTATGCCTCCCCTGCCGCC NM_ AGGATG Mouse 6.1 R: TGCTGGATATCTGCAGAATTTTATAGTCTTGGATCTTC CCACT F: TAGTCCAGTGTGGTGGAATTATGCAGAACCCAGCCAT NM_ CACTGG Mouse 6.1 R: TGCTGGATATCTGCAGAATTTTAATCCACACCTTCGAA GCCT F: TAGTCCAGTGTGGTGGAATTATGGCGACCGGGCTTGG NM_ G Mouse 6.1 R: TGCTGGATATCTGCAGAATTTTATAGTCTTGGATCTTC CCACT F: TAGTCCAGTGTGGTGGAATTATGGCGGTGTCCGAGAG HA-TSG101 NM_ Mouse TC R: TGCTGGATATCTGCAGAATTTCAGTAGAGGTCACTAA GGCCCG F: TAGTCCAGTGTGGTGGAATTATGGCGGTGTCCGAGAG HA-TSG101 TCA NM_ Mouse (UEV) R: TGCTGGATATCTGCAGAATTTCAAGGCCGGGAGAACA CTGGAG F: TAGTCCAGTGTGGTGGAATTACTGTTTCTGCATCCTAC HA-TSG101 CC NM_ Mouse ( UEV) R: TGCTGGATATCTGCAGAATTTCAGTAGAGGTCACTAA GGC FLAG-TSG10 F: GGGGTACCATGGCGGTGTCCGAGAGTC NM_ Mouse 1 R: CCGCTCGAGTCAGTAGAGGTCACTAAGGCCCG F: TGCTGGATATCTGCAGAATTATGGGGCGAGGCAGCG HA-HRS NM_ GCAC Mouse 8.1 R: TGCTGGATATCTGCAGAATTTCAGTCAAAGGAGATG AGCT TLR4-HA NM_ Mouse F: CGGGGTACCGCCACCATGATGCCTCCCTGGCTCCT
60 AAV8-TLR4 NM_ Mouse AAV8- htmbim1 NM_ Human AAV8- mtmbim1 NM_ Mouse Lenti-GFP Lenti-mTMBI M1 NM_ Mouse Lenti-hTMBI M1 NM_ Human GFP-TMBIM1 NM_ Mouse Cherry-TMBI M1 NM_ Mouse NEDD4L- NM_ Cherry 6.1 Mouse Cherry-TSG10 1 NM_ Mouse HRS-Cherry NM_ Mouse TLR4-YFP NM_ Mouse R: CGCGGATCCGGTCCAAGTTGCCGTTTC F: CGGGATCCGCCACCATGATGCCTCCCTGGCTCCT R: ACGCGTCGACCTTGTCATCGTCGTCCTTGTAATCGGT CCAAGTTGCCGTTTCTT F: CGGGATCCGCCACCATGGATTACAAGGACGACGATG ACAAGTCCAACCCCAGCGCCCCACC R: ACGCGTCGACATTGCGATCCCCCATCAGCTGC F: CGGGATCCGCCACCATGGATTACAAGGACGACGATG ACAAGTCCAATCCCAGTGCCCCAC R: ACGCGTCGACGTCTCTACTTCCTACGAGC F: GCGGCCACGCGTGCGGCCATGGTGAGCAAGGGCGA GGA R: GTCATCCTTGTAATCCTCGATTACTTGTACAGCTCGTC CATGC F: GGCCACGCGTGCGGCCATGGCTAGCTGGAGCCACC R: CTCGTAGGAAGTAGAGACTGATCGAGGATTACAAGG ATG F: CGCGGATCCATGTCCAACCCCAGCGCCCC R: CCGCTCGAGCTAATTGCGATCCCCCATCA F: ATAAGAATGCGGCCGCATGGTGAGCAAGGGCGAGGA G R: CCGCTCGAGTCAGTCTCTACTTCCTACGA F: ATAAGAATGCGGCCGCCACCATGGTGAGCAAGGGCG AGGAG R: CCGCTCGAGTCAGTCTCTACTTCCTACGA F: AAGGAAAAAAGCGGCCGCGCCACCATGGCGACCGG GCTTGGG R: GGAAGATCTATCCACACCTTCGAAGCCTT F: CGCGGATCCATGGCGGTGTCCGAGAGTCA R: CCGCTCGAGTCAGTAGAGGTCACTAAGGCC F: ATAAGAATGCGGCCGCCACCATGGGGCGAGGCAGCG GCAC R: CGCGGATCCGTCAAAGGAGATGAGCTGGG F: CGGCGGCCACGCGTGCGGCCGCCACCATGATGCCTC CCTGGCTCCT R: CCCTTGCTCACCATGGATCCGGTCCAAGTTGCCGTTT CTT
Supplementary Figure 1: Additional metabolic parameters of obesity mouse models and controls. (a) Body weight, (b) blood glucose and (c) insulin
 Body weight, (b) blood glucose and (c) insulin") Supplementary Figure 1: Additional metabolic parameters of obesity mouse models and controls. (a) Body weight, (b) blood glucose and (c) insulin resistance index of homeostatic model assessment (HOMA IR)
Supplementary Figure 1: Additional metabolic parameters of obesity mouse models and controls. (a) Body weight, (b) blood glucose and (c) insulin resistance index of homeostatic model assessment (HOMA IR)
RAW264.7 cells stably expressing control shrna (Con) or GSK3b-specific shrna (sh-
 or GSK3b-specific shrna (sh-") 1 a b Supplementary Figure 1. Effects of GSK3b knockdown on poly I:C-induced cytokine production. RAW264.7 cells stably expressing control shrna (Con) or GSK3b-specific shrna (sh- GSK3b) were stimulated
1 a b Supplementary Figure 1. Effects of GSK3b knockdown on poly I:C-induced cytokine production. RAW264.7 cells stably expressing control shrna (Con) or GSK3b-specific shrna (sh- GSK3b) were stimulated
SUPPLEMENTARY INFORMATION
 doi:10.1038/nature12652 Supplementary Figure 1. PRDM16 interacts with endogenous EHMT1 in brown adipocytes. Immunoprecipitation of PRDM16 complex by flag antibody (M2) followed by Western blot analysis
18s AAACGGCTACCACATCCAAG CCTCCAATGGATCCTCGTTA. 36b4 GTTCTTGCCCATCAGCACC AGATGCAGCAGATCCGCAT. Acc1 AGCAGATCCGCAGCTTG ACCTCTGCTCGCTGAGTGC
 Supplementary Table 1. Quantitative PCR primer sequences Gene symbol Sequences (5 to 3 ) Forward Reverse 18s AAACGGCTACCACATCCAAG CCTCCAATGGATCCTCGTTA 36b4 GTTCTTGCCCATCAGCACC AGATGCAGCAGATCCGCAT Acc1
Supplementary Figure 1
 Supplementary Figure 1 YAP negatively regulates IFN- signaling. (a) Immunoblot analysis of Yap knockdown efficiency with sh-yap (#1 to #4 independent constructs) in Raw264.7 cells. (b) IFN- -Luc and PRDs
Supplementary Figure 1. Normal T lymphocyte populations in Dapk -/- mice. (a) Normal thymic development in Dapk -/- mice. Thymocytes from WT and Dapk
 Normal thymic development in Dapk -/- mice. Thymocytes from WT and Dapk") Supplementary Figure 1. Normal T lymphocyte populations in Dapk -/- mice. (a) Normal thymic development in Dapk -/- mice. Thymocytes from WT and Dapk -/- mice were stained for expression of CD4 and CD8.
Supplementary Figure 1. Normal T lymphocyte populations in Dapk -/- mice. (a) Normal thymic development in Dapk -/- mice. Thymocytes from WT and Dapk -/- mice were stained for expression of CD4 and CD8.
293T cells were transfected with indicated expression vectors and the whole-cell extracts were subjected
 SUPPLEMENTARY INFORMATION Supplementary Figure 1. Formation of a complex between Slo1 and CRL4A CRBN E3 ligase. (a) HEK 293T cells were transfected with indicated expression vectors and the whole-cell
Supplementary Figure 1. PD-L1 is glycosylated in cancer cells. (a) Western blot analysis of PD-L1 in breast cancer cells. (b) Western blot analysis
 Western blot analysis of PD-L1 in breast cancer cells. (b) Western blot analysis") Supplementary Figure 1. PD-L1 is glycosylated in cancer cells. (a) Western blot analysis of PD-L1 in breast cancer cells. (b) Western blot analysis of PD-L1 in ovarian cancer cells. (c) Western blot analysis
Supplementary Figure 1. PD-L1 is glycosylated in cancer cells. (a) Western blot analysis of PD-L1 in breast cancer cells. (b) Western blot analysis of PD-L1 in ovarian cancer cells. (c) Western blot analysis
Supplemental Information. Increased 4E-BP1 Expression Protects. against Diet-Induced Obesity and Insulin. Resistance in Male Mice
 Cell Reports, Volume 16 Supplemental Information Increased 4E-BP1 Expression Protects against Diet-Induced Obesity and Insulin Resistance in Male Mice Shih-Yin Tsai, Ariana A. Rodriguez, Somasish G. Dastidar,
SUPPLEMENTARY FIGURES
 SUPPLEMENTARY FIGURES Supplementary Figure 1. (A) Left, western blot analysis of ISGylated proteins in Jurkat T cells treated with 1000U ml -1 IFN for 16h (IFN) or left untreated (CONT); right, western
Supplementary Figure 1
 Supplementary Figure 1 a γ-h2ax MDC1 RNF8 FK2 BRCA1 U2OS Cells sgrna-1 ** 60 sgrna 40 20 0 % positive Cells (>5 foci per cell) b ** 80 sgrna sgrna γ-h2ax MDC1 γ-h2ax RNF8 FK2 MDC1 BRCA1 RNF8 FK2 BRCA1
Supplementary Figure S1. Effect of Glucose on Energy Balance in WT and KHK A/C KO
 Supplementary Figure S1. Effect of Glucose on Energy Balance in WT and KHK A/C KO Mice. WT mice and KHK-A/C KO mice were provided drinking water containing 10% glucose or tap water with normal chow ad
S1a S1b S1c. S1d. S1f S1g S1h SUPPLEMENTARY FIGURE 1. - si sc Il17rd Il17ra bp. rig/s IL-17RD (ng) -100 IL-17RD
 -100 IL-17RD") SUPPLEMENTARY FIGURE 1 0 20 50 80 100 IL-17RD (ng) S1a S1b S1c IL-17RD β-actin kda S1d - si sc Il17rd Il17ra rig/s15-574 - 458-361 bp S1f S1g S1h S1i S1j Supplementary Figure 1. Knockdown of IL-17RD enhances
SUPPLEMENTARY FIGURE 1 0 20 50 80 100 IL-17RD (ng) S1a S1b S1c IL-17RD β-actin kda S1d - si sc Il17rd Il17ra rig/s15-574 - 458-361 bp S1f S1g S1h S1i S1j Supplementary Figure 1. Knockdown of IL-17RD enhances
Supplementary Information
 Supplementary Information mediates STAT3 activation at retromer-positive structures to promote colitis and colitis-associated carcinogenesis Zhang et al. a b d e g h Rel. Luc. Act. Rel. mrna Rel. mrna
Supplementary Figure 1. DNA methylation of the adiponectin promoter R1, Pparg2, and Tnfa promoter in adipocytes is not affected by obesity.
 Supplementary Figure 1. DNA methylation of the adiponectin promoter R1, Pparg2, and Tnfa promoter in adipocytes is not affected by obesity. (a) Relative amounts of adiponectin, Ppar 2, C/ebp, and Tnf mrna
AdPLA ablation increases lipolysis and prevents obesity induced by high fat feeding or leptin deficiency
 AdPLA AdPLA ablation increases lipolysis and prevents obesity induced by high fat feeding or leptin deficiency Kathy Jaworski, Maryam Ahmadian, Robin E. Duncan, Eszter Sarkadi-Nagy, Krista A. Va rady,
Nature Immunology doi: /ni.3268
 Supplementary Figure 1 Loss of Mst1 and Mst2 increases susceptibility to bacterial sepsis. (a) H&E staining of colon and kidney sections from wild type and Mst1 -/- Mst2 fl/fl Vav-Cre mice. Scale bar,
(A) SW480, DLD1, RKO and HCT116 cells were treated with DMSO or XAV939 (5 µm)
 SW480, DLD1, RKO and HCT116 cells were treated with DMSO or XAV939 (5 µm)") Supplementary Figure Legends Figure S1. Tankyrase inhibition suppresses cell proliferation in an axin/β-catenin independent manner. (A) SW480, DLD1, RKO and HCT116 cells were treated with DMSO or XAV939
Supplementary Figure Legends Figure S1. Tankyrase inhibition suppresses cell proliferation in an axin/β-catenin independent manner. (A) SW480, DLD1, RKO and HCT116 cells were treated with DMSO or XAV939
Supplementary Table 1. Metabolic parameters in GFP and OGT-treated mice
 Supplementary Table 1. Metabolic parameters in GFP and OGT-treated mice Fasted Refed GFP OGT GFP OGT Liver G6P (mmol/g) 0.03±0.01 0.04±0.02 0.60±0.04 0.42±0.10 A TGs (mg/g of liver) 20.08±5.17 16.29±0.8
AAV-TBGp-Cre treatment resulted in hepatocyte-specific GH receptor gene recombination
 AAV-TBGp-Cre treatment resulted in hepatocyte-specific GH receptor gene recombination Supplementary Figure 1. Generation of the adult-onset, liver-specific GH receptor knock-down (alivghrkd, Kd) mouse
Supplementary Figure 1
 Supplementary Figure 1 Supplementary Figure 1 Schematic depiction of the tandem Fc GDF15. Supplementary Figure 2 Supplementary Figure 2 Gfral mrna levels in the brains of both wild-type and knockout Gfral
SUPPLEMENTARY INFORMATION
 SUPPLEMENTARY INFORMATION doi:1.138/nature9814 a A SHARPIN FL B SHARPIN ΔNZF C SHARPIN T38L, F39V b His-SHARPIN FL -1xUb -2xUb -4xUb α-his c Linear 4xUb -SHARPIN FL -SHARPIN TF_LV -SHARPINΔNZF -SHARPIN
Supplementary Materials
 Supplementary Materials 1 Supplementary Table 1. List of primers used for quantitative PCR analysis. Gene name Gene symbol Accession IDs Sequence range Product Primer sequences size (bp) β-actin Actb gi
Supplementary Figure 1
 Supplementary Figure 1 how HFD how HFD Epi WT p p Hypothalamus p p Inguinal WT T Liver Lean mouse adipocytes p p p p p p Obese mouse adipocytes Kidney Muscle Spleen Heart p p p p p p p p Extracellular
Supplementary Figure 1. Repression of hepcidin expression in the liver of mice treated with
 Supplementary Figure 1. Repression of hepcidin expression in the liver of mice treated with DMN Immunohistochemistry for hepcidin and H&E staining (left). qrt-pcr assays for hepcidin in the liver (right).
Supplementary Figure 1. Expression of CUGBP1 in non-parenchymal liver cells treated with TGF-β
 Supplementary Figures Supplementary Figure 1. Expression of CUGBP1 in non-parenchymal liver cells treated with TGF-β and LPS. Non-parenchymal liver cells were isolated and treated with or without TGF-β
Supplementary Figures
 Supplementary Figures Supplementary Figure 1 Characterization of stable expression of GlucB and sshbira in the CT26 cell line (a) Live cell imaging of stable CT26 cells expressing green fluorescent protein
Supplementary Fig. 1. GPRC5A post-transcriptionally down-regulates EGFR expression. (a) Plot of the changes in steady state mrna levels versus
 Plot of the changes in steady state mrna levels versus") Supplementary Fig. 1. GPRC5A post-transcriptionally down-regulates EGFR expression. (a) Plot of the changes in steady state mrna levels versus changes in corresponding proteins between wild type and Gprc5a-/-
Supplementary Fig. 1. GPRC5A post-transcriptionally down-regulates EGFR expression. (a) Plot of the changes in steady state mrna levels versus changes in corresponding proteins between wild type and Gprc5a-/-
SUPPLEMENTARY INFORMATION. Supplementary Figures S1-S9. Supplementary Methods
 SUPPLEMENTARY INFORMATION SUMO1 modification of PTEN regulates tumorigenesis by controlling its association with the plasma membrane Jian Huang 1,2#, Jie Yan 1,2#, Jian Zhang 3#, Shiguo Zhu 1, Yanli Wang
Supplementary Figure 1.TRIM33 binds β-catenin in the nucleus. a & b, Co-IP of endogenous TRIM33 with β-catenin in HT-29 cells (a) and HEK 293T cells
 and HEK 293T cells") Supplementary Figure 1.TRIM33 binds β-catenin in the nucleus. a & b, Co-IP of endogenous TRIM33 with β-catenin in HT-29 cells (a) and HEK 293T cells (b). TRIM33 was immunoprecipitated, and the amount of
Supplementary Figure 1.TRIM33 binds β-catenin in the nucleus. a & b, Co-IP of endogenous TRIM33 with β-catenin in HT-29 cells (a) and HEK 293T cells (b). TRIM33 was immunoprecipitated, and the amount of
Trim29 gene-targeting strategy. (a) Genotyping of wildtype mice (+/+), Trim29 heterozygous mice (+/ ) and homozygous mice ( / ).
 Genotyping of wildtype mice (+/+), Trim29 heterozygous mice (+/ ) and homozygous mice ( / ).") Supplementary Figure 1 Trim29 gene-targeting strategy. (a) Genotyping of wildtype mice (+/+), Trim29 heterozygous mice (+/ ) and homozygous mice ( / ). (b) Immunoblot analysis of TRIM29 in lung primary
Supplementary Figure 1 Trim29 gene-targeting strategy. (a) Genotyping of wildtype mice (+/+), Trim29 heterozygous mice (+/ ) and homozygous mice ( / ). (b) Immunoblot analysis of TRIM29 in lung primary
Nature Structural and Molecular Biology: doi: /nsmb Supplementary Figure 1
 Supplementary Figure 1 Mutational analysis of the SA2-Scc1 interaction in vitro and in human cells. (a) Autoradiograph (top) and Coomassie stained gel (bottom) of 35 S-labeled Myc-SA2 proteins (input)
SUPPLEMENTARY INFORMATION
 DOI: 10.1038/ncb3461 In the format provided by the authors and unedited. Supplementary Figure 1 (associated to Figure 1). Cpeb4 gene-targeted mice develop liver steatosis. a, Immunoblot displaying CPEB4
Over-expression of MKP-3 and knockdown of MKP-3 and FOXO1 in primary rat. day, cells were transduced with adenoviruses expressing GFP, MKP-3 or shgfp,
 SUPPLEMENTAL METHODS Over-expression of MKP-3 and knockdown of MKP-3 and FOXO1 in primary rat hepatocytes Primary rat hepatocytes were seeded as described in experimental procedures. The next day, cells
A Central Role of MG53 in Metabolic Syndrome. and Type-2 Diabetes
 A Central Role of MG53 in Metabolic Syndrome and Type-2 Diabetes Yan Zhang, Chunmei Cao, Rui-Ping Xiao Institute of Molecular Medicine (IMM) Peking University, Beijing, China Accelerated Aging in China
1.5 ASK1KO fed. fasted 16 hrs w/o water. Fed. 4th. 4th WT ASK1KO N=29, 11(WT), ,5(ASK1KO) ASK1KO ASK1KO **** Time [h]
![1.5 ASK1KO fed. fasted 16 hrs w/o water. Fed. 4th. 4th WT ASK1KO N=29, 11(WT), ,5(ASK1KO) ASK1KO ASK1KO **** Time [h]](/thumbs/87/97258189.jpg "1.5 ASK1KO fed. fasted 16 hrs w/o water. Fed. 4th. 4th WT ASK1KO N=29, 11(WT), ,5(ASK1KO) ASK1KO ASK1KO **** Time [h]") 7: 13: 19: 1: 7: 151117 a 151117 4th 4th b c RQ.95 KO.9.85.8.75.7 light dark light dark.65 7: 19: 7: 19: 7: Means ± SEM, N=6 RQ 1..9.8.7.6.6 KO CL (-) CL (+) ibat weight ratio (/body weight) [%].5.4.3.2.1
7: 13: 19: 1: 7: 151117 a 151117 4th 4th b c RQ.95 KO.9.85.8.75.7 light dark light dark.65 7: 19: 7: 19: 7: Means ± SEM, N=6 RQ 1..9.8.7.6.6 KO CL (-) CL (+) ibat weight ratio (/body weight) [%].5.4.3.2.1
Effect of BI-1 on insulin resistance through regulation of CYP2E1
 Effect of BI-1 on insulin resistance through regulation of CYP2E1 Geum-Hwa Lee 1, Kyoung-Jin Oh 2, 3, Hyung-Ryong Kim 4, Hye-Sook Han 2, Hwa-Young Lee 1, Keun-Gyu Park 5, Ki-Hoan Nam 6, Seung-Hoi Koo 2
Males- Western Diet WT KO Age (wks) Females- Western Diet WT KO Age (wks)
 Females- Western Diet WT KO Age (wks)") Relative Arv1 mrna Adrenal 33.48 +/- 6.2 Skeletal Muscle 22.4 +/- 4.93 Liver 6.41 +/- 1.48 Heart 5.1 +/- 2.3 Brain 4.98 +/- 2.11 Ovary 4.68 +/- 2.21 Kidney 3.98 +/-.39 Lung 2.15 +/-.6 Inguinal Subcutaneous
Relative Arv1 mrna Adrenal 33.48 +/- 6.2 Skeletal Muscle 22.4 +/- 4.93 Liver 6.41 +/- 1.48 Heart 5.1 +/- 2.3 Brain 4.98 +/- 2.11 Ovary 4.68 +/- 2.21 Kidney 3.98 +/-.39 Lung 2.15 +/-.6 Inguinal Subcutaneous
Supplementary Figure 1 CD4 + T cells from PKC-θ null mice are defective in NF-κB activation during T cell receptor signaling. CD4 + T cells were
 Supplementary Figure 1 CD4 + T cells from PKC-θ null mice are defective in NF-κB activation during T cell receptor signaling. CD4 + T cells were isolated from wild type (PKC-θ- WT) or PKC-θ null (PKC-θ-KO)
William C. Comb, Jessica E. Hutti, Patricia Cogswell, Lewis C. Cantley, and Albert S. Baldwin
 Molecular Cell, Volume 45 Supplemental Information p85 SH2 Domain Phosphorylation by IKK Promotes Feedback Inhibition of PI3K and Akt in Response to Cellular Starvation William C. Comb, Jessica E. Hutti,
SUPPLEMENTAL FIGURE LEGENDS
 SUPPLEMENTAL FIGURE LEGENDS Supplemental Figure S1: Endogenous interaction between RNF2 and H2AX: Whole cell extracts from 293T were subjected to immunoprecipitation with anti-rnf2 or anti-γ-h2ax antibodies
Supplementary Figure 1
 Supplementary Figure 1 A B mir-141, human cell lines mir-2c, human cell lines mir-141, hepatocytes mir-2c, hepatocytes Relative RNA.1.8.6.4.2 Relative RNA.3.2.1 Relative RNA 1.5 1..5 Relative RNA 2. 1.5
Title: Cytosolic DNA-mediated, STING-dependent pro-inflammatory gene. Fig. S1. STING ligands-mediated signaling response in MEFs. (A) Primary MEFs (1
 Primary MEFs (1") 1 Supporting Information 2 3 4 Title: Cytosolic DNA-mediated, STING-dependent pro-inflammatory gene induction necessitates canonical NF-κB activation through TBK1 5 6 Authors: Abe et al. 7 8 9 Supporting
1 Supporting Information 2 3 4 Title: Cytosolic DNA-mediated, STING-dependent pro-inflammatory gene induction necessitates canonical NF-κB activation through TBK1 5 6 Authors: Abe et al. 7 8 9 Supporting
Nature Immunology: doi: /ni.3866
 Nature Immunology: doi:10.1038/ni.3866 Supplementary Figure 1 The effect of TIPE2 on chemotaxis. a, The expression of TIPE2 in dhl-60c, dhl-60t, TIPE2-expressing and 15/16Q-expressing dhl-60t neutrophils
The antiparasitic drug ivermectin is a novel FXR ligand that regulates metabolism
 Supplementary Information The antiparasitic drug ivermectin is a novel FXR ligand that regulates metabolism Address correspondence to Yong Li (yongli@xmu.edu.cn, Tel: 86-592-218151) GW464 CDCA Supplementary
T H E J O U R N A L O F C E L L B I O L O G Y
 T H E J O U R N A L O F C E L L B I O L O G Y Supplemental material Krenn et al., http://www.jcb.org/cgi/content/full/jcb.201110013/dc1 Figure S1. Levels of expressed proteins and demonstration that C-terminal
SUPPLEMENTARY INFORMATION
 DOI: 10.1038/ncb2988 Supplementary Figure 1 Kif7 L130P encodes a stable protein that does not localize to cilia tips. (a) Immunoblot with KIF7 antibody in cell lysates of wild-type, Kif7 L130P and Kif7
Supplementary Fig. 1 eif6 +/- mice show a reduction in white adipose tissue, blood lipids and normal glycogen synthesis. The cohort of the original
 Supplementary Fig. 1 eif6 +/- mice show a reduction in white adipose tissue, blood lipids and normal glycogen synthesis. The cohort of the original phenotypic screening was n=40. For specific tests, the
Supplementary Figure 1 IMQ-Induced Mouse Model of Psoriasis. IMQ cream was
 Supplementary Figure 1 IMQ-Induced Mouse Model of Psoriasis. IMQ cream was painted on the shaved back skin of CBL/J and BALB/c mice for consecutive days. (a, b) Phenotypic presentation of mouse back skin
SUPPLEMENTARY INFORMATION
 SUPPLEMENTARY INFORMATION doi:10.1038/nature11464 Supplemental Figure S1. The expression of Vegfb is increased in obese and diabetic mice as compared to lean mice. a-b, Body weight and postprandial blood
A Hepatocyte Growth Factor Receptor (Met) Insulin Receptor hybrid governs hepatic glucose metabolism SUPPLEMENTARY FIGURES, LEGENDS AND METHODS
 Insulin Receptor hybrid governs hepatic glucose metabolism SUPPLEMENTARY FIGURES, LEGENDS AND METHODS") A Hepatocyte Growth Factor Receptor (Met) Insulin Receptor hybrid governs hepatic glucose metabolism Arlee Fafalios, Jihong Ma, Xinping Tan, John Stoops, Jianhua Luo, Marie C. DeFrances and Reza Zarnegar
A Hepatocyte Growth Factor Receptor (Met) Insulin Receptor hybrid governs hepatic glucose metabolism Arlee Fafalios, Jihong Ma, Xinping Tan, John Stoops, Jianhua Luo, Marie C. DeFrances and Reza Zarnegar
Supplementary Figure 1. PAQR3 knockdown inhibits SREBP-2 processing in CHO-7 cells CHO-7 cells were transfected with control sirna or a sirna
 Supplementary Figure 1. PAQR3 knockdown inhibits SREBP-2 processing in CHO-7 cells CHO-7 cells were transfected with control sirna or a sirna targeted for hamster PAQR3. At 24 h after the transfection,
Supplementary Figure 1. Confocal immunofluorescence showing mitochondrial translocation of Drp1. Cardiomyocytes treated with H 2 O 2 were prestained
 Supplementary Figure 1. Confocal immunofluorescence showing mitochondrial translocation of Drp1. Cardiomyocytes treated with H 2 O 2 were prestained with MitoTracker (red), then were immunostained with
Supplementary Figure 1
 Supplementary Figure 1 AAV-GFP injection in the MEC of the mouse brain C57Bl/6 mice at 4 months of age were injected with AAV-GFP into the MEC and sacrificed at 7 days post injection (dpi). (a) Brains
SUPPLEMENTARY INFORMATION
 Supplementary Figures Supplementary Figure S1. Binding of full-length OGT and deletion mutants to PIP strips (Echelon Biosciences). Supplementary Figure S2. Binding of the OGT (919-1036) fragments with
Tbk1-TKO! DN cells (%)! 15! 10!
! 15! 10!") a! T Cells! TKO! B Cells! TKO! b! CD4! 8.9 85.2 3.4 2.88 CD8! Tbk1-TKO! 1.1 84.8 2.51 2.54 c! DN cells (%)! 4 3 2 1 DP cells (%)! 9 8 7 6 CD4 + SP cells (%)! 5 4 3 2 1 5 TKO! TKO! TKO! TKO! 15 1 5 CD8
a! T Cells! TKO! B Cells! TKO! b! CD4! 8.9 85.2 3.4 2.88 CD8! Tbk1-TKO! 1.1 84.8 2.51 2.54 c! DN cells (%)! 4 3 2 1 DP cells (%)! 9 8 7 6 CD4 + SP cells (%)! 5 4 3 2 1 5 TKO! TKO! TKO! TKO! 15 1 5 CD8
Figure S1. Sorting nexin 9 (SNX9) specifically binds psmad3 and not psmad 1/5/8. Lysates from AKR-2B cells untreated (-) or stimulated (+) for 45 min
 specifically binds psmad3 and not psmad 1/5/8. Lysates from AKR-2B cells untreated (-) or stimulated (+) for 45 min") Figure S1. Sorting nexin 9 (SNX9) specifically binds psmad3 and not psmad 1/5/8. Lysates from AKR2B cells untreated () or stimulated () for 45 min with 5 ng/ml TGFβ or 10 ng/ml BMP4 were incubated with
Figure S1. Sorting nexin 9 (SNX9) specifically binds psmad3 and not psmad 1/5/8. Lysates from AKR2B cells untreated () or stimulated () for 45 min with 5 ng/ml TGFβ or 10 ng/ml BMP4 were incubated with
The clathrin adaptor Numb regulates intestinal cholesterol. absorption through dynamic interaction with NPC1L1
 The clathrin adaptor Numb regulates intestinal cholesterol absorption through dynamic interaction with NPC1L1 Pei-Shan Li 1, Zhen-Yan Fu 1,2, Ying-Yu Zhang 1, Jin-Hui Zhang 1, Chen-Qi Xu 1, Yi-Tong Ma
(a) Significant biological processes (upper panel) and disease biomarkers (lower panel)
 Significant biological processes (upper panel) and disease biomarkers (lower panel)") Supplementary Figure 1. Functional enrichment analyses of secretomic proteins. (a) Significant biological processes (upper panel) and disease biomarkers (lower panel) 2 involved by hrab37-mediated secretory
Supplementary Figure 1. Functional enrichment analyses of secretomic proteins. (a) Significant biological processes (upper panel) and disease biomarkers (lower panel) 2 involved by hrab37-mediated secretory
GPR120 *** * * Liver BAT iwat ewat mwat Ileum Colon. UCP1 mrna ***
 a GPR120 GPR120 mrna/ppia mrna Arbitrary Units 150 100 50 Liver BAT iwat ewat mwat Ileum Colon b UCP1 mrna Fold induction 20 15 10 5 - camp camp SB202190 - - - H89 - - - - - GW7647 Supplementary Figure
Supplementary Materials for
 www.sciencesignaling.org/cgi/content/full/8/407/ra127/dc1 Supplementary Materials for Loss of FTO in adipose tissue decreases Angptl4 translation and alters triglyceride metabolism Chao-Yung Wang,* Shian-Sen
Supplementary Figure S I: Effects of D4F on body weight and serum lipids in apoe -/- mice.
 Supplementary Figures: Supplementary Figure S I: Effects of D4F on body weight and serum lipids in apoe -/- mice. Male apoe -/- mice were fed a high-fat diet for 8 weeks, and given PBS (model group) or
control kda ATGL ATGLi HSL 82 GAPDH * ** *** WT/cTg WT/cTg ATGLi AKO/cTg AKO/cTg ATGLi WT/cTg WT/cTg ATGLi AKO/cTg AKO/cTg ATGLi iwat gwat ibat
 body weight (g) tissue weights (mg) ATGL protein expression (relative to GAPDH) HSL protein expression (relative to GAPDH) ### # # kda ATGL 55 HSL 82 GAPDH 37 2.5 2. 1.5 1..5 2. 1.5 1..5.. Supplementary
The Enhancement of Toxin-Induced Liver Fibrosis in Fatty Liver Disease. Ekihiro Seki, M.D.,Ph.D. University of California San Diego
 The Enhancement of Toxin-Induced Liver Fibrosis in Fatty Liver Disease Ekihiro Seki, M.D.,Ph.D. University of California San Diego - A manufactured chemical. - Does not exist naturally. Carbon tetrachloride
Supplementary Figure 1. Spatial distribution of LRP5 and β-catenin in intact cardiomyocytes. (a) and (b) Immunofluorescence staining of endogenous
 and (b) Immunofluorescence staining of endogenous") Supplementary Figure 1. Spatial distribution of LRP5 and β-catenin in intact cardiomyocytes. (a) and (b) Immunofluorescence staining of endogenous LRP5 in intact adult mouse ventricular myocytes (AMVMs)
Supplementary Figure 1. Spatial distribution of LRP5 and β-catenin in intact cardiomyocytes. (a) and (b) Immunofluorescence staining of endogenous LRP5 in intact adult mouse ventricular myocytes (AMVMs)
SUPPLEMENTARY FIGURES AND TABLE
 SUPPLEMENTARY FIGURES AND TABLE Supplementary Figure S1: Characterization of IRE1α mutants. A. U87-LUC cells were transduced with the lentiviral vector containing the GFP sequence (U87-LUC Tet-ON GFP).
Supplementary Materials for
 www.sciencesignaling.org/cgi/content/full/6/283/ra57/dc1 Supplementary Materials for JNK3 Couples the Neuronal Stress Response to Inhibition of Secretory Trafficking Guang Yang,* Xun Zhou, Jingyan Zhu,
supplementary information
 DOI: 1.138/ncb1 Control Atg7 / NAC 1 1 1 1 (mm) Control Atg7 / NAC 1 1 1 1 (mm) Lamin B Gstm1 Figure S1 Neither the translocation of into the nucleus nor the induction of antioxidant proteins in autophagydeficient
Supplementary Information
 Supplementary Information Overexpression of Fto leads to increased food intake and results in obesity Chris Church, Lee Moir, Fiona McMurray, Christophe Girard, Gareth T Banks, Lydia Teboul, Sara Wells,
In vivo bromodeoxyuridine (BrdU) incorporation was performed to analyze cell
 incorporation was performed to analyze cell") Supplementary Methods BrdU incorporation in vivo In vivo bromodeoxyuridine (BrdU) incorporation was performed to analyze cell proliferation in the heart. Mice were subjected to LI-TAC, and 5 days later
Supplementary Methods BrdU incorporation in vivo In vivo bromodeoxyuridine (BrdU) incorporation was performed to analyze cell proliferation in the heart. Mice were subjected to LI-TAC, and 5 days later
hexahistidine tagged GRP78 devoid of the KDEL motif (GRP78-His) on SDS-PAGE. This
 on SDS-PAGE. This") SUPPLEMENTAL FIGURE LEGEND Fig. S1. Generation and characterization of. (A) Coomassie staining of soluble hexahistidine tagged GRP78 devoid of the KDEL motif (GRP78-His) on SDS-PAGE. This protein was expressed
SUPPLEMENTAL FIGURE LEGEND Fig. S1. Generation and characterization of. (A) Coomassie staining of soluble hexahistidine tagged GRP78 devoid of the KDEL motif (GRP78-His) on SDS-PAGE. This protein was expressed
a. b. c. d. e. f. g. h. i. j. k. l. m. n. o. p.
 a. b. c. d. e. f. g. h. i. j. k. l. 2.5 2 1.5 1.5 IL-1β 12 8 6 4 2 IL-1β 9 8 7 6 4 3 3 2.9 IL-1β m. n. o. p. 1.8 1.6 1.4 1.2 1.8.6.4.2 6h LPS 2 15 1 5 6h LPS 2 6h LPS 6 4 3 6h LPS Supplementary Figure
Supplementary Figure 1
 VO (ml kg - min - ) VCO (ml kg - min - ) Respiratory exchange ratio Energy expenditure (cal kg - min - ) Locomotor activity (x count) Body temperature ( C) Relative mrna expression TA Sol EDL PT Heart
Stewart et al. CD36 ligands promote sterile inflammation through assembly of a TLR 4 and 6 heterodimer
 NFκB (fold induction) Stewart et al. ligands promote sterile inflammation through assembly of a TLR 4 and 6 heterodimer a. mrna (fold induction) 5 4 3 2 1 LDL oxldl Gro1a MIP-2 RANTES mrna (fold induction)
Supplemental Figure 1. Intracranial transduction of a modified ptomo lentiviral vector in the mouse
 Supplemental figure legends Supplemental Figure 1. Intracranial transduction of a modified ptomo lentiviral vector in the mouse hippocampus targets GFAP-positive but not NeuN-positive cells. (A) Stereotaxic
Zhu et al, page 1. Supplementary Figures
 Zhu et al, page 1 Supplementary Figures Supplementary Figure 1: Visual behavior and avoidance behavioral response in EPM trials. (a) Measures of visual behavior that performed the light avoidance behavior
Supplemental Information
 Supplemental Information Tobacco-specific Carcinogen Induces DNA Methyltransferases 1 Accumulation through AKT/GSK3β/βTrCP/hnRNP-U in Mice and Lung Cancer patients Ruo-Kai Lin, 1 Yi-Shuan Hsieh, 2 Pinpin
Figure S1. Generation of inducible PTEN deficient mice and the BMMCs (A) B6.129 Pten loxp/loxp mice were mated with B6.
 B6.129 Pten loxp/loxp mice were mated with B6.") Figure S1. Generation of inducible PTEN deficient mice and the BMMCs (A) B6.129 Pten loxp/loxp mice were mated with B6.129-Gt(ROSA)26Sor tm1(cre/ert2)tyj /J mice. To induce deletion of the Pten locus,
Figure S1. Generation of inducible PTEN deficient mice and the BMMCs (A) B6.129 Pten loxp/loxp mice were mated with B6.129-Gt(ROSA)26Sor tm1(cre/ert2)tyj /J mice. To induce deletion of the Pten locus,
Intracellular MHC class II molecules promote TLR-triggered innate. immune responses by maintaining Btk activation
 Intracellular MHC class II molecules promote TLR-triggered innate immune responses by maintaining Btk activation Xingguang Liu, Zhenzhen Zhan, Dong Li, Li Xu, Feng Ma, Peng Zhang, Hangping Yao and Xuetao
Supplementary Appendix
 Supplementary Appendix This appendix has been provided by the authors to give readers additional information about their work. Supplement to: Choi YL, Soda M, Yamashita Y, et al. EML4-ALK mutations in
Supplementary Figure 1: Co-localization of reconstituted L-PTC and dendritic cells
 a CD11c Na + K + ATPase Na + K + ATPase CD11c x-y CD11c Na + K + ATPase Na + K + ATPase CD11c x-z c b x-y view BoNT NAPs CD11c BoNT CD11c NAPs BoNT NAPs CD11c 90 x-z view Apical Basolateral Supplementary
Type of file: PDF Title of file for HTML: Supplementary Information Description: Supplementary Figures
 Type of file: PDF Title of file for HTML: Supplementary Information Description: Supplementary Figures Type of file: MOV Title of file for HTML: Supplementary Movie 1 Description: NLRP3 is moving along
Figure S1. Reduction in glomerular mir-146a levels correlate with progression to higher albuminuria in diabetic patients.
 Supplementary Materials Supplementary Figures Figure S1. Reduction in glomerular mir-146a levels correlate with progression to higher albuminuria in diabetic patients. Figure S2. Expression level of podocyte
ACC ELOVL MCAD. CPT1α 1.5 *** 0.5. Reverbα *** *** 0.5. Fasted. Refed
 Supplementary Figure A 8 SREBPc 6 5 FASN ELOVL6.5.5.5 ACC.5.5 CLOCK.5.5 CRY.5.5 PPARα.5.5 ACSL CPTα.5.5.5.5 MCAD.5.5 PEPCK.5.5 G6Pase 5.5.5.5 BMAL.5.5 Reverbα.5.5 Reverbβ.5.5 PER.5.5 PER B Fasted Refed
Nature Structural & Molecular Biology: doi: /nsmb Supplementary Figure 1. Differential expression of mirnas from the pri-mir-17-92a locus.
 Supplementary Figure 1 Differential expression of mirnas from the pri-mir-17-92a locus. (a) The mir-17-92a expression unit in the third intron of the host mir-17hg transcript. (b,c) Impact of knockdown
 DOI: 10.1038/ncb2210 b. ICAM1 ng ml -1 P = 0.0001 Small RNA (15-30nts) ng ml -1 Cell Lysate Exosome HDL Plasma HDL Normal Human HDL mirnas R = 0.45 P < 0.0001 Normal Human Exosome mirnas Figure S1. Characterization
Supplementary Figure 1. Generation of knockin mice expressing L-selectinN138G. (a) Schematics of the Sellg allele (top), the targeting vector, the
 Schematics of the Sellg allele (top), the targeting vector, the") Supplementary Figure 1. Generation of knockin mice expressing L-selectinN138G. (a) Schematics of the Sellg allele (top), the targeting vector, the targeted allele in ES cells, and the mutant allele in
Supplementary Figure 1. Generation of knockin mice expressing L-selectinN138G. (a) Schematics of the Sellg allele (top), the targeting vector, the targeted allele in ES cells, and the mutant allele in
a) Primary cultures derived from the pancreas of an 11-week-old Pdx1-Cre; K-MADM-p53
 Primary cultures derived from the pancreas of an 11-week-old Pdx1-Cre; K-MADM-p53") 1 2 3 4 5 6 7 8 9 10 Supplementary Figure 1. Induction of p53 LOH by MADM. a) Primary cultures derived from the pancreas of an 11-week-old Pdx1-Cre; K-MADM-p53 mouse revealed increased p53 KO/KO (green,
1 2 3 4 5 6 7 8 9 10 Supplementary Figure 1. Induction of p53 LOH by MADM. a) Primary cultures derived from the pancreas of an 11-week-old Pdx1-Cre; K-MADM-p53 mouse revealed increased p53 KO/KO (green,
Supplementary Figure 1. MAT IIα is Acetylated at Lysine 81.
 IP: Flag a Mascot PTM Modified Mass Error Position Gene Names Score Score Sequence m/z [ppm] 81 MAT2A;AMS2;MATA2 35.6 137.28 _AAVDYQK(ac)VVR_ 595.83-2.28 b Pre-immu After-immu Flag- WT K81R WT K81R / Flag
well for 2 h at rt. Each dot represents an individual mouse and bar is the mean ±
 Supplementary data: Control DC Blimp-1 ko DC 8 6 4 2-2 IL-1β p=.5 medium 8 6 4 2 IL-2 Medium p=.16 8 6 4 2 IL-6 medium p=.3 5 4 3 2 1-1 medium IL-1 n.s. 25 2 15 1 5 IL-12(p7) p=.15 5 IFNγ p=.65 4 3 2 1
p = formed with HCI-001 p = Relative # of blood vessels that formed with HCI-002 Control Bevacizumab + 17AAG Bevacizumab 17AAG
 A.. Relative # of ECs associated with HCI-001 1.4 1.2 1.0 0.8 0.6 0.4 0.2 0.0 ol b p < 0.001 Relative # of blood vessels that formed with HCI-001 1.4 1.2 1.0 0.8 0.6 0.4 0.2 0.0 l b p = 0.002 Control IHC:
(a) Schematic diagram of the FS mutation of UVRAG in exon 8 containing the highly instable
 Schematic diagram of the FS mutation of UVRAG in exon 8 containing the highly instable") Supplementary Figure 1. Frameshift (FS) mutation in UVRAG. (a) Schematic diagram of the FS mutation of UVRAG in exon 8 containing the highly instable A 10 DNA repeat, generating a premature stop codon
Supplementary Figure 1. Frameshift (FS) mutation in UVRAG. (a) Schematic diagram of the FS mutation of UVRAG in exon 8 containing the highly instable A 10 DNA repeat, generating a premature stop codon
Supplementary Information
 Supplementary Information Akt regulates hepatic metabolism by suppressing a Foxo1 dependent global inhibition of adaptation to nutrient intake Mingjian Lu 1, Min Wan 1, Karla F. Leavens 1, Qingwei Chu
Supplementary Table 1. The primers used for quantitative RT-PCR. Gene name Forward (5 > 3 ) Reverse (5 > 3 )
 Reverse (5 > 3 )") 770 771 Supplementary Table 1. The primers used for quantitative RT-PCR. Gene name Forward (5 > 3 ) Reverse (5 > 3 ) Human CXCL1 GCGCCCAAACCGAAGTCATA ATGGGGGATGCAGGATTGAG PF4 CCCCACTGCCCAACTGATAG TTCTTGTACAGCGGGGCTTG
770 771 Supplementary Table 1. The primers used for quantitative RT-PCR. Gene name Forward (5 > 3 ) Reverse (5 > 3 ) Human CXCL1 GCGCCCAAACCGAAGTCATA ATGGGGGATGCAGGATTGAG PF4 CCCCACTGCCCAACTGATAG TTCTTGTACAGCGGGGCTTG
T H E J O U R N A L O F C E L L B I O L O G Y
 T H E J O U R N A L O F C E L L B I O L O G Y Supplemental material Amelio et al., http://www.jcb.org/cgi/content/full/jcb.201203134/dc1 Figure S1. mir-24 regulates proliferation and by itself induces
Expanded View Figures
 PEX13 functions in selective autophagy Ming Y Lee et al Expanded View Figures Figure EV1. PEX13 is required for Sindbis virophagy. A, B Quantification of mcherry-capsid puncta per cell (A) and GFP-LC3
SUPPLEMENTARY INFORMATION
 doi:10.1038/nature11095 Supplementary Table 1. Summary of the binding between Angptls and various Igdomain containing receptors as determined by flow cytometry analysis. The results were summarized from
SUPPLEMENTARY INFORMATION
 doi: 10.1038/nature05732 SUPPLEMENTARY INFORMATION Supplemental Data Supplement Figure Legends Figure S1. RIG-I 2CARD undergo robust ubiquitination a, (top) At 48 h posttransfection with a GST, GST-RIG-I-2CARD
Supplemental Information. NRF2 Is a Major Target of ARF. in p53-independent Tumor Suppression
 Molecular Cell, Volume 68 Supplemental Information NRF2 Is a Major Target of ARF in p53-independent Tumor Suppression Delin Chen, Omid Tavana, Bo Chu, Luke Erber, Yue Chen, Richard Baer, and Wei Gu Figure
Supplemental Figure 1. Western blot analysis indicated that MIF was detected in the fractions of
 Supplemental Figure Legends Supplemental Figure 1. Western blot analysis indicated that was detected in the fractions of plasma membrane and cytosol but not in nuclear fraction isolated from Pkd1 null