International Statistical Literacy Competition of the ISLP Training package 3
|
|
|
- Dominick Blake
- 5 years ago
- Views:
Transcription

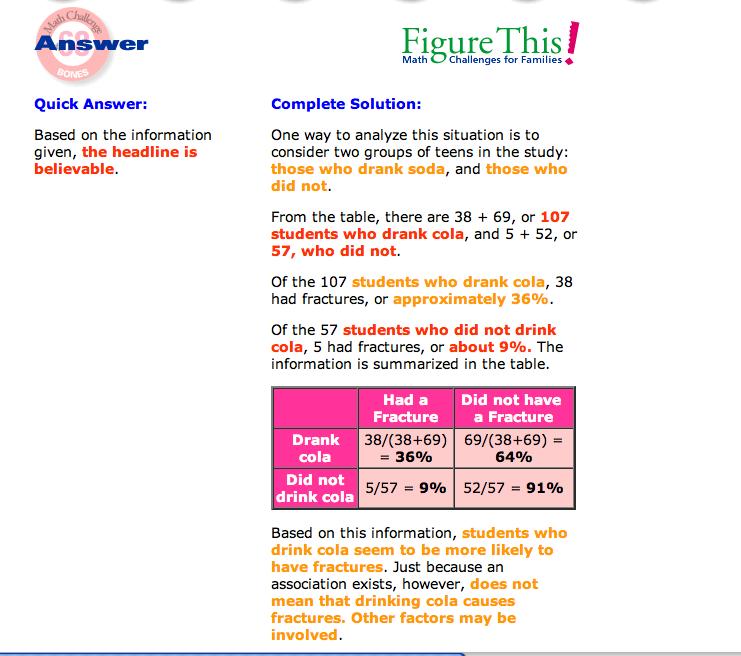
1 International Statistical Literacy Competition of the ISLP Training package Drinking Soda and bone Health 1
2 2

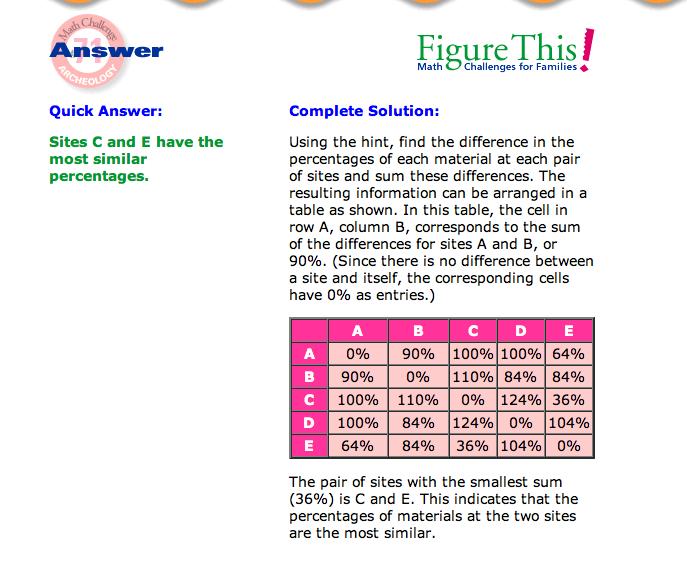
3 2.- Comparing Archaeological Sites 3
4 4

5 3.- Estimating Chances of Winning given some information 5
6 6

7 4.- How many fish? 7
8 8

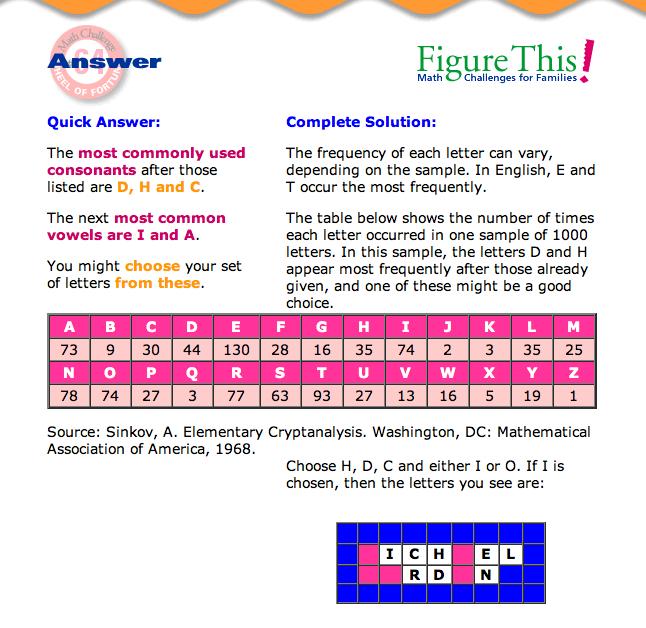
9 5.- Language 9
10 10

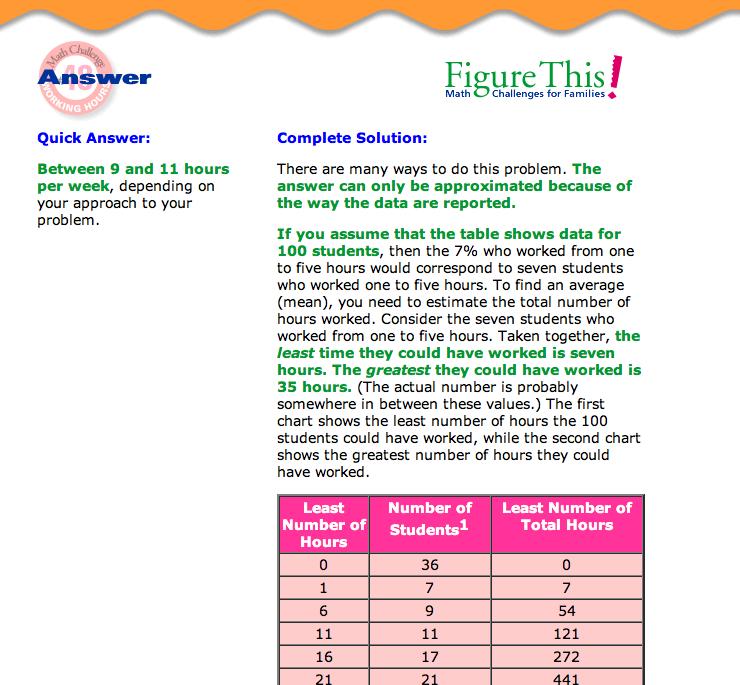
11 6.- How much time do Teens spend on the job? 11
12 12
13 7.- Sleeping Time How much time do students in your school sleep at night? Do girls show a significantly different pattern of sleep than boys? What do you think would explain a difference if there was one? Do a survey of your class and record for each student the following variables: Sleep= sleep time last night in hours Sex = Boy or girl Mystery= the variable that you think might explain a difference if it exists. Determine with a graph and the relevant summary statistics whether there is a difference. Is there a significant difference? Could you extrapolate to other boys and girls in the larger world out there your conclusions for the class? Were you right in your hypothesis about the reason for a difference, if there is any? To Teacher This is a very open ended question, where the student has to prepare a questionnaire, do the survey, collect the data, realize that measures of central tendency and variability have to be used to compare the two groups. They have to decide how they are going to tabulate their data set, how to summarize variable by variable and how to show a relationship sexsleeping. Box plots, histograms and other creative graphs can be used to compare. Make the students write a summary of what they found. 13


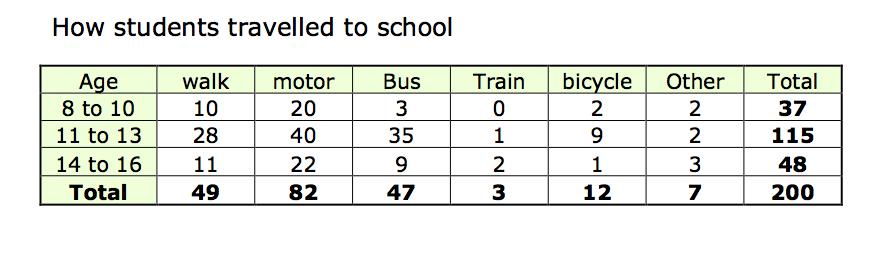
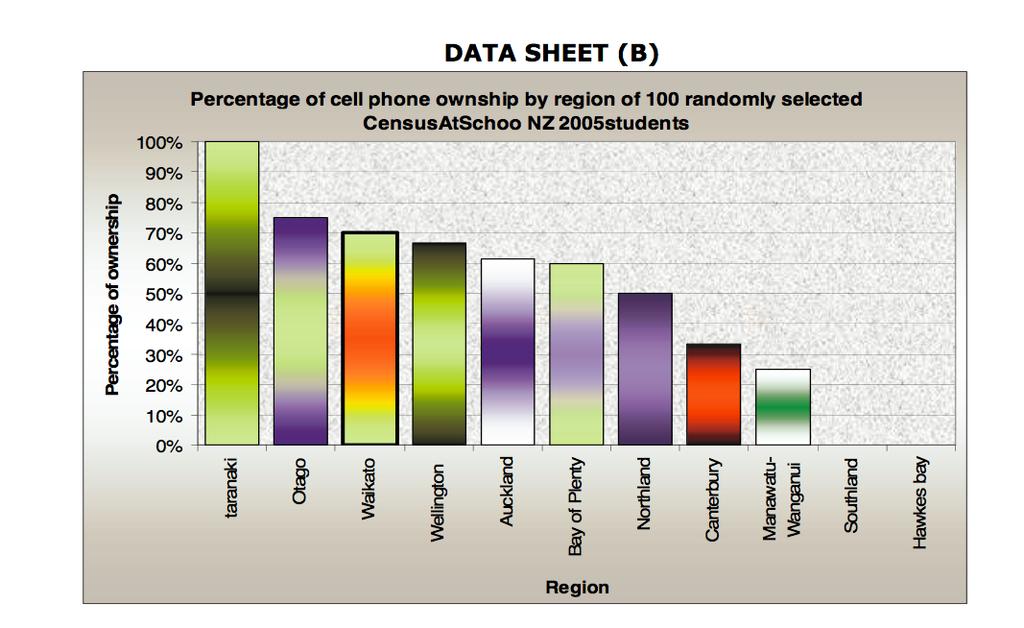
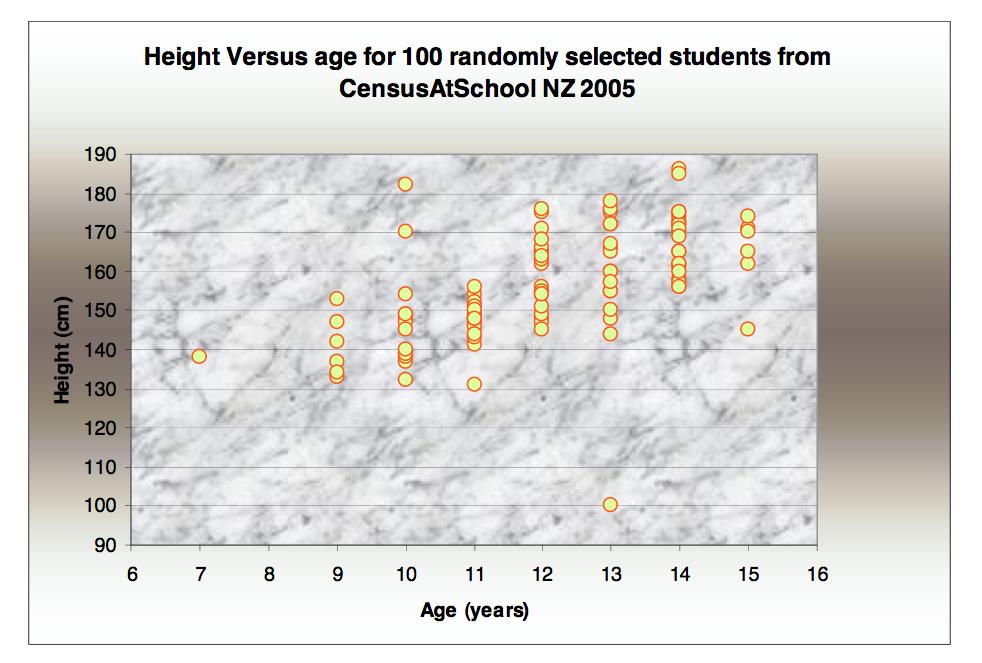
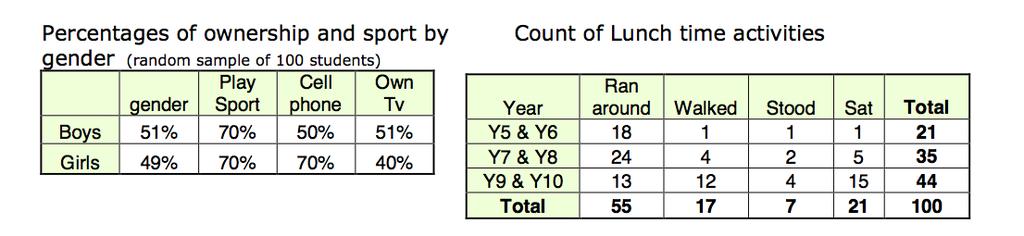
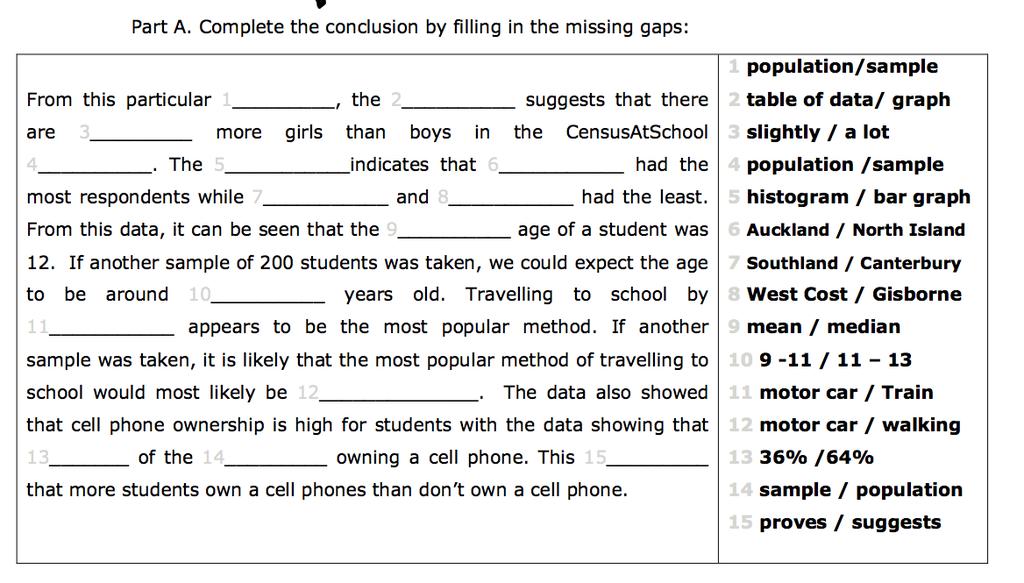
14 8.- From CensusAtSchool New Zealand Information provided in the next two pages. 14
15 15
16 16
17 17

18 TEACHER NOTES PART B 18
19 9. The Effectiveness of Captopril 1. Introduction Pharmaceutical manufacturers go through a very rigorous process in order to get their drugs approved for sale. The process is designed to determine whether or not the drug works. There are a variety of factors that make this more difficult than it might seem at first blush. One factor is that different people have different reactions to the same drug. So it s not true that a drug works or doesn t work. In truth, it will have a different effect on different people and therefore, drug manufacturers have to convince the government that it works, on average, loosely speaking. In this activity, we will examine a study designed to study the effectiveness of the drug Captopril to lower blood pressure. We will focus only on Captopril s effect on systolic blood pressure. The study, reported in the British Medicine Journal in 1979, examined 15 patients. Each patient had his or her blood pressure measured, was given the drug, and then had their blood pressure taken again several minutes later. The fifteen patients were given equal dosage of the drug. 2.- The Data In order to test the effectiveness of the drug Captopril to lower blood pressure we need to have the measurements of the blood pressure before the patients took the drug, and the blood pressure after taking the drug. The data set containing this information is given below. For each patient, the variable called before represents the systolic blood pressure before Captopril was administered, while the variable called after represents the systolic blood pressure after Captopril was administered. Patient before after
20 Question 1: What type of variables are before and after? Question 2: Describe the distribution of blood pressures of the sample before taking the drug. Support your answer with the summary statistics you get and the plots. Refer both to spread and typical values. Use summary statistics, a histogram and a box plot to do that. In view of the distribution and the summary statistics you get, which statistics do you think are the most appropriate to summarize the distribution Question 3. Describe the distribution of blood pressures of the sample after taking the drug. Support your answer with the summary statistics you get and the plots. Refer both to spread and typical values. Use summary statistics, a histogram and a box plot to do that. In view of the distribution and the summary statistics you get, which statistics do you think are the most appropriate to summarize the distribution? Copy-paste your histogram, your box plot and your summary statistics and write Question 4. Our research question is whether Captopril is effective in lowering systolic blood pressure. So what we really need is to examine both before and after simultaneously. Do comparative box plots and comparative summary statistics, and determine whether Captopril was effective in lowering blood pressure. Explain your answer and support it with the summary statistics and the box plots. Question 5.- Do you think all the participants changed by the same amount? If so, explain. If not, which patients do you think changed the most? Which changed the least? Do you think it s possible that anybody s blood pressure increased? Can you answer these questions with any of the graphs we have used? Question 7.- So far we have looked at descriptions of the blood pressures before taking the drug separately from the blood pressures after. But it would be nice to know who in the group changed, and in which fashion. These questions can be answered with a little more effort. These data are what we call paired. Every individual that contributes a value in the first variable also contributes an observation in the second variable. We can focus our investigation on the change. So we will create a new variable called difference (difference=bp after BP before) and look at its histogram. Describe the distribution of the variable difference and comment on the following: what was the greatest change? What was the least change? What was a typical amount of change? Did anybody s blood pressure increase? By how much? Did anyone show no change? Support your answers with the graphs and the numbers in the data. We will also do a stem and leaf plot 20
21 Question 8.-How many people saw their blood pressure fall by 20 or more? 2 Question 9.- If Captopril were ineffective, about where would you expect the center of the distribution of the variable difference to be? 21
22 Teacher Question 1: Before is a quantitative variable, after is a quantitative variable. Question 2: Min. 1st Qu. Median Mean 3rd Qu. Max sd= IQR=18.5 According to the histogram and summary statistics, before Captopril, blood pressure ranged from 98 to 130, with 50% of the people having between 103 and 121.5, and 25% having more than It looks like we have a bimodal distribution with some people around the range and others around the range. However, if you notice, there are too many bins for the number of cases. So the bimodality is just an artifact of so many bins. So those are really the typical values. Judging by the standard deviation, the spread is quite large. There are no outliers. The mean and median seem to be very close so we could just use mean and standard deviation as measures of spread 22
23 Min. 1st Qu. Median Mean 3rd Qu. Max sd= IQR=10 According to the histogram and summary statistics, before Captopril, most of the blood pressures ranged from 82 to 110, with 50% of the people having between 103 and 108, and 25% having more than 108. Nobody has between 110 and 120, so the group accounbts for that upper 25%. to be kind of different from the rest of the group. So those are really the typical values. Judging by the standard deviation, the spread is quite large. With bimodality, the box plot is not very helpful, but it confirms the range and interquartile range seen in the histogram and the summary statistics. 23
24 The mean is really close to the median, and the shape of the histogram does not help conclude skweness one way or the other, so the mean and standard deviation are as good here as the median and interquartile range. Question 4 before after Min. : 98.0 Min. : st Qu.: st Qu.: 98.0 Median :112.0 Median :103.0 Mean :112.3 Mean : rd Qu.: rd Qu.:108.0 Max. :130.0 Max. :125.0 Looking at the summary statistics and the box plot we can see that all summary statistics are lower after than before. The median is lower, the 1 st quartile is lower, et The interquartile range is lower after than before, too, suggesting that patients s blood pressure are much more concentrated around the median after than before, a more homogeneous group. The reason we have a higher standard deviation after is that there are two outliers, one in the upper end and another in the lower end. According to all this information, Captopril was effective in decreasing blood pressure. Question 7 The histogram shows that most patients saw their blood pressure decrease. Only 2 had blood pressure that increased. What was the greatest change? A decrease of 23 (-23). What was the least change? A decrease of 1 (-1) What was a typical amount of change? A decrease of (-15 to 20) or a decrease of 0-5 (0 to 5). Did anybody s blood pressure increase? Yes. By how much? 4 and 2 Did anyone show no change? No, there are no 0. 24
25 > stem(change) The decimal point is 1 digit(s) to the right of the Students can see all these things by creating another column in the data table which they can find by subtracting after from before and by looking at the histogram of the variable difference. Note: difference refers to the the change in the blood pressure (BP after-bp before). 25

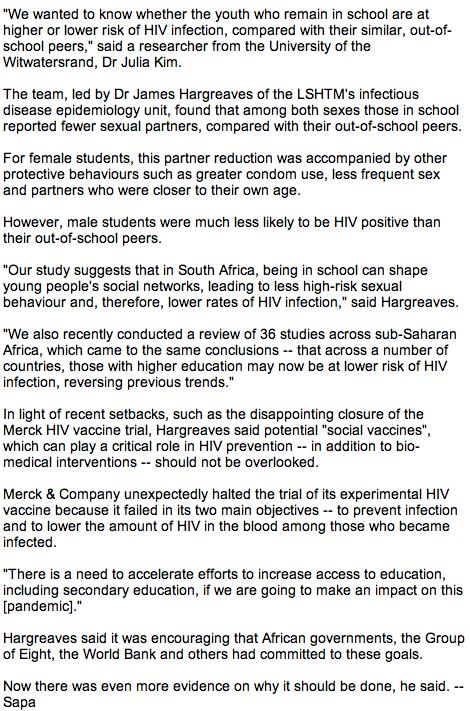
26 10.-The media NATIONAL School attendance can lower risk of HIV, study shows Johannesburg, South Africa 17 January :52 26
27 27
28 Activity for learners 1.- Describe how the research study described in this news article was done. Could this kind of study have been done through an experiment (a clinical trial style study). 2.- Describe the conclusions of the study. 3.- Identify things in a person that may lead the person to be cautious about AIDS 4.- Rewrite the conclusion of this article based on what you know about how statistical studies should be done to establish causality. 28
29 11.-Bullying Example 4.3, Teachers Notes FET Phase By Delia North Suppose that learners at various schools are interviewed to establish whether they feel that the school has taken necessary steps to protect them against bullying from older children. Children from rural and urban schools are interviewed. Suppose that 40 learners at rural schools felt that the school took steps to protect them against bullying from older children, while 51 learners at rural schools did not think that they were adequately protected against bullying by older children. In urban schools, 64 learners felt that the school protected them against bullying, whilst 34 did not think so. (a) Set up a 2 x 2 contingency table to reflect the frequencies as given above. (b) Set up a 2 x2 contingency table with all probabilities in the appropriate cells, so as to answer (i) What is the probability that a randomly chosen learner is from a rural school? (ii) What is the probability that a randomly chosen learner does not think his school takes adequate steps to protect him against bullying? (iii) What is the probability that a randomly chosen learner is from a rural school and feels that the school does take steps to protect him against bullying from older children? (iv) What is the probability that a randomly chosen learner does not feel that the school takes adequate steps to protect him against bullying, given he is from a rural school. 29
The Effectiveness of Captopril
 Lab 7 The Effectiveness of Captopril In the United States, pharmaceutical manufacturers go through a very rigorous process in order to get their drugs approved for sale. This process is designed to determine
Unit 7 Comparisons and Relationships
 Unit 7 Comparisons and Relationships Objectives: To understand the distinction between making a comparison and describing a relationship To select appropriate graphical displays for making comparisons
Section I: Multiple Choice Select the best answer for each question.
 Chapter 1 AP Statistics Practice Test (TPS- 4 p78) Section I: Multiple Choice Select the best answer for each question. 1. You record the age, marital status, and earned income of a sample of 1463 women.
1.4 - Linear Regression and MS Excel
 1.4 - Linear Regression and MS Excel Regression is an analytic technique for determining the relationship between a dependent variable and an independent variable. When the two variables have a linear
M 140 Test 1 A Name SHOW YOUR WORK FOR FULL CREDIT! Problem Max. Points Your Points Total 60
 M 140 Test 1 A Name SHOW YOUR WORK FOR FULL CREDIT! Problem Max. Points Your Points 1-10 10 11 3 12 4 13 3 14 10 15 14 16 10 17 7 18 4 19 4 Total 60 Multiple choice questions (1 point each) For questions
Introduction to Statistical Data Analysis I
 Introduction to Statistical Data Analysis I JULY 2011 Afsaneh Yazdani Preface What is Statistics? Preface What is Statistics? Science of: designing studies or experiments, collecting data Summarizing/modeling/analyzing
PubHlth Introductory Biostatistics Practice Test I (Without Unit 3 Questions)
") 1 PubHlth 540 - Introductory Biostatistics Practice Test I (Without Unit 3 Questions) 1. (10 points) In the Honolulu Heart Study, Systolic Blood Pressure was tabulated for 100 Subjects including 37 Smokers
1 PubHlth 540 - Introductory Biostatistics Practice Test I (Without Unit 3 Questions) 1. (10 points) In the Honolulu Heart Study, Systolic Blood Pressure was tabulated for 100 Subjects including 37 Smokers
Undertaking statistical analysis of
 Descriptive statistics: Simply telling a story Laura Delaney introduces the principles of descriptive statistical analysis and presents an overview of the various ways in which data can be presented by
Key: 18 5 = 1.85 cm. 5 a Stem Leaf. Key: 2 0 = 20 points. b Stem Leaf Key: 2 0 = 20 cm. 6 a Stem Leaf. c Stem Leaf
 Answers EXERCISE. D D C B Numerical: a, b, c Categorical: c, d, e, f, g Discrete: c Continuous: a, b C 9 C Categorical B A Categorical and ordinal Discrete Ordinal D EXERCISE. Stem Leaf 9 9 9 Key: = Stem
M 140 Test 1 A Name (1 point) SHOW YOUR WORK FOR FULL CREDIT! Problem Max. Points Your Points Total 75
 SHOW YOUR WORK FOR FULL CREDIT! Problem Max. Points Your Points Total 75") M 140 est 1 A Name (1 point) SHOW YOUR WORK FOR FULL CREDI! Problem Max. Points Your Points 1-10 10 11 10 12 3 13 4 14 18 15 8 16 7 17 14 otal 75 Multiple choice questions (1 point each) For questions
M 140 est 1 A Name (1 point) SHOW YOUR WORK FOR FULL CREDI! Problem Max. Points Your Points 1-10 10 11 10 12 3 13 4 14 18 15 8 16 7 17 14 otal 75 Multiple choice questions (1 point each) For questions
Statistics 13, Midterm 1
 Statistics 13, Midterm 1 Name: 1. (1 points) In this question we will consider two different graphical procedures. Answer as completely as you can, but only supply meaningful comparisons. 1 175 data 5
Understandable Statistics
 Understandable Statistics correlated to the Advanced Placement Program Course Description for Statistics Prepared for Alabama CC2 6/2003 2003 Understandable Statistics 2003 correlated to the Advanced Placement
MATH 1040 Skittles Data Project
 Laura Boren MATH 1040 Data Project For our project in MATH 1040 everyone in the class was asked to buy a 2.17 individual sized bag of skittles and count the number of each color of candy in the bag. The
3. For a $5 lunch with a 55 cent ($0.55) tip, what is the value of the residual?
 tip, what is the value of the residual?") STATISTICS 216, SPRING 2006 Name: EXAM 1; February 21, 2006; 100 points. Instructions: Closed book. Closed notes. Calculator allowed. Double-sided exam. NO CELL PHONES. Multiple Choice (3pts each). Circle
STATISTICS 216, SPRING 2006 Name: EXAM 1; February 21, 2006; 100 points. Instructions: Closed book. Closed notes. Calculator allowed. Double-sided exam. NO CELL PHONES. Multiple Choice (3pts each). Circle
Population. Sample. AP Statistics Notes for Chapter 1 Section 1.0 Making Sense of Data. Statistics: Data Analysis:
 Section 1.0 Making Sense of Data Statistics: Data Analysis: Individuals objects described by a set of data Variable any characteristic of an individual Categorical Variable places an individual into one
PRINTABLE VERSION. Quiz 1. True or False: The amount of rainfall in your state last month is an example of continuous data.
 Question 1 PRINTABLE VERSION Quiz 1 True or False: The amount of rainfall in your state last month is an example of continuous data. a) True b) False Question 2 True or False: The standard deviation is
Math 2200 First Mid-Term Exam September 22, 2010
 Math 2200 First Mid-Term Exam September 22, 2010 This exam has 25 questions of 4 points each. All answers have been rounded-off so if your calculated answer differs from the given options slightly, choose
Chapter 1: Exploring Data
 Chapter 1: Exploring Data Key Vocabulary:! individual! variable! frequency table! relative frequency table! distribution! pie chart! bar graph! two-way table! marginal distributions! conditional distributions!
(a) 50% of the shows have a rating greater than: impossible to tell
 50% of the shows have a rating greater than: impossible to tell") q 1. Here is a histogram of the Distribution of grades on a quiz. How many students took the quiz? What percentage of students scored below a 60 on the quiz? (Assume left-hand endpoints are included in
q 1. Here is a histogram of the Distribution of grades on a quiz. How many students took the quiz? What percentage of students scored below a 60 on the quiz? (Assume left-hand endpoints are included in
AP Stats Review for Midterm
 AP Stats Review for Midterm NAME: Format: 10% of final grade. There will be 20 multiple-choice questions and 3 free response questions. The multiple-choice questions will be worth 2 points each and the
Section 1.2 Displaying Quantitative Data with Graphs. Dotplots
 Section 1.2 Displaying Quantitative Data with Graphs Dotplots One of the simplest graphs to construct and interpret is a dotplot. Each data value is shown as a dot above its location on a number line.
V. Gathering and Exploring Data
 V. Gathering and Exploring Data With the language of probability in our vocabulary, we re now ready to talk about sampling and analyzing data. Data Analysis We can divide statistical methods into roughly
STT315 Chapter 2: Methods for Describing Sets of Data - Part 2
 Chapter 2.5 Interpreting Standard Deviation Chebyshev Theorem Empirical Rule Chebyshev Theorem says that for ANY shape of data distribution at least 3/4 of all data fall no farther from the mean than 2
Examining differences between two sets of scores
 6 Examining differences between two sets of scores In this chapter you will learn about tests which tell us if there is a statistically significant difference between two sets of scores. In so doing you
(a) 50% of the shows have a rating greater than: impossible to tell
 50% of the shows have a rating greater than: impossible to tell") KEY 1. Here is a histogram of the Distribution of grades on a quiz. How many students took the quiz? 15 What percentage of students scored below a 60 on the quiz? (Assume left-hand endpoints are included
KEY 1. Here is a histogram of the Distribution of grades on a quiz. How many students took the quiz? 15 What percentage of students scored below a 60 on the quiz? (Assume left-hand endpoints are included
5 14.notebook May 14, 2015
 Objective: I can represent categorical data using a two way frequency table Entry: A marketing company is trying to determine how much diversity there is in the age of people who drink different soft drinks.
Unit 1 Exploring and Understanding Data
 Unit 1 Exploring and Understanding Data Area Principle Bar Chart Boxplot Conditional Distribution Dotplot Empirical Rule Five Number Summary Frequency Distribution Frequency Polygon Histogram Interquartile
Level 2 Mathematics and Statistics, 2013
 91267 912670 2SUPERVISOR S Level 2 Mathematics and Statistics, 2013 91267 Apply probability methods in solving problems 2.00 pm Monday 18 November 2013 Credits: Four Achievement Achievement with Merit
AP Statistics. Semester One Review Part 1 Chapters 1-5
 AP Statistics Semester One Review Part 1 Chapters 1-5 AP Statistics Topics Describing Data Producing Data Probability Statistical Inference Describing Data Ch 1: Describing Data: Graphically and Numerically
Lesson 1: Distributions and Their Shapes
 Lesson 1 Name Date Lesson 1: Distributions and Their Shapes 1. Sam said that a typical flight delay for the sixty BigAir flights was approximately one hour. Do you agree? Why or why not? 2. Sam said that
Missy Wittenzellner Big Brother Big Sister Project
 Missy Wittenzellner Big Brother Big Sister Project Evaluation of Normality: Before the analysis, we need to make sure that the data is normally distributed Based on the histogram, our match length data
Lecture 13. Outliers
 Lecture 13 Outliers Outliers In this lesson: 1. Finding quartiles in a stem and leaf diagram: 2. One definition of an outlier 3. How to classify an observation as an outlier. What you should be able to
People have used random sampling for a long time
 Sampling People have used random sampling for a long time Sampling by lots is mentioned in the Bible. People recognised that it is a way to select fairly if every individual has an equal chance of being
Test 1 Version A STAT 3090 Spring 2018
 Multiple Choice: (Questions 1 20) Answer the following questions on the scantron provided using a #2 pencil. Bubble the response that best answers the question. Each multiple choice correct response is
4.3 Measures of Variation
 4.3 Measures of Variation! How much variation is there in the data?! Look for the spread of the distribution.! What do we mean by spread? 1 Example Data set:! Weight of contents of regular cola (grams).
Announcement. Homework #2 due next Friday at 5pm. Midterm is in 2 weeks. It will cover everything through the end of next week (week 5).
.") Announcement Homework #2 due next Friday at 5pm. Midterm is in 2 weeks. It will cover everything through the end of next week (week 5). Political Science 15 Lecture 8: Descriptive Statistics (Part 1) Data
Announcement Homework #2 due next Friday at 5pm. Midterm is in 2 weeks. It will cover everything through the end of next week (week 5). Political Science 15 Lecture 8: Descriptive Statistics (Part 1) Data
What you should know before you collect data. BAE 815 (Fall 2017) Dr. Zifei Liu
 Dr. Zifei Liu") What you should know before you collect data BAE 815 (Fall 2017) Dr. Zifei Liu Zifeiliu@ksu.edu Types and levels of study Descriptive statistics Inferential statistics How to choose a statistical test
What you should know before you collect data BAE 815 (Fall 2017) Dr. Zifei Liu Zifeiliu@ksu.edu Types and levels of study Descriptive statistics Inferential statistics How to choose a statistical test
Instructions and Checklist
 BIOSTATS 540 Fall 2015 Exam 1 Corrected 9-28-2015 Page 1 of 11 BIOSTATS 540 - Introductory Biostatistics Fall 2015 Examination 1 Due: Monday October 5, 2015 Last Date for Submission with Credit: Monday
UF#Stats#Club#STA#2023#Exam#1#Review#Packet# #Fall#2013#
 UF#Stats#Club#STA##Exam##Review#Packet# #Fall## The following data consists of the scores the Gators basketball team scored during the 8 games played in the - season. 84 74 66 58 79 8 7 64 8 6 78 79 77
SAMPLE ASSESSMENT TASKS MATHEMATICS ESSENTIAL GENERAL YEAR 11
 SAMPLE ASSESSMENT TASKS MATHEMATICS ESSENTIAL GENERAL YEAR 11 Copyright School Curriculum and Standards Authority, 2014 This document apart from any third party copyright material contained in it may be
Test 1: Professor Symanzik Statistics
 Page 1 of 11 1 (6 Points) A researcher wants to learn whether regularly taking chromium picolinate may reduce elevated cholesterol values. The researcher is considering two approaches to study this issue:
Further Mathematics 2018 CORE: Data analysis Chapter 3 Investigating associations between two variables
 Chapter 3: Investigating associations between two variables Further Mathematics 2018 CORE: Data analysis Chapter 3 Investigating associations between two variables Extract from Study Design Key knowledge
Biostatistics. Donna Kritz-Silverstein, Ph.D. Professor Department of Family & Preventive Medicine University of California, San Diego
 Biostatistics Donna Kritz-Silverstein, Ph.D. Professor Department of Family & Preventive Medicine University of California, San Diego (858) 534-1818 dsilverstein@ucsd.edu Introduction Overview of statistical
Conduct an Experiment to Investigate a Situation
 Level 3 AS91583 4 Credits Internal Conduct an Experiment to Investigate a Situation Written by J Wills MathsNZ jwills@mathsnz.com Achievement Achievement with Merit Achievement with Excellence Conduct
CCM6+7+ Unit 12 Data Collection and Analysis
 Page 1 CCM6+7+ Unit 12 Packet: Statistics and Data Analysis CCM6+7+ Unit 12 Data Collection and Analysis Big Ideas Page(s) What is data/statistics? 2-4 Measures of Reliability and Variability: Sampling,
UNIVERSITY OF TORONTO SCARBOROUGH Department of Computer and Mathematical Sciences Midterm Test February 2016
 UNIVERSITY OF TORONTO SCARBOROUGH Department of Computer and Mathematical Sciences Midterm Test February 2016 STAB22H3 Statistics I, LEC 01 and LEC 02 Duration: 1 hour and 45 minutes Last Name: First Name:
STATISTICS 8 CHAPTERS 1 TO 6, SAMPLE MULTIPLE CHOICE QUESTIONS
 STATISTICS 8 CHAPTERS 1 TO 6, SAMPLE MULTIPLE CHOICE QUESTIONS Circle the best answer. This scenario applies to Questions 1 and 2: A study was done to compare the lung capacity of coal miners to the lung
Knowledge discovery tools 381
 Knowledge discovery tools 381 hours, and prime time is prime time precisely because more people tend to watch television at that time.. Compare histograms from di erent periods of time. Changes in histogram
Medical Statistics 1. Basic Concepts Farhad Pishgar. Defining the data. Alive after 6 months?
 Medical Statistics 1 Basic Concepts Farhad Pishgar Defining the data Population and samples Except when a full census is taken, we collect data on a sample from a much larger group called the population.
Smoking Calculator. Study Guide
 www.nosmokes.com.au Smoking Calculator Information for teachers Study Guide The Smoking Calculator is an online tool which illustrates the real cost of cigarettes; both financially and to your health.
MULTIPLE CHOICE. Choose the one alternative that best completes the statement or answers the question.
 Statistics Final Review Semeter I Name MULTIPLE CHOICE. Choose the one alternative that best completes the statement or answers the question. Provide an appropriate response. 1) The Centers for Disease
YSU Students. STATS 3743 Dr. Huang-Hwa Andy Chang Term Project 2 May 2002
 YSU Students STATS 3743 Dr. Huang-Hwa Andy Chang Term Project May 00 Anthony Koulianos, Chemical Engineer Kyle Unger, Chemical Engineer Vasilia Vamvakis, Chemical Engineer I. Executive Summary It is common
Table of Contents. Plots. Essential Statistics for Nursing Research 1/12/2017
 Essential Statistics for Nursing Research Kristen Carlin, MPH Seattle Nursing Research Workshop January 30, 2017 Table of Contents Plots Descriptive statistics Sample size/power Correlations Hypothesis
Statistical Techniques. Masoud Mansoury and Anas Abulfaraj
 Statistical Techniques Masoud Mansoury and Anas Abulfaraj What is Statistics? https://www.youtube.com/watch?v=lmmzj7599pw The definition of Statistics The practice or science of collecting and analyzing
Empirical Rule ( rule) applies ONLY to Normal Distribution (modeled by so called bell curve)
 applies ONLY to Normal Distribution (modeled by so called bell curve)") Chapter 2.5 Interpreting Standard Deviation Chebyshev Theorem Empirical Rule Chebyshev Theorem says that for ANY shape of data distribution at least 3/4 of all data fall no farther from the mean than 2
Chapter 2.5 Interpreting Standard Deviation Chebyshev Theorem Empirical Rule Chebyshev Theorem says that for ANY shape of data distribution at least 3/4 of all data fall no farther from the mean than 2
Test 1C AP Statistics Name:
 Test 1C AP Statistics Name: Part 1: Multiple Choice. Circle the letter corresponding to the best answer. 1. At the beginning of the school year, a high-school teacher asks every student in her classes
PubHlth Introductory Biostatistics Fall 2011 Examination 1 Due Monday October 31, 2011
 PubHlth 540 2011 Exam I Page 1 of 13 PubHlth 540 - Introductory Biostatistics Fall 2011 Examination 1 Due Monday October 31, 2011 Before you begin: This is a take-home exam. You are welcome to use any
Practice First Midterm Exam
 Practice First Midterm Exam Statistics 200 (Pfenning) This is a closed book exam worth 150 points. You are allowed to use a calculator and a two-sided sheet of notes. There are 9 problems, with point values
MULTIPLE CHOICE. Choose the one alternative that best completes the statement or answers the question.
 Exam Name MULTIPLE CHOICE. Choose the one alternative that best completes the statement or answers the question. Identify the W's for the description of data. 1) A survey of bicycles parked outside college
Statistics. Nur Hidayanto PSP English Education Dept. SStatistics/Nur Hidayanto PSP/PBI
 Statistics Nur Hidayanto PSP English Education Dept. RESEARCH STATISTICS WHAT S THE RELATIONSHIP? RESEARCH RESEARCH positivistic Prepositivistic Postpositivistic Data Initial Observation (research Question)
Water Microbiology Proficiency Test Scheme. Overview & Description
 National Laboratory Association South Africa Association Incorporated under Section 21 Not for Gain) P.O. Box 298 1 De Havilland Crescent Persequor Park Persequor Technopark Pretoria, South Africa, 0020
HW 1 - Bus Stat. Student:
 HW 1 - Bus Stat Student: 1. An identification of police officers by rank would represent a(n) level of measurement. A. Nominative C. Interval D. Ratio 2. A(n) variable is a qualitative variable such that
Quantitative Methods in Computing Education Research (A brief overview tips and techniques)
") Quantitative Methods in Computing Education Research (A brief overview tips and techniques) Dr Judy Sheard Senior Lecturer Co-Director, Computing Education Research Group Monash University judy.sheard@monash.edu
Quantitative Methods in Computing Education Research (A brief overview tips and techniques) Dr Judy Sheard Senior Lecturer Co-Director, Computing Education Research Group Monash University judy.sheard@monash.edu
Identify two variables. Classify them as explanatory or response and quantitative or explanatory.
 OLI Module 2 - Examining Relationships Objective Summarize and describe the distribution of a categorical variable in context. Generate and interpret several different graphical displays of the distribution
Module 4 Introduction
 Module 4 Introduction Recall the Big Picture: We begin a statistical investigation with a research question. The investigation proceeds with the following steps: Produce Data: Determine what to measure,
PubHlth Introductory Biostatistics Fall 2013 Examination 1 - REQURED Due Monday September 30, 2013
 PubHlth 540 Fall 2013 Exam I Page 1 of 10 PubHlth 540 - Introductory Biostatistics Fall 2013 Examination 1 - REQURED Due Monday September 30, 2013 Before you begin: This is a take-home exam. You are welcome
Lesson 8 Descriptive Statistics: Measures of Central Tendency and Dispersion
 Lesson 8 Descriptive Statistics: Measures of Central Tendency and Dispersion Learning Objectives All students will define key terms and calculate different descriptive statistics. All students should be
Chapter Three in-class Exercises. MULTIPLE CHOICE. Choose the one alternative that best completes the statement or answers the question.
 Name Chapter Three in-class Exercises MULTIPLE CHOICE. Choose the one alternative that best completes the statement or answers the question. 1) The table below lists the populations, in thousands, of several
Risk Aversion in Games of Chance
 Risk Aversion in Games of Chance Imagine the following scenario: Someone asks you to play a game and you are given $5,000 to begin. A ball is drawn from a bin containing 39 balls each numbered 1-39 and
Descriptive Research a systematic, objective observation of people.
 What is going on in this picture? We cannot say exactly, but we can describe what we see. Thus we have.. Descriptive Research a systematic, objective observation of people. Any research that observes and
STA 3024 Spring 2013 EXAM 3 Test Form Code A UF ID #
 STA 3024 Spring 2013 Name EXAM 3 Test Form Code A UF ID # Instructions: This exam contains 34 Multiple Choice questions. Each question is worth 3 points, for a total of 102 points (there are TWO bonus
Lesson 11 Correlations
 Lesson 11 Correlations Lesson Objectives All students will define key terms and explain the difference between correlations and experiments. All students should be able to analyse scattergrams using knowledge
Outline. Practice. Confounding Variables. Discuss. Observational Studies vs Experiments. Observational Studies vs Experiments
 1 2 Outline Finish sampling slides from Tuesday. Study design what do you do with the subjects/units once you select them? (OI Sections 1.4-1.5) Observational studies vs. experiments Descriptive statistics
Unit 1 Outline Science Practices. Part 1 - The Scientific Method. Screencasts found at: sciencepeek.com. 1. List the steps of the scientific method.
 Screencasts found at: sciencepeek.com Part 1 - The Scientific Method 1. List the steps of the scientific method. 2. What is an observation? Give an example. Quantitative or Qualitative Data? 35 grams?
10/4/2007 MATH 171 Name: Dr. Lunsford Test Points Possible
 Pledge: 10/4/2007 MATH 171 Name: Dr. Lunsford Test 1 100 Points Possible I. Short Answer and Multiple Choice. (36 points total) 1. Circle all of the items below that are measures of center of a distribution:
MOCKTIME.COM ONLINE TEST SERIES CORRESPONDENCE COURSE
 Simplification 1. Simplify : 1 + (a) 28/17 (b) 15/7 (c) 23/17 (d) 38/17 2. Evaluate: [ ] (a) 9/10 (b) -(8/17 ) (c) - (16/19 ) (d) 4/7 3. 45 [4- {3 - (3 3 6)}] is equal to : (a) 10 (b) 6 (c) 4 (d) 0 4.
Basic Statistics for Comparing the Centers of Continuous Data From Two Groups
 STATS CONSULTANT Basic Statistics for Comparing the Centers of Continuous Data From Two Groups Matt Hall, PhD, Troy Richardson, PhD Comparing continuous data across groups is paramount in research and
OCW Epidemiology and Biostatistics, 2010 David Tybor, MS, MPH and Kenneth Chui, PhD Tufts University School of Medicine October 27, 2010
 OCW Epidemiology and Biostatistics, 2010 David Tybor, MS, MPH and Kenneth Chui, PhD Tufts University School of Medicine October 27, 2010 SAMPLING AND CONFIDENCE INTERVALS Learning objectives for this session:
Chapter 1: Explaining Behavior
 Chapter 1: Explaining Behavior GOAL OF SCIENCE is to generate explanations for various puzzling natural phenomenon. - Generate general laws of behavior (psychology) RESEARCH: principle method for acquiring
bivariate analysis: The statistical analysis of the relationship between two variables.
 bivariate analysis: The statistical analysis of the relationship between two variables. cell frequency: The number of cases in a cell of a cross-tabulation (contingency table). chi-square (χ 2 ) test for
WDHS Curriculum Map Probability and Statistics. What is Statistics and how does it relate to you?
 WDHS Curriculum Map Probability and Statistics Time Interval/ Unit 1: Introduction to Statistics 1.1-1.3 2 weeks S-IC-1: Understand statistics as a process for making inferences about population parameters
Higher Psychology RESEARCH REVISION
 Higher Psychology RESEARCH REVISION 1 The biggest change from the old Higher course (up to 2014) is the possibility of an analysis and evaluation question (8-10) marks asking you to comment on aspects
AP Statistics Practice Test Unit Seven Sampling Distributions. Name Period Date
 AP Statistics Practice Test Unit Seven Sampling Distributions Name Period Date Vocabulary: 1. Define and provide an example of a statistic.. Define Sampling Distribution. 3. Define the variability of a
Probability and Statistics. Chapter 1
 Probability and Statistics Chapter 1 Individuals and Variables Individuals and Variables Individuals are objects described by data. Individuals and Variables Individuals are objects described by data.
Welcome to OSA Training Statistics Part II
 Welcome to OSA Training Statistics Part II Course Summary Using data about a population to draw graphs Frequency distribution and variability within populations Bell Curves: What are they and where do
q2_2 MULTIPLE CHOICE. Choose the one alternative that best completes the statement or answers the question.
 q2_2 MULTIPLE CHOICE. Choose the one alternative that best completes the statement or answers the question. A sporting goods retailer conducted a customer survey to determine its customers primary reason
MINUTE TO WIN IT: NAMING THE PRESIDENTS OF THE UNITED STATES
 MINUTE TO WIN IT: NAMING THE PRESIDENTS OF THE UNITED STATES THE PRESIDENTS OF THE UNITED STATES Project: Focus on the Presidents of the United States Objective: See how many Presidents of the United States
Collecting & Making Sense of
 Collecting & Making Sense of Quantitative Data Deborah Eldredge, PhD, RN Director, Quality, Research & Magnet Recognition i Oregon Health & Science University Margo A. Halm, RN, PhD, ACNS-BC, FAHA Director,
Students were asked to report how far (in miles) they each live from school. The following distances were recorded. 1 Zane Jackson 0.
 they each live from school. The following distances were recorded. 1 Zane Jackson 0.") Identifying Outliers Task Students were asked to report how far (in miles) they each live from school. The following distances were recorded. Student Distance 1 Zane 0.4 2 Jackson 0.5 3 Benjamin 1.0 4
Identifying Outliers Task Students were asked to report how far (in miles) they each live from school. The following distances were recorded. Student Distance 1 Zane 0.4 2 Jackson 0.5 3 Benjamin 1.0 4
Human-Computer Interaction IS4300. I6 Swing Layout Managers due now
 Human-Computer Interaction IS4300 1 I6 Swing Layout Managers due now You have two choices for requirements: 1) try to duplicate the functionality of an existing applet; or, 2) create your own (ideally
Part 1. For each of the following questions fill-in the blanks. Each question is worth 2 points.
 Part 1. For each of the following questions fill-in the blanks. Each question is worth 2 points. 1. The bell-shaped frequency curve is so common that if a population has this shape, the measurements are
Rising Scholars Academy 8 th Grade English I Summer Reading Project The Alchemist By Paulo Coelho
 Rising Scholars Academy 8 th Grade English I Summer Reading Project The Alchemist By Paulo Coelho Welcome to 8th grade English I! Summer is a time where you can relax and have fun, but did you know you
3. What is the most common form in which tobacco is used? Name three other tobacco products.
 Chapter 13 lesson 1: 1. What is nicotine? 2. Identify and describe the risks associated with three harmful substances found in all forms of tobacco. 3. What is the most common form in which tobacco is
AP STATISTICS 2010 SCORING GUIDELINES (Form B)
") AP STATISTICS 2010 SCORING GUIDELINES (Form B) Question 1 Intent of Question The primary goals of this question were to assess students ability to (1) compare three distributions of a quantitative variable;
AP STATISTICS 2010 SCORING GUIDELINES (Form B) Question 1 Intent of Question The primary goals of this question were to assess students ability to (1) compare three distributions of a quantitative variable;
Statistics is the science of collecting, organizing, presenting, analyzing, and interpreting data to assist in making effective decisions
 Readings: OpenStax Textbook - Chapters 1 5 (online) Appendix D & E (online) Plous - Chapters 1, 5, 6, 13 (online) Introductory comments Describe how familiarity with statistical methods can - be associated
First Hourly Quiz. SW 430: Research Methods in Social Work I
 SW 430 1 st Hourly Quiz - 1 of 11 SW 430: Research Methods in Social Work I First Hourly Quiz Name: 1.23. When we use the Method of Science, we hold a belief because a. evidence from a systematic observation
Statistics Assignment 11 - Solutions
 Statistics 44.3 Assignment 11 - Solutions 1. Samples were taken of individuals with each blood type to see if the average white blood cell count differed among types. Eleven individuals in each group were
How to Conduct On-Farm Trials. Dr. Jim Walworth Dept. of Soil, Water & Environmental Sci. University of Arizona
 How to Conduct On-Farm Trials Dr. Jim Walworth Dept. of Soil, Water & Environmental Sci. University of Arizona How can you determine whether a treatment (this might be an additive, a fertilizer, snake
Chapter 1. Picturing Distributions with Graphs
 Chapter 1 Picturing Distributions with Graphs Statistics Statistics is a science that involves the extraction of information from numerical data obtained during an experiment or from a sample. It involves