2004 Florida Youth Substance Abuse Survey
|
|
|
- Kenneth Kennedy
- 5 years ago
- Views:
Transcription


1 2004 Florida Youth Substance Abuse Survey Miami-Dade County Executive Office of the Governor
2 2004 Florida Youth Substance Abuse Survey Miami-Dade County Report
3 2004 Florida Department of Children & Families
4 EXECUTIVE SUMMARY T he Florida Legislature s 1999 Drug Control Summit recommended the establishment of an annual, multi-agencydirected, statewide school-based survey effort, combining several survey instruments, with specific variations in odd and even years. The Florida Youth Substance Abuse Survey (FYSAS), one of these instruments and the focus of this report, is administered to a county-level sample of students in even years, and a smaller statewide sample in odd years. The FYSAS is based on the Communities That Care Youth Survey, developed from the nationally recognized work of Dr. J. David Hawkins and Dr. Richard F. Catalano. It not only measures the prevalence of alcohol, tobacco and other drug use and delinquent behavior, but also measures the risk and protective factors related to these behaviors. The 2004 FYSAS was administered to 1,808 Miami-Dade County students in grades 6 through 12 in the spring of The results supply a valuable source of information to help reduce and prevent the use of alcohol, tobacco and other drugs by school-aged youth. Key Survey Results Strengths to Build on Past-30-day prevalence rates for Ecstasy (1.0%), Rohypnol (0.7%), LSD or PCP (0.4%), hallucinogenic mushrooms (0.9%), ketamine (0.4%), crack cocaine (0.6%), heroin (0.6%), OxyContin (0.4%), amphetamines (0.6%) and steroids (0.6%) are all 1.0% or less. Relatively few students reported that they would be seen as cool by their peers if they drank alcohol regularly (8.3%), smoked cigarettes (5.3%) or smoked marijuana (10.2%). A substantial proportion of students indicated that it would be wrong or very wrong for someone their age to smoke cigarettes (81.1%), smoke marijuana (85.5%) or use other illicit drugs (95.1%). A majority of respondents reported that each of the following behaviors poses a great risk of harm: smoking a pack or more of cigarettes per day (63.1%) and regular use of marijuana (62.8%). Students reported particularly low percentile scores for two risk factor scales that are directly associated with alcohol, tobacco and other drug use: Perceived Availability of Drugs and Handguns (35) and Low Perceived Risks of Drug Use (38). Prevalence rates for Carrying a Handgun (3.6%), Selling Drugs (3.9%), Attempting to Steal a Vehicle (3.8%) and Taking a Handgun to (1.1%) are all less than 5.0%. Opportunities for Improvement With overall prevalence rates of 57.9% for lifetime use and 30.9% for past-30-day use, alcohol is the most commonly used drug among Miami-Dade County students. Binge drinking (defined as the consumption of five or more drinks in a row within the last two weeks) is more prevalent than past-30-day tobacco, marijuana and other illicit drug use.
5 After alcohol, students reported cigarettes (30.0% lifetime and 8.1% past-30-day) and marijuana (17.7% lifetime and 8.6% past-30-day) as the most commonly used drugs. Prevalence rates for other drugs are substantially lower. Among Miami-Dade County students, lifetime use of inhalants increased from 8.3% in 2000 to 10.8% in Miami-Dade County students reported one of their highest percentile scores for the community risk factor scale Personal Transitions and Mobility (63). This means that students are less likely to become involved with prosocial organizations and positive role models in their communities. Miami-Dade County students reported some of their lowest percentile scores for two reward-based protective factor scales: Rewards for Prosocial Involvement (40) and Community Rewards for Prosocial Involvement (42). This means that schools and communities need to provide additional positive feedback to students, to help them form prosocial bonds in their schools and communities. Disapproval of alcohol use seems to have weakened over time. The percentage of students reporting that it would be wrong or very wrong for someone their age to drink alcohol regularly decreased from 70.2% in 2000 to 65.5% in Of surveyed Miami -Dade County students, 14.1% reported Getting Suspended. These key findings illustrate the complexity of drug use and antisocial behavior among Miami -Dade County s youth and the possible factors that may contribute to these activities. While some of the findings compare favorably to the national findings, Miami-Dade County youth are still reporting drug use and delinquent behavior that will negatively affect their lives and our society. The FYSAS data will enable Miami-Dade County s planners to learn which risk and protective factors to target for their prevention, intervention and treatment programs.
6 Table of Contents METHODOLOGY...1 VALIDITY OF SURVEY DATA...1 WEIGHTING...1 CONFIDENCE INTERVALS...2 DEMOGRAPHICS...2 ALCOHOL, TOBACCO AND OTHER DRUG USE...2 ALCOHOL...3 TOBACCO...4 MARIJUANA OR HASHISH...5 INHALANTS...6 CLUB DRUGS...6 Ecstasy...6 Other Club Drugs...7 OTHER ILLICIT DRUGS...7 DRUG COMBINATION RATES...7 Any Illicit Drug...7 Any Illicit Drug Other than Marijuana...8 Alcohol Only...8 Alcohol or Any Illicit Drug...8 Any Illicit Drug, but No Alcohol...8 OTHER ANTISOCIAL BEHAVIORS...9 RISK AND PROTECTIVE FACTORS THE SOCIAL DEVELOPMENT STRATEGY...10 MEASUREMENT...12 USING YOUR RISK AND PROTECTIVE FACTOR DATA...12 Risk and Protective Factor Prioritization...12 Choosing Effective Prevention Strategies...16 SPECIAL TOPICS AGE OF ONSET OF ATOD USE...18 PERCEIVED RISK OF HARM...18 PERSONAL DISAPPROVAL...18 PEER APPROVAL...19 APPENDIX A: DETAILED TABLES APPENDIX B: REFERENCES APPENDIX C: THE SOCIAL DEVELOPMENT STRATEGY APPENDIX D: OTHER RESOURCES... 37
7
8 2004 Florida Youth Substance Abuse Survey Miami-Dade County Report T he 2004 Florida Youth Substance Abuse Survey (FYSAS) provides scientifically sound information to communities on the prevalence of alcohol, tobacco and other drug (ATOD) use, and risk and protective factors among 6 th through 12 th grade students. This information is essential to support effective substance abuse needsassessment and services planning, and to measure performance outcomes at local and state levels. This report is one in a series of reports that describes the findings from the FYSAS. As part of the 2004 Florida Youth Survey effort, the FYSAS was administered to Florida youth jointly with the Florida Youth Tobacco Survey in May of The Florida Youth Survey effort was a collaboration among the Florida Departments of Health, Education, Children and Families, Juvenile Justice, and the Florida Office of Drug Control. This report was prepared by Channing Bete Company, Inc. The FYSAS was previously administered at the county level to Miami-Dade County students in (1) December of 1999 and January of 2000 and (2) May of While the survey form has been updated with some additions to the ATOD question battery, the majority of the instrument has remained unchanged. As a result, the present report includes both an analysis of current survey results and comparisons with the 2000 and 2002 survey findings. Comparison data for risk and protective factors come from research (the Six-State Study) funded by the Center for Substance Abuse Prevention, Department of Health and Human Services. This project collected school survey data from six states and provided the normative data on risk and protective factor prevalence used here. This report contains only a brief discussion of methodology. More extensive information on survey administration, methodology and statewide findings can be found in the statewide report, available online at: Methodology The sampling strategy was designed to produce survey results that are representative at both the state and county levels, with a minimal margin of error. In Miami-Dade County, this method resulted in a sample target of 2,853 middle school students and 2,532 high school students. After invalid responses were removed, valid questionnaires from 1,027 middle school students and 767 high school students were included in the dataset. This final sample includes 36% of the target middle school sample and 30% of the target high school sample. Validity of Survey Data Four strategies were used to assess the validity of survey responses. Data were eliminated from the analysis for youth who appeared to exaggerate their substance use or antisocial behavior, reported use of a fictitious drug, or reported logically inconsistent patterns of substance use. These four strategies have been shown to consistently identify most surveys that were completed in a random fashion, those that were not taken seriously, and/or those that are not valid for other reasons. Miami-Dade County students produced a high percentage (94.1%) of valid surveys. Only 113 surveys were deemed invalid. Weighting In statewide school-based survey projects like the FYSAS, nonrandom variations in participation across grade levels are common. Grade-level sampling bias 2004 Florida Youth Substance Abuse Survey - Miami-Dade County Report 1
9 is especially problematic because ATOD use is strongly associated with age. In order to generate drug use prevalence estimates and risk and protective factor scale scores that more accurately represent 6 th to 12 th grade students in Miami-Dade County, it is necessary to adjust the grade distribution of the sample to match the population. This is achieved with a statistical technique called weighting. Through this process, responses from the grades that were underrepresented relative to the true population are given more weight in the data analysis, while responses from the grades that were overrepresented are given less weight. This creates a sample that proportionately matches student enrollments across grade levels. The 2000 and 2002 Miami-Dade County datasets were weighted in this manner as well. Additional weights were also applied to the 2000 dataset to help adjust for the earlier administration dates (December and January) that were employed in that survey effort. (See the 2002 FYSAS statewide report for a complete description of the methods used to prepare the 2000 data for analysis.) Confidence Intervals For the full sample of Miami-Dade County respondents, the maximum 95% confidence interval estimate ( the margin of error ) is ±2.3 percentage points for prevalence rates approximating 50% (such as alcohol or tobacco). The maximum 95% confidence interval estimate is ±1.4 percentage points for prevalence rates of 10% or lower (such as Ecstasy or cocaine). The level of certainty, in this case 95%, means that 95 out of 100 times the true population value will fall within the range of the confidence interval. For example, if 40% of the sample indicate using alcohol and the confidence interval is ±2.0%, then the population value should fall within a range of 38% to 42%. For subgroup analyses, confidence intervals are larger. Estimates for Miami-Dade County middle school students have confidence intervals ranging fro m ±3.1 percentage points (50% prevalence rates) to ±1.8 percentage points (10% prevalence rates). Estimates for high school students have confidence intervals ranging from ±3.5 percentage points (50% prevalence rates) to ±2.1 percentage points (10% prevalence rates). Demographics The survey measures a variety of demographic characteristics. The first two data columns of Table 1 (see Appendix A for data tables) describe the demographic profile of the Miami-Dade County sample before weights were applied. Please note that some categories do not sum to 100% due to missing values. Despite covering only three out of seven surveyed grades, middle school students constituted slightly more than one half of the sample (56.8% middle school versus 42.4% high school). A higher percentage of the respondents were female (52.9% female versus 42.9% male). Hispanic/Latino students represent 59.2% of the sample. The largest minority population is African American students (22.5%), followed by White, non-hispanic students (5.4% ). The rest of the ethnic breakdown ranges from 0.2% for Native Hawaiian/Pacific Islander students to 9.8% for students who indicated Other/Multiple ethnic backgrounds. The second set of data columns in Table 1 presents the demographic profile information for the statewide sample. Alcohol, Tobacco and Other Drug Use Alcohol, tobacco and other drug (ATOD) use is measured by a set of 43 items on the 2004 FYSAS. While most of the survey items are identical to those used in previous waves of the survey, several key changes have been made. Starting in 2001, the survey included items measuring: (a) the use of so-called club drugs such as Ecstasy, GHB, ketamine and Rohypnol, (b) the use of hallucinogenic mushrooms, and (c) the use of amphetamines, including Ritalin and Adderall. In addition, the use of marijuana and the use of hashish were combined into a single item, and the use of LSD and other psychedelics was reworded to read LSD or PCP. Starting in 2002, the questionnaire incorporated three additional changes: (a) a new item measuring the use of OxyContin without a doctor s orders, (b) the prescription drug Xanax was added to the list of examples given in the depressants and downers question, and (c) the other narcotics item was replaced by a new question measuring the use of prescription pain relievers without a doctor s orders. Tables 2 and 3 and Graphs 1 and 2 show the percentage of surveyed Miami-Dade County students Florida Youth Substance Abuse Survey - Miami-Dade County Report
10 who reported using ATODs. These results are presented for both lifetime and past-30-day prevalence of use periods. Lifetime prevalence of use (whether the student has ever used the drug) is a good measure of student experimentation. Past-30-day prevalence of use (whether the student has used the drug within the last month) is a good measure of current use. In addition to the standard lifetime and past-30-day prevalence rates for alcohol use, binge drinking behavior (defined as a report of five or more drinks in a row within the past two weeks) is also measured. Comparisons to the statewide results of the 2004 survey are presented in Tables 2 and 3 and Graphs 3 through 8. Trend comparisons to Miami-Dade County results from the 2000 and 2002 surveys are presented in Tables 4 and 5 and Graphs 3 through 6. Alcohol In most communities, alcohol is the drug used by the largest number of adolescents. As Graph 1 shows, this is indeed the case in Miami-Dade County. Prevalence of Use. Of the students surveyed in Miami-Dade County in 2004, 57.9% have used alcohol on at least one occasion in their lifetimes. This corresponds to a rate of 45.2% among middle school students and 67.9% among high school students. Current use is substantially lower. Overall, 30.9% of surveyed Miami -Dade County students reported the use of alcohol in the past 30 days, with grade-cohort averages of 20.3% for middle school students and 39.2% for high school students. Statewide Comparison. As Graph 3 shows, the prevalence of past-30-day alcohol use for 2004 is lower in Miami-Dade County compared to the state of Florida as a whole. Overall, 30.9% of surveyed Miami-Dade County students reported the use of alcohol in the past 30 days compared to 32.3% of surveyed students statewide. Grade-cohort analysis shows that this overall lower rate of use is concentrated in high school (39.2% for Miami-Dade County versus 42.0% statewide) rather than middle school (20.3% for Miami-Dade County versus 20.3% statewide) Trend. Overall, in Miami-Dade County, past-30-day alcohol use decreased 1.9 percentage points between 2000 and 2002 and increased 3.1 percentage points between 2002 and 2004, for a net increase of 1.2 percentage points. Among high school students, past-30-day alcohol use increased 2.8 percentage points between 2000 and In contrast, middle school student use decreased 0.5 percentage points between 2000 and Graph 1 Lifetime use of alcohol, tobacco and other drugs by Miami-Dade County youth, Percentage use Alcohol Cigarettes Marijuana or Hashish Inhalants Smokeless Tobacco Cocaine Other Prescription Pain Relievers Depressants Ecstasy Methamphetamine Hallucinogenic Mushrooms Crack Cocaine GHB Rohypnol LSD or PCP Amphetamines Steroids Heroin Ketamine OxyContin 3
11 Graph 2 Past-30-day use of alcohol, tobacco and other drugs by Miami-Dade County youth, Percentage use Alcohol Binge Drinking Marijuana or Hashish Cigarettes Inhalants Smokeless Tobacco Other Prescription Pain Relievers Methamphetamine GHB Depressants Cocaine Ecstasy Hallucinogenic Mushrooms Rohypnol Steroids Amphetamines Heroin Crack Cocaine OxyContin Ketamine LSD or PCP Binge Drinking. Findings on binge drinking (defined as consuming five or more drinks in a row within the past two weeks) are likely to be among the most important findings related to alcohol use (Johnston, O Malley, Bachman & Schulenberg, 2004). In Miami-Dade County, 14.6% of surveyed students reported binge drinking, with corresponding rates of 8.1% among middle school students and 19.5% among high school students. While this represents a similar rate of middle school binge drinking compared to the state as a whole (8.5%), Miami- Dade County high school students reported a lower rate compared to results from across Florida (22.0%). Tobacco This section of the report discusses the prevalence of tobacco use as measured by the 2004 FYSAS. Another survey, the 2004 Florida Youth Tobacco Survey (Florida Department of Health), was administered simultaneously with the 2004 FYSAS, and was specifically tobacco related. That survey is Florida s official source for youth tobacco use information. The information presented in this report is consistent with findings reported in the 2004 Florida Youth Tobacco Survey. Prevalence of Use. Of the students surveyed in Miami-Dade County in 2004, 30.0% have used cigarettes on at least one Percentage use Graph occasion in their lifetimes. This corresponds to a rate of 19.8% among middle school students and 38.1% among high school students. Current use is substantially lower. Overall, 8.1% of surveyed Miami-Dade County students reported the use of cigarettes in the past 30 days, with grade-cohort averages of 4.5% for middle school students and 11.0% for high school students. Statewide Comparison. As Graph 4 shows, the prevalence of past-30-day cigarette use for 2004 is lower in Miami-Dade County compared to the state of Florida as a whole. Overall, 8.1% of surveyed Miami-Dade County students reported the use of Past-30-day alcohol use, Miami-Dade County and Florida 2004 Overall County 2000 County 2002 County 2004 Florida Florida Youth Substance Abuse Survey - Miami-Dade County Report
12 Percentage use Graph Past-30-day cigarette use, Miami-Dade County and Florida 2004 Overall County 2000 County 2002 County 2004 Florida 2004 cigarettes in the past 30 days compared to 11.4% of surveyed students statewide. This lower rate of use applies both to middle school (4.5% for Miami-Dade County versus 6.9% statewide) and high school (11.0% for Miami-Dade County versus 15.0% statewide) grade-cohorts Trend. Overall, in Miami-Dade County, past-30-day cigarette use decreased 4.1 percentage points between 2000 and 2002 and increased 2.2 percentage points between 2002 and 2004, for a net reduction of 1.9 percentage points. Among middle school students, past-30-day cigarette use decreased 3.6 percentage points between 2000 and Among high school students, past-30-day cigarette use decreased 0.5 percentage points between 2000 and Smokeless Tobacco. The prevalence of smokeless tobacco use is substantially lower than cigarette use. Overall, 5.8% of surveyed Miami -Dade County students reported using smokeless tobacco in their lifetimes, with corresponding rates of 5.0% among middle school students and 6.5% among high school students. The overall prevalence for past-30-day use is 2.5%, with corresponding rates of 2.3% among middle school students and 2.5% among high school students. Graph day rates more than doubled during this period. Since 1996 and 1997, when marijuana use peaked, rates have declined slightly. Prevalence of Use. Of the students surveyed in Miami-Dade County in 2004, 17.7% have used marijuana or hashish on at least one occasion in their lifetimes. This corresponds to a rate of 7.7% among middle school students and 25.5% among high school students. Current use is substantially lower. Overall, 8.6% of surveyed Miami-Dade County students reported the use of marijuana or hashish in the past 30 days, with grade-cohort averages of 3.6% for middle school students and 12.6% for high school students. Statewide Comparison. As Graph 5 shows, the prevalence of past-30-day marijuana or hashish use for 2004 is lower in Miami-Dade County compared to the state of Florida as a whole. Overall, 8.6% of surveyed Miami -Dade County students reported the use of marijuana or hashish in the past 30 days compared to 11.5% of surveyed students statewide. This lower rate of use applies both to middle school (3.6% for Miami-Dade County versus 5.3% statewide) and high school (12.6% for Miami-Dade County versus 16.4% statewide) grade-cohorts Trend. Overall, in Miami-Dade County, past-30-day marijuana or hashish use decreased 2.4 percentage points between 2000 and 2002 and increased 2.1 percentage points between 2002 and 2004, for a net reduction of 0.3 percentage points. Among middle school students, past-30-day marijuana or hashish use decreased 1.0 percentage points between 2000 and In contrast, high Past-30-day marijuana or hashish use, Miami-Dade County and Florida 2004 Marijuana or Hashish During the 1990s, there were major changes in trends of marijuana use throughout the United States. Results from the Monitoring the Future study show dramatic increases in both lifetime and past-30-day prevalence rates through the early and mid 1990s (Johnston et al., 2004). For 8 th and 10 th graders, the past- Percentage use 20 0 Overall County 2000 County 2002 County 2004 Florida
13 Percentage use Graph school student use increased 0.2 percentage points between 2000 and Inhalants Past-30-day inhalant use, Miami-Dade County and Florida 2004 Overall County 2000 County 2002 County 2004 Florida 2004 After alcohol, tobacco and marijuana, the most commonly used drug among Florida students is inhalants. In contrast to other ATODs, inhalant use is more prevalent with younger students, perhaps because inhalants are often the easiest drugs for them to obtain. This finding is typical of most youth substance use surveys. Prevalence of Use. Of the students surveyed in Miami-Dade County in 2004, 10.8% have used inhalants on at least one occasion in their lifetimes. This corresponds to a rate of 14.8% among middle school students and 7.7% among high school students. Current use is substantially lower. Overall, 3.7% of surveyed Miami-Dade County students reported the use of inhalants in the past 30 days, with grade-cohort averages of 5.8% for middle school students and 2.0% for high school students Trend. Overall, in Miami- Dade County, past-30-day inhalant use decreased 0.6 percentage points between 2000 and 2002 and increased 0.5 percentage points between 2002 and 2004, for a net reduction of 0.1 percentage points. Among high school students, past- 30-day inhalant use decreased 0.6 percentage points between 2000 and In contrast, middle school student use increased 0.7 percentage points between 2000 and Club Drugs Club drugs are a broad category of illicit substances that are classified together because their use started at dance clubs and raves, not because they are of a similar chemical class (like amphetamines). Their use, however, has expanded beyond these settings. For the purpose of the 2004 FYSAS, club drugs include Ecstasy, GHB, ketamine and Rohypnol. Note that this list is not meant to be exclusive, as other drugs are used at clubs and raves. Ecstasy Prevalence of Use. As it is across the state as a whole, Ecstasy is the most commonly used club drug in Miami-Dade County. Overall, 3.6% of surveyed Miami-Dade County students have used Ecstasy on at least one occasion in their lifetimes. This corresponds to a rate of 1.8% among middle school students and 5.1% among high school students. Current use is substantially lower. Overall, 1.0% of surveyed Miami-Dade County students reported the use of Ecstasy in the past 30 days, with grade-cohort averages of 1.0% for middle school students and Statewide Comparison. As Graph 6 shows, the prevalence of past-30-day inhalant use for 2004 in Miami-Dade County is similar to the rate for the state of Florida as a whole. Across all surveyed grades, 3.7% of surveyed Miami-Dade County students reported the use of inhalants in the past 30 days compared to 4.2% of surveyed students statewide. This similarity in the rates of use applies both to middle school (5.8% for Miami-Dade County versus 6.6% statewide) and high school (2.0% for Miami-Dade County versus 2.4% statewide) grade-cohorts. Percentage use Graph Past-30-day Ecstasy use, Miami-Dade County and Florida 2004 Overall County 2002 County 2004 Florida Florida Youth Substance Abuse Survey - Miami-Dade County Report
14 1.0% for high school students. Statewide Comparison. As Graph 7 shows, the prevalence of past-30-day Ecstasy use for 2004 in Miami-Dade County is similar to the rate for the state of Florida as a whole. Across all surveyed grades, 1.0% of surveyed Miami-Dade County students reported the use of Ecstasy in the past 30 days compared to 1.1% of surveyed students statewide. This similarity in the rates of use applies both to middle school (1.0% for Miami-Dade County versus 0.8% statewide) and high school (1.0% for Miami- Dade County versus 1.3% statewide) grade-cohorts Trend. Miami-Dade County students reported rates of past-30-day Ecstasy use that are relatively stable across years, going from 1.4% in 2002 to 1.0% in school rates were also stable, going from 0.6% in 2002 to 1.0% in However, high school rates decreased from 2.1% in 2002 to 1.0% in Other Club Drugs The remaining club drugs Rohypnol, GHB and ketamine all have lower levels of use. In 2004, surveyed Miami-Dade County students reported overall lifetime prevalence rates for Rohypnol, GHB and ketamine of 1.9%, 1.9% and 1.2%, respectively. The past-30-day use rates for these same drugs were 0.7%, 1.3% and 0.4%, respectively. Very few students are experimenting with or currently using these drugs. Other Illicit Drugs The 2004 FYSAS also measured the prevalence of use of a variety of other illicit drugs among Miami-Dade County students. This includes use of the following: LSD or PCP, hallucinogenic mushrooms, cocaine, crack cocaine, methamphetamine, depressants, heroin, OxyContin, other prescription pain relievers, steroids without a doctor s orders, and amphetamines. Results for these illicit drugs are presented in Tables 2 through 5. Prevalence of Use. Lifetime prevalence-of-use rates for this group of drugs range from a high of 4.4% for cocaine to a low of 0.8% for OxyContin. The prevalence of use within the past 30 days is lower, going from a high of 1.7% for other prescription pain relievers to a low of 0.4% for OxyContin and LSD or PCP. Statewide Comparison. On average, lifetime prevalence rates for other illicit drug use are lower in Miami-Dade County than in the state of Florida as a whole. In particular, Miami-Dade County students reported lower rates of other prescription pain reliever use (4.3% in Miami-Dade County versus 7.8% in Florida) and use of depressants (4.2% in Miami-Dade County versus 7.1% in Florida) than their counterparts from across the state. Past-30-day prevalence rates are too low to allow a meaningful comparison between the samples. Drug Combination Rates Prevalence-of-use rates for combinations of drugs provide a helpful summary of drug use behavior. Tables 2 and 3 present lifetime and past-30-day prevalence rates for combinations of drugs (the use of one or more drugs from a set of illicit drugs). Illicit drugs are substances that are illegal for adults to use, so they include all drugs on the survey except alcohol, cigarettes and smokeless tobacco. This list includes: marijuana or hashish, inhalants, LSD or PCP, cocaine, crack cocaine, methamphetamine, depressants, heroin and steroids. In order to provide comparability with previous reports, only drugs that were included on all five waves (2000 through 2004) of the FYSAS were included. Five types of drug combination rates are presented here: Any illicit drug Use of at least one illicit drug Any illicit drug other than marijuana Use of at least one illicit drug other than marijuana Alcohol only The use of alcohol and no illicit drugs Alcohol or any illicit drug Use of alcohol or at least one illicit drug Any illicit drug, but no alcohol Use of at least one illicit drug, without any use of alcohol Statewide comparative data are presented in Tables 2 and 3 and Graph 8. Trend comparisons to Miami- Dade County results from the 2000 and 2002 surveys are presented in Tables 4 and 5. Any Illicit Drug Overall, 26.0% of surveyed Miami-Dade County students reported at least one use of any illicit drug in their lifetimes, and 13.2% reported use in the past 30 days. The past-30-day prevalence rate corresponds to 10.4% among middle school students and 15.4% among high school students. As Graph 8 shows, use of any illicit drug in the past 30 days is lower in Miami-Dade County than across the state of Florida 7
15 Graph 8 Past-30-day drug combination rates for Miami-Dade County and Florida Statewide, Percentage use Any illicit drug Any illicit drug other than marijuana Alcohol only Alcohol or any illicit drug Any illicit drug, but no alcohol as a whole (13.2% for Miami-Dade County versus 15.8% statewide). Any Illicit Drug Other than Marijuana The purpose of this drug combination rate is to provide prevention planners with an overall indicator of so-called hard drug use (Johnston et al., 2004). Overall, 17.0% of surveyed Miami-Dade County students reported at least one use of any illicit drug other than marijuana in their lifetimes, and 6.5% reported use in the past 30 days. The past-30-day prevalence rate corresponds to 8.0% among middle school students and 5.2% among high school students. As Graph 8 shows, use of any illicit drug other than marijuana in the past 30 days is lower in Miami-Dade County than across the state of Florida as a whole (6.5% for Miami-Dade County versus 8.0% statewide). It is important to note that this measure the current use of all illicit drugs other than marijuana combined is less than the past-30-day prevalence of use of alcohol (30.9%), marijuana (8.6%) and cigarettes (8.1%), as well as the prevalence of binge drinking (14.6%). Alcohol Only Miami-Dade County Overall, 35.4% of surveyed Miami-Dade County students reported at least one use of alcohol only the use of alcohol and no illicit drugs in their Florida Statewide lifetimes, and 21.8% reported use in the past 30 days. The past-30-day prevalence rate corresponds to 13.8% among middle school students and 28.3% among high school students. As Graph 8 shows, use of alcohol only in the past 30 days is similar in Miami-Dade County and the state (21.8% for Miami- Dade County versus 20.8% statewide). Alcohol or Any Illicit Drug Alcohol or any illicit drug use is a summary measure that included all drugs from the 2004 survey, with the exception of cigarettes and smokeless tobacco. Overall, 61.1% of surveyed Miami-Dade County students reported at least one use of alcohol or any illicit drug in their lifetimes, and 34.7% reported use in the past 30 days. The past-30-day prevalence rate corresponds to 23.9% among middle school students and 43.4% among high school students. As Graph 8 shows, use of alcohol or any illicit drug in the past 30 days is lower in Miami-Dade County than across the state of Florida as a whole (34.7% for Miami- Dade County versus 36.1% statewide). Any Illicit Drug, but No Alcohol The final drug combination category measures the use of illicit drugs by students who are not using alcohol. As Tables 2 through 5 show, this combination is quite rare. Overall, 3.6% of surveyed Miami-Dade County students reported having used illicit drugs in their lifetimes but never using alcohol Florida Youth Substance Abuse Survey - Miami-Dade County Report
16 Current use of illicit drugs (within the past 30 days) without the accompanying use of alcohol is also rare (4.1%). The past-30-day prevalence rate corresponds to 3.8% among middle school students and 4.3% among high school students. As Graph 8 shows, use of any illicit drug, but no alcohol in the past 30 days is similar in Miami-Dade County and the state (4.1% for Miami-Dade County versus 4.2% statewide). Other Antisocial Behaviors The 2004 FYSAS also measures a series of eight other problem or antisocial behaviors that is, behaviors that run counter to established norms of good behavior. Note that information on antisocial behaviors is collected only for a prevalence period of the past 12 months. The survey measured the following antisocial behaviors: Carrying a Handgun, Selling Drugs, Attempting to Steal a Vehicle, Being Arrested, Taking a Handgun to, Getting Suspended, Attacking Someone with Intent to Harm and Being Drunk or at. Prevalence rates for these behaviors among Miami- Dade County students, as well as comparison rates from the statewide survey, are presented in Table 6 and Graph 9. Trend comparisons to Miami-Dade County results from the 2000 and 2002 surveys are presented in Table 11. As Table 6 shows, the prevalence rates reported by Miami-Dade County students differ substantially across the eight antisocial behaviors measured in the survey. Reports of Taking a Handgun to (1.1%), Carrying a Handgun (3.6%), and Attempting to Steal a Vehicle (3.8%) are rare, while Getting Suspended (14.1%), Attacking Someone with Intent to Harm (11.5%), and Being Drunk or at (10.4%) are more common. Carrying a Handgun. In Miami-Dade County, 3.6% of students reported carrying a handgun in the past year, with rates of 3.2% and 3.9% for middle school and high school students, respectively. Male students (5.6%) were more likely than female students (2.0%) to have reported this behavior. Across the state as a whole, 3.9% of students reported carrying a handgun. Selling Drugs. In Miami -Dade County, 3.9% of students reported selling drugs in the past year, with rates of 1.9% and 5.4% for middle school and high school students, respectively. Male students (5.9%) were more likely than female students (2.4%) to have reported this behavior. Across the state as a whole, 5.6% of students reported selling drugs. Attempting to Steal a Vehicle. In Miami-Dade County, 3.8% of students reported attempting to steal a vehicle in the past year, with rates of 3.1% and 4.2% for middle school and high school students, respectively. Male students (4.6%) were more likely than female students (2.9%) to have reported this Graph 9 Comparisons of past-12-month delinquent behavior for Miami-Dade County and Florida Statewide, Percentage Getting suspended Attacking with intent to harm Being drunk or high at school Being arrested Selling drugs Attempting to steal a vehicle Carrying a handgun Taking a handgun to school Miami-Dade County Florida Statewide 9
17 behavior. Across the state as a whole, 3.1% of students reported attempting to steal a vehicle. Being Arrested. In Miami-Dade County, 5.4% of students reported being arrested in the past year, with rates of 4.1% and 6.4% for middle school and high school students, respectively. Male students (7.9%) were more likely than female students (3.5%) to have reported this behavior. Across the state as a whole, 5.8% of students reported being arrested. Taking a Handgun to. In Miami-Dade County, 1.1% of students reported taking a handgun to school in the past year, with rates of 0.9% and 1.2% for middle school and high school students, respectively. Male students (2.0%) were more likely than female students (0.3%) to have reported this behavior. Across the state as a whole, 0.9% of students reported taking a handgun to school. Getting Suspended. In Miami-Dade County, 14.1% of students reported getting suspended in the past year, with rates of 16.1% and 12.6% for middle school and high school students, respectively. Male students (17.6%) were more likely than female students (11.4%) to have reported this behavior. Across the state as a whole, 15.5% of students reported getting suspended. Note, however, that the questionnaire item used to measure Getting Suspended does not define suspension. Rather, it is left to the individual respondent to define. Because suspension policies vary substantially from county to county, comparisons to statewide results should be interpreted with caution for this item. Attacking Someone with Intent to Harm. In Miami- Dade County, 11.5% of students reported attacking someone with intent to harm in the past year, with rates of 11.9% and 11.1% for middle school and high school students, respectively. Male students (14.2%) were more likely than female students (9.6%) to have reported this behavior. Across the state as a whole, 12.7% of students reported attacking someone with intent to harm. Being Drunk or at. In Miami-Dade County, 10.4% of students reported being drunk or high at school in the past year, with rates of 6.6% and 13.0% for middle school and high school students, respectively. Male students (10.7%) and female students (10.1%) reported similar rates for this behavior. Across the state as a whole, 12.8% of students reported being drunk or high at school. Risk and Protective Factors Just as smoking is a risk factor for heart disease and getting regular exercise is a protective factor against heart disease and other health problems, there are factors that can help protect youth from, or put them at risk for, drug use and other problem behaviors. Protective factors, also known as assets, are conditions that buffer children and youth from exposure to risk by either reducing the impact of the risks or changing the way that young people respond to risks. Risk factors are conditions that increase the likelihood of a young person becoming involved in drug use, delinquency, school dropout and/or violence. For example, children living in fa milies with poor family supervision are more likely to become involved in these problems. Research during the past 30 years supports the view that delinquency; alcohol, tobacco and other drug use; school achievement; and other important outcomes in adolescence are associated with specific risk and protective factors in the student s community, school and family environments, as well as with characteristics of the individual (Hawkins, Catalano & Miller, 1992). In fact, these risk and protective factors have been shown to be more important in understanding these behaviors than ethnicity, income or family structure (Blum et al., 2000). There is a substantial amount of research showing that adolescents exposure to a greater number of risk factors is associated with more drug use and delinquency. There is also evidence that exposure to a number of protective factors is associated with lower prevalence of these problem behaviors (Bry, McKeon & Pandina, 1982; Newcomb, Maddahian & Skager, 1987; Newcomb & Felix-Ortiz, 1992; Newcomb, 1995; Pollard et al., 1999). The Social Development Strategy The Social Development Strategy (Hawkins, Catalano & Associates, 1992) organizes these risk and protective factors into a framework that families, schools and communities can use to help children develop healthy behaviors. This strategy, which is graphically depicted in Appendix C, shows how three broad categories of protective factors healthy beliefs and clear standards, bonding, and individual characteristics work together to promote positive youth development and healthy behaviors (Hawkins, Arthur & Catalano, 1995). The Social Development Florida Youth Substance Abuse Survey - Miami-Dade County Report
18 Graph 10 school protective factor scales for Miami-Dade County, 2004 Community Rewards for Prosocial Involvement 46 Family Attachment Family Opportunities for Prosocial Involvement Family Rewards for Prosocial Involvement Opportunities for Prosocial Involvement Rewards for Prosocial Involvement Religiosity 51 Social Skills 55 Belief in the Moral Order Community Domain Family Domain Domain Peer and Individual Domain Strategy begins with a goal of healthy behaviors for all children and youth. In order for young people to develop healthy behaviors, adults mu st communicate healthy beliefs and clear standards for behavior to young people (Catalano & Hawkins, 1996). Bonding (an attached, committed relationship) between a child and an adult who communicates healthy beliefs and clear standards motivates the child to follow healthy beliefs and clear standards. A child who forges a bond with an adult is less likely to threaten the relationship by violating the beliefs and standards held by the adult. Research has identified three conditions for bonding (Catalano & Ha wkins, 1996): First, children need developmentally appropriate opportunities for meaningful involvement with a positive social group (community, family, school, etc.) or individual. Second, children need the emotional, cognitive, social and behavioral skills to successfully take advantage of opportunities. Third, children must be recognized for their involvement. Recognition sets up a reinforcing cycle in which children continue to look for opportunities and learn skills and, therefore, receive recognition. Certain characteristics with which some children come into the world (positive social orientation, resilient temperament and high intelligence) can also help protect children from risk. For children who do not have the protective advantages of these characteristics, in order to build strong bonds to family, school and community, it is even more important for community members to: make extra efforts to provide opportunities for involvement teach the social, emotional, and cognitive skills needed to be successful recognize children s efforts as well as their successes. The developmental process outlined in this model has important implications for prevention planning. Programs that seek to change the attitudes young people hold about the pros and cons of ATOD use, for example, may produce an immediate reduction in the prevalence of problem behaviors. The effectiveness of these efforts will be limited, however, by the risk and protective factors that underlie the acquisition of healthy beliefs and clear standards. If young people have weak bonds to 11
19 prosocial groups and strong bonds to antisocial groups, they will be less receptive to drug abuse prevention messages. An alternative prevention strategy might involve targeting the risk and protective factors that operate at an earlier point in the developmental process. While programs and policies that increase the opportunities for prosocial involvement in the family, at school and in the community may not yield an immediate reduction in the rates of ATOD use, they will encourage young people to form attachments to sources of positive social influence, thereby building the foundation for healthy behavioral choices in the future. Measurement Most risk and protective factors are measured by the FYSAS. Some of the risk factors are so broad that they can t be measured and reported adequately by themselves. As a result, they are measured and reported using groups of questions called scales. Each scale addresses some aspect of the broader risk factor. See the 2004 FYSAS statewide report for more details on these scales. Risk and protective factor scale scores are compared against the Communities That Care normative database. Like the scoring systems used by many national testing programs such as the SAT and ACT this method of norm-referencing generates percentile scores ranging from 0 to 100. A score of 50, which matches the normative median, indicates that 50% of the respondents in the normative sample reported a score that is lower than the average for Miami-Dade County and 50% reported a score that is higher. Similarly, a score of 75 indicates that 75% of the normative sample reported a lower score and 25% reported a higher score. Because risk is associated with negative behavioral outcomes, it is better to have lower risk factor scale scores, not higher. Conversely, because protective factors are associated with better behavioral outcomes, it is better to have higher protective factor scale scores, not lower. The FYSAS measures a variety of risk and protective factor scales across four domains: Community Domain, Family Domain, Domain, and Peer and Individual Domain. Percentile scores for the 21 risk factor and nine protective factor scales for middle school and high school grade cohorts are presented in Graphs 10 through 13. Comparisons between the survey results for Miami-Dade County and the state of Florida as a whole are presented in Tables 13 and 14. Results for the overall Miami-Dade County sample and comparisons to Miami-Dade County results from the 2000 and 2002 surveys are presented in Table 14. Using Your Risk and Protective Factor Data The analysis of risk and protective factors is the most powerful tool available for understanding what promotes both positive and negative adolescent behavior and for helping design successful prevention programs for young people. To promote positive development and prevent problem behavior, it is necessary to address the factors that predict these outcomes. By measuring these risk and protective factors, specific factors that are elevated can be prioritized in the community. This process also helps in selecting tested-effective prevention programming shown to address those elevated factors and consequently provide the greatest likelihood for success. Risk and Protective Factor Prioritization In general, a prevention strategy that focuses on a relatively narrow set of developmental factors can be more effective than a strategy that spreads resources across a broad set of factors. Risk and protective factor data from the FYSAS can provide critical guidance in this prioritization process. That is, prevention planners can use the information gathered by the survey to identify youth development areas where programs, policies and practices are likely to have the greatest positive impact. Start the prioritization process by identifying the protective factor scales with the lowest percentile scores and the risk factor scales with the highest percentile scores. Because of the smaller number of protective factor scales compared to the number of risk factor scales, protective factors should be prioritized across domains while risk factors should be prioritized within domains. Conduct this analysis separately for students in middle school and students in high school. This is necessary because risk and protective factor profiles can change as students get older, and because many prevention programs target specific stages of youth development. When assessing both weaknesses and strengths in your community s profile, it is important to note that most protective factor scale scores decrease as students enter higher grade levels. In Miami-Dade County, the average percentile score across all nine protective factor scales is 50 among middle school students and 44 among high school students. Risk factors present the opposite pattern, with average percentile scores across the 21 scales increasing from Florida Youth Substance Abuse Survey - Miami-Dade County Report
20 45 among middle school students to 53 among high school students. Lowest Protective Factor Scales Across all nine protective factor scales, both middle school and high school students in Miami-Dade County reported the lowest level of protection for the Rewards for Prosocial Involvement scale. school students scored a 44, equaling the statewide average. school students scored a 37, equaling the statewide average. Low scores on this scale indicate that students receive less praise and encouragement when they work hard and do well in school. This lack of positive feedback, in turn, may weaken students bonds with teachers, coaches and prosocial peers. Additionally, both middle school and high school students in Miami -Dade County reported a low level of protection for the Community Rewards for Prosocial Involvement scale. school students scored a 46, one point lower than the statewide average of 47. school students scored a 38, three points lower than the statewide average of 41. Students who reported low scores on this scale receive less encouragement and praise from neighbors and other community members. Without this type of support, young people may be more likely to reject guidance from the positive role models in their communities. est Risk Factor Scales Community Domain: Within the Community Domain, both middle school and high school students in Miami-Dade Graph 11 school risk factor scales for Miami-Dade County, 2004 Low Neighborhood Attachment Community Disorganization Personal Transitions and Mobility Laws and Norms Favorable to Drug Use and Handguns Perceived Availability of Drugs and Handguns Poor Family Supervision Poor Family Discipline Family History of Antisocial Behavior Parental Attitudes Favorable toward ATOD Use Parental Attitudes Favorable toward Antisocial Behavior Poor Academic Performance Lack of Commitment to Rebelliousness Friends Delinquent Behavior Friends Use of Drugs Peer Rewards for Antisocial Behavior Favorable Attitudes toward Antisocial Behavior Favorable Attitudes toward ATOD Use Low Perceived Risks of Drug Use Early Initiation (of Drug Use and Antisocial Behavior) Sensation Seeking Community Domain Family Domain Domain Peer and Individual Domain 13
21 County reported the highest level of risk for the Personal Transitions and Mobility scale. school students scored a 61, two points lower than the statewide average of 63. school students scored a 65, one point lower than the statewide average of 66. scores on this scale indicate that students are changing homes and schools more frequently. Such transitions can make it harder for students to become involved with prosocial organizations and individuals within their schools and communities. Family Domain: Within the Family Domain, middle school students in Miami -Dade County reported the highest level of risk for the Parental Attitudes Favorable toward Antisocial Behavior scale. Their score of 52 was one point higher than the statewide average of 51. scores on this scale indicate that parents are less likely to voice opposition to their children s involvement in crime and violence. When parents fail to strongly oppose behaviors such as stealing and fighting, children are more likely to develop problems with juvenile delinquency. school students in Miami-Dade County reported the highest level of risk for the Poor Family Discipline scale. Their score of 61 was one point higher than the statewide average of 60. scores on this scale indicate that delinquent behaviors such as drug use, skipping school and carrying a weapon are less likely to be noticed and punished by parents. Domain: Within the Domain, both middle school and high school students in Miami-Dade County reported the highest level of risk for the Poor Academic Performance scale. school students scored a 56, four points higher than the statewide average of 52. school students scored a 61, eight points higher than the statewide average of 53. Beginning in the late elementary grades, poor academic performance increases the risk of drug use, delinquency, violence and school dropout. Children fail for many reasons, but it appears that the experience of failure itself increases the risk of these problem behaviors. Peer and Individual Domain: Within the Peer and Individual Domain, both middle school and high school students in Miami-Dade County reported the highest level of risk for the Friends Delinquent Behavior scale. school students scored a 56, equaling the statewide average. school students scored a 58, equaling the statewide average. Students with high scores on this scale have a greater number of friends who engage in antisocial behaviors such as selling drugs or carrying a weapon, or who have gotten into trouble with school officials or police. Young people who associate with delinquent peers are more likely to engage in delinquent behaviors themselves. Strengths to Build on In addition to specifying problem areas, the prioritization process also benefits from identifying the scales for which students reported the highest levels of protection and the lowest levels of risk. These areas represent strengths that Miami-Dade County may wish to build on. est Protective Factor Scales: Across all nine protective factor scales, middle school students in Miami -Dade County reported the highest level of protection for the Social Skills scale. Their score of 55 was one point lower than the statewide average of 56. Students with highly developed social skills are more likely to appropriately resolve conflicts and engage in positive, prosocial behaviors instead of risky behaviors. school students in Miami-Dade County reported the highest level of protection for the Opportunities for Prosocial Involvement scale. Their score of 50 was one point higher than the statewide average of 49. Students with high scores on this scale have more opportunities to interact closely with teachers, to participate in special classroom projects and activities, and to participate in sports, clubs and other school activities. These activities create bonds with teachers and prosocial peers that encourage students to adopt healthy attitudes and standards of behavior. Miami-Dade County middle school students also reported high levels of protection for two other scales. The first of these was Family Rewards for Prosocial Involvement. Their score of 54 was Florida Youth Substance Abuse Survey - Miami-Dade County Report
22 Graph 12 school protective factor scales for Miami-Dade County, 2004 Community Rewards for Prosocial Involvement 38 Family Attachment Family Opportunities for Prosocial Involvement Family Rewards for Prosocial Involvement Opportunities for Prosocial Involvement Rewards for Prosocial Involvement Religiosity Social Skills 48 Belief in the Moral Order Community Domain Family Domain Domain Peer and Individual Domain one point lower than the statewide average of 55. Students who reported high scores on this scale are more likely to receive praise and support from their parents when they accomplish something positive. This positive feedback, in turn, may strengthen the parent-child bond and support the ability of parents to transfer prosocial values to their children. The second additional protective factor scale with a high score in middle school was Family Opportunities for Prosocial Involvement. Their score of 54 was the same as the statewide average. scores on this scale indicate that family recreation, involvement in family decisions, and other activities that promote family bonding are available to students. These activities reinforce family bonds, which makes students more likely to adopt prosocial norms and values. school students reported high levels of protection for two other scales. The first of these was Social Skills. Their score of 48 was one point lower than the statewide average of 49. The second additional protective factor scale with a high score in high school was Religiosity. Their score of 48 was three points lower than the statewide average of 51. Students who reported high scores on this scale attend religious services and activities more frequently. As a result, they are more likely to benefit from relationships with prosocial adults and peers, opportunities for prosocial activities, and the teaching of prosocial values that are often part of religious involvement. Lowest Risk Factor Scales: Across all 21 risk factor scales, middle school students in Miami -Dade County reported the lowest level of risk for the Perceived Availability of Drugs and Handguns scale. Their score of 26 was one point lower than the statewide average of 27. A low score on this scale indicates that it is more difficult for students to get alcohol, tobacco, other drugs or handguns. school students in Miami-Dade County reported the lowest level of risk for the Low Perceived Risks of Drug Use scale. Their score of 39 was three points lower than the statewide average of 42. Students with low scores on this scale believe that alcohol, cigarette and marijuana use pose a substantial risk. When 15
23 young people perceive the risks of drug use to be high, they are less likely to experiment with these substances. In many communities, beliefs about the risks associated with ATOD use are a leading indicator of future usage patterns. That is, when perceived risk increases, use often decreases. Alternatively, when perceived risk decreases, use often increases. Additionally, middle school students in Miami- Dade County also reported a low level of risk for the Friends Use of Drugs scale. Their score of 35 was two points lower than the statewide average of 37. Students with low scores on this scale indicated that few, if any, of their best friends use alcohol, tobacco or other drugs. Young people who do not associate with peers who use these substances are less likely to use them as well. Research has shown peer influence to be one of the strongest predictors of ATOD use stronger, in many cases, than the influence of parents or other family members. school students in Miami-Dade County also reported a low level of risk for the Perceived Availability of Drugs and Handguns scale. Their score of 42 was five points lower than the statewide average of 47. Further Considerations In addition to identifying the highest risk factor scales and lowest protective factor scales, the prevention prioritization process may include several supplemental steps, such as: Compare county-level results to state-level results. Risk and protective factor scale scores from the statewide FYSAS are presented in Tables 13 and 14. A comparison to statewide results may reveal additional strengths and weaknesses in Miami -Dade County s risk and protective factor profile. For example, a risk factor scale that is not the most elevated within its domain may be designated as a target for prevention programming because it is notably higher in Miami -Dade County than across the state as a whole. Review the prevalence of ATOD use and other antisocial behaviors in your community. A high rate of alcohol use, for example, may dictate a different prevention strategy than a high rate of youth violence. The table on the second page in Appendix C provides a resource for this analysis by showing the behavioral outcomes that have been linked, in multiple longitudinal studies, to each risk factor. Use archival data to fill the gaps in the FYSAS data, and to support findings in the survey. For example, Teen Pregnancy and Drop-Out are problem behaviors not measured by the survey that may influence prevention planning. Archival data are information sources that have already been collected and/or documented at the local, state or national level. They can include records that are kept by governmental and other agencies, and records that are normally kept as part of the operation of an institution or organization. Consider which risk and protective factors the community can realistically tackle at this time. Some factors may be too big, or there may be other efforts already underway in the community to address them. If your community does not have extensive financial or human resources, then it may be appropriate to narrow the list down to one or two priority factors. Consider political, social and economic factors in the community. What is best for the community? Which risk and protective factors would policy makers find acceptable to address at this time? Choosing Effective Prevention Strategies After completing the prioritization process and identifying key risk and protective factors for focused prevention efforts, the next step for communities is to select research-based, proven-effective programs that target these problem areas. A major breakthrough in the field of positive youth development in the past two decades has been the development and testing of programs, policies and practices that are shown to work to reduce adolescent drug use, violence, risky sexual behavior and school failure. State and national agencies have become increasingly interested in and committed to programs, policies and practices that have been rigorously tested for effectiveness. Prevention strategies identified as tested, effective are those that have been tested in well-controlled trials comparing schools, families, young people or communities that received the strategy with those that did not. Results of those trials showed that those who received the strategies were better off than those that did not, in terms of lower risk, greater protection and better behavioral outcomes Florida Youth Substance Abuse Survey - Miami-Dade County Report
24 A good first step in the strategy selection process is to review published lists of tested, effective prevention resources. A number of organizations have constructed lists that link research-based programs with the risk and protective factors they have been shown to effectively address. Additional information on the four lists presented below is available in Appendix D of this report. The Channing Bete Company s Communities That Care Prevention Strategies Guide The U.S. Department of Health and Human Services, Substance Abuse and Mental Health Services Administration s (SAMHSA) Model Programs list The University of Colorado at Boulder s Blueprints for Violence Prevention initiative, sponsored by the Office of Juvenile Justice and Delinquency Prevention (OJJDP) The Western Center for the Application of Prevention Technologies (CAPT) list of Best Practices and Promising Practices In addition to selecting research-based, proveneffective programs to target areas of low protection and high risk, communities should also consider the impact of environmental factors and public policies. For example, a strategy to combat a high level of Perceived Availability of Drugs and Handguns might incorporate changes to local laws or provide resources to strengthen the enforcement of existing laws. Special Topics Several analyses were conducted to investigate alcohol, tobacco and other drug (ATOD) use results. Graph 13 school risk factor scales for Miami-Dade County, 2004 Low Neighborhood Attachment Community Disorganization Personal Transitions and Mobility Laws and Norms Favorable to Drug Use and Handguns Perceived Availability of Drugs and Handguns Poor Family Supervision Poor Family Discipline Family History of Antisocial Behavior Parental Attitudes Favorable toward ATOD Use Parental Attitudes Favorable toward Antisocial Behavior Poor Academic Performance Lack of Commitment to Rebelliousness Friends Delinquent Behavior Friends Use of Drugs Peer Rewards for Antisocial Behavior Favorable Attitudes toward Antisocial Behavior Favorable Attitudes toward ATOD Use Low Perceived Risks of Drug Use Early Initiation (of Drug Use and Antisocial Behavior) Sensation Seeking Community Domain Family Domain Domain Peer and Individual Domain 17
25 These include age of onset of ATOD use and attitudes toward ATOD use (perceived risk of harm, personal disapproval and peer approval). Age of Onset of ATOD Use Students were asked to report on when they began using alcohol, cigarettes and marijuana. Age of onset for these drugs is of special importance, since they are often precursors to the use of harder drugs such as methamphetamine and cocaine. The question related to cigarettes is How old were you when you first smoked a cigarette, even just a puff? The question about marijuana is How old were you when you first smoked marijuana? Two questions about alcohol were asked, one asking when the student first had more than a sip or two of beer, wine or hard liquor (for example, vodka, whiskey or gin) and one asking the student when he or she began drinking alcoholic beverages regularly, that is, at least once or twice a month. Tables 8 and 12 present the average age students reported first engaging in any alcohol use, regular alcohol use, any use of cigarettes, and any use of marijuana. For most items on this survey, averaging the scores of all respondents provides the best overall description of the behavior or attitude under investigation. In contrast, the question When do Florida students first start using ATODs? is best answered by examining the responses of high school students. This is because scores for this question are based only on students who reported engaging in the behavior. Consequently, younger students who will eventually experiment with ATODs as they enter higher grades are excluded from the analysis, resulting in an artificial lowering of age of onset scores. Note that in the statewide report, age of onset of ATOD use is discussed for 12 th graders rather than high school students. The earliest age of onset reported by Miami-Dade County s surveyed high school students was for cigarette use (12.9 years of age), followed by more than a sip or two of alcohol (13.3 years of age), marijuana use (14.0 years of age) and drinking at least once a month (14.8 years of age). Perceived Risk of Harm Perception of risk is an important determinant in the decision-making process young people go through when deciding whether or not to use alcohol, tobacco or other drugs. Evidence also suggests that the perceptions of the risks and benefits associated with drug use sometimes serve as a leading indicator of future drug use patterns in a community (Bachman, Johnston, O Malley & Humphrey, 1986). Tables 9 and 12 present prevalence rates for surveyed Miami- Dade County students assigning great risk of harm to four drug use behaviors: near daily use of alcohol, daily use of cigarettes, regular use of marijuana, and trying marijuana once or twice. Surveyed Miami-Dade County students assigned the highest risk of harm to daily use of cigarettes (63.1%), followed by regular use of marijuana (62.8%), near daily use of alcohol (41.6%) and trying marijuana once or twice (35.5%). Daily Use of Alcohol. In Miami-Dade County, 41.6% of students reported that having one or more drinks nearly every day would pose a great risk of harm. This is down 1.8 percentage points from school students reported a rate of 38.3% and high school students reported a rate of 44.3%. Across the state as a whole, 38.2% of students reported that near daily use of alcohol would pose a great risk of harm. Daily Use of Cigarettes. In Miami-Dade County, 63.1% of students reported that smoking a pack or more of cigarettes every day would pose a great risk of harm. This is up 1.5 percentage points from school students reported a rate of 60.7% and high school students reported a rate of 65.0%. Across the state as a whole, 64.9% of students reported that near daily use of cigarettes would pose a great risk of harm. Regular Use of Marijuana. In Miami-Dade County, 62.8% of students reported that smoking marijuana regularly would pose a great risk of harm. This is up 4.0 percentage points from school students reported a rate of 68.6% and high school students reported a rate of 58.4%. Across the state as a whole, 60.9% of students reported that smoking marijuana regularly would pose a great risk of harm. Trying Marijuana Once or Twice. In Miami-Dade County, 35.5% of students reported that trying marijuana once or twice would pose a great risk of harm. This is down 0.1 percentage points from school students reported a rate of 41.9% and high school students reported a rate of 30.5%. Across the state as a whole, 32.2% of students reported trying marijuana once or twice would pose a great risk of harm. Personal Disapproval In addition to perceptions of risk, personal approval or disapproval of drugs has been linked to the Florida Youth Substance Abuse Survey - Miami-Dade County Report
26 prevalence of ATOD use (Bachman, Johnston & O Malley, 1996). Personal disapproval was measured by asking students how wrong it would be for someone their age to drink alcohol regularly, smoke cigarettes, smoke marijuana, or use other illicit drugs ( LSD, cocaine, amphetamines or another illegal drug ). The rates presented in Tables 9 and 12 represent the percentages of students who thought it would be wrong or very wrong to use each drug. Surveyed Miami-Dade County students were most likely to disapprove of other illicit drug use (95.1%), followed by smoking marijuana (85.5%), smoking cigarettes (81.1%) and drinking alcohol regularly (65.5%). Smoking Cigarettes. In Miami-Dade County, 81.1% of students reported that they think it would be wrong or very wrong for someone their age to smoke cigarettes. This is up 1.1 percentage points from school students reported a rate of 89.2% and high school students reported a rate of 74.8%. Across the state as a whole, 77.9% of students reported disapproval of smoking cigarettes. Drinking Alcohol Regularly. In Miami-Dade County, 65.5% of students reported that they think it would be wrong or very wrong for someone their age to drink alcohol regularly. This is down 4.7 percentage points from school students reported a rate of 79.7% and high school students reported a rate of 54.2%. Across the state as a whole, 62.8% of students reported disapproval of drinking alcohol regularly. Smoking Marijuana. In Miami -Dade County, 85.5% of students reported that they think it would be wrong or very wrong for someone their age to smoke marijuana. This is up 0.9 percentage points from school students reported a rate of 92.7% and high school students reported a rate of 79.9%. Across the state as a whole, 80.3% of students reported disapproval of smoking marijuana. Peer Approval In addition to perceived risk of harm and disapproval, expectations of how one s peer group might react have an impact on whether or not young people choose to use drugs. The data presented in Tables 10 and 12 show the percentage of students who said that there is a pretty good or very good chance that they would be seen as cool if they smoked cigarettes, drank alcohol regularly or smoked marijuana. Drinking Alcohol Regularly. In Miami-Dade County, 8.3% of students reported that there is a pretty good or a very good chance that they would be seen as cool if they drank alcohol regularly. This is up 2.2 percentage points from school students reported a rate of 8.2% and high school students reported a rate of 8.1%. Across the state as a whole, 11.3% of students reported peer approval of drinking alcohol regularly. Smoking Cigarettes. In Miami-Dade County, 5.3% of students reported that there is a pretty good or a very good chance that they would be seen as cool if they smoked cigarettes. This is up 0.2 percentage points from school students reported a rate of 7.9% and high school students reported a rate of 3.2%. Across the state as a whole, 5.8% of students reported peer approval of smoking cigarettes. Smoking Marijuana. In Miami -Dade County, 10.2% of students reported that there is a pretty good or a very good chance that they would be seen as cool if they smoked marijuana. This is up 2.0 percentage points from school students reported a rate of 9.8% and high school students reported a rate of 10.5%. Across the state as a whole, 11.5% of students reported peer approval of smoking marijuana. Using Other Illicit Drugs. In Miami-Dade County, 95.1% of students reported that they think it would be wrong or very wrong for someone their age to use other illicit drugs. This is up 1.0 percentage points from school students reported a rate of 96.0% and high school students reported a rate of 94.6%. Across the state as a whole, 95.0% of students reported disapproval of using other illicit drugs. 19
27
28 Appendix A Detailed Tables Appendix A: Detailed Tables 21
29 Table 1. Major demographic characteristics of surveyed Miami-Dade County youth and Florida Statewide youth Miami-Dade County Florida Statewide N % N % Sex Female , Male , Race/Ethnic group African American , American Indian Asian , Hispanic/Latino 1, , Native Hawaiian/Pacific Islander Other/Multiple , White, non-hispanic , Age , , , , , , , , or older Grade 6th , th , th , th , th , th , th , Overall 1, , Overall , Total 1, , Note: Some categories do not sum to 100% of the total due to missing values (e.g., not all survey questions were answered). In addition, rounding can produce totals that do not equal 100%. N represents the number of valid cases. 22
30 Table 2. Percentages of Miami-Dade County youth and Florida Statewide youth who reported having used various drugs in their lifetimes, by grade, sex and age Miami-Dade County Florida Statewide Female Male Total Female Male Total Alcohol Cigarettes Smokeless Tobacco Marijuana or Hashish Inhalants Ecstasy Rohypnol LSD or PCP Hallucinogenic Mushrooms GHB Ketamine Methamphetamine Cocaine Crack Cocaine Depressants Heroin OxyContin Other Prescription Pain Relievers Amphetamines Steroids (without a doctor s order) Any illicit drug Any illicit drug other than marijuana Alcohol only Alcohol or any illicit drug Any illicit drug, but no alcohol Note: In order to provide comparability with previous reports, only drugs that were included in all three waves of the FYSAS were included in the drug combination rates. 23
31 Table 3. Percentages of Miami-Dade County youth and Florida Statewide youth who reported having used various drugs in the past 30 days, by grade, sex and age Miami-Dade County Florida Statewide Female Male Total Female Male Total Alcohol Binge Drinking Cigarettes Smokeless Tobacco Marijuana or Hashish Inhalants Ecstasy Rohypnol LSD or PCP Hallucinogenic Mushrooms GHB Ketamine Methamphetamine Cocaine Crack Cocaine Depressants Heroin OxyContin Other Prescription Pain Relievers Amphetamines Steroids (without a doctor s order) Any illicit drug Any illicit drug other than marijuana Alcohol only Alcohol or any illicit drug Any illicit drug, but no alcohol Note: In order to provide comparability with previous reports, only drugs that were included in all three waves of the FYSAS were included in the drug combination rates. 24
32 Table 4. Lifetime trend in alcohol, tobacco and other drug use for Miami-Dade County youth, 2000, 2002 and Total Total Total Alcohol Cigarettes Smokeless Tobacco Marijuana or Hashish Inhalants Ecstasy Rohypnol LSD or PCP Hallucinogenic Mushrooms GHB Ketamine Methamphetamine Cocaine Crack Cocaine Depressants Heroin OxyContin Other Prescription Pain Relievers Amphetamines Steroids (without a doctor s order) Any illicit drug Any illicit drug other than marijuana Alcohol only Alcohol or any illicit drug Any illicit drug, but no alcohol Note: The symbol -- indicates that data are not available. 1 Measured as LSD or other psychedelics in the 2000 survey, and as LSD or PCP in the 2002 and 2004 surveys. 2 In 2002, the prescription drug Xanax was added to the list of examples given in the depressants question. 3 In order to provide comparability with previous reports, only drugs that were included in all three waves of the FYSAS were used in the drug combination rates. 25
33 Table 5. Past-30-day trend in alcohol, tobacco and other drug use for Miami-Dade County youth, 2000, 2002 and Total Total Total Alcohol Binge Drinking Cigarettes Smokeless Tobacco Marijuana or Hashish Inhalants Ecstasy Rohypnol LSD or PCP Hallucinogenic Mushrooms GHB Ketamine Methamphetamine Cocaine Crack Cocaine Depressants Heroin OxyContin Other Prescription Pain Relievers Amphetamines Steroids (without a doctor s order) Any illicit drug Any illicit drug other than marijuana Alcohol only Alcohol or any illicit drug Any illicit drug, but no alcohol Note: The symbol -- indicates that data are not available. 1 Measured as LSD or other psychedelics in the 2000 survey, and as LSD or PCP in the 2002 and 2004 surveys. 2 In 2002, the prescription drug Xanax was added to the list of examples given in the depressants question. 3 In order to provide comparability with previous reports, only drugs that were included on all three waves of the FYSAS were used in the drug combination rates. 26
34 Table 6. Percentages of Miami-Dade County youth and Florida Statewide youth who reported engaging in delinquent behavior within the past 12 months, by grade, sex and age Miami-Dade County Female Male Total Florida Statewide Female Male Total Carrying a handgun Selling drugs Attempting to steal a vehicle Being arrested Taking a handgun to school Getting suspended Attacking someone with intent to harm Being drunk or high at school Table 7. Percentages of Miami-Dade County youth who reported gambling and arguing about gambling in the past 12 months, by grade, sex and age Miami-Dade County Female Male Total Florida Statewide Female Male Total Gambling Arguing about gambling
35 Table 8. Mean age of first substance use among Miami-Dade County youth and Florida Statewide youth, by grade, sex and age Mean Age At First Use Miami-Dade County Female Male Total Florida Statewide Female Male Total More than a sip of alcohol Drinking at least once a month Cigarettes Marijuana Table 9. Percentages of Miami-Dade County youth and Florida Statewide youth who reported a perceived risk of harm or personal disapproval, by grade, sex and age Miami-Dade County Female Male Total Florida Statewide Female Male Total Perceive great risk of harm if One or more drinks every day Smoke a pack or more every day Smoke marijuana regularly Try marijuana once or twice Think it would be wrong for someone their age to Smoke cigarettes Drink alcohol regularly Smoke marijuana Use other illicit drugs
36 Table 10. Percentages of Miami-Dade County youth and Florida Statewide youth who reported peer approval, by grade, sex and age Miami-Dade County Florida Statewide Female Male Total Female Male Total Good chance of being seen as cool if Drink alcohol regularly Smoke cigarettes Smoke marijuana
37 Table 11. Trends in delinquent behaviors for Miami-Dade County youth, 2000, 2002 and Total Total Total Carrying a handgun Selling drugs Attempting to steal a vehicle Being arrested Taking a handgun to school Getting suspended Attacking someone with intent to harm Being drunk or high at school Table 12. Trends in mean age of first use and attitudes toward substance use for Miami-Dade County youth, 2000, 2002 and 2004 Age when first used Total Total More than a sip or two of alcohol Drinking at least once a month Cigarettes Marijuana Perceive great risk of harm if One or more drinks every day Smoke a pack or more every day Smoke marijuana regularly Try marijuana once or twice Think it wrong if Smoke cigarettes Drink alcohol regularly Smoke marijuana Use other illicit drugs Seen as cool if Drink alcohol regularly Smoke cigarettes Smoke marijuana Total 30
38 Table 13. Protective and risk factor scale scores for Miami-Dade County youth and Florida Statewide youth by grade-cohort, 2004 Protective Factors Domain Scale Miami-Dade County Florida Statewide Community Community Rewards for Prosocial Involvement Family Family Attachment Family Opportunities for Prosocial Involvement Family Rewards for Prosocial Involvement Opportunities for Prosocial Involvement Rewards for Prosocial Involvement Peer and Religiosity Individual Social Skills Belief in the Moral Order Average Protective Factor Scale Score Risk Factors Domain Scale Miami-Dade County Florida Statewide Community Low Neighborhood Attachment Community Disorganization Personal Transitions and Mobility Laws and Norms Favorable to Drug Use and Handguns Perceived Availability of Drugs and Handguns Family Poor Family Supervision Poor Family Discipline Family History of Antisocial Behavior Parental Attitudes Favorable toward ATOD Use Parental Attitudes Favorable toward Antisocial Behavior Poor Academic Performance Lack of Commitment to Peer and Individual Rebelliousness Friends Delinquent Behavior Friends Use of Drugs Peer Rewards for Antisocial Behavior Favorable Attitudes toward Antisocial Behavior Favorable Attitudes toward ATOD Use Low Perceived Risks of Drug Use Early Initiation (of Drug Use and Antisocial Behavior) Sensation Seeking Average Risk Factor Scale Score Note: A score of 50 indicates the average for the normativ e population, with scores higher than 50 indicating above-average scores, and scores below 50 indicating below-average scores. Because risk is associated with negative behavioral outcomes, it is better to have lower risk factor scale scores, not higher. Conversely, because protective factors are associated with better student behavioral outcomes, it is better to have protective factor scale scores with high values. 31
39 Table 14. Overall trends in overall protective and risk factor scale scores for Miami-Dade County youth, 2000, 2002 and 2004 and Florida Statewide youth, 2004 Protective Factors Domain Scale Miami-Dade County Florida Community Community Rewards for Prosocial Involvement Family Family Attachment Family Opportunities for Prosocial Involvement Family Rewards for Prosocial Involvement Opportunities for Prosocial Involvement Rewards for Prosocial Involvement Peer and Religiosity Individual Social Skills Belief in the Moral Order Average Protective Factor Scale Score Risk Factors Domain Scale Miami-Dade County Florida Community Low Neighborhood Attachment Community Disorganization Personal Transitions and Mobility Laws and Norms Favorable to Drug Use and Handguns Perceived Availability of Drugs and Handguns Family Poor Family Supervision Poor Family Discipline Family History of Antisocial Behavior Parental Attitudes Favorable toward ATOD Use Parental Attitudes Favorable toward Antisocial Behavior Poor Academic Performance Lack of Commitment to Peer and Rebelliousness Individual Friends Delinquent Behavior Friends Use of Drugs Peer Rewards for Antisocial Behavior Favorable Attitudes toward Antisocial Behavior Favorable Attitudes toward ATOD Use Low Perceived Risks of Drug Use Early Initiation (of Drug Use and Antisocial Behavior) Sensation Seeking Average Risk Factor Scale Score Note: A score of 50 indicates the average for the normative population, with scores higher than 50 indicating above-average scores, and scores below 50 indicating below-average scores. Because risk is associated with negative behavioral outcomes, it is better to have lower risk factor scale scores, not higher. Conversely, because protective factors are associated with better student behavioral outcomes, it is better to have protective factor scale scores with high values. 32
40 Appendix B References Appendix B: References Arthur, M. W., Hawkins, J. D., Pollard, J. A., Catalano, R. F., & Baglioni, A. J. (2002). Measuring risk and protective factors for substance use, delinquency, and other adolescent problem behaviors: The communities that care youth survey. Evaluation Review, 26, Bachman, J. G., Johnston, L. D., O Malley, P. M. (1996). The Monitoring the Future project after twenty-two years: Design and procedures. (Monitoring the Future Occasional Paper No. 38.) Ann Arbor, MI: Institute for Social Research. Bachman, J. G., Johnston, L. D., O Malley, P. M. & Humphrey, R. H. (1986). Changes in marijuana use linked to changes in perceived risks and disapproval. (Monitoring the Future Occasional Paper No. 19.) Ann Arbor, MI: Institute for Social Research. Blum, R. W., Beuhring, T., Shew, M. L., Bearinger, L. H., Sieving, R. E., & Resnick, M. D. (2000). The effects of race/ethnicity, income, and family structure on adolescent risk behaviors. American Journal of Public Health, 90, Bracht, N., & Kingsbury, L. (1990). Community organization principles in health promotion: A five-state model. In N. Bracht (Ed.), Health promotion at the community level (pp ). Beverly Hills, CA: Sage. Bry, B. H., McKeon, P., & Pandina, R. J. (1982). Extent of drug use as a function of number of risk factors. Journal of Abnormal Psychology, 91, Catalano, R. F. & Hawkins, J. D. (1996). The social development model: A theory of antisocial behavior. In J. D. Hawkins (Ed.), Delinquency and crime: Current theories (pp ). New York, NY: Cambridge University Press. Hawkins, J. D., Arthur, M. W., & Catalano, R. F. (1995). Preventing substance abuse. In M. Tonry & D. Farrington (Eds.), Building a safer society: Strategic approaches to crime prevention (Vol. 19, pp , Crime and justice: A review of research). Chicago, IL: University of Chicago Press. Hawkins, J. D., Catalano, R. F., & Associates. (1992). Communities that care: Action for drug abuse prevention (1 st ed.). San Francisco: Jossey-Bass. Hawkins, J. D., Catalano, R. F., & Miller, J. Y. (1992). Risk and protective factors for alcohol and other drug problems in adolescence and early adulthood: Implications for substance abuse prevention. Psychological Bulletin, 112, Johnston, L. D., O Malley, P. M., Bachman, J. G., & Schulenberg, J. E. (2004). Monitoring the Future national survey results on drug use, Volume I: Secondary school students (NIH Publication No ). Bethesda, MD: National Institute on Drug Abuse. Newcomb, M. D. (1995). Identifying high-risk youth: Prevalence and patterns of adolescent drug abuse. In E. Rahdert & D. Czechowicz (Eds.), Adolescent drug abuse: Clinical assessment and therapeutic interventions (NIDA Research Monograph, 156). Washington, DC: U.S. Department of Health and Human Services. Newcomb, M. D., & Felix-Ortiz, M. (1992). Multiple protective and risk factors for drug use and abuse: Cross-sectional and prospective findings. Journal of Personality and Social Psychology, 51,
41 Newcomb, M. D., Maddahian, E., & Skager, R. (1987). Substance abuse and psychosocial risk factors among teenagers: Associations with sex, age, ethnicity, and type of school. American Journal of Drug and Alcohol Abuse, 13, Pollard, J. A., Hawkins, J. D., & Arthur, M. W. (1999). Risk and protection: Are both necessary to understand diverse behavioral outcomes in adolescence? Social Work Research, 23,

42 Appendix C The Social Development Strategy Appendix C: The Social Development Strategy 35
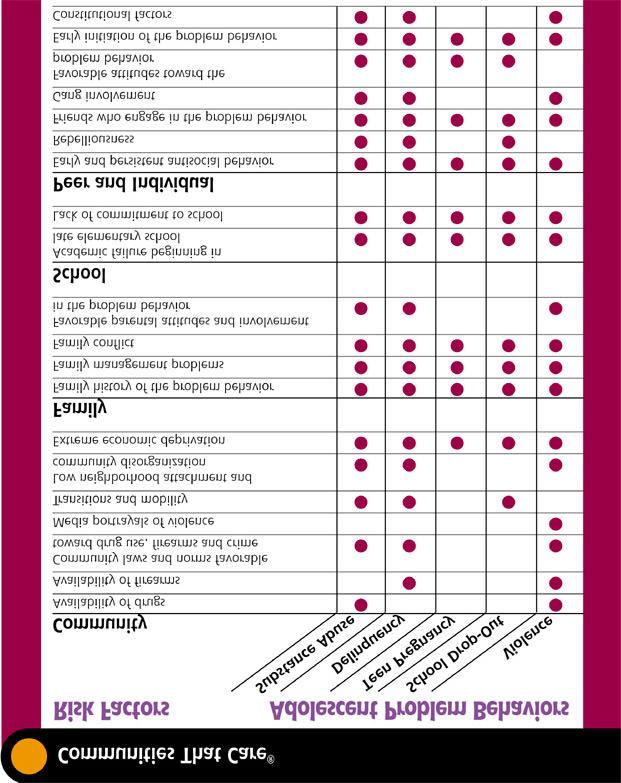
43 36
2004 Florida Youth Substance Abuse Survey
 2004 Florida Youth Substance Abuse Survey Orange County Executive Office of the Governor 2004 Florida Youth Substance Abuse Survey Orange County Report 2004 Florida Department of Children & Families EXECUTIVE
2004 Florida Youth Substance Abuse Survey
 2004 Florida Youth Substance Abuse Survey Baker County Executive Office of the Governor 2004 Florida Youth Substance Abuse Survey Baker County Report 2004 Florida Department of Children & Families EXECUTIVE
2004 Florida Youth Substance Abuse Survey
 2004 Florida Youth Substance Abuse Survey Dixie County Executive Office of the Governor 2004 Florida Youth Substance Abuse Survey Dixie County Report 2004 Florida Department of Children & Families EXECUTIVE
2004 Florida Youth Substance Abuse Survey
 2004 Florida Youth Substance Abuse Survey Jefferson County Executive Office of the Governor 2004 Florida Youth Substance Abuse Survey Jefferson County Report 2004 Florida Department of Children & Families
2004 Florida Youth Substance Abuse Survey
 2004 Florida Youth Substance Abuse Survey Hillsborough County Executive Office of the Governor 2004 Florida Youth Substance Abuse Survey Hillsborough County Report 2004 Florida Department of Children &
2006 Florida Youth Substance Abuse Survey. Miami-Dade County Report
 2006 Florida Youth Substance Abuse Survey Miami-Dade County Report 2006 Florida Youth Substance Abuse Survey Miami-Dade County Report 2006 Florida Department of Children & Families EXECUTIVE SUMMARY T
2006 Florida Youth Substance Abuse Survey. Collier County Report
 2006 Florida Youth Substance Abuse Survey Collier County Report 2006 Florida Youth Substance Abuse Survey Collier County Report 2006 Florida Department of Children & Families EXECUTIVE SUMMARY T he Florida
2006 Florida Youth Substance Abuse Survey. Levy County Report
 2006 Florida Youth Substance Abuse Survey Levy County Report 2006 Florida Youth Substance Abuse Survey Levy County Report 2006 Florida Department of Children & Families EXECUTIVE SUMMARY T he Florida
2006 Florida Youth Substance Abuse Survey. Saint Johns County Report
 2006 Florida Youth Substance Abuse Survey Saint Johns County Report 2006 Florida Youth Substance Abuse Survey Saint Johns County Report 2006 Florida Department of Children & Families EXECUTIVE SUMMARY
2006 Florida Youth Substance Abuse Survey. Polk County Report
 2006 Florida Youth Substance Abuse Survey Polk County Report 2006 Florida Youth Substance Abuse Survey Polk County Report 2006 Florida Department of Children & Families EXECUTIVE SUMMARY T he Florida
2006 Florida Youth Substance Abuse Survey. Broward County Report
 2006 Florida Youth Substance Abuse Survey Broward County Report 2006 Florida Youth Substance Abuse Survey Broward County Report 2006 Florida Department of Children & Families EXECUTIVE SUMMARY T he Florida
2006 Florida Youth Substance Abuse Survey. District 3 Report
 2006 Florida Youth Substance Abuse Survey District 3 Report 2006 Florida Youth Substance Abuse Survey District 3 Report 2006 Florida Department of Children & Families EXECUTIVE SUMMARY T he Florida Legislature
2004 Florida Youth Substance Abuse Survey
 2004 Florida Youth Substance Abuse Survey Sarasota County Executive Office of the Governor 2004 Florida Youth Substance Abuse Survey Sarasota County Report 2004 Florida Department of Children & Families
2006 Florida Youth Substance Abuse Survey. Liberty County Report
 2006 Florida Youth Substance Abuse Survey Liberty County Report 2006 Florida Youth Substance Abuse Survey Liberty County Report 2006 Florida Department of Children & Families EXECUTIVE SUMMARY T he Florida
2006 Florida Youth Substance Abuse Survey. Marion County Report
 2006 Florida Youth Substance Abuse Survey Marion County Report 2006 Florida Youth Substance Abuse Survey Marion County Report 2006 Florida Department of Children & Families EXECUTIVE SUMMARY T he Florida
2006 Florida Youth Substance Abuse Survey. Monroe County Report
 2006 Florida Youth Substance Abuse Survey Monroe County Report 2006 Florida Youth Substance Abuse Survey Monroe County Report 2006 Florida Department of Children & Families EXECUTIVE SUMMARY T he Florida
2008 Florida Youth Substance Abuse Survey
 2008 Florida Youth Substance Abuse Survey Miami-Dade County Report Executive Office of the Governor 2008 Florida Youth Substance Abuse Survey Miami-Dade County Report 2008 Florida Department of Children
2008 Florida Youth Substance Abuse Survey
 2008 Florida Youth Substance Abuse Survey Broward County Report Executive Office of the Governor 2008 Florida Youth Substance Abuse Survey Broward County Report 2008 Florida Department of Children & Families
2008 Florida Youth Substance Abuse Survey
 2008 Florida Youth Substance Abuse Survey Palm Beach County Report Executive Office of the Governor 2008 Florida Youth Substance Abuse Survey Palm Beach County Report 2008 Florida Department of Children
2008 Florida Youth Substance Abuse Survey
 2008 Florida Youth Substance Abuse Survey Osceola County Report Executive Office of the Governor 2008 Florida Youth Substance Abuse Survey Osceola County Report 2008 Florida Department of Children & Families
2008 Florida Youth Substance Abuse Survey
 2008 Florida Youth Substance Abuse Survey Seminole County Report Executive Office of the Governor 2008 Florida Youth Substance Abuse Survey Seminole County Report 2008 Florida Department of Children &
2008 Florida Youth Substance Abuse Survey
 2008 Florida Youth Substance Abuse Survey Liberty County Report Executive Office of the Governor 2008 Florida Youth Substance Abuse Survey Liberty County Report 2008 Florida Department of Children & Families
2008 Florida Youth Substance Abuse Survey
 2008 Florida Youth Substance Abuse Survey Pasco County Report Executive Office of the Governor 2008 Florida Youth Substance Abuse Survey Pasco County Report 2008 Florida Department of Children & Families
2008 Florida Youth Substance Abuse Survey
 2008 Florida Youth Substance Abuse Survey Brevard County Report Executive Office of the Governor 2008 Florida Youth Substance Abuse Survey Brevard County Report 2008 Florida Department of Children & Families
2008 Florida Youth Substance Abuse Survey
 2008 Florida Youth Substance Abuse Survey Levy County Report Executive Office of the Governor 2008 Florida Youth Substance Abuse Survey Levy County Report 2008 Florida Department of Children & Families
2008 Florida Youth Substance Abuse Survey
 2008 Florida Youth Substance Abuse Survey Polk County Report Executive Office of the Governor 2008 Florida Youth Substance Abuse Survey Polk County Report 2008 Florida Department of Children & Families
2008 Florida Youth Substance Abuse Survey
 2008 Florida Youth Substance Abuse Survey Bradford County Report Executive Office of the Governor 2008 Florida Youth Substance Abuse Survey Bradford County Report 2008 Florida Department of Children &
2002 Florida Youth Substance Abuse Survey
 2002 Florida Youth Substance Abuse Survey Baker County Report Executive Office of the Governor Baker County Report 2003 Florida Department of Children & Families EXECUTIVE SUMMARY T he Florida Legislature
2002 Florida Youth Substance Abuse Survey
 2002 Florida Youth Substance Abuse Survey Saint Johns County Report Executive Office of the Governor Saint Johns County Report 2003 Florida Department of Children & Families EXECUTIVE SUMMARY T he Florida
2002 Florida Youth Substance Abuse Survey
 2002 Florida Youth Substance Abuse Survey Lee County Report Executive Office of the Governor Lee County Report 2003 Florida Department of Children & Families EXECUTIVE SUMMARY T he Florida Legislature
2012 Florida Youth Substance Abuse Survey
 2012 Florida Youth Substance Abuse Survey Data Tables 2012 Florida Department of Children & Families Table 1. Major demographic characteristics of surveyed youth and youth, 2012 N % N % Sex Female 1,306
2014 Florida Youth Substance Abuse Survey
 2014 Florida Youth Substance Abuse Survey Data Tables 2014 Florida Department of Children & Families Table 1. Major demographic characteristics of surveyed and, 2014 N % N % Sex Female 936 52.0 33,366
2016 Florida Youth Substance Abuse Survey
 2016 Florida Youth Substance Abuse Survey Data Tables 2016 Florida Department of Children & Families Table 1. Major demographic characteristics of surveyed and, 2016 N % N % Sex Female 779 48.4 31,515
2016 Florida Youth Substance Abuse Survey
 2016 Florida Youth Substance Abuse Survey Data Tables 2016 Florida Department of Children & Families Table 1. Major demographic characteristics of surveyed and, 2016 N % N % Sex Female 774 51.9 31,515
Florida Youth Substance Abuse Survey Miami-Dade County Report
 Florida Youth Substance Abuse Survey Sponsored by The Department of Children and Families Substance Abuse Program Office in conjunction with Developmental Research and Programs, Inc. Table of Contents
2017 Florida Youth Substance Abuse Survey
 2017 Florida Youth Substance Abuse Survey State Report Executive Office of the Governor 2017 Florida Youth Substance Abuse Survey 2017 Florida Department of Children & Families 2017 Florida Youth Substance
Florida Youth Substance Abuse Survey Polk County Report
 Florida Youth Substance Abuse Survey Sponsored by The Department of Children and Families Substance Abuse Program Office in conjunction with Developmental Research and Programs, Inc. Table of Contents
Florida Youth Substance Abuse Survey St. Johns County Report
 Florida Youth Substance Abuse Survey Sponsored by The Department of Children and Families Substance Abuse Program Office in conjunction with Developmental Research and Programs, Inc. Table of Contents
Florida Youth Substance Abuse Survey Escambia County Report
 Florida Youth Substance Abuse Survey Sponsored by The Department of Children and Families Substance Abuse Program Office in conjunction with Developmental Research and Programs, Inc. Table of Contents
Florida Youth Substance Abuse Survey Monroe County Report
 Florida Youth Substance Abuse Survey Sponsored by The Department of Children and Families Substance Abuse Program Office in conjunction with Developmental Research and Programs, Inc. Table of Contents
Florida Youth Substance Abuse Survey Liberty County Report
 Florida Youth Substance Abuse Survey Sponsored by The Department of Children and Families Substance Abuse Program Office in conjunction with Developmental Research and Programs, Inc. Table of Contents
Florida Youth Substance Abuse Survey Sarasota County Report
 Florida Youth Substance Abuse Survey Sponsored by The Department of Children and Families Substance Abuse Program Office in conjunction with Developmental Research and Programs, Inc. .Table of Contents
Florida Youth Substance Abuse Survey Lake County Report
 Florida Youth Substance Abuse Survey Sponsored by The Department of Children and Families Substance Abuse Program Office in conjunction with Developmental Research and Programs, Inc. Table of Contents
2012 FLORIDA YOUTH SUBSTANCE ABUSE SURVEY. Miami-Dade County
 2012 FLORIDA YOUTH SUBSTANCE ABUSE SURVEY Miami-Dade County Methodology Survey administration: February-March of 2012. Sampling strategy: schools and classrooms were selected to generate statistically
Florida Youth Substance Abuse Survey Clay County Report
 Florida Youth Substance Abuse Survey Sponsored by The Department of Children and Families Substance Abuse Program Office in conjunction with Developmental Research and Programs, Inc. Table of Contents
2014 FLORIDA YOUTH SUBSTANCE ABUSE SURVEY. Escambia County
 2014 FLORIDA YOUTH SUBSTANCE ABUSE SURVEY Escambia County Methodology Survey administration: February of 2014. Sampling strategy: schools and classrooms were selected to generate statistically representative
Appendix D The Social Development Strategy
 Appendix D The Social Development Strategy 99 Appendix E Risk and Protective Factors and Sample Survey Items Community Domain Community Rewards for Community Rewards for Prosocial Involvement My neighbors
2014 FLORIDA YOUTH SUBSTANCE ABUSE SURVEY. Santa Rosa County
 2014 FLORIDA YOUTH SUBSTANCE ABUSE SURVEY Santa Rosa County Methodology Survey administration: February of 2014. Sampling strategy: schools and classrooms were selected to generate statistically representative
2016 FLORIDA YOUTH SUBSTANCE ABUSE SURVEY. Flagler County
 2016 FLORIDA YOUTH SUBSTANCE ABUSE SURVEY Flagler County Methodology Survey administration: February of 2016. Sampling strategy: schools and classrooms were selected to generate statistically representative
2014 FLORIDA YOUTH SUBSTANCE ABUSE SURVEY. Central Florida Behavioral Health Network
 2014 FLORIDA YOUTH SUBSTANCE ABUSE SURVEY Central Florida Behavioral Health Network Methodology Survey administration: February of 2014. Sampling strategy: schools and classrooms were selected to generate
2014 FLORIDA YOUTH SUBSTANCE ABUSE SURVEY. South Florida Behavioral Health Network
 2014 FLORIDA YOUTH SUBSTANCE ABUSE SURVEY South Florida Behavioral Health Network Methodology Survey administration: February of 2014. Sampling strategy: schools and classrooms were selected to generate
Community Assessment Training
 Community Assessment Training Using the Communities That Care Youth Survey Participant s Guide Module 2 Module 2 Table of Contents Page Module 2... 2 4 We are here.... 2 5 Module 2 goal... 2 6 Objectives...
Bach Harrison Youth Survey Results for 2006
 Your Logo, name, address or any contractor information Bach Harrison Youth Survey Results for Report for Sample This report was prepared for the Sample by: Bach Harrison, L.L.C. 116 S. 500 E. Salt Lake
Dallas County County Profile Report
 County Profile Report Contents 1 INTRODUCTION 3 1.1 The Risk and Protective Factor Model of Prevention............................ 3 2 TOOLS FOR ASSESSMENT AND PLANNING 4 3 SCHOOL IMPROVEMENT USING SURVEY
Sevier County Profile Report
 Sevier County Profile Report . Contents 1 INTRODUCTION 6 1.1 The Risk and Protective Factor Model of Prevention........ 9 2 TOOLS FOR ASSESSMENT AND PLANNING 9 3 SCHOOL IMPROVEMENT USING SURVEY DATA 10
2005 Chester County Youth Survey
 25 Chester County Youth Survey This survey was funded by the Chester County Commissioners, Pennsylvania Department of Health, and Pennsylvania Commission on Crime and Delinquency Table of Contents Section
Arkansas Prevention Needs Assessment Survey
 2016 Arkansas Prevention Needs Assessment Survey Clark County Profile Report Arkansas Department of Human Services Division of Behavioral Health Services Prevention Services Conducted by International
Arkansas Prevention Needs Assessment Survey
 2016 Arkansas Prevention Needs Assessment Survey Pope County Profile Report Arkansas Department of Human Services Division of Behavioral Health Services Prevention Services Conducted by International Survey
Conducted by International Survey Associates dba Pride Surveys
 2015 Clark County Profile Report Arkansas Department of Human Services Division of Behavioral Health Services Prevention Services Conducted by International Survey Associates dba Pride Surveys . Contents
Conducted by International Survey Associates dba Pride Surveys
 2015 Phillips County Profile Report Arkansas Department of Human Services Division of Behavioral Health Services Prevention Services Conducted by International Survey Associates dba Pride Surveys . Contents
Conducted by International Survey Associates dba Pride Surveys
 2015 Faulkner County Profile Report Arkansas Department of Human Services Division of Behavioral Health Services Prevention Services Conducted by International Survey Associates dba Pride Surveys . Contents
Section 3 Alcohol, Tobacco and Other Drug Use Measurement
 Section 3 Alcohol, Tobacco and Other Drug Use Measurement Drug use is measured by a set of 23 survey questions on the Communities That Care Youth Survey. The questions are similar to those used in the
APNA. Arkansas Prevention Needs Assessment Student Survey
 2013 APNA Arkansas Prevention Needs Assessment Student Survey Jefferson County Profile Report Arkansas Department of Human Services Division of Behavioral Health Services Prevention Services Conducted
Hendry County Florida
 Drug-Free Hendry County Hendry County Florida Drug and Alcohol Assessment Youth Ages 12-20 2013 Prepared by: The Health Planning Council of Southwest Florida, Inc. Table of Contents Executive Summary...
Arkansas Prevention Needs Assessment Survey
 2017 Arkansas Prevention Needs Assessment Survey Ashley County Profile Report Arkansas Department of Human Services, Division of Aging, Adults and Behavioral Health Services And University of Arkansas
Arkansas Prevention Needs Assessment Survey
 2017 Arkansas Prevention Needs Assessment Survey Faulkner County Profile Report Arkansas Department of Human Services, Division of Aging, Adults and Behavioral Health Services And University of Arkansas
The 2010 Wyoming Prevention Needs Assessment: State of Wyoming Profile Report
 The 2010 Wyoming Prevention Needs Assessment: State of Wyoming Profile Report WYSAC Technical Report No. CHES-1012-1 November 1, 2010 Wyoming Survey & Analysis Center (307) 766-2189 wysac@uwyo.edu http://wysac.uwyo.edu
Arkansas Prevention Needs Assessment Survey
 2017 Arkansas Prevention Needs Assessment Survey Craighead County Profile Report Arkansas Department of Human Services, Division of Aging, Adults and Behavioral Health Services And University of Arkansas
Apache County REPORT PROVIDED BY:
 4 Arizona Youth Survey Apache County REPORT PROVIDED BY: Arizona Criminal Justice Commission 4 Arizona Youth Survey Shining Light on Arizona Youth THIS REPORT IS PROVIDED BY THE Arizona Criminal Justice
Slide 1. Indiana Prevention Resource Center
 Slide 1 Indiana Prevention Resource Center Slide 2 2 This presentation is about the annual survey of Alcohol, Tobacco, and Other Drug Use conducted by the Indiana Prevention Resource Center. Slide 3 Students
New Jersey Communities That Care Survey Developmental Research & Programs, Inc.
 ii TABLE OF CONTENTS TABLE OF CONTENTS... ii ACKNOWLEDGEMENTS iii EXECUTIVE SUMMARY.....iv INTRODUCTION...1 THE NEW JERSEY COMMUNITIES THAT CARE YOUTH SURVEY...1 THE PARTICIPATING STUDENTS IN NEW JERSEY...2
Since 1989, the Commonwealth of Pennsylvania has conducted a survey of secondary school students on their behavior, attitudes and knowledge
 Since 1989, the Commonwealth of Pennsylvania has conducted a survey of secondary school students on their behavior, attitudes and knowledge concerning alcohol, tobacco, other drugs and violence. The Pennsylvania
High School and Youth Trends
 High School and Youth Trends Trends in Use Since 1975, the Monitoring the Future Survey (MTF) has annually studied the extent of drug abuse among high school 12th-graders. The survey was expanded in 1991
Arizona Gambling Profile Report
 \ Arizona Youth Survey Arizona Gambling Profile Report REPORT PROVIDED BY: Arizona Criminal Justice Commission Arizona Youth Survey Shining Light on Arizona Youth THIS REPORT IS PROVIDED BY THE Arizona
2010 New Jersey Middle School Risk & Protective Factor Survey
 2010 New Jersey Middle School Risk & Protective Factor Survey New Jersey Department of Human Services Division of Mental Health and Addiction Services Office of Addiction Services 2010 New Jersey Middle
COMMUNITY-LEVEL EFFECTS OF INDIVIDUAL AND PEER RISK AND PROTECTIVE FACTORS ON ADOLESCENT SUBSTANCE USE
 A R T I C L E COMMUNITY-LEVEL EFFECTS OF INDIVIDUAL AND PEER RISK AND PROTECTIVE FACTORS ON ADOLESCENT SUBSTANCE USE Kathryn Monahan and Elizabeth A. Egan University of Washington M. Lee Van Horn University
Florida Youth Substance Abuse Survey State Report
 Florida Youth Substance Abuse Survey State Report Sponsored by The Department of Children and Families Substance Abuse Program Office in conjunction with Developmental Research and Programs, Inc. Acknowledgements
High School & Youth Trends
 High School & Youth Trends Trends in Use Since 1975, the Monitoring the Future (MTF) survey has studied annually the extent of drug use among high school 12th-graders. The survey was expanded in 1991 to
RISK AND PROTECTIVE FACTORS ANALYSIS
 RISK AND PROTECTIVE FACTORS ANALYSIS 2013 Prevention Needs Assessment Berkshire County Prepared by: Berkshire Benchmarks A program of the Berkshire Regional Planning Commission Prepared for: Berkshire
Teen drug use continues down in 2006, particularly among older teens; but use of prescription-type drugs remains high
 December 21, 2006 Contacts: Joe Serwach, (734) 647-1844 or jserwach@umich.edu Patti Meyer, (734) 647-1083 or mtfinfo@isr.umich.edu Study Web site: www.monitoringthefuture.org EMBARGOED FOR RELEASE AT 10
---- Suburb. Analysis by Locale Code Profile Report
 ---- Analysis by Locale Code Profile Report Table of Contents Introduction The Charts and Tables in this Report Data Charts: Lifetime and Day ATOD Use Problem Substance Use, Mental Health, and Antisocial
2013 New Jersey Student Health Survey DRUG USE
 2013 New Jersey Student Health Survey DRUG USE Among youth in the United States, illicit drug use is associated with heavy alcohol and tobacco use, (1) violence, delinquency, (2-5) and suicide. (6) All
KEY FINDINGS FROM THE 2005 MYRBS
 4 CHAPTER 4 ILLEGAL DRUG USE INTRODUCTION Drug use costs taxpayers about $98 billion annually in preventable health care costs, extra law enforcement, auto crashes, crime, and lost productivity (4a). More
Alcohol & Drug Abuse Prevention Team. Student Survey Report 2018
 Alcohol & Drug Abuse Prevention Team Student Survey Report 2018 2 Introduction The need for such a survey is clear. The drug problem and the context within which substance use and abuse occurs will not
Alpine School District. Profile Report
 Alpine School Profile Report Introduction Alpine School Prevention Needs Assessment Survey Report This report summarizes the findings from the Utah Prevention Needs Assessment (PNA) Survey that was conducted
Health Risk and Protective Framework, Health Belief Model, Alternate Smoking Devices (ASD), Substance Abuse, Tobacco Prevention and Control
, Substance Abuse, Tobacco Prevention and Control") Health Risk and Protective Framework, Health Belief Model, Alternate Smoking Devices (ASD), Substance Abuse, Tobacco Prevention and Control Duston Morris, MS, PhD, CHES Emily Harris, MPH University of
Health Risk and Protective Framework, Health Belief Model, Alternate Smoking Devices (ASD), Substance Abuse, Tobacco Prevention and Control Duston Morris, MS, PhD, CHES Emily Harris, MPH University of
Composite Prevention Profile: City of Chicago, Illinois
 : City of Chicago, Illinois 2008 City of Chicago Prepared by Published by the Center for Prevention Research and Development, within the Institute of Government and Public Affairs at the University of
2014 Virginia Prevention Needs Assessment Survey Survey Results for: Chesterfield County
 204 Virginia Prevention Needs Assessment Survey Survey Results for: Chesterfield County Sponsored by: Safe, INC. P.O. Box 40 Chesterfield, Virginia 23832 804-267-700 Introduction 204 Prevention Needs Assessment
2015 New York Prevention Needs Assessment Survey
 205 New York Prevention Needs Assessment Survey Survey Results for: Manhasset Union Free School District Sponsored by: Manhasset Public Schools 200 Memorial Place, Manhasset, NY 030 Introduction 205 Prevention
Validity of the Risk & Protective Factor Model
 Validity of the Risk & Protective Factor Model The Use in Evaluation Vicki Schmitt Bruce Frey Michelle Dunham Carol Carman School Program Evaluation and Research (SPEaR) University of Kansas Background
Use of alcohol, cigarettes, and a number of illicit drugs declines among U.S. teens
 Dec. 16, 214 Contacts: Jared Wadley, (734) 936-7819, jwadley@umich.edu EMBARGOED FOR RELEASE AT 12:1 A.M. ET, TUESDAY, DEC. 16, 214 Note: Video explaining the results is available at http://youtu.be/9lpjo7j3k8u
Student Risk and Protective Factor Survey
 Allegany Risk and County Protective Schools Factor Survey Allegany Spring County 2011 Schools Allegany County Student Risk and Protective Factor Survey 2011 Prepared by: Evalumetrics Research 58 Scotland
How Well Do You Know Tompkins County Youth?
 Communities that Care Youth Survey Summary Highlights Tompkins County Spring, 2015 Community Coalition for Healthy Youth www.healthyyouth.org Tompkins County Youth Services Dept. www.tompkinscountyny.gov/youth
2016 Prevention Needs Assessment Survey
 Bach Harrison, L.L.C. Survey Research & Evaluation Services 2016 Prevention Needs Assessment Survey Summary of Profile Report Report for: Niskayuna Central School District Sponsored by: 116 South 500 East
Youth Study on Substance Use
 Youth Study on Substance Use Results from the 8 Illinois Youth Survey Illinois Department of Human Services Division of Community Health and Prevention 9 Chestnut Health Systems, Inc. i Acknowledgments
2010 Florida Youth Substance Abuse Survey 2010 Florida Prevention Conference Orlando, Florida October 1, 2010
 2010 Florida Youth Substance Abuse Survey 2010 Florida Prevention Conference Orlando, Florida October 1, 2010 Hal Johnson, MPH Substance Abuse Program Office Florida Department of Children and Families
End the Epidemic. Miami-Dade County COMPREHENSIVE COMMUNITY PREVENTION ACTION PLAN
 End the Epidemic Miami-Dade County COMPREHENSIVE COMMUNITY PREVENTION ACTION PLAN 2018 2021 Miami-Dade County along with the State of Florida and the Nation are dramatically impacted by an Opioid Epidemic
2017 Massachusetts Prevention Needs Assessment Survey Printed August 30th 2017
 207 Massachusetts Prevention Needs Assessment Survey Printed August 30th 207 Survey Results for: Hampshire County Sponsored by: Strategic Planning Initiative For Families and Youth (SPIFFY) Collaborative
Panhandle Public Health Department
 Nebraska Risk and Protective Factor Student Survey Results for 2014 Profile Report: Panhandle Public Health Department Sponsored by: Nebraska Department of Health and Human Services Division of Behavioral