Author(s) Sekiya, Takuro; Yoshimura, Nagahisa. Citation Japanese journal of ophthalmology (
|
|
|
- Cynthia Henry
- 5 years ago
- Views:
Transcription
 Ogino, Ken; Otani, Atsushi; Oishi, Sekiya, Takuro; Yoshimura, Nagahisa Citation")

1 Title Concentric division of 10 visual f pigmentosa. Author(s) Ogino, Ken; Otani, Atsushi; Oishi, Sekiya, Takuro; Yoshimura, Nagahisa Citation Japanese journal of ophthalmology ( Issue Date URL Right The final publication is available Type Journal Article Textversion author Kyoto University
2 Introduction Retinitis pigmentosa (RP) is a hereditary heterogenous disease, which primarily affects rod photoreceptors. As a consequence of rod photoreceptor death, patients experience night blindness and peripheral visual field (VF) loss in the early stages of the disease. 1 Although cone photoreceptors are not the primarily affected cells in typical RP, devastating rod photoreceptor loss eventually leads to cone photoreceptor death. The loss of cone photoreceptors result in central VF loss and visual acuity (VA) impairment that has more critical influence in urbanized societies compared to night blindness or peripheral VF loss. Thus, it is important for RP patients to evaluate the remaining function of cone photoreceptors. Automated static perimetry such as Humphery Field Analyzer (Carl Zeiss Meditec, Inc. Dublin, CA) is one potential method for the purpose. 2-7 Several studies and large clinical trials, 8-9 use the measurement of HFA as a primary endpoint of the effect visual field testing program is a pre installed program of HFA that measures 68 points within central 10 degree. Because other programs use much less measuring pints in the central area (for example, 30-2 program lays only 12 points within 10 degree), 10-2 program might be better to evaluate the central
3 visual function and indeed, the advantage of 10-2 program in evaluating RP patients has been investigated 3. Sectorization of the VF has been proposed in glaucoma and succeeded in detecting changes in the threshold value Because RP patients shows concentric restriction of VF, we hypothesized that novel concentric sectorization of 10-2 program would be more useful to monitor the VF changes in RP patients. In this study, we retrospectively analyzed the mean sensitivity value in each concentrically divided sector of HFA 10-2 testing and investigated the efficacy of VF sectorization in evaluating the RP patients.
4 Patients and Methods We reviewed the clinical records of 415 patients who were diagnosed with RP at Kyoto University Hospital. The diagnosis of RP was made with night blindness, characteristic fundus appearance, concentric or ring-shaped scotoma and low amplitudes of electroretinogram in rods. We selected the patients who had constantly (five or more tests during 3.5 years or more) examined with the Humphrey Field Analyzer (HFA, Carl Zeiss Meditec, Inc. Dublin, CA) 10-2 SITA standard program. The first data of HFA in each patient was not included in the analysis to overcome the learning effect. The data with fixation loss scores of 20% or more or false-positive or false-negative errors of 33% or more were also discarded. 14 The patients who received any intervention e.g. cataract surgery or medication of vitamine A during the follow up period were excluded. As a result, 37 eyes of 19 RP patients were included in the study. The VF of all 19 patients showed central constriction within 10 degree with or without peripheral islands of VF. The mean deviation (MD) for central 10-2 visual field was calculated from total deviation with the Humphrey STATPAC. To achieve sector analysis,
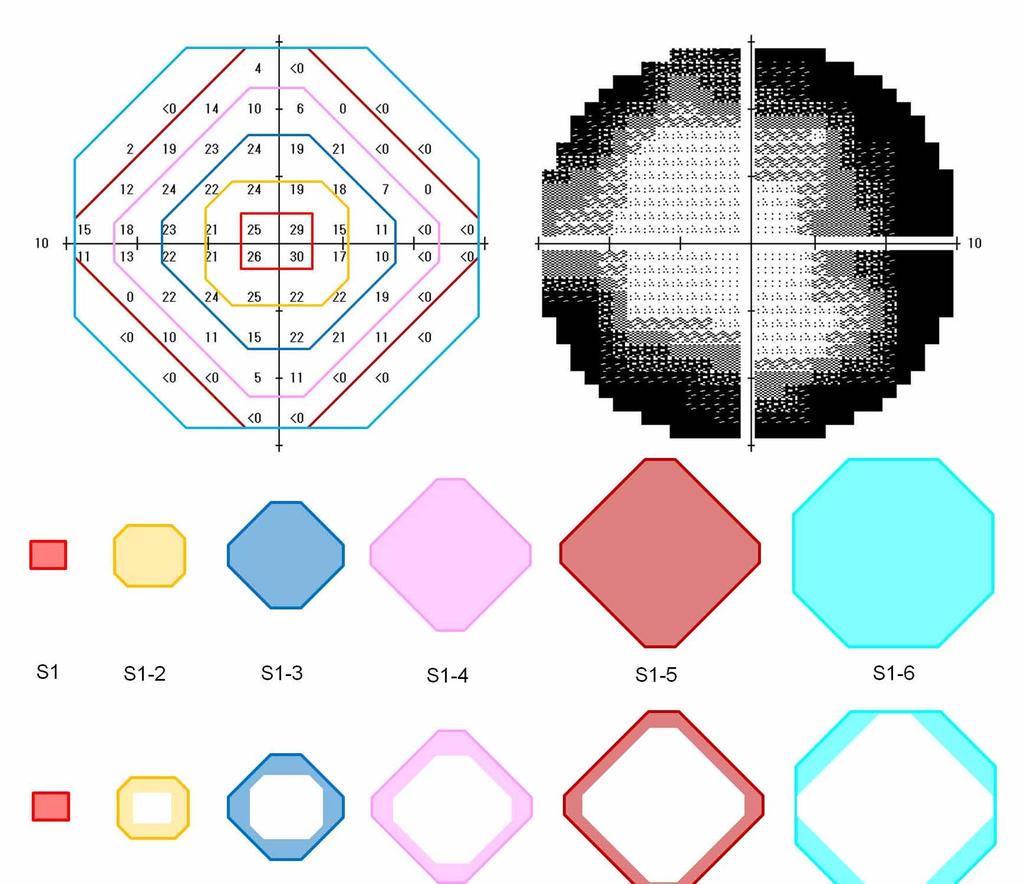
5 the 68 measuring points of HFA 10-2 program were divided by six circular lines (Figure 1A). Then, the sectors were defined as six concentric sectors (Figure 1B, S1, S1-2, S1-3, S1-4, S1-5, S1-6) and six circular sectors (Figure 1C, S1, S2, S3, S4, S5, S6). In the study, sector analyses were performed based on the numerical value (NV) obtained from the result of each HFA field test. (Figure 1A) Each NV represents the sensitivity (db) at each point and mean sensitivity of each sector was calculated by averaging the NVs included in each sector. The serial values of the mean sensitivity in each eye were analyzed with univariate linear regression and the time-dependent change of sensitivity was examined statistically by analysis of variance. To compare the sensitivity of detecting progression of VF between the MD and the NV of total 68 points, we used chi-square test. Best-corrected visual acuity (VA) was measured with a Landolt chart and was converted to a logarithm of the minimum angle of resolution (logmar). OCT images were obtained from all patients using Spectralis+OCT (Heidelberg Engineering, Heidelberg, Germany) at the end of the follow up period. We measured the length of the junction between inner segments and outer segments (IS/OS) manually in the 30 degree cross scans. Mann-Whitney U
6 test was performed to compare the lengths of IS/OS line of independent 2 groups. We performed all the statistical analysis in this study using PASW Statistics version 17.0 (SPSS, Chicago, IL)
7 Results The characteristics of the cases included in the study are summarized in Table 1. The median age was 51 years (range 29-75, eight men and eleven women) at the beginning of follow-up. The median follow-up period was 4.5 years (range 3.5-8) and the median number of VF tests during the follow-up period was 6 (range 5-8). Mean Deviation VS Numerical Value in 68 points In the study period, the average rates of decline in the MD and the NV of whole points (S1-6) were ±0.544 db/year (R 2 = 0.450±0.331) and ± db/year (R 2 = 0.429±0.327), respectively. The linear regression showed that significant progression of VF was noted in 10 eyes in the MD and 11 eyes in the NV. The sensitivity in detecting the progression of VF was showed no difference between the MD and the NV (P = 1.000). Concentric sectors analysis The R 2 value represents how closely the data conform to a linear
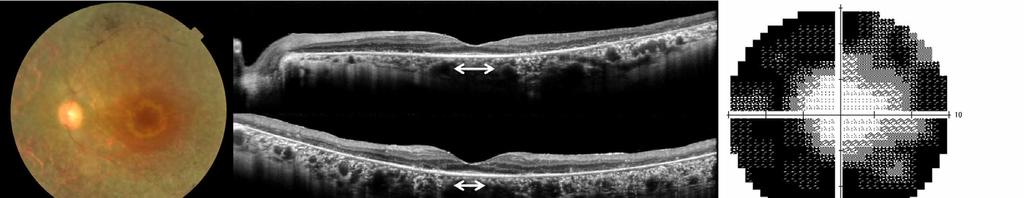
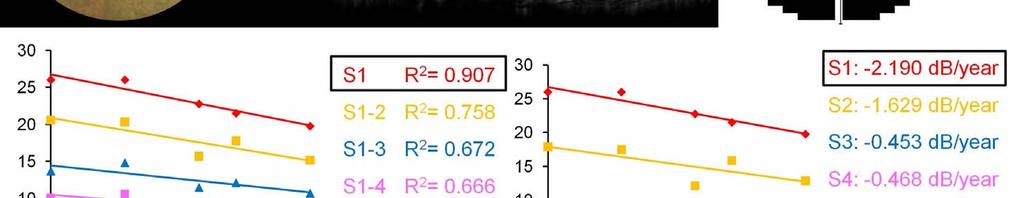
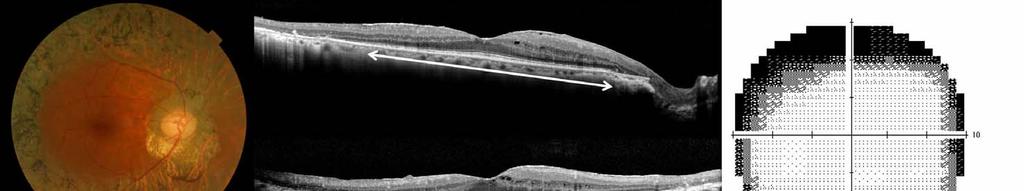
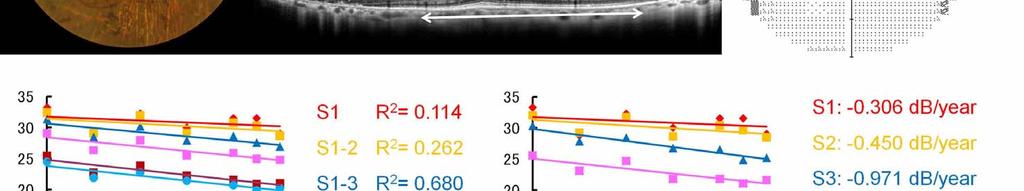
8 relationship. To elucidate the proper size of VF tests in RP patients, this concentric sectors analysis was performed. Among the concentric sectors (S1, S1-2, S1-3, S1-4, S1-5, S1-6), fifteen eyes showed the best fit between the data and the regression line at S1 (Figure 2). Interestingly, the R 2 values were low in the intermediate sectors S1-2, S1-3, S1-4, while seven eyes had the best fit in S1-5 and S1-6 (Figure 2). As the results of linear regression analysis of all eyes, the mean R2 and mean annual rate of decline about concentric sectors was shown in Table 2. Since Figure 2 showed bipolar distribution in both extremes, we divided them into 2 groups: best fitting to regression was seen in central area S1, S1-S2, S1-S3 and in larger area S1-S4, S1-S5, S1-S6. The eyes showing the best fitting to regression line within S3 area had significantly shorter IS/OS line (median, μm) than did the other eyes (median, μm). (P = 0.043) The left eye of patient #10 represented the former eyes (Figure 4) and the right eye of patient #1 represented the latter eyes (Figure 5). Circular sectors analysis To illuminate the point in which the VF of RP patients is changing, we adopted the circular sectors analysis. S1 had the highest rate of decline in 15
9 eyes, while S6, peripheral region in the VF of 10 degree was the most progressive sector in 11 eyes (Figure 3). The mean R2 and mean annual rate of decline about circular sectors was shown in Table 3. Since Figure 3 also showed bipolar distribution in both extremes, we divided them into 2 groups: best fitting to regression was seen in central area S1, S2, S3 and in larger area S4, S5, S6. The eyes showing the progression within S3 tended to have shorter IS/OS (median, μm) than did the other eyes (median, μm). (P = 0.100)
10 Discussion In the present study, we showed that an area of central VF, which is optimal to monitor the changes in RP patients, is different among each patient. Patients with severe VF constriction generally showed best fitting to regression and most significant progression in the most central area. Meanwhile, patients whose VF remains in 10 degree showed best fitting to regression and significant progression in the border of 10 degree field. RP is a hereditary retinal disease and the major cause of visual handicap or blindness also in Japan. Although taking vitamin A showed slower decline in electroretinogram, there has been no treatment to improve or preserve the visual functionof the patients. 15 One reason for the difficulty in developing novel treatments is the absence of practical evaluation system for disease progression; visual acuity does not change for a long time, electroretinogram has inter-examination variation, and kinetic perimetry is not suitable for quantitative analysis. Some recent large clinical trials adopted the change of VF threshold measured with HFA 30-2 program as the main outcome but they could not show sufficiently the effect of the treatment. 8-9 In order to detect the probably small response to such treatment, it is essential to establish another strategy for the
11 estimation of VF that has a higher sensitivity. RP typically shows ring-shaped scotoma, which advances to remains only central visual field within 10 degree. Thus, some researchers investigated and reported the usefulness of HFA 10-2 program. 7 In fact, Nakazawa et al. recently showed that taking nilvadipine retarded progression of HFA 10-2 scores in a small study., 16 It has not been, however, elucidated whether measurement of the 10 degree VF is most suitable to follow the visual field of patients with RP. After Hirakawa et al. reported the 10-2 FASTPAC program about RP, SITA program was developed to reduce the examination time. 17 We observed the central visual field of RP patients with HFA 10-2 SITA standard program at Kyoto University Hospital since 2003 and assessed the concentric sectorial analysis within 10 degree in this retrospective study. The MD of HFA is calculated using total deviation with Humphrey STATPAC. The total deviation is estimated by subtracting the median value of healthy people from the NV. We hypothesized that MD, which would be a better parameter to distinguish patients from healthy people, might have lower power to detect the change of longitudinal data. Actually, the clinical trials of docosahexaenoic acid or Lutein in patients with RP used the total point score of
12 NV of HFA. Unexpectedly, however, our result did not reveal the statistical difference between MD and mean NV of total 68 points (S1-6) in detecting the progression.. Considering that increase of measurement points mathematically makes the variance smaller, the mean sensitivity of total 68 points (S1-6) should have been better to fit the regression line than the mean of central 4 points (S1). Surprisingly, however, our result demonstrated that 41% of all the eyes had the best score of R 2 at the central sector (S1). Furthermore, S1 had also the highest rate of decline in 41%. The result shows that the measurement values are not a simple stochastic event. The threshold in central visual field would have less variability compared to peripheral one. The result suggests that monitoring the changes of S1 sector would make it easier to detect the change of VF in patients with RP than monitoring total VF of 10 degree. Rangaswamy et al. investigated the relationship between HFA and IS/OS and showed that the termination of the IS/OS border corresponded to VF loss of -10 db. 18 To evaluate the relationship between HFA and retinal morphology, we also measured the length of IS/OS and compared them between cases with highest correlation coefficient in inner sectors and in outer
13 sectors. The analysis showed that those with highest correlation coefficient in inner sectors have shorter IS/OS; in other words, those with shorter IS/OS tended to show reproducible and significant decline of VF in inner sectors. The result indicates that we should monitor different part of VF depending on the remaining retinal morphology or function. There were several limitations to the present study, retrospective design, one institution based sample size, possible selection bias in that they underwent HFA for a long period. Especially, included eyes in this study had small VF limited within 10 degree with/without far peripheral VF islands. Some younger patients with RP have larger VF than 10 degree in their central vision. If they were include in this study, the distribution of the best fitting sector or the most progressive sector would be shifted to more peripheral sectors and the proper program would be 30-2 program rather than But, at least, in the eyes with concentric VF loss within 10 degree, it would be safe to say that the mean sensitivity of central 4 points (S1) in 10-2 program is a good parameter to follow up and detect the decline of sensitivity. We need further studies to optimize the VF tests for the purpose of effective follow-up of the patients with RP and designing clinical trials to test the efficacy of any treatments.
14 References 1. Hartong DT, Berson EL, Dryja TP. Retinitis pigmentosa. Lancet 2006;368(9549): Kim LS, McAnany JJ, Alexander KR, Fishman GA. Intersession repeatability of humphrey perimetry measurements in patients with retinitis pigmentosa. Invest Ophthalmol Vis Sci 2007;48(10): Hirakawa H, Iijima H, Gohdo T, Imai M, Tsukahara S. Progression of defects in the central 10-degree visual field of patients with retinitis pigmentosa and choroideremia. Am J Ophthalmol 1999;127(4): Felius J, Thompson DA, Khan NW, et al. Clinical course and visual function in a family with mutations in the RPE65 gene. Arch Ophthalmol 2002;120(1): Hood DC, Ramachandran R, Holopigian K, Lazow M, Birch DG, Greenstein VC. Method for deriving visual field boundaries from OCT scans of patients with retinitis pigmentosa. Biomed Opt Express 2011;2(5): Abe K, Iijima H, Hirakawa H, Tsukahara Y, Toda Y. Visual acuity and 10 degrees automated static perimetry in eyes with retinitis pigmentosa. Jpn J Ophthalmol 2002;46(5):
15 7. Nakazawa M, Ohguro H, Takeuchi K, Miyagawa Y, Ito T, Metoki T. Effect of nilvadipine on central visual field in retinitis pigmentosa: a 30-month clinical trial. Ophthalmologica 2011;225(2): Berson EL, Rosner B, Sandberg MA, et al. Clinical trial of lutein in patients with retinitis pigmentosa receiving vitamin A. Arch Ophthalmol 2010;128(4): Berson EL, Rosner B, Sandberg MA, et al. Clinical trial of docosahexaenoic acid in patients with retinitis pigmentosa receiving vitamin A treatment. Arch Ophthalmol 2004;122(9): Duggan C, Sommer A, Auer C, Burkhard K. Automated differential threshold perimetry for detecting glaucomatous visual field loss. Am J Ophthalmol 1985;100(3): Sommer A, Duggan C, Auer C, Abbey H. Analytic approaches to the interpretation of automated threshold perimetric data for the diagnosis of early glaucoma. Trans Am Ophthalmol Soc 1985;83( Suzuki Y, Araie M, Ohashi Y. Sectorization of the central 30 degrees visual field in glaucoma. Ophthalmology 1993;100(1): Wirtschafter JD, Becker WL, Howe JB, Younge BR. Glaucoma visual
16 field analysis by computed profile of nerve fiber function in optic disc sectors. Ophthalmology 1982;89(3): Heijl A, Bengtsson B. The effect of perimetric experience in patients with glaucoma. Arch Ophthalmol 1996;114(1): Berson EL, Rosner B, Sandberg MA, et al. A randomized trial of vitamin A and vitamin E supplementation for retinitis pigmentosa. Arch Ophthalmol 1993;111(6): Fujimoto N. Comparison of a five-degree visual field between two programs of different testing field range. Am J Ophthalmol 2007;143(5): Bengtsson B, Olsson J, Heijl A, Rootzen H. A new generation of algorithms for computerized threshold perimetry, SITA. Acta Ophthalmol Scand 1997;75(4): Rangaswamy NV, Patel HM, Locke KG, Hood DC, Birch DG. A comparison of visual field sensitivity to photoreceptor thickness in retinitis pigmentosa. Invest Ophthalmol Vis Sci 2010;51(8):
17 Figure legends Figure 1. The sectorization of 10 degree visual field test concentric sectorization of numerical value and grey scale (a), unified sectors for the analysis of goodness of fitting (b), single sectors for the analysis of the annual rates of decline (c), S1 was composed of central 4 points, S2 was 8 points around S1, S3 was 12 points around S2, S4 was 16 points around S3, S5 was 20 points around S4, and S6 was 4 points Figure 2. The distribution of the best fitting sectors in the concentric sector analysis The number of eyes which had the best score of R 2 at each concentric sector is shown in the bar graph. Figure 3. The distribution in the circular sector analysis The number of eyes which had the highest rate of decline (a) and the best score of R2 (b) at each circular sector are shown in the bar graph.
18 Figure 4. Color fundus photograph (a), the horizontal scan of optical coherence tomography (b), the vertical scan (c), the grey scale (d), the linear regression of unified sectors (e) and the linear regression of each sector (f) in the left eye of patients #10 Figure 5. Color fundus photograph (a), the horizontal scan of optical coherence tomography (b), the vertical scan (c), the grey scale (d), the linear regression of unified sectors (e) and the linear regression of each sector (f) in the right eye of patients #1
19 Figure 1
20 Figure 2
21 Figure 3
22 Figure 4
23 Figure 5
24 Table 1 Characteristics of patients Patient number, Inheritan ce eye Follow-up period Number of field tests Visual Acuity (logmar) Mean Deviation (db) initial age, pattern gender (year) initial final initial final 1, 73, M Sporadic L R , 48, M Sporadic L R , 44, M Sporadic L R , 54, M AR L R , 48, M AD L R , 34, F AD L R , 56, F AD L R , 75, F AD L R , 66, F AD R , 44, F AD L
25 R , 56, F AD L R , 58, M AD L R , 29, F Sporadic L R , 57, M Sporadic L R , 41, F AD L R , 48, M AD L R , 58, F Sporadic L R , 46, F AD L R , 51, F AR L R The annual rate of decline (mean ± standard deviation ) ± (logmar/year) ±0.544 db/year The number of eyes showing significant progression 10 10
26 Table 2 The annual rate of decline and R2 in the concentric sectors analysis Slope (db/year) R2 S ± ±0.309 S ± ±0.308 S ± ±0.320 S ± ±0.322 S ± ±0.333 S ± ±0.327 Table 3 The annual rate of decline and R2 in the circular sectors analysis Slope (db/year) R2 S ± ±0.309 S ± ±0.309 S ± ±0.314 S ± ±0.320 S ± ±0.305 S ± ±0.320
21st Century Visual Field Testing
 Supplement to Supported by an educational grant from Carl Zeiss Meditec, Inc. Winter 2011 21st Century Visual Field Testing the Evolution Continues 21st Century Visual Field Testing 21st Century Visual
Retinitis pigmentosa (RP) is an inherited retinal disease that
 is an inherited retinal disease that") Retina Significant Relationship of Visual Field Sensitivity in Central 108 to Thickness of Retinal Layers in Retinitis Pigmentosa Akira Sayo, Shinji Ueno, Taro Kominami, Satoshi Okado, Daiki Inooka, Shiori
Retina Significant Relationship of Visual Field Sensitivity in Central 108 to Thickness of Retinal Layers in Retinitis Pigmentosa Akira Sayo, Shinji Ueno, Taro Kominami, Satoshi Okado, Daiki Inooka, Shiori
CORRELATING OF THE VISUAL FIELD INDEX WITH MEAN DEVIATION AND PATTERN STANDARD DEVIATION IN GLAUCOMA PATIENTS
 CORRELATING OF THE VISUAL FIELD INDEX WITH MEAN DEVIATION AND PATTERN STANDARD DEVIATION IN GLAUCOMA PATIENTS Bui Thi Huong Giang, Pham Thi Kim Thanh Department of Ophthamology, Hanoi Medical University
Description of new EyeSuite visual field and trend analysis functions
 Description of new EyeSuite visual field and trend analysis functions Global Trend Graph The trend graph indicates the normality range (95%) on top as grey band. Falling below that area means falling out
3/16/2018. Perimetry
 Perimetry The normal visual field extends further away from fixation temporally and inferiorly than superiorly and nasally. From the center of the retina this sensitivity decreases towards the periphery,
Method for comparing visual field defects to local RNFL and RGC damage seen on frequency domain OCT in patients with glaucoma.
 Method for comparing visual field defects to local RNFL and RGC damage seen on frequency domain OCT in patients with glaucoma. Donald C. Hood 1,2,* and Ali S. Raza 1 1 Department of Psychology, Columbia
Science & Technologies
 STANDARD COMPUTERIZED PERIMETRY IN FUNCTION OF DIAGNOSTIC GLAUCOMA Iljaz Ismaili, 1 Gazepov Strahil, 2, Goshevska Dashtevska Emilija 1 1 University Eye Clinic,Skopje 2 Clinical Hospital, Shtip Abstract
Translating data and measurements from stratus to cirrus OCT in glaucoma patients and healthy subjects
 Romanian Journal of Ophthalmology, Volume 60, Issue 3, July-September 2016. pp:158-164 GENERAL ARTICLE Translating data and measurements from stratus to cirrus OCT in glaucoma patients and healthy subjects
Il contributo dell'angio-oct: valutazione integrata della componente nervosa e vascolare della malattia glaucomatosa
 SIMPOSIO G.O.A.L. - LE NUOVE FRONTIERE DIAGNOSTICHE E LE LINEE DI INDIRIZZO AMBULATORIALI DEL GLAUCOMA Coordinatore e moderatore: D. Mazzacane Presidente: L. Rossetti Il contributo dell'angio-oct: valutazione
T he retinal ganglion cells of different sizes have distinct
 604 CLINICAL SCIENCE Agreement between frequency doubling perimetry and static perimetry in eyes with high tension glaucoma and normal tension glaucoma S Kogure, Y Toda, D Crabb, K Kashiwagi, F W Fitzke,
STRUCTURE & FUNCTION An Integrated Approach for the Detection and Follow-up of Glaucoma. Module 3a GDx
 STRUCTURE & FUNCTION An Integrated Approach for the Detection and Follow-up of Glaucoma Module 3a GDx Educational Slide Deck Carl Zeiss Meditec, Inc. November 2005 1 Structure & Function Modules Module
HFA3 with SITA Faster Frequently Asked Questions
 HFA3 with SITA Faster Frequently Asked Questions 1) What is SITA Faster? a. SITA Faster is the newest addition to the SITA family of testing strategies for the Humphrey Field Analyzer 3 (HFA3) perimeter.
Spontaneous Intraocular Pressure Reduction in Normal-Tension Glaucoma and Associated Clinical Factors
 CLINICAL INVESTIGATIONS Spontaneous Intraocular Pressure Reduction in Normal-Tension Glaucoma and Associated Clinical Factors Akihiro Oguri, Tetsuya Yamamoto and Yoshiaki Kitazawa Department of Ophthalmology,
STANDARD AUTOMATED PERIMETRY IS A GENERALLY
 Comparison of Long-term Variability for Standard and Short-wavelength Automated Perimetry in Stable Glaucoma Patients EYTAN Z. BLUMENTHAL, MD, PAMELA A. SAMPLE, PHD, LINDA ZANGWILL, PHD, ALEXANDER C. LEE,
Access to the published version may require journal subscription. Published with permission from: Elsevier
 This is an author produced version of a paper published in Ophthalmology. This paper has been peer-reviewed but does not include the final publisher proof-corrections or journal pagination. Citation for
VISUAL FIELD TESTING OCCUpies
 CLINICAL SCIENCES Prediction of Glaucomatous Visual Field Loss by Extrapolation of Linear Trends Boel Bengtsson, PhD; Vincent Michael Patella, OD; Anders Heijl, MD, PhD Objective: To investigate how well
Comparative evaluation of time domain and spectral domain optical coherence tomography in retinal nerve fiber layer thickness measurements
 Original article Comparative evaluation of time domain and spectral domain optical coherence tomography in retinal nerve fiber layer thickness measurements Dewang Angmo, 1 Shibal Bhartiya, 1 Sanjay K Mishra,
Differences between Non-arteritic Anterior Ischemic Optic Neuropathy and Open Angle Glaucoma with Altitudinal Visual Field Defect
 pissn: 1011-8942 eissn: 2092-9382 Korean J Ophthalmol 2015;29(6):418-423 http://dx.doi.org/10.3341/kjo.2015.29.6.418 Original Article Differences between Non-arteritic Anterior Ischemic Optic Neuropathy
Supplementary Appendix
 This appendix has been provided by the authors to give readers additional information about their work. Supplement to: Edwards TL, Jolly JK, MacLaren RE, et al.. N Engl J Med 206;374:996-8. DOI: 0.056/NEJMc50950
Macular Ganglion Cell Complex Measurement Using Spectral Domain Optical Coherence Tomography in Glaucoma
 Med. J. Cairo Univ., Vol. 83, No. 2, September: 67-72, 2015 www.medicaljournalofcairouniversity.net Macular Ganglion Cell Complex Measurement Using Spectral Domain Optical Coherence Tomography in Glaucoma
Study of Retinal Nerve Fiber Layer Thickness Within Normal Hemivisual Field in Primary Open-Angle Glaucoma and Normal-Tension Glaucoma
 Study of Retinal Nerve Fiber Layer Thickness Within Normal Hemivisual Field in Primary Open-Angle Glaucoma and Normal-Tension Glaucoma Chiharu Matsumoto, Shiroaki Shirato, Mai Haneda, Hiroko Yamashiro
Evolving glaucoma management True diagnostic integration for the preservation of vision
 Evolving glaucoma management True diagnostic integration for the preservation of vision // GLAUCOMA MANAGEMENT MADE BY ZEISS The moment you are certain it is glaucoma. This is the moment we work for. There
Parafoveal Scanning Laser Polarimetry for Early Glaucoma Detection
 Yamanashi Med. J. 18(1), 15~ 20, 2003 Original Article Parafoveal Scanning Laser Polarimetry for Early Glaucoma Detection Satoshi KOGURE, Yoshiki TODA, Hiroyuki IIJIMA and Shigeo TSUKAHARA Department of
Retinal nerve fiber layer thickness in Indian eyes with optical coherence tomography
 Original articles in Indian eyes with optical coherence tomography Malik A, Singh M, Arya SK, Sood S, Ichhpujani P Department of Ophthalmology Government Medical College and Hospital, Sector 32, Chandigarh,
FORUM Glaucoma Workplace from ZEISS Clinical Interpretation Guide
 FORUM Glaucoma Workplace from ZEISS Clinical Interpretation Guide ZEISS FORUM Glaucoma Workplace.0 For years, doctors have asked for the operational capability to analyze data from their Humphrey Field
Misleading Statistical Calculations in Faradvanced Glaucomatous Visual Field Loss
 Misleading Statistical Calculations in Faradvanced Glaucomatous Visual Field Loss Eytan Z. Blumenthal, MD, Ruthy Sapir-Pichhadze, MD Objective: In this study, the capability of statistical analysis indices
Structural examina.on: Imaging
 ManaMa: Glaucoma Structural examina.on: Imaging Luís Abegão Pinto, MD, PhD Department of Ophthalmology CHLC Lisbon Faculty of Medicine, Lisbon University 1 11-10- 2013 Structural changes Qualitative changes
RETINAL NERVE FIBER LAYER
 CLINICAL SCIENCES The Effect of Scan Diameter on Retinal Nerve Fiber Layer Thickness Measurement Using Stratus Optic Coherence Tomography Giacomo Savini, MD; Piero Barboni, MD; Michele Carbonelli, MD;
Correlation of Blue Chromatic Macular Sensitivity with Optic Disc Change in Early Glaucoma Patients
 Correlation of Blue Chromatic Macular Sensitivity with Optic Disc Change in Early Glaucoma Patients Yoshio Yamazaki, Kenji Mizuki, Fukuko Hayamizu and Chizuru Tanaka Department of Ophthalmology, Nihon
Test-retest variability in visual field testing using frequency doubling technology
 European Journal of Ophthalmology / Vol. 17 no. 2, 2007 / pp. 203-207 Test-retest variability in visual field testing using frequency doubling technology A. HORANI, S. FRENKEL, E.Z. BLUMENTHAL Department
Perimetry Phobia: Don t fear the field Savory Turman, COMT, CPSS
 Perimetry Phobia: Don t fear the field Savory Turman, COMT, CPSS I have no financial interest in this presentation. Who am I? Where am I? What am I? The anatomy of the visual field Purpose of Visual Field
CHAPTER 11 KINETIC PERIMETRY WHAT IS KINETIC PERIMETRY? LIMITATIONS OF STATIC PERIMETRY LOW SPATIAL RESOLUTION
 205 CHAPTER 11 KINETIC PERIMETRY WHAT IS KINETIC PERIMETRY? LIMITATIONS OF STATIC PERIMETRY LOW SPATIAL RESOLUTION Static perimetry is currently the most commonly used type of perimetry. With static perimetry,
Retinal Nerve Fiber Layer Measurements in Myopia Using Optical Coherence Tomography
 Original Article Philippine Journal of OPHTHALMOLOGY Retinal Nerve Fiber Layer Measurements in Myopia Using Optical Coherence Tomography Dennis L. del Rosario, MD and Mario M. Yatco, MD University of Santo
Visual Fields Shawn L. Cohen, M.D. Part 2 of 4. Definitions / Tables (Part 2 of 2) Static Perimetry (Humphrey, Octopus)
 Static Perimetry (Humphrey, Octopus)") Visual Fields Shawn L. Cohen, M.D. Part 2 of 4 Definitions / Tables (Part 2 of 2) Static Perimetry (Humphrey, Octopus) Normal Visual Field: Components: General Information Reliability Indices Raw Data
Visual Fields Shawn L. Cohen, M.D. Part 2 of 4 Definitions / Tables (Part 2 of 2) Static Perimetry (Humphrey, Octopus) Normal Visual Field: Components: General Information Reliability Indices Raw Data
Investigative Ophthalmology & Vision Sciences MSc Course. Glaucoma Module. Visual Field Reliability Indices. David Henson 2014.
 Investigative Ophthalmology & Vision Sciences MSc Course Glaucoma Module Visual Field Reliability Indices David Henson 214 Variability 1 Variability Clinical problem How can we judge whether the change
Clinical Trial Endpoints for Macular Diseases
 Clinical Trial Endpoints for Macular Diseases Developed in collaboration Learning Objective Upon completion, participants should be able to: Summarize types of biomarkers of progression and treatment response
Case Report Optic Disk Pit with Sudden Central Visual Field Scotoma
 Case Reports in Ophthalmological Medicine Volume 2016, Article ID 1423481, 4 pages http://dx.doi.org/10.1155/2016/1423481 Case Report Optic Disk Pit with Sudden Central Visual Field Scotoma Nikol Panou
A Formula to Predict Spectral Domain Optical Coherence Tomography (OCT) Retinal Nerve Fiber Layer Measurements Based on Time Domain OCT Measurements
 Retinal Nerve Fiber Layer Measurements Based on Time Domain OCT Measurements") pissn: 1011-8942 eissn: 2092-9382 Korean J Ophthalmol 2012;26(5):369-377 http://dx.doi.org/10.3341/kjo.2012.26.5.369 Original Article A Formula to Predict Spectral Domain Optical Coherence Tomography (OCT)
pissn: 1011-8942 eissn: 2092-9382 Korean J Ophthalmol 2012;26(5):369-377 http://dx.doi.org/10.3341/kjo.2012.26.5.369 Original Article A Formula to Predict Spectral Domain Optical Coherence Tomography (OCT)
S Morishita, T Tanabe, S Yu, M Hangai, T Ojima, H Aikawa, N Yoshimura. Clinical science
 Department of Ophthalmology and Visual Sciences, Kyoto University Graduate School of Medicine, Kyoto, Japan Correspondence to: Dr T Tanabe, Department of Ophthalmology, The Tazuke Kofukai Medical Institute,
Fluctuation of Intraocular Pressure and Glaucoma Progression in the Early Manifest Glaucoma Trial
 Fluctuation of Intraocular Pressure and Glaucoma Progression in the Early Manifest Glaucoma Trial Boel Bengtsson, PhD, 1 M. Cristina Leske, MD, MPH, 2 Leslie Hyman, PhD, 2 Anders Heijl, MD, PhD, 1 Early
Fundus Autofluorescence. Jonathan A. Micieli, MD Valérie Biousse, MD
 Fundus Autofluorescence Jonathan A. Micieli, MD Valérie Biousse, MD The retinal pigment epithelium (RPE) has many important functions including phagocytosis of the photoreceptor outer segments Cone Rod
Noel de Jesus Atienza, MD, MSc and Joseph Anthony Tumbocon, MD
 Original Article Philippine Journal of OPHTHALMOLOGY Diagnostic Accuracy of the Optical Coherence Tomography in Assessing Glaucoma Among Filipinos. Part 1: Categorical Outcomes Based on a Normative Database
Ganglion cell complex scan in the early prediction of glaucoma
 Original article in the early prediction of glaucoma Ganekal S Nayana Super Specialty Eye Hospital and Research Center, Davangere, Karnataka, India Abstract Objective: To compare the macular ganglion cell
Citation for published version (APA): Wesselink, C. (2017). Glaucoma care optimised in an ageing population [Groningen]: Rijksuniversiteit Groningen
![Citation for published version (APA): Wesselink, C. (2017). Glaucoma care optimised in an ageing population [Groningen]: Rijksuniversiteit Groningen](/thumbs/90/102866625.jpg "Citation for published version (APA): Wesselink, C. (2017). Glaucoma care optimised in an ageing population [Groningen]: Rijksuniversiteit Groningen") University of Groningen Glaucoma care optimised in an ageing population Wesselink, Christiaan IMPORTANT NOTE: You are advised to consult the publisher's version (publisher's PDF) if you wish to cite from
University of Groningen Glaucoma care optimised in an ageing population Wesselink, Christiaan IMPORTANT NOTE: You are advised to consult the publisher's version (publisher's PDF) if you wish to cite from
Optic Disk Pit with Sudden Central Visual Field Scotoma
 Optic Disk Pit with Sudden Central Visual Field Scotoma The Harvard community has made this article openly available. Please share how this access benefits you. Your story matters. Citation Published Version
Factors Associated With Visual Field Progression in Cirrus Optical Coherence Tomography-guided Progression Analysis: A Topographic Approach
 ORIGINAL STUDY Factors Associated With Visual Field Progression in Cirrus Optical Coherence Tomography-guided Progression Analysis: A Topographic Approach Joong Won Shin, MD, Kyung Rim Sung, MD, PhD, Jiyun
City, University of London Institutional Repository
 City Research Online City, University of London Institutional Repository Citation: Artes, P. H., O'Leary, N., Nicolela, M. T., Chauhan, B. C. and Crabb, D. P. (2014). Visual Field Progression in Glaucoma
Reproducibility of Nerve Fiber Layer Thickness Measurements by Use of Optical Coherence Tomography
 Reproducibility of Nerve Fiber Layer Thickness Measurements by Use of Optical Coherence Tomography Eytan Z. Blumenthal, MD, 1 Julia M. Williams, BS, 1 Robert N. Weinreb, MD, 1 Christopher A. Girkin, MD,
CLINICAL SCIENCES. (FDP) was designed to emphasize the response characteristics of the parasol
 was designed to emphasize the response characteristics of the parasol") CLINICAL SCIENCES Detecting Visual Function Abnormalities Using the Swedish Interactive Threshold Algorithm and Matrix Perimetry in Eyes With Glaucomatous Appearance of the Optic Disc Lisandro M. Sakata,
CLINICAL SCIENCES Detecting Visual Function Abnormalities Using the Swedish Interactive Threshold Algorithm and Matrix Perimetry in Eyes With Glaucomatous Appearance of the Optic Disc Lisandro M. Sakata,
Retinitis pigmentosa (RP) primarily affects the photoreceptor/pigment
 primarily affects the photoreceptor/pigment") Thickness of Receptor and Post-receptor Retinal Layers in Patients with Retinitis Pigmentosa Measured with Frequency-Domain Optical Coherence Tomography Donald C. Hood, 1,2 Christine E. Lin, 1 Margot A.
Thickness of Receptor and Post-receptor Retinal Layers in Patients with Retinitis Pigmentosa Measured with Frequency-Domain Optical Coherence Tomography Donald C. Hood, 1,2 Christine E. Lin, 1 Margot A.
NERVE FIBER LAYER THICKNESS IN NORMALS AND GLAUCOMA PATIENTS
 Nerve fiber layer thickness in normals and glaucoma patients 403 NERVE FIBER LAYER THICKNESS IN NORMALS AND GLAUCOMA PATIENTS HIROTAKA SUZUMURA, KAYOKO HARASAWA, AKIKO KOBAYASHI and NARIYOSHI ENDO Department
Test-Retest, Within-Visit Variability of Goldmann Visual Fields in Retinitis Pigmentosa
 Low Vision Test-Retest, Within-Visit Variability of Goldmann Visual Fields in Retinitis Pigmentosa Ava K. Bittner, Mian Haris Iftikhar, and Gislin Dagnelie From the Wilmer Eye Institute, Johns Hopkins
CLINICAL SCIENCES. Glaucoma Monitoring in a Clinical Setting
 CLINICAL SCIENCES Glaucoma Monitoring in a Clinical Setting Glaucoma Progression Analysis vs Nonparametric Progression Analysis in the Groningen Longitudinal Glaucoma Study Christiaan Wesselink, MD; Govert
OPHTHALMIC MOLECULAR GENETICS. SECTION EDITOR: JANEY L. WIGGS, MD, PhD
 OPHTHALMIC MOLECULAR GENETICS SECTION EDITOR: JANEY L. WIGGS, MD, PhD Phenotypic Characterization of 3 Families With Autosomal Dominant Retinitis Pigmentosa Due to Mutations in KLHL7 Yuquan Wen, PhD; Kirsten
Do You See What I See!!! Shane R. Kannarr, OD
 Do You See What I See!!! Shane R. Kannarr, OD skannarr@kannarreyecare.com Define Specialty Testing Additional Test to: Prove/Disprove Diagnosis To monitor progression of a condition To document a condition
CHAPTER 13 CLINICAL CASES INTRODUCTION
 2 CHAPTER 3 CLINICAL CASES INTRODUCTION The previous chapters of this book have systematically presented various aspects of visual field testing and is now put into a clinical context. In this chapter,
Characteristics of Frequency-of-Seeing Curves in Normal Subjects, Patients With Suspected Glaucoma, and Patients With Glaucoma
 Characteristics of Frequency-of-Seeing Curves in Normal Subjects, Patients With Suspected Glaucoma, and Patients With Glaucoma Balwantray C. Chauhan* James D. Tompkins,-\ Raymond P. LeBlanc* and Terry
Supplementary information Novel VCP modulators mi2gate major pathologies of rd10, a mouse model of re2ni2s pigmentosa
 Supplementary information Novel VCP modulators mi2gate major pathologies of rd1, a mouse model of re2ni2s pigmentosa Hanako Ohashi Ikeda, Norio Sasaoka, Masaaki Koike, Noriko Nakano, Yuki Muraoka, Yoshinobu
Learn Connect Succeed. JCAHPO Regional Meetings 2017
 Learn Connect Succeed JCAHPO Regional Meetings 2017 Visual Field Testing Suzanne Hansen, M.Ed., COMT, OSC Why are these tests ordered? Visual field testing is ordered to help the physician diagnose and
Glaucoma: Diagnostic Modalities
 Glaucoma: Diagnostic Modalities - Dr. Barun Kumar Nayak, Dr. Sarika Ramugade Glaucoma is a leading cause of blindness in the world, especially in older people. Early detection and treatment by ophthalmologist
Mark Dunbar: Disclosure
 Important Things to Understand About OCT Mark T. Dunbar, O.D., F.A.A.O. Bascom Palmer Eye Institute University of Miami, School of Medicine Mark Dunbar: Disclosure Optometry Advisory Board for: Allergan
Learning Effect and Test-Retest Variability in Healthy Subjects and Patients with Primary Open Angle Glaucoma Using Rarebit Perimetry
 International Journal of Pharmaceutical Science Invention ISSN (Online): 2319 6718, ISSN (Print): 2319 670X Volume 6 Issue 4 April 2017 PP. 38-43 Learning Effect and Test-Retest Variability in Healthy
NIH Public Access Author Manuscript Br J Ophthalmol. Author manuscript; available in PMC 2010 April 29.
 NIH Public Access Author Manuscript Published in final edited form as: Br J Ophthalmol. 2009 August ; 93(8): 1057 1063. doi:10.1136/bjo.2009.157875. Retinal nerve fibre layer thickness measurement reproducibility
VISUAL FIELDS. Visual Fields. Getting the Terminology Sorted Out 7/27/2018. Speaker: Michael Patrick Coleman, COT & ABOC
 VISUAL FIELDS Speaker: Michael Patrick Coleman, COT & ABOC Visual Fields OBJECTIVES: 1. Explain what is meant by 30-2 in regards to the Humphrey Visual Field test 2. Identify the difference between a kinetic
Financial Disclosure. Visual Field Interpretation RELIABILITY VISUAL FIELD INTERPRETATION IN GLAUCOMA METHODS OF DATA PRESENTATION
 VISUAL FIELD INTERPRETATION IN GLAUCOMA Danica J. Marrelli, OD, FAAO University of Houston College of Optometry Financial Disclosure I have received speaking and/or consulting fees from: Aerie Pharmaceutical
Summary HTA HTA-Report Summary Validity and cost-effectiveness of methods for screening of primary open angle glau- coma
 Summary HTA HTA-Report Summary Validity and cost-effectiveness of methods for screening of primary open angle glaucoma Antony K, Genser D, Fröschl B DAHTA@DIMDI Waisenhausgasse 36-38a D-50676 Köln Tel.:
NIH Public Access Author Manuscript Arch Ophthalmol. Author manuscript; available in PMC 2010 November 18.
 NIH Public Access Author Manuscript Published in final edited form as: Arch Ophthalmol. 2009 July ; 127(7): 875 881. doi:10.1001/archophthalmol.2009.145. Measurement of Local Retinal Ganglion Cell Layer
Confocal Adaptive Optics Imaging of Peripapillary Nerve Fiber Bundles: Implications for Glaucomatous Damage Seen on Circumpapillary OCT Scans
 Article DOI: 10.1167/tvst.4.2.12 Confocal Adaptive Optics Imaging of Peripapillary Nerve Fiber Bundles: Implications for Glaucomatous Damage Seen on Circumpapillary OCT Scans Donald C. Hood 1, Monica F.
Research Article The Pattern of Retinal Nerve Fiber Layer and Macular Ganglion Cell-Inner Plexiform Layer Thickness Changes in Glaucoma
 Hindawi Ophthalmology Volume 2017, Article ID 78365, 8 pages https://doi.org/10.1155/2017/78365 Research Article The Pattern of Retinal Nerve Fiber Layer and Macular Ganglion Cell-Inner Plexiform Layer
CHAPTER 2 LITERATURE REVIEW
 CHAPTER 2 LITERATURE REVIEW 2.1 Introduction The retina is a light-sensitive tissue lining the inner surface of the eye. The optics of the eye create an image of the visual world on the retina, which serves
 Title Optical Coherence Tomography Angiog Retinal Blood Flow in Eyes with Ret Sugahara, Masako; Miyata, Manabu; I Norimoto; Morooka, Satoshi; Ogino, Author(s) Hirashima, Takako; Yoshikawa, Munem Muraoka,
Thickness Changes in the Fovea and Peripapillary Retinal Nerve Fiber Layer Depend on the Degree of Myopia
 Thickness Changes in the Fovea and Peripapillary Retinal Nerve Fiber Layer Depend on the Degree of Myopia Sung-Won Choi, MD, Seok-Joon Lee, MD Department of Ophthalmology, Wonju Christian Hospital. Yonsei
New Concepts in Glaucoma Ben Gaddie, OD Moderator Murray Fingeret, OD Louis Pasquale, MD
 New Concepts in Glaucoma Ben Gaddie, OD Moderator Murray Fingeret, OD Louis Pasquale, MD New Concepts in Glaucoma Optical Coherence Tomography: Is it necessary and needed to diagnose and monitor glaucoma?
CLINICAL SCIENCES. Comparison of Glaucoma Diagnostic Capabilities of Cirrus HD and Stratus Optical Coherence Tomography
 CLINICAL SCIENCES Comparison of Glaucoma Diagnostic Capabilities of Cirrus HD and Stratus Optical Coherence Tomography Seong Bae Park, MD; Kyung Rim Sung, MD, PhD; Sung Yong Kang, MD; Kyung Ri Kim, BS;
Case Report Peripapillary Intrachoroidal Cavitation in Myopia Evaluated with Multimodal Imaging Comprising (En-Face) Technique
 Technique") Case Reports in Ophthalmological Medicine Volume 2015, Article ID 890876, 5 pages http://dx.doi.org/10.1155/2015/890876 Case Report Peripapillary Intrachoroidal Cavitation in Myopia Evaluated with Multimodal
Case Reports in Ophthalmological Medicine Volume 2015, Article ID 890876, 5 pages http://dx.doi.org/10.1155/2015/890876 Case Report Peripapillary Intrachoroidal Cavitation in Myopia Evaluated with Multimodal
CLINICAL SCIENCES. Repeatability and Reproducibility of Fast Macular Thickness Mapping With Stratus Optical Coherence Tomography
 CLINICAL SCIENCES Repeatability and Reproducibility of Fast Macular Thickness Mapping With Stratus Optical Coherence Tomography Antonio Polito, MD; Michele Del Borrello, MD; Miriam Isola, MHS; Nicola Zemella,
Lifetime Risk of Blindness in Open-Angle Glaucoma.
 Lifetime Risk of Blindness in Open-Angle Glaucoma. Peters, Dorothea; Bengtsson, Boel; Heijl, Anders Published in: American Journal of Ophthalmology DOI: 10.1016/j.ajo.2013.05.027 2013 Link to publication
Scanning Laser Tomography to Evaluate Optic Discs of Normal Eyes
 Scanning Laser Tomography to Evaluate Optic Discs of Normal Eyes Hiroshi Nakamura,* Toshine Maeda,* Yasuyuki Suzuki and Yoichi Inoue* *Eye Division of Olympia Medical Clinic, Tokyo, Japan; Department of
Citation for published version (APA): Stoutenbeek, R. (2010). Population based glaucoma screening Groningen: s.n.
: Stoutenbeek, R. (2010). Population based glaucoma screening Groningen: s.n.") University of Groningen Population based glaucoma screening Stoutenbeek, Remco IMPORTANT NOTE: You are advised to consult the publisher's version (publisher's PDF) if you wish to cite from it. Please check
University of Groningen Population based glaucoma screening Stoutenbeek, Remco IMPORTANT NOTE: You are advised to consult the publisher's version (publisher's PDF) if you wish to cite from it. Please check
C a t a r a c t G l a u c o m a R e t i n a R e f r a c t i v e. The GDxVCC Early answers and ongoing assessment for glaucoma
 C a t a r a c t G l a u c o m a R e t i n a R e f r a c t i v e The GDxVCC Early answers and ongoing assessment for glaucoma The quantifiable approach to quality care Only Humphrey GPA software Early insight
著者最終稿 (author final version) post.
 post.") Title Superior Segmental Optic Hypoplas Health Care Project Participants( Author(s) YAMAMOTO, Tetsuya Citation [Japanese journal of ophthalmolog [583] Issue Date 2004-11-01 Rights Version 著者最終稿 (author
Title Superior Segmental Optic Hypoplas Health Care Project Participants( Author(s) YAMAMOTO, Tetsuya Citation [Japanese journal of ophthalmolog [583] Issue Date 2004-11-01 Rights Version 著者最終稿 (author
Multifocal Electroretinograms in Patients with Branch Retinal Artery Occlusion
 Multifocal Electroretinograms in Patients with Branch Retinal Artery Occlusion Akira Ohshima, Shigeru Hasegawa, Ritsuko Takada, Mineo Takagi and Haruki Abe Department of Ophthalmology, Niigata University
Relationship Between Structure
 Original Article Relationship Between Structure and Function of the Optic Nerve Head-Glaucoma versus Normal Dr Savita Bhat, Dr Anna Elias, Dr Siddharth Pawar, Dr S.J. Saikumar, Dr Alpesh Rajput, superior,
Retinal Adaptability Loss in Serous Retinal Detachment with Central Serous Chorioretinopathy METHODS
 Retina Retinal Adaptability Loss in Serous Retinal Detachment with Central Serous Chorioretinopathy Yoshiaki Shimada, 1 Daisuke Imai, 2 Yuriko Ota, 2 Kaname Kanai, 2 Keisuke Mori, 2 Koichiro Murayama,
Optical coherence tomography (OCT) is a noninvasive,
 is a noninvasive,") Ability of Stratus OCT to Detect Progressive Retinal Nerve Fiber Layer Atrophy in Glaucoma Eun Ji Lee, 1,2 Tae-Woo Kim, 1,2 Ki Ho Park, 2 Mincheol Seong, 3 Hyunjoong Kim, 4 and Dong Myung Kim 2 PURPOSE.
Ability of Stratus OCT to Detect Progressive Retinal Nerve Fiber Layer Atrophy in Glaucoma Eun Ji Lee, 1,2 Tae-Woo Kim, 1,2 Ki Ho Park, 2 Mincheol Seong, 3 Hyunjoong Kim, 4 and Dong Myung Kim 2 PURPOSE.
Electrodiagnostics Alphabet Soup
 Nathan Lighthizer, O.D., F.A.A.O Assistant Professor, NSUOCO Chief of Specialty Care Clinics Chief of Electrodiagnostics Clinic What is electrodiagnostics testing? Visual Pathway Basic Understanding VEP
The Evolution of Fundus Perimetry
 The Evolution of Fundus Perimetry Company Profile CenterVue designs and manufactures highly automated medical devices for the diagnosis and management of ocular pathologies, including those that represent
Linking structure and function in glaucoma
 CET CONTINUING Sponsored by 1 CET POINT Linking structure and function in glaucoma 50 Dr Samantha McGinnigle PhD, BSc (Hons), MCOptom, AHEA This article will give an overview of the latest imaging technology
Variability of Automated Visual Fields in Clinically Stable Glaucoma Patients
 Investigative Ophthalmology & Visual Science, Vol. 30, No. 6, June 1989 Copyright Association for Research in Vision and Ophthalmology Variability of Automated Visual Fields in Clinically Stable Glaucoma
Comparison of Retinal Nerve Fiber Layer Thickness between Stratus and Spectralis OCT
 pissn: 1011-8942 eissn: 2092-9382 Korean J Ophthalmol 2011;25(3):166-173 DOI: 10.3341/kjo.2011.25.3.166 Original Article Comparison of Retinal Nerve Fiber Layer Thickness between Stratus and Spectralis
The determination of glaucoma progression is based on a. Refinement of Pointwise Linear Regression Criteria for Determining Glaucoma Progression
 Glaucoma Refinement of Pointwise Linear Regression Criteria for Determining Glaucoma Progression Colleen M. Kummet, 1 K. D. Zamba, 2 Carrie K. Doyle, 3 5 Chris A. Johnson, 3,4 and Michael Wall 3 5 1 Department
Correspondence should be addressed to Verena Prokosch;
 Hindawi Ophthalmology Volume 2017, Article ID 8014294, 6 pages https://doi.org/10.1155/2017/8014294 Research Article Comparison between the Correlations of Retinal Nerve Fiber Layer Thickness Measured
Scanning Laser Polarimetry in Patients with Acute Attack of Primary Angle Closure
 Scanning Laser Polarimetry in Patients with Acute Attack of Primary Angle Closure Jimmy S. M. Lai*, Clement C. Y. Tham, Jonathan C. H. Chan*, Nelson K. F. Yip, Wilson W. T. Tang, Patrick S. H. Li*, Jane
CLINICAL SCIENCES. Characterizing the Phenotype and Genotype of a Family With Occult Macular Dystrophy
 CLINICAL SCIENCES Characterizing the Phenotype and Genotype of a Family With Occult Macular Dystrophy Connie J. Chen, MD; Hendrik P. N. Scholl, MD, MA; David G. Birch, PhD; Takeshi Iwata, PhD; Neil R.
Baseline Visual Field Characteristics in the Ocular Hypertension Treatment Study
 Baseline Visual Field Characteristics in the Ocular Hypertension Treatment Study Chris A. Johnson, PhD, 1 John L. Keltner, MD, 2 Kimberly E. Cello, BS, 2 Mary Edwards, BS, 2 Michael A. Kass, MD, 3 Mae
A New Model for Assessment of Change in Visual Function in Diabetes
 A New Model for Assessment of Change in Visual Function in Diabetes HELLGREN, KARL-JOHAN 2014 Link to publication Citation for published version (APA): Hellgren, K-J. (2014). A New Model for Assessment
Full-field ERG, multifocal ERG and multifocal VEP in patients with retinitis pigmentosa and residual central visual fields.
 Full-field ERG, multifocal ERG and multifocal VEP in patients with retinitis pigmentosa and residual central visual fields. Gränse, Lotta; Ponjavic, Vesna; Andréasson, Sten Published in: Acta Ophthalmologica
Expanding your field of vision. Visual Field Analyzers from Carl Zeiss
 Expanding your field of vision Visual Field Analyzers from Carl Zeiss Vision in focus Visual Field Analyzers Humphrey Field Analyzer/HFA II-i Series Humphrey Matrix Humphrey FDT Perimeter Software Guided