Texas Medical Center Library. Justin Mikell
|
|
|
- Christian Oliver
- 5 years ago
- Views:
Transcription

.")
1 Texas Medical Center Library UT GSBS Dissertations and Theses (Open Access) Graduate School of Biomedical Sciences VOXEL-LEVEL ABSORBED DOSE CALCULATIONS WITH A DETERMINISTIC GRID-BASED BOLTZMANN SOLVER FOR NUCLEAR MEDICINE AND THE CLINICAL VALUE OF VOXEL-LEVEL CALCULATIONS Justin Mikell Follow this and additional works at: Part of the Biomedical Engineering and Bioengineering Commons, Hepatology Commons, Nuclear Commons, and the Radiology Commons Recommended Citation Mikell, Justin, "VOXEL-LEVEL ABSORBED DOSE CALCULATIONS WITH A DETERMINISTIC GRID-BASED BOLTZMANN SOLVER FOR NUCLEAR MEDICINE AND THE CLINICAL VALUE OF VOXEL-LEVEL CALCULATIONS" (2015). UT GSBS Dissertations and Theses (Open Access) This Dissertation (PhD) is brought to you for free and open access by the Graduate School of Biomedical Sciences at DigitalCommons@TMC. It has been accepted for inclusion in UT GSBS Dissertations and Theses (Open Access) by an authorized administrator of DigitalCommons@TMC. For more information, please contact laurel.sanders@library.tmc.edu.
2 VOXEL-LEVEL ABSORBED DOSE CALCULATIONS WITH A DETERMINISTIC GRID-BASED BOLTZMANN SOLVER FOR NUCLEAR MEDICINE AND THE CLINICAL VALUE OF VOXEL-LEVEL CALCULATIONS by Justin Kennedy Cuttino Mikell, B.S. APPROVED: S. Cheenu Kappadath, Ph.D. Advisory Professor Firas Mourtada, Ph.D. Uwe Titt, Ph.D. Veera Baladandayuthapani, Ph.D. Armeen Mahvash, M.D. APPROVED: Dean, The University of Texas Graduate School of Biomedical Sciences at Houston i
3 VOXEL-LEVEL ABSORBED DOSE CALCULATIONS WITH A DETERMINISTIC GRID-BASED BOLTZMANN SOLVER FOR NUCLEAR MEDICINE AND THE CLINICAL VALUE OF VOXEL-LEVEL CALCULATIONS A DISSERTATION Presented to the Faculty of The University of Texas Health Science Center at Houston and The University of Texas MD Anderson Cancer Center Graduate School of Biomedical Sciences in Partial Fulfillment of the Requirements for the Degree of DOCTOR OF PHILOSOPHY by Justin Kennedy Cuttino Mikell, B.S. Houston, Texas December, 2015 ii
4 Acknowledgments I would first like to thank my advisor, S. Cheenu Kappadath, for suggesting and agreeing to be my primary advisor. He has been demanding yet reasonable, and provided a tremendous amount of stability, guidance, and insight over the years. He has helped me to achieve my goals and become a better scientist. Firas Mourtada was my first advisor in graduate school, and he introduced me to applications of the discrete-ordinates method (grid-based Boltzmann solver) in radiation oncology. His NIH funded grant (NIH/NCI R01 CA138986) supported me over the years. In addition to Cheenu Kappadath and Firas Mourtada, Uwe Titt, Armeen Mahvash, Veera Baladandayuthapani, Bill Erwin, and Todd Wareing were members of my supervisory committee. They have helped shape much of my dissertation research. Bill Erwin and Todd Wareing are not officially recognized members of my committee according to graduate school rules, but they made meaningful contributions over the years with their expert knowledge in nuclear medicine physics and deterministic radiation transport, respectively. David Yang and Mohammad Salehpour also contributed to my supervisory committee for periods of time. The latter was gracious enough to be my temporary on-site advisor after my first advisor left the institution. I want to thank Oleg Vassiliev for introducing me to EGSnrc, Uwe Titt and Firas Mourtada for introducing me to MCNP, and Dragan Mirkovic for allowing me continued access to a Radiation Physics computing resource after I moved to Imaging Physics. The MD Anderson high performance computing cluster was also used throughout my research. iii
5 Ian Davis, Todd Wareing, and Gregory Failla of Varian Medical Systems (formely Transpire Inc.) provided guidance using both Attila and CEPXS/ZERKON. Adam Neff of MiM Software provided a research version of MiM Maestro that made analysis of 90 Y post-therapy imaging and response manageable. The graduate school and Medical Physics program always helped with deadlines and kept pushing me towards graduation. Young Yu, Mark Khil, Jae Kwag, and Kevin Novel introduced me to radiation oncology, medical physics, and clinical linear accelerators. They supplied me with a tremendous amount of practical clinical radiotherapy knowledge. While working with them as a physics assistant, I became a certified medical dosimetrist and developed an interest in clinical absorbed dose calculations which led me to pursue a doctoral degree. iv
6 VOXEL-LEVEL ABSORBED DOSE CALCULATIONS WITH A DETERMINISTIC GRID-BASED BOLTZMANN SOLVER FOR NUCLEAR MEDICINE AND THE CLINICAL VALUE OF VOXEL-LEVEL CALCULATIONS Justin Kennedy Cuttino Mikell, B.S. Advisory Professor: S. Cheenu Kappadath, Ph.D. Voxel-level absorbed dose (VLAD) is rarely calculated for nuclear medicine (NM) procedures involving unsealed sources or 90 Y microspheres (YM). The current standard of practice for absorbed dose calculations in NM utilizes MIRD S-values, which 1) assume a uniform distribution in organs, 2) do not use patient specific geometry, and 3) lack a tumor model. VLADs overcome these limitations. One reason VLADs are not routinely performed is the difficulty in obtaining accurate absorbed doses in a clinically accept able time. The deterministic gridbased Boltzmann solver (GBBS) was recently applied to radiation oncology where it was reported as fast and accurate for both megavoltage photons and high dose rate nuclide-based photon brachytherapy. This dissertation had two goals. The first was to demonstrate that the general GBBS code ATTILA can be used for VLADs in NM, where primary photon and electron sources are distributed throughout a patient. The GBBS was evaluated in voxel-s-value geometries where agreement with Monte Carlo (MC) in the source voxel was 6% for 90 Y and 131 I; 20% differences were seen for mono- v
7 energetic 10 kev photons in bone. An adaptive tetrahedral mesh (ATM) generation procedure was developed using information from both the SPECT and CT for 90 Y and 131 I patients. The ATM with increased energy transport cutoffs, enabled GBBS transport to execute in under 2 ( 90 Y) and 10 minutes ( 131 I). GBBS absorbed doses to tumors and organs were within 4.5% of MC. Dose v olume histograms were indistinguishable from MC. The second goal was to demonstrate VLAD value using 21 YM patients. Package insert dosimetry was not able to predict mean VLAD tumor absorbed doses. Partition model had large bias (factor of 0.39) and uncertainty (±128 Gy). Dose-response curves for hepatocellular carcinoma tumors were generated using logistic regression. The dose covering 70% of volume (D70) predicted binary modified RECIST response with an area under the curve of 80.3%. A D70 88 Gy threshold yielded 89% specificity and 69% sensitivity. The GBBS was shown to be fast and accurate, flaws in clinical dosimetry models were highlighted, and dose-response curves were generated. The findings in this dissertation support the adoption of VLADs in NM. vi
8 Approval Page... i Title Page... ii Acknowledgments... iii Abstract... v List of Figures... xv List of Tables... xix Chapter 1: Introduction Purpose Statement Background Therapeutic Nuclear Medicine Voxel-level Absorbed Dose Calculations Radioembolization for hepatocellular carcinoma and metatstatic colorectal cancers Significance and Rationale Hypothesis and Aims Central Hypothesis Specific Aim Specific Aim Specific Aim vii
9 1.5 Organization Chapter 2: Evaluation of a deterministic Grid-Based Boltzmann Solver (GBBS) for voxel-level absorbed dose calculations in nuclear medicine Introduction Materials and Methods DOSXYZnrc Monte Carlo Simulations ATTILA GBBS Code Voxel-S-Value Simulations ATTILA Solver Settings Sensitivity Analysis for ATTILA Tetrahedral Meshes Energy Groups Comparison Metrics Single source voxel at interface simulations Results DOSXYZnrc MC Comparison with Published Data ATTILA Voxel-S-Value Simulations Sensitivity Results Comparison with DOSXYZnrc MC ATTILA and MC Interface Simulations viii
10 2.4. Discussion Conclusion Chapter 3: Feasibility of fast and accurate GBBS calculations on clinical data through adaptive tetrahedral meshing of emission and transmission images Introduction Methods and Materials Patient Data DOSXYZnrc Monte Carlo (MC) Transport Parameters Sources and Spectra Mapping of CT to Density and Material GBBS ATTILA Adaptive Tetrahedral Mesh Generation Mapping of source, material, and density to the tetrahedral mesh Cross Sections and Energy Groups Transport parameters Post-processing to calculate absorbed doses for comparison with MC Analysis Results Y Tetrahedral Mesh ix
11 Y GBBS calculations and comparison with MC I Tetrahedral Mesh I GBBS calculations and comparison with MC Discussion Conclusion Chapter 4: Biases and variability in tumor and non-tumoral absorbed doses from clinical dosimetry models applied to post-therapy 90 Y SPECT/CT Introduction Materials and Methods Patient Data Dosimetry Models Applied to Post-Therapy Imaging Assessing Partition Model variability Using linear regression to transform Standard and Partition Model absorbed doses to Monte Carlo absorbed doses Results STD, PM, and MC mean absorbed doses to tumor and non-tumoral liver Variability of PM absorbed doses due to TNR variability from NT uptake estimation Using linear regression to transform individual patient s Standard and Partition Model absorbed doses to Monte Carlo absorbed doses Discussion x
12 4.5. Conclusion Chapter 5: Comparing voxel-based absorbed dosimetry methods in tumors, liver, lung, and at the liver-lung interface for 90Y microsphere selective internal radiation therapy Introduction Methods and Materials Patient Data Voxel-Based Dosimetry Methods Investigated: Monte Carlo (MC), Soft-tissue kernel with density correction (SKD), soft-tissue kernel (SK), and local deposition (LD) Assessing sensitivity of non-tumoral liver (NL), right lung (RL), and total liver mean absorbed dose to the liver-lung interface Simulation to estimate the impact of spatial resolution and lung shunt (LS) on the accuracy of voxel-based dosimetry method (VBDM) at the liver-lung interface Results Comparing soft-tissue kernel with density correction (SKD), soft-tissue kernel (SK), and local deposition (LD) with Monte Carlo (MC) for patients Sensitivity of total liver, non-tumoral liver (NL), and right lung (RL) mean doses to the liver-lung interface Effect of spatial resolution and lung shunt (LS) on accuracy of the voxelbased dosimetry method (VBDM) at the liver-lung interface xi
13 5.4 Discussion Conclusion Chapter 6: Absorbed dose response for hepatocellular carcinoma (HCC) tumors based on post-therapy 90Y SPECT/CT Introduction Methods & Materials Patient Data Response Criteria Dosimetric Quantities Voxel-level absorbed dose and biological effective dose DVH and BEDVH metrics Data Analysis Summary data Logistic Regression Receiver operating curve Results Box plots, t-tests, and summary of dosimetric quantities Logistic Regression Receiver Operating Curve Discussion xii
14 6.5 Conclusion Chapter 7: Discussion Summary Listed Contributions of this Dissertation Physics Contributions Clinical Contributions Future Directions Opportunities for the GBBS unique to radioembolization and nuclear medicine Continued translation of Radiation Oncology methods to radioembolization and nuclear medicine Appendix A1: Estimating the in-vivo accuracy of local deposition approximation and Monte Carlo for 90Y absorbed dose calculations in tissue as a function of voxel size and spatial resolution A1.1 Introduction A1.2 Methods & Materials A1.3 Results A2: Explanation for the rationale, implementation strategy, and interpretation of logistic regression parameters for dose-response curve Appendix A3: Steps to validate dose-response curve xiii
15 Bibliography Vita xiv
16 List of Figures Figure 1. A schematic for planning voxel-based absorbed doses or biological effective doses incorporating dose rate, repair, and radiosensitiviity for nuclear medicine Figure 2 Virtual Phantoms and an individual patient Figure 3. The three meshes of the octant are shown with increasing number of tetrahedrons in and around the source voxel Figure 4. Interface simulation geometry Figure 5. The tetrahedral mesh used for the interface simulation Figure 6. Differences between DOSXYZnrc MC and published data in soft tissue Figure 7. Convergence through refinement of phase space variables for monoenergetic 1 MeV electron voxel-s-values in soft tissue Figure 8. Comparing absorbed doses from the finest GBBS discretization with MC Figure 9. Percent differences between the finest GBBS and MC Figure 10. Lung-soft tissue interface showing finest discretized GBBS and MC Figure 11. Bone-soft tissue interface showing finest discretized GBBS and MC Figure 12. Lung-soft tissue interface GBBS vs MC percent difference Figure 13. Bone-soft tissue interface GBBS vs MC percent difference Figure 14. Illustration showing how L ACT (i, j, k) is determined from the input activity distribution xv
17 Figure Y SPECT/CT and corresponding tetrahedral mesh Figure 16. Dose volume histograms for the 90 Y patient Figure I SPECT/CT and corresponding tetrahedral mesh Figure 18. Dose volume histograms for the 131 I patient Figure 19. Coronal plane showing GBBS and MC 131 I absorbed doses Figure 20. Box and whisker plots summarizing absorbed dose to tumors and nontumoral liver Figure 21. Boxplots showing variation in partition model absorbed doses due to variations in tissue-to-normal ratios Figure 22. Linear regressions of the mean MC absorbed doses as a function of partition model absorbed dose Figure 23. Sagittal view through liver and right lung illustrating excluded regions from the liver-lung interface Figure 24. Schematic geometry of the simulations for the liver-lung interface Figure 25. Isodose curves for MC, local deposition, soft-tissue kernel, and soft-tissue kernel with density correction in coronal plane through the right lung and liver Figure 26. Correlation of Monte Carlo with local deposition, soft-tissue kernel, and softtissue kernel with density correction in tumor and non-tumoral liver xvi
18 Figure 27. Sensitivity of the right lung absorbed dose to the liver-lung interface region Figure 28. Simulated profiles showing the absorbed dose at the liver-lung interface given a lung shunt fraction and spatial resolution Figure 29. Simulated profiles showing the absorbed dose percent differences at the liver-lung interface given a lung shunt fractoin and spatial resolution Figure 30. Boxplots summarizing response criteria for dosimetric quantities Figure 31. Logistic regressions for the dosimetric quantities fitted to response criteria Figure 32. ROC curves for response and dosimetric quantities investigated Figure 33. Accuracy of local deposition and MC given voxel size and spatial resolution Figure 34. Linear regression of mrecist tumor response as a function of mean tumor absorbed dose Figure 35. Linear regression of the binned probability of mrecist tumor response as a function of mean tumor absorbed dose Figure 36. Example logistic functions that have been parameterized by different values of d50% and γ50% Figure 37. The logistic regression for predicting mrecist given the mean absorbed dose of current data xvii
19 Figure 38. Statistically significant linear regression of modified RECIST criteria as a function of mean absorbed dose Figure 39. Illustration showing how increasing the sample size will decrease the 95% confidence interval in our logistic regressions xviii
20 List of Tables Table 1. Summary of approximate energy group widths for different energy discretizations Table 2. Percent difference values for DOSXYZnrc MC versus published data Table 3. Source voxel absorbed doses for the GBBS and MC Table 4. Summary of differences between GBBS and MC absorbed doses near the source voxel Table 5. Percent differences for the coarsest and finest GBBS voxel-s-values relative to published data and MC Table 6. Percent differences for GBBS from MC near an interface Table 7. Parameters used in determining the final 90 Y and 131 I mesh-sizing functions. 72 Table 8. Parameters used for the multiple 90 Y GBBS calculations Table 9. Parameters used for the multiple 131 I GBBS calculations Table 10. Percent differences between GBBS and MC for 90 Y patient VOIs Table 11. Percent differences between GBBS and MC for 131 I patient VOIs Table 12. Mean ± sd of absorbed doses for clinical dosimetry models and MC Table 13. Coefficients of variation for tissue-to-normal ratio and partition model absorbed doses xix
21 Table 14. Uncertainty analysis for partition model absorbed doses estimated using nominal input values Table 15. Correlations of MC with clinical dosimetry models Table 16. Bootstrapped linear regressions transforming clinical dosimetry models to mean absorbed dose calculated by MC Table 17. Percent difference of clinical dosimetry model absorbed doses from MC mean absorbed doses Table 18. Characteristics of the different voxel-level dosimetry models investigated. 117 Table 19. Percent differences between soft-tissue kernel with density correction, softtissue kernel, and local deposition with MC Table 20. Intervals around the liver-lung interface where soft-tissue kernel with density correction, soft-tissue kernel, local deposition, and Monte Carlo achieve 10% accuracy for multiple spatial resolutions and lung shunt fractions Table 21. Summary statistics of dosimetric quantities for responders and nonresponders Table 22. Summary of logistic regressions for predicting response criteria from dosimetric quantities Table 23. Summary of ROC analysis for the response and dosimetric quantities investigated xx
22 Table 24. Data showing how varying the number of samples affects the standard errors on the coefficients and the corresponding d50% and γ50% xxi
23 Chapter 1: Introduction 1.1 Purpose Statement The goal of the research presented in this dissertation is to improve the state of voxel-level dosimetry for radiopharmaceutical therapies which include radioimmunotherapy, targeted radionuclide therapy (TRT), peptide receptor radiation therapy (PRRT), and radioactive microsphere therapies. Microspheres are technically a sealed source, but in clinical practice they are administered and handled as if they were an unsealed source; the main difference between the other nuclear medicine (NM) therapies and 90 Y microspheres is that the former are metabolized, whereas microspheres become mechanically trapped in arterioles. Broadly speaking, this research focuses on translating methods commonly practiced in radiation oncology, where voxel-level absorbed doses have been used regularly over the last two decades, to the nuclear medicine regime, where improvements in emission imaging, nanotechnology, and targeted drug development, including radiopharmaceuticals, continue to further the understanding, diagnosis, and control of cancer and other diseases. This dissertation addresses several issues for both applying a grid-based Boltzman solver (GBBS) in the nuclear medicine regime and the value of voxel level absorbed doses in nuclear medicine. The first part of the research investigates using the general GBBS code ATTILA 1 for nuclear medicine absorbed dose calculations. ATTILA was the precursor to the hexahedral-based GBBS Acuros that is used for 1
24 clinical absorbed dose calculations in radiation oncology The GBBS ATTILA, which has been studied for both high energy sealed source photon brachytherapy and megavoltage photon beams 12,14 is benchmarked against Monte Carlo in the nuclear medicine energy regime in the familiar voxel-s-value geometry 15. The GBBS is also applied to patient scans with a relaxation of the geometry matching constraint imposed during the voxel-s-value study; an adaptive tetrahedral meshing scheme is devised to use on the patient SPECT/CT s to generate source, material, and density distribution inputs to make full scan absorbed dose calculations with the GBBS clinically practical with regards to calculation time and memory. An important second goal of the research is to demonstrate the value of voxellevel absorbed doses in the NM regime. Using post-therapy bremsstrahlung SPECT/CT scans for patients treated with 90Y glass microspheres, this work 1) reports differences in voxel-level absorbed dose calculations (Monte Carlo, dose kernel, dose kernel with density scaling, local deposition) in the liver, lung, and at the liver-lung interface; 2) generates absorbed dose response curves for HCC tumors; 3) quantifies biases and uncertainties in standard of practice dosimetry models by transforming single compartment MIRD and three compartment partition model absorbed doses to voxellevel absorbed doses calculated by Monte Carlo. 1.2 Background Therapeutic Nuclear Medicine Ionizing radiation has a long history of therapeutic success in medicine for many diseases 16. Shortly after the cyclotron was invented by Ernest Lawrence, unsealed 2
25 sources (and eventually radiopharmaceuticals) were made available for therapeutic procedures. In 1936, John Lawrence treated the first patient with an internal emitter: a patient with polycythemia vera was treated using the beta emitter 32 P. 17 The first instance of targeted radionuclide therapy with radioactive iodine in a human was performed by Seidlin et. al 18.; they documented the successful application of radioactive iodine for treating metastatic adenocarcinoma of the thyroid. 18 Today, there are guidelines and practice parameters in place for administering such unsealed source therapies that range from alpha and beta emitters for metastatic bone disease to beta emitters for non-hodgkins lymphoma The Committee on Medical Internal Radiation Dose (MIRD) of the Society of Nuclear Medicine and Molecular Imaging (SNMMI) has been integral to the development and implementation of dosimetric aspects of nuclear medicine therapy, with dedicated pamphlets to aid the nuclear medicine community with collecting image data, pharmacokinetics, and applying dosimetry models 15, The European Association of Nuclear Medicine (EANM) also provides dosimetry recommendations and practice guidelines 19,30 41 for several common NM procedures. Voxel-level absorbed dose calculation methods for nuclear medicine, which require at least one tomographic emission image, have been around for decades 15,42 44, but they have yet to be incorporated into routine clinical practice. There are several reasons for this, including: reimbursement; referral biases; competing therapies; the need to acquire tomographic emission scans at multiple time points; lack of dedicated personnel (equivalent to dosimetrists in radiation oncology); treatment planning tools; 3
26 inadequate activity quantification and image quality in reconstructed emission images; and long computation times for Monte Carlo voxel-level absorbed dose calculations. Figure 1 provides an overview of nuclear medicine absorbed dose and biological effective dose (BED) calculations 45,46. The first objective when calculating voxel-level absorbed doses is to estimate the activity as a function of space and time: A(x, y, z, t). The acquisition process for planning can yield data from multiple time-points, consisting of various combinations of blood and tissue samples, planar images, and tomographic images. After spatially registering activity distributions from multiple time-points, the next step is a temporal integration to yield the total number of disintegrations (cumulated activity) at each spatial location: N(x, y, z) = 0 A(x, y, z, t)dt. This distribution can then be input into a Monte Carlo dose calculation or convolved with a point dose kernel to compute absorbed doses 15, but accurate radiation transport methods like Monte Carlo are preferred because they account for the different materials and densities throughout the patient, as opposed to kernels that are precalculated in a uniform medium. 4
27 5
28 Figure 1. A schematic for planning voxel-based absorbed doses or biological effective doses incorporating dose rate, repair, and radiosensitiviity for TRT. For planning purposes, the goal is to deliver absorbed doses to tumors while minimizing toxicity in normal tissues, which are usually kidneys, bone marrow, liver and lungs in therapeutic nuclear medicine. The physician would prescribe a target tumor absorbed dose, and then this absorbed dose would be used to determine the amount of activity to administer for therapy. A similar prescription can be created using the BED model, which is potentially useful for comparing with external beam radiotherapy absorbed doses Voxel-level Absorbed Dose Calculations Voxel-level absorbed doses have been used extensively in radiation oncology for external beam megavoltage photon treatments as well as, sealed source photon brachytherapy treatments with 192 Ir, 125 I, 103 Pd, and other radionuclides. The current standard of practice for voxel-level absorbed doses with external photon beams relies on superposition/convolution methods such as the anisotropic analytical algorithm and collapsed cone convolution 50. These have limitations stemming from the approximation of transport imposed by scaling a water or tissue based kernel. However, there continues to be a need for more accurate calculations as radiation oncologists attempt to treat smaller targets in low density and interface regions. Consequently, full radiation transport methods including both Monte Carlo 51 and GBBS 8,52 are being made available for clinical external photon beam calculations. 6
29 For sealed source brachytherapy, the current standard of practice relies on the American Association of Physicists in Medicine Task Group 43 formalism 53,54 which parameterizes an absorbed dose kernel from a single source at the center of a sphere of water. This formalism enables voxel-level absorbed doses, but disregards boundaries, tissue heterogeneities, and brachytherapy implant applicator materials. However, the recent introduction of model-based dose calculations in brachytherapy for clinical absorbed dose calculations is again emphasizing the importance of more realistic radiation transport in patients for therapeutic procedures 55,56. The GBBS 2,5 Acuros BrachyVision and advanced collapsed engine ACE Oncentra 57 are now available from vendors for 192 Ir sealed source brachytherapy. Similar to external beam and sealed source brachytherapy there is an on-going evolution in absorbed dose calculations for nuclear medicine therapy. The current standard of practice is not patient-specific and utilizes generic S-values for organ-level absorbed dose estimates 58,59. MIRD and other researchers have published voxel-svalues (dose kernels), but these are approximations to full transport with known limitations regarding material and tissue heterogeneity. Collapsed cone convolution methods, common in radiation oncology, were recently implemented for nuclear medicine 60,61, and have improved handling of heterogeneities compared to conventional published dose kernels. However, there is still a push toward full transport as witnessed by the many research codes based on Monte Carlo that have been used to demonstrate the potential of patient-specific voxel-level absorbed doses 42 44, Unfortunately, Monte Carlo methods are computationally intensive and require much 7
30 computation time to reduce statistical noise inherent to the stochastic process of tracking/simulating individual particles. However, a potential solution to the computational time, is to extend the deterministic GBBS that has been shown to be fast and accurate in external beam and sealed source brachytherapy 12,14. Deterministic solvers of the linear Boltzmann transport equation (LBTE) have become more practical over the last decade as computers shifted to 64-bit architectures; this has allowed larger amounts of the phase-space variables (space, energy, angle) to reside in main memory allowing for more efficient solvers. The embarrassingly parallel nature of Monte Carlo has also benefitted from multiple cores and graphical processing units. GBBS is also commonly known as the discreteordinates method in the nuclear engineering field. It directly solves the LBTE for the steady-state distribution of neutral particles as a function of space, angle, and energy (i.e. angular flux) and the linear Boltzmann-Fokker-Plank (BFP) equation for the angular flux of charged particles 66,67. The GBBS ATTILA solves the transport equations in three-dimensions through discretization of the phase-space variables consisting of energy, angle, and space. The solution is defined throughout the entire space represented by the problem. Discrete ordinates differencing is used for discretizing angles. Spatial discretization utilizes linear discontinuous finite element spatial differencing on an unstructured tetrahedral mesh, and standard multi-group energy discretization is employed to represent energy. The scattering sources are represented as a finite number of terms in a spherical harmonics expansion, which is limited by the number of discrete ordinates. The GBBS 8
31 requires cross-sections to be in a multi-group Legendre form and are obtained through an external program As the GBBS refines the phase-space to finer and finer discretizations, and Monte Carlo simulates an increasing number of particles, the GBBS and Monte Carlo, in theory, will converge to the same solution Radioembolization for hepatocellular carcinoma and metatstatic colorectal cancers Liver cancer accounts for 748,000 new cancer cases every year making it the sixth most common cancer throughout the world 71,72. It is almost always fatal, with survival rates on the order of a few percent; liver cancers are estimated to cause 696,000 deaths per year globally - trailing only the number of deaths from lung (1,380,000) and stomach (738,000) cancers. 72 Consequently, investigations to improve the efficacy of liver-directed therapies is of the utmost importance for the global population. There are many options for treating HCC, as well as, liver metastases from colorectal cancer 73,74. The therapy chosen depends on a multitude of factors, including: patient stage; previous therapy; institutional resources and preference; and patient resources and preference. Bland embolization, transarterial chemoembolization, radioembolization, radiofrequency ablation, sealed source brachytherapy 75, stereotactic body radiation therapy 76, proton therapy, kinase inhibition (sorafenib), and others are treatment options. 9
32 Radioembolization ( 90 Y radiolabeled microspheres) liver-directed therapy is multidisciplinary, often including personnel from radiation oncology, interventional radiology, nuclear medicine, and nuclear medicine and radiation physics. 77,78 90 Y microspheres are classified as a sealed source used for permanent implantation by the Nuclear Regulatory Commission, 79 but in practice they are handled and delivered similar to unsealed sources. There are currently two options for 90 Y radioembolization with microspheres. Resin microspheres (SIR-Spheres, Sirtex SIR-Spheres Pty Ltd.) are FDA approved for the treatment of colorectal cancer liver metastases. Glass microspheres (Therasphere, Theragenics Corporation) can only be used under a humanitarian device exemption from the FDA for hepatocellular carcinoma (HCC) - to treat other diseases in the liver with glass spheres the user s institutional review board must approve it. The package insert for glass microspheres 80 uses a simple MIRD style mean absorbed to the target (segmental, lobar or whole liver) region, whereas the package insert for resin microspheres details both an empiric body surface area, and a three compartment partition model approach that separates tumor from non-tumoral (i.e. normal) liver 81. Compared to treatment planning in radiation oncology, these are very simple absorbed dose calculation methods that only report mean absorbed doses. HCC has been shown to be radiosensitive, but unfortunately, so is the nontumoral liver 74. Radioembolization with 90 Y microspheres exploits the fact that HCC tumors exhibit hypervascularity and receive most of their blood supply from the hepatic artery, while normal liver parenchyma receives blood supply predominantly from the portal vein 82. This allows an interventional radiologist to guide a catheter from the femoral artery into the hepatic artery or one of its branches, where the microspheres 10
33 can be slowly released and delivered to the target volume. Such a delivery and subsequent trapping of microspheres in the arterioles allows a large increase in the absorbed dose in and around the tumor while minimizing absorbed dose in surrounding non-tumoral liver tissue. 1.3 Significance and Rationale The general GBBS code ATTILA has not been benchmarked in the voxellevel nuclear medicine energy regime where absorbed dose gradients can change by orders of magnitude over a few millimeters, compared to smaller gradients found in sealed source brachytherapy and external beam. Primary electron sources (betas, auger electrons, internal conversion electrons) are common in nuclear medicine, but the study of the GBBS for electron transport in patients is limited to partial-coupling (photon interactions are allowed to generate electrons, but electron interactions are not allowed generate photons) from megavoltage photon beams with an electron source component from the linear accelerator head that only affects the absorbed dose near the patient s surface. Relative to Monte Carlo transport codes, three-dimensional electron transport is fairly new to the GBBS 83. Consequently, an investigation of the GBBS ATTILA in a well-known geometry for therapeutic nuclear medicine with relevant energy spectra and radionuclides is required. A major driving force behind this research is the realization that biologists and chemists continue to identify more biomarkers and develop corresponding targeting agents that can be labeled with a radionuclide. In parallel to these molecular 11
34 developments, advances in detector technologies and reconstruction methods are improving emission image quality, sensitivity, and resolution; and they are providing more accurate quantifications 84. As a result, the therapeutic options available to nuclear medicine are likely to increase. Radioimmunotherapy (e.g. monoclonal antibodies), peptide receptor radionuclide therapy (PRRT), and other receptor-based targeting agents can be labeled with radionuclides for therapeutic purposes to target thyroid carcinoma, neuroendocrine tumors, solid tumors, lymphomas, and bone metastases. 153 Sm-ethylene diamine tetramethylene phosphonate ( 153 Sm EDTMP) (Quadramet, EUSA Pharma, Inc.) and 89 SrCl2 (Metastron, GE Healthcare) are used to target bone metastases. 85, I-tositumomab (Bexxar, GlaxoSmithKline) and 90 Y-ibritumomab tiuxetan (Zevalin, Spectrum Pharmaceuticals, Inc.) are both approved by the FDA for the treatment of CD20+ transformed non-hodgkins lymphoma, although BEXXAR was commercially withdrawn in The alpha emitter 223 RaCl2 (Xofigo, Bayer Aktiengesellschaft) has been FDA approved for bone metastases from castrate resistant prostate cancer I metaiodobenzylguanidine (MIBG) has been used to treat neuroblastomas 88 90, and PRRT with both 90 Y and 177 Lu DOTA have been used to target somatostatin receptors on neuroendocrine tumors More recently, prostatespecific membrane antigen, which is overexpressed on prostate cancer cells, has been targeted with peptides labeled with 68 Ga for PET imaging and 177 Lu for therapy purposes Given the increasing number of nuclear medicine therapies and advances in imaging, providing voxel-level absorbed doses and biological effective doses will be important for properly planning patient treatments and interpreting or predicting their response to therapy
35 Therapeutic procedures should strive to be as patient-specific as possible and utilize the individual patient s anatomy and biodistribution. The University of Michigan performed a study using patient-specific 3D imaging with voxel-level absorbed doses and showed a clear separation in progression free survival based on tumor absorbed doses for Non-Hodgkins lymphoma patients treated with 131 I-tositumomab. 98 This patient-specific approach is the one utilized in radiation oncology, where a patient s CT scans are used to plan and calculate absorbed doses. Unfortunately, the current standard of practice for nuclear medicine absorbed dose calculations is not patient specific. It utilizes stylized mathematical phantoms to represent patient geometry to calculate S-values. The ubiquitous S-values (mean absorbed dose to a target region per unit cumulated activity in a source region) for nuclear medicine organ-level dosimetry are a result of efforts from individuals associated with the MIRD Committee. 99 These S-values were calculated primarily for occupational and diagnostic safety purposes, not therapeutic procedures. In practice, treatment planning for nuclear medicine consists of 1) an empirical one-size-fits-all activity prescription (e.g. 200 mci Na 131 I), 2) prescribing activity based on body surface area, or 3) prescribing activity based on patient mass. These prescription methods have the advantage of simplicity, but they fail to tailor therapies for individual patients. In practice, the S-values are routinely used for determining patient absorbed doses from therapy as well. 58 However, S-values have the following known limitations: 1) they assume a uniform distribution of activity throughout an organ and thus only report the mean absorbed dose to organs; 2) they are not patient-specific because they are based on a stylized phantom; and 3) they do not include a tumor 13
 101,102, but even the advanced NURBS phantoms fail to capture")
36 model consistent with the patient geometry, but simple spherical tumor models for nonpenetrating radiations are available. Figure 2 shows the progression of phantoms over the years from quadric surfaces 100 to the recent non-uniform rational B-splines (NURBS) 101,102, but even the advanced NURBS phantoms fail to capture variations in an individual patient as shown on a coronal slice of the SPECT/CT from a patient treated with 153 Sm-EDTMP for metastatic breast cancer osteosarcoma. (a) (b) (c) Figure 2 Virtual Phantoms and an individual patient. Early S-values were calculated using patient geometry defined with quadric surfaces (a), while newer ones have used non-uniform rational B-splines (NURBS) (b). Although the level of realism is improved with NURBS, it is still not patient-specific as shown by the coronal SPECT/CT image (c). The quadric surfaces and NURBS image are from research originally published in JNM. Stabin. Uncertainties in internal dose calculations for radiopharmaceuticals. J Nucl Med. 2008; 49: by the Society of Nuclear Medicine and Molecular Imaging, Inc. The clinical SPECT/CT image (c) was provided courtesy of William D. Erwin at MD Anderson Cancer Center, Houston, TX. 14
37 1.4 Hypothesis and Aims Central Hypothesis The central hypothesis of this dissertation is that a deterministic grid-based Boltzmann solver can calculate voxel-level absorbed doses for nuclear medicine applications within 5% of Monte Carlo Specific Aim 1 Benchmark GBBS against MC calculations of voxel-level absorbed doses for the nuclear medicine regime. Rationale: The GBBS has been studied for megavoltage photon beams and high energy sealed source photons. Partial coupling has been investigated for external beam where absorbed dose was scored. For sealed source brachytherapy, only photon transport was considered and KERMA was reported, not absorbed dose. There is a gap in knowledge using the GBBS for voxel-level absorbed doses in the nuclear medicine energy regime. Thus, this aim quantifies the differences between GBBS and Monte Carlo. Several studies have shown that differences between modern Monte Carlo radiation transport codes are on the order of a few to ten percent when comparing electron and photon sources, with electron sources yielding larger differences relative to photons The differences between GBBS and Monte Carlo 15
38 are contextualized by comparing them with the magnitude of differences encountered among Monte Carlo generated voxel-s-values in the literature Specific Aim 2 Extend the GBBS to voxel-level absorbed dose calculations on clinical data and show GBBS is comparable to MC. Rationale: The low-level benchmarking of the GBBS against MC in voxel-svalue geometry required numerous (>= 6) tetrahedrons per voxel. This is an inefficient use of the spatial discretization used by the GBBS, and forcing tetrahedrons to match voxels unnecessarily increases the computational burden for the GBBS. Thus, in this aim we show that fast and accurate absorbed dose can be calculated by executing the GBBS with an adaptive tetrahedral mesh derived from the patient s emission and transmission scans, while also adjusting the transport cut off energy and the angular quadrature order (number of angles) Specific Aim 3 Retrospectively assess the value of voxel-level absorbed dose calculations for 90 Y microsphere patients. Rationale: Dosimetry models currently used in the clinic (empirical body surface area (BSA), single compartment MIRD (STD), three compartment partition model (PM)) have serious limitations. Voxel-level dosimetry overcomes some of these limitations, but interpretation of voxel-level absorbed doses requires care. Using a UT MD 16
39 Anderson Cancer Center institutional review board approved retrospective analysis ( Improved radiation absorbed dose estimates for tumor and normal liver tissues following trans-hepatic arterial radioembolic therapy using patient-specific liver volumes and tumor-to-normal liver uptake ratios, DR , PI:SCK), we investigated the following to demonstrate the value of voxel-level dosimetry: 1) limitations, biases, and variability in current clinical dosimetry models; 2) differences in voxel-level absorbed dose methods and the effect of spatial resolution; and 3) modeling of tumor response using voxel-level dosimetry. Finally, it is important to recognize that although voxellevel dosimetry is theoretically technically superior, the vast majority of clinical data to date has been reported using STD or PM; as a result great care must be taken to ensure the community can properly use voxel-level dosimetry to improve or maintain outcomes, and not produce worse clinical results. Understanding the best ways to use new methods takes time Organization The main body of this dissertation consists of five chapters. Each chapter is written in manuscript form and includes the following five sections: introduction, methods and materials, results, discussion, and conclusion. Chapter two specifically addresses specific aim 1. It is a low-level benchmarking of the GBBS in the nuclear medicine energy regime using voxel-s-value geometry in multiple materials and an interface. The tetrahedrons used by the GBBS are not allowed to cross voxel boundaries defined by Monte Carlo, and groupings of tetrahedrons are used to create 17
40 regions corresponding to the voxel geometry used by Monte Carlo. This approach ensures that differences between GBBS and Monte Carlo are not due to source, material, or scoring geometry. Previous comparisons of the GBBS with Monte Carlo for medical physics applications have relied heavily on gamma index analysis 110, which combines distance to agreement and dose differences. Given the large absorbed dose gradients in nuclear medicine, distance to agreement will cause most of the gamma indices to pass, and thus will not be a discriminating metric. A more rigorous voxel-tovoxel matched geometry allows quantitative comparisons using percent difference relative to Monte Carlo and other published voxel-s-values. Differences between the GBBS and Monte Carlo are contextualized by comparing them with the magnitude of differences encountered among other published voxel-s-values in the literature 15,103,104,111. Furthermore, multiple discretizations of the phase-space variables were carried out to show that the GBBS was converged in phase-space variables in and around the source voxel. Specific aim 2 is detailed in chapter three, which extends the GBBS to clinical patient SPECT/CT datasets and shows that fast and accurate, relative to Monte Carlo, absorbed dose calculations are possible. Maintaining the geometry matching performed in specific aim 1 would result in at least six tetrahedrons per voxel. Such matching is not practical for a patient scan and the GBBS ATTILA, with its use of unstructured tetrahedrons and linear discontinuous finite element method, was not designed for such a grid. To reduce the number of spatial elements to make computations clinically practical (memory- and speed-wise) the geometry matching is relaxed. This is accomplished by generating adaptive tetrahedral meshes based on 18
41 both the SPECT and CT. The methodology presented is readily extended to other radiopharmaceutical scans for generating such meshes by incorporating the activity, material, and material gradients. The accuracy, relative to Monte Carlo, and calculation times are recorded for different number of outer iterations, angular quadrature orders, and increasing the transport energy cutoffs for electrons. Specific aim 3 is spread throughout chapters 4, 5, and 6. In chapter 4, clinical dosimetry models used for glass microspheres (single compartment MIRD and three compartment partition model MIRD) are compared with voxel-level Monte Carlo absorbed doses for post-therapy 90 Y bremsstrahlung imaging. The partition model requires a tumor-to-normal ratio (TNR) for the absorbed dose calculation; a portion of this chapter quantifies the variability in TNR and tumor and non-tumoral (i.e. normal ) liver doses when using a single sphere to estimate the normal uptake. Linear regressions are performed to show the mean voxel-level absorbed to tumor or normal liver as a function of the single compartment or three compartment dosimetry models. A propagation of errors is also included to estimate the uncertainty in absorbed doses using the clinical dosimetry models. It should be noted that MC calculations and not GBBS calculations were performed in specific aim 3. However, the results from specific aims one and two demonstrate that we expect to find similar results when using either MC or GBBS for 90 Y microspheres. The fifth chapter investigates multiple voxel-level absorbed dose calculation methods using post-therapy 90 Y bremsstrahlung images. This is an important study because there are many different implementations of voxel-level dosimetry for 90 Y 19
42 microspheres. Monte Carlo, soft tissue kernel, soft tissue kernel with density correction, and local deposition are all investigated in the liver, lung, and at the liver-lung interface. As the field moves toward voxel-level dosimetry, this work 1) highlights the issue of using a simple soft tissue kernel without density correction in the lung; and 2) shows sensitivity of reported lung absorbed doses to segmentation given the spatial resolution limitations of emission imaging. A simple simulation study is also performed that examines the accuracy of the different methods at the liver-lung interface for multiple lung shunt fractions and spatial resolutions. In chapter 6, absorbed dose response is investigated for HCC tumors. An interventional radiologist analyzed patient follow-up imaging data for tumor response using RECIST, WHO, and modified RECIST criteria. Tumors were classified as complete response, partial response, stable disease, or progressive disease; and these were grouped into responders (complete response & partial response) and nonresponders (stable disease & progressive disease). Absorbed doses were calculated with Monte Carlo and transformed to biological effective dose. Logistic regression was then performed to generate response probability curves as a function of various dose volume histogram quantities for both absorbed dose and biological effective dose. Finally, the last chapter is a summary and discussion of the work performed for this dissertation. It also provides future research opportunities for the GBBS and voxellevel absorbed dose calculations for 90Y microspheres and other nuclear medicine therapies. 20
43 Chapter 2: Evaluation of a deterministic Grid-Based Boltzmann Solver (GBBS) for voxel-level absorbed dose calculations in nuclear medicine. 2.1 Introduction Voxel-based dosimetry models (VBDM) are the norm in radiation oncology practice where external beam and sealed source brachytherapy procedures are performed. Several nuclear medicine researchers have implemented their own VBDM, 42 44, but unfortunately such VBDM are not widely used within nuclear medicine departments. Nuclear medicine instead continues to rely on anthropomorphic phantoms that are not patient-specific, assume uniform activity distributions throughout organs, and do not include tumor models, 118 although some have added simple tumor models. 58,64,65 Studies have shown that VBDMs, sometimes coupled with radiobiological modeling, operating on patient-specific anatomy including tumors improves treatment planning and refines predictions of response and toxicities. 98, Implementation of VBDMs in therapeutic nuclear medicine range from simplified complete local absorption/deposition models for 90 Y, 122,123 voxel dose kernels, 15,104,111,112,122,123 and collapsed-cone convolution 60 to solutions of the fully coupled transport equations for electrons, positrons, and photons ,122,124 Solutions to the linear Boltzmann transport equation (LBTE) have traditionally been obtained stochastically through Monte Carlo (MC) techniques, however deterministic methods also exist to solve the LBTE. 125 Deterministic solvers of the LBTE are relatively new to the radiotherapy community. Only recently have grid-based Boltzmann solvers (GBBS) been adapted for clinical use in external photon beams and 192 Ir sealed source brachytherapy, 5 14,52 and 21
44 have been investigated for use in magnetic fields. 126 ATTILA (Varian Medical Systems, Palo Alto, CA) is a general purpose GBBS code, and it has been investigated for applications to megavoltage photon beams and high energy sealed source gamma emitters ( 137 Cs, 192 Ir) It has not been studied for nuclear medicine applications of unsealed sources where electron sources (beta, auger, and internal conversion electrons) are responsible for most of the energy deposition, and gamma-ray and x-ray sources are common. When compared to external beam and sealed source brachytherapy, unsealed sources produce absorbed doses with much larger gradients and increased heterogeneity. It is important to evaluate the GBBS at the lower (relative to external beam) energies found in nuclear medicine to ensure that its transport and cross sections are sufficient for unsealed source voxel-level dosimetry. The goal of this investigation was to perform a low-level evaluation of the GBBS ATTILA for voxel-level dosimetry in clinical nuclear medicine. To accomplish this, MC voxel-s-values were calculated with DOSXYZnrc and benchmarked against published tabulations of voxel-s-values. It should be noted that MC is often taken as the gold standard in medical physics radiation transport calculations; then, taking MC as truth, absorbed dose distributions estimated using the GBBS were compared to those from MC in the nuclear medicine energy regime for photons and electrons in the following configurations: 1) the well-studied single source voxel (voxel-s-values) in uniform soft tissue, bone, and lung; and 2) a single source voxel at the interface of materials (lung soft tissue, soft tissue lung, bone soft tissue, and soft tissue bone). Our goal was not to calculate voxel-s-values with the GBBS for clinical use, but rather to use voxel-s-values as a benchmark for GBBS in the therapeutic nuclear medicine regime. The use of voxel-s-values allows us to match source and scoring 22
45 geometry and materials exactly and perform quantitative comparisons with published data. We want to emphasize this is a difficult transport problem with very large gradients, and it does not represent a true in-vivo clinical activity distribution acquired via PET or SPECT. However, voxel-s-values are well known in the nuclear medicine community and, most importantly, they have been tabulated by several authors using modern radiation transport codes. Given that voxel-s-values are well known and quantitative comparisons are possible due to tabulation, we chose to perform a lowlevel benchmarking of the GBBS against MC using the voxel-s-value geometry to elucidate potential differences between GBBS and other modern radiation transport codes for therapeutic nuclear medicine. This work represents the first step in demonstrating the potential value of GBBS for absorbed dose calculations in nuclear medicine. 2.2 Materials and Methods DOSXYZnrc Monte Carlo Simulations MC was used as the gold standard for comparisons with the GBBS code. MC simulations were performed using DOSXYZnrc 127 which is a user code of EGSnrc (version ). 128 EGSnrc is a general purpose radiation transport code with improved low energy support compared with EGS4, 129 and DOSXYZnrc allows scoring in the familiar Cartesian voxel geometry ubiquitous in medical imaging. The simulation geometry employed was the 3 mm voxel-s-value geometry found in MIRD Report Briefly, this phantom geometry consisted of a three-dimensional infinite distribution of soft tissue discretized into 3 mm isotropic voxels, where the center voxel was uniformly filled with activity. The absorbed dose to each target voxel 23
46 from the source voxel was then reported as a function of radial distance; source voxel center to target voxel center was defined as a radial distance r i = (Δ i ) 2 + (Δ j ) 2 + (Δ k ) 2, where Δ = 3 mm and i, j, k represent 0-based indices relative to the source voxel. Radionuclide spectra were obtained from RADTABS software. 130 Independent simulations were performed for the following emission components: 1) photons: gamma and x-ray; 2) continuous beta spectra (β ); and 3) mono-energetic electrons: auger and internal conversion (auger + IC). The simulated auger component was the collapsed auger electrons listed in the *.RAD file output by RADTABS. The continuous beta spectrum is often the dominant energy supplier in the source voxel, but auger and conversion electrons can also provide substantial contributions. Beyond the range of beta, auger, and conversion electrons, the gamma and x-ray emissions are dominant. We did not simulate the gamma and x-ray emissions or auger and conversion electrons for 90 Y because their contributions are negligible for dosimetry. Several publications exist for voxel-s-values using MC. 15,103,104,111,112 As an initial check we compared our MC simulations with published data. For soft tissue we compared our MC simulation results with published data for 131 I, 90 Y, 153 Sm, 177 Lu, and 99m Tc taken from Lanconelli et al, 104 Amato et al, 111 or Bolch et al. 15 For bone we compared our MC simulation results with published data for 131 I, 90 Y, 153 Sm, and 177 Lu using tabulations from Lanconelli et al 104. Lanconelli et al 104 data were generated using DOSXYZnrc. Amato et al 111 data were generated using Geant4, and Bolch et al 15 data were from EGS4. We tabulated the emission contributions (gamma + x-ray, beta, auger + IC) as a percentage of the total voxel-s-value at each voxel for the radionuclides 24
47 investigated. For quantitative comparisons we followed the analysis of Pacilio et al 103 and investigated differences in the source voxel (000), nearest neighbor (001), and along the diagonal (011). To put the differences in perspective, we compared our MC simulations with published values 15,103,104,111 from other modern radiation transport codes. For qualitative comparisons we plotted the voxel-s-values by collapsing them to one dimension as a function of their radius r i. The voxel-s-values were sorted by radial distance (r i ) such that r 0 r 1 r n ; for example, r 0 corresponds to the source voxel (i = 0, j = 0, k = 0). In addition to the absolute voxel-s-values, we plotted percent differences of MC relative to published data as a function of r i. For comparisons with ATTILA we investigated three different materials generated using the preprocessor PEGS4: soft tissue 131 (ρ = 1.04 g/cc), cortical bone 100 (ρ = 1.85 g/cc), and lung 100 (ρ = 0.26 g/cc). The sources simulated were 90 Y and 131 I, which are the two radionuclides most commonly used in internal radionuclide therapy; mono-energetic 1MeV, 0.1MeV, and 0.01MeV electrons and photons were also simulated to span the energy range found in typical nuclear medicine procedures. For our MC simulations, all electrons and photons were tracked down to kinetic energies of 1 kev. The simulation parameters were set to all the advanced options including bound Compton scattering, Rayleigh scattering, atomic relaxations, electron impact ionization, XCOM photon cross sections 132, spin effects, exact boundary crossing, and PRESTA-II 128,129. Our MC simulations were performed using 1E+09 source particles for each 25
48 emitted radiation: 1) gamma + x-ray, 2) beta, and 3) auger + IC. This yielded statistical uncertainty 0.05% in the source voxel for all sources in soft tissue. The full voxel-svalues were constructed by adding the individual emitted radiation components together with weightings taken from RADTABS ATTILA GBBS Code ATTILA (version 8.0.0) was the GBBS code evaluated in this work. ATTILA has been used to calculate absorbed doses from external megavoltage photon beams 12,14, as well as high energy gamma emitting ( 137 Cs, 192 Ir) sealed sources. 12,13 ATTILA discretizes space, angle, and energy to solve the LBTE for photons and the Linear Boltzmann-Fokker-Planck Transport Equation (LBFPTE) for charged particles. It solves for the energy and angular dependent particle flux Ψ(r, E, Ω ) throughout space, and it has the following properties: 1) support for electrons, positrons, photons, and neutrons; 2) fully-coupled transport where electrons and positrons generate photons, and photons generate electrons and positrons; 3) unstructured tetrahedral mesh to represent geometry; 4) linear discontinuous finite element in space; 5) multi-group discretization in energy; 6) discrete ordinates differencing in angle; and 7) spherical harmonics expansion of scattering source. 12,14,133 The energy dependent scalar flux, Φ(r, E), is computed by ATTILA and used to calculate reaction rates corresponding to absorbed dose (energy reaction rate) for electron groups or kinetic energy released in material (KERMA) for photons; the energy dependent reaction rate cross sections were calculated by the cross section generator described later. Details of the LBTE, LBFPTE, and calculating reaction rates as post- 26
49 processing steps are not replicated here because they have been listed and described in previous publications ATTILA requires multi-group energy cross sections, which were generated using ZERKON (Varian Medical Systems, Palo Alto, CA), which is an extension of CEPXS. 68 CEPXS has been benchmarked against several other codes suggesting it sufficiently accounts for electron and photon interactions. 69 For cross section generation, full-coupling was used for both photon and electron sources with a Legendre expansion of order 7. Cross sections were generated for soft tissue, lung, and bone matching the atomic composition and densities used in the MC simulations. Cross section files were generated for each radionuclide emission component and each energy group discretization Voxel-S-Value Simulations For the initial evaluation of ATTILA in the nuclear medicine regime, we chose to calculate voxel-s-values, as published by the Society of Nuclear Medicine and Molecular Imaging s Medical Internal Radiation Dosimetry (MIRD) committee. 15 Voxel- S-values are well known in the nuclear medicine community, and publications offer tabulated results for quantitative comparisons. 15,104,111 Most work and publications to date have reported voxel-s-values only in soft tissue. In this work, we performed calculations in soft tissue, cortical bone, and lung. The MC simulations used were described earlier. The ATTILA settings and parameters selection are described below. 27
50 ATTILA Solver Settings We used square Chebychev Legendre quadrature sets, with Galerkin scattering treatment, and diagonal transport correction. For photon sources, we set the diffusion synthetic acceleration (DSA) to simplified_wla. DSA was turned off for the electron sources. Further detail on DSA can be found in the literature. 134 All electron and photon energy cutoffs were 1 kev Sensitivity Analysis for ATTILA The GBBS requires sufficient discretization in space, angle, energy, and scatter source to converge on a solution. In this work, we wanted to ensure that the space, angle, energy, and scatter source (also known as phase-space variables) converged sufficiently in and near the source; this was the rationale behind the sensitivity analysis. To evaluate the effect of these parameters, we generated calculations for three tetrahedral meshes (M 0, M 1, M 2 ); three energy group structures (E 0, E 1, E 2 ); three angular quadrature orders (S 4, S 8, S 16 ) corresponding to 32, 128, and 512 angles over the unit sphere respectively for the Square-Chebychev quadrature set; and up to a 7 th order spherical harmonics polynomial expansion of the scattering source (P 0 to P 6 ). Higher numbers on the subscripts indicate finer discretizations. To quantify the convergence in terms of the four discretization parameters, we calculated the ratio in the source voxel absorbed dose along each variable of the finest discretization to the next finest for each variable: ΔM = M 2 E 2 P 6 S 16 /M 1 E 2 P 6 S 16, ΔE = M 2 E 2 P 6 S 16 /M 2 E 1 P 6 S 16, ΔP = M 2 E 2 P 6 S 16 /M 2 E 2 P 5 S 16, and ΔS = M 2 E 2 P 6 S 16 /M 2 E 2 P 6 S 8. We qualitatively showed convergence by plotting the coarsest (M 0 E 0 P 0 S 4 ), intermediate (M 1 E 1 P 1 S 8 ), and finest (M 2 E 2 P 6 S 16 ) discretizations. 28
 and then exported in Parasolid format which was imported into ATTILA.")

 with 64,000 tetrahedrons (Figure 3). a) b) c) Figure 3.")
51 Tetrahedral Meshes We matched the voxel geometry from MC simulations exactly with ATTILA by decomposing each voxel into tetrahedrons. An octant of 3 mm voxels was generated in Solidworks (Dassault Systèmes SolidWorks Corporation, Waltham, MA) and then exported in Parasolid format which was imported into ATTILA. Tetrahedral meshes were generated with the built-in meshing utility in ATTILA. The coarsest mesh (M 0 ) had 6 tetrahedrons per voxel resulting in 8,000 tetrahedrons. We increased the number of tetrahedrons in and around the source voxel by reducing the maximum tetrahedral edge length in the source voxel and its neighbors for both intermediate and fine meshes. A maximum tetrahedral edge length of 1 mm was specified to generate the intermediate mesh (M 1 ) with 16,000 tetrahedrons, and a maximum tetrahedral edge length of 0.5 mm was selected to create the fine mesh (M 2 ) with 64,000 tetrahedrons (Figure 3). a) b) c) Figure 3. The three meshes of the octant are shown with increasing number of tetrahedrons in and around the source voxel, which is identified by the arrow. a) 29
52 M 0 with 8,000 tetrahedrons b) M 1 with 16,000 tetrahedrons, c) M 2 with 64,000 tetrahedrons Energy Groups We investigated three energy group discretizations for each radionuclide/source component. The coarse (E 0 ), intermediate (E 1 ), and fine (E 2 ) had approximately 30, 60, and 90 groups for each particle respectively, yielding approximately 60, 120, and 180 total groups for photons and electrons. Energy groups were distributed logarithmically using an approximately constant number of groups per decade down to 1 kev. The energy group widths are described in Table 1. 30
53 1 kev < 10 kev 10 kev < kev < 1 kev MeV > 1 MeV Coarse (E 0 ) 1 kev 10 kev 100 kev 200 kev Intermediate (E 1 ) 0.5 kev 5 kev 50 kev 100 kev Fine (E 2 ) kev 3.33 kev 33.3 kev 66.7 kev Table 1. Summary of approximate energy group widths for different energy discretizations as a function of energy. Group widths were the same for both electrons and photons. Significant mono-energetic radiations were accommodated by adding additional narrow groups. Photon energy group structure was adjusted for gamma and x-ray emission photo-peaks contributing >99% of the total gamma + x-ray emission energy for 131 I (80.2, 284, 326, 364, 503, 637, 643, and 723 kev); 1 kev width energy groups centered on the photo-peaks (e.g to kev) were added to the photon group structure. Similar adjustments to the group structure were made for the 131 I auger + IC emission component. Group structures for the mono-energetic electron and photon sources were also similarly adjusted using 1 kev group widths for 1 MeV and 0.1MeV, while a 0.1 kev group width was used for 0.01 MeV sources Comparison Metrics Similar to the validation of our MC, we performed quantitative comparisons of ATTILA (coarsest and finest discretizations) in and around the source (000,001,011) by calculating percent differences of the GBBS relative to MC and published data. The ground truth in the comparisons was MC or the published data. Qualitative comparisons of percent differences were performed graphically using radial plots of the 31
54 voxel-s-values Single source voxel at interface simulations To evaluate the GBBS with non-uniform materials, we performed simulations at an interface of two materials with a single voxel of activity on one side of the interface. The interfaces studied were lung soft tissue (L_S), soft tissue lung (S_L), bone soft tissue (B_S), and soft tissue bone (S_B); the first material represents the material containing the source voxel. The simulation geometry is illustrated in Figure 4; the scoring geometry (voxels) matched MC exactly by not allowing tetrahedrons to cross voxel boundaries. The same cross sections and source spectra were used as in the voxel-s-value simulations. However, a full voxel geometry (not octant) and tetrahedral mesh consisting of 120,000 tetrahedrons were generated as shown in Figure 5. The energy groups, scatter expansion, and angular quadrature set order were identical to the finest discretization in the uniform material simulations. 32

55 Figure 4. Illustration of the interface simulation geometry with 3 mm voxels. The source material was defined for voxel centers with z 0, whereas the other material was defined for voxel centers having z +1. The source voxel is at the center of the z = 0 plane. We evaluated the voxel-s-values and percent differences for radii confined to the planes z = 0 and z = +1. The ordering of radii in each planar comparison is shown as ordered subscripts. Similar to the procedure for uniform voxel-s-values, we performed quantitative comparisons of ATTILA using tabulations near the source voxel. On the source side, we investigated the source voxel (000), its neighbor (001), and along the diagonal (011). On the other side we investigated immediately across from the source (001*) and diagonally across from the source (011*). Local percent differences were evaluated 33

56 with the ground truth set to our MC. A notable difference in this analysis was that we only investigated voxels at the interface, meaning the voxel has to exist in the plane defined by z = 0 or z = +1; we only used the r i in the two planes on either side of the interface as shown in Figure 4. Qualitative comparisons were performed graphically using radial plots of voxel-s-values and percent differences for voxels in the z = 0 or z = +1 plane. Figure 5. The tetrahedral mesh used for the interface simulation seen at the interface surface between the planes of voxels. The red voxel in the center is the source. This mesh has 120, 000 tetrahedrons. 34
57 2.3. Results DOSXYZnrc MC Comparison with Published Data Figure 6 shows 131 I and 153 Sm plots comparing our DOSXYZnrc MC simulations with published data in soft tissue. Qualitatively, the absolute voxel-s-value graphs are in good agreement viewed on the logarithmic scale, where the absorbed dose can changes by 4 orders of magnitude from the source voxel to the bremsstrahlung tail. The local percent differences in Figure 6 indicate excellent agreement with both Lanconelli et al 104 and Amato et al 111 for 131 I values near the source (listed in Table 2) were within 3% and the differences at distance are within 5%. Compared to the older EGS4 used by Bolch et al 15, the source voxel had good agreement with differences around 25% for 001, and 011. At distances further from the source, the differences were within about 20%. For 153 Sm, which has significant auger and conversion electrons, our MC overestimated the Lanconelli et al 104 source voxel by 23.4%, but these differences reduced to 5% at distances further from the source voxel. MC differed from Amato et al 111 by -5.3% in the source voxel, however differences at distance were larger. The differences ranged from -40% to -20% with the maximum difference occurring near the transition region where the gamma and x-ray component becomes dominant. For the source voxel, differences between MC and published data were within 4.3% for 131 I, 90 Y, and 99m Tc. However, MC differences with Lanconelli et al 104 were 8% and 23% for 177 Lu and 153 Sm, respectively, whereas MC differences with Amato et al 111 were only 4% and 6%, respectively. 35
58 Similar levels of agreement were found for 90 Y, 131 I, 153 Sm, 177 Lu, and 99m Tc in soft tissue, bone, and lung. a) b) c) d) Figure 6. Differences between DOSXYZnrc MC (this work) and published data in soft tissue. Radial plots of a) voxel-s-values for 131 I, b) %difference of MC vs published data for 131 I, c) voxel-s-values for 153 Sm, and d) %difference of MC vs published data for 153 Sm. 36
59 Soft Tissue Bone MC vs Lanconelli et al 104 MC vs Amato et al 111 MC vs Bolch et al 15 MC vs Lanconelli et al 104 ijk 90 Y I Lu NA NA NA Sm NA NA NA m Tc 000 NA NA 001 NA NA 011 NA NA Table 2. Percent difference values for our DOSXYZnrc MC versus published data for 3 mm voxel-s-values in soft tissue. The percent difference in 000 is within 4.3% for 90 Y, 131 I, and 99m Tc indicating excellent agreement. For 000 differences >8% occur when compared with Lanconelli et al for 177 Lu and 153 Sm; both radionuclides have significant auger and conversion electron contributions to the source voxel. NA indicates the published data did not contain published voxel-s-values for the given radionuclide. 37
60 ATTILA Voxel-S-Value Simulations Sensitivity Results Figure 7 illustrates convergence of the GBBS voxel-s-values for a 1 MeV electron source as the space (M 0, M 1, M 2 ), energy (E 0, E 1, E 2 ), angle (S 4, S 8, S 16 ), and scattering source expansion (P 0 to P 6 ) was refined. The effect of the angular discretization was apparent at larger radii with increased angular quadrature order leading to reduced spreading (Figure 7a). Negative fluxes were occasionally returned by the coarsest discretization which resulted in negative voxel-s-values; negative values are an indication that the phase-space variables have not been refined enough. A few negative values still existed with the intermediate discretization, but the negative values disappeared for the finest discretization. Effects of the mesh, energy and scatter source expansion discretizations for S 16 were observed as changes in the source voxel-s-value for 1 MeV electron (Figure 7c and Figure 7d). Increasing the energy group discretization (Figure 7c and Figure 7d) did affect the solution, but given P 3 or higher then the difference between E 1 and E 2 was 0.5%; the difference between E 0 and E 1 given P 3 or higher was 2%. The spatial discretization differences between M 1 and M 2 were less than 0.1%. However, differences between M 1 and M 0 ranged from 4.5% for P 0 to 1.5% for P 3 and higher (Figure 7c and Figure 7d). 38
 log scale and b) linear scale near the source to")
61 a) b) c) d) Figure 7. Illustration showing convergence through refinement of phase space variables for mono-energetic 1 MeV electron voxel-s-values in soft tissue on a) log scale and b) linear scale near the source to show changes in source voxel, where red = finest, green = intermediate, orange = coarsest, and MC = black line. The values around 10-8 in (a) were originally negative values, but have been set positive for display. Convergence as a function of scatter source expansion P N for the 1 MeV electron source voxel-s-value (square = M 2, triangle = M 1, circle = M 0, red = E 2, green =E 1, orange = E 0 ) is shown in c) with a zoomed view in d). In (d) notice that moving from M 1 to M 2 makes little difference (<<1%), moving from 39
62 5 to 6 in P N makes little difference (<<1%) for E 1 and E 2, and moving from E 1 to E 2 results in about a 0.5% difference; this tells us that our GBBS solution, at least in the source voxel, is converged. For the finest discretizations, most GBBS absorbed doses in the source voxel changed by less than 1% compared with the next finest discretization along each phase-space variable; this indicated that our finest discretization was sufficiently refined. In the source voxel for all sources and materials investigated ΔM and ΔS ranged from to ΔE ranged from to 1.001; most ΔE were from to with worse values for photons in bone and for 100 kev photons in lung. ΔP ranged from to with the exception of 1 MeV photon in lung which was Comparison with DOSXYZnrc MC Qualitatively, the finest discretization of GBBS and MC in Figure 8 exhibited good agreement. The agreement worsened at larger radii, most likely due to ray effects that are known to exist with GBBS methods 12. However, it should be noted that these effects can be overcome through the use of a first scattered distributed source calculation or further increasing the number of angles, 13,133 but this was not performed in the current study. There was an incorrect artificial dip in the GBBS voxel-s-values for 1 MeV mono-energetic electrons near the end of the electron range in lung (Figure 8e); this occurred because the solution was changing too quickly at that spatial location. The dip became wider and deeper (including negative values) for the next coarsest mesh with 40


63 other phase-space variables held constant. Thus, we expect further mesh refinement to resolve this dip. 41
64 Figure 8. Comparison of GBBS finest discretization (M 2 E 2 P 6 S 16 ) voxel-s-values with MC for electron sources (a,c,e) and photon sources (b,d,f) in soft tissue (a,b), bone (c,d) and lung (e,f). MC solutions are lines and GBBS solutions are symbols (1 MeV = red circles, 0.1 MeV = green diamonds, 0.01 MeV = purple squares, 90 Y = orange pentagons, 131 I augeric + IC electrons = blue triangles with dashed MC line, 131 I beta or gamma +x-rays = blue X s) Figure 9 illustrates quantitative differences between GBBS and our DOSXYZnrc MC by plotting local percent differences for the finest GBBS calculations assuming MC as the truth. The overall trend is for the GBBS to produce absorbed doses 7-15% less than MC. In general, the agreement with photon sources is better than electron sources. For electron sources, larger differences (>20%) are seen near the end of the beta range for 90 Y in soft tissue and bone, and for both auger + IC electrons and betas for 131 I in lung. The 10 kev sources show the largest percent differences, but the MC uncertainty at 4.42 mm (011) and beyond for 10 kev electrons was 10%. The magnitude of differences also tends to increase as the radius increases. Table 3 supplements Figure 9 by listing GBBS percent differences from MC for the source voxel in soft tissue, bone, and lung for the coarsest (M 0 E 0 P 0 S 4 ) and finest (M 2 E 2 P 6 S 16 ) discretizations. At lower energies ( 100 kev), the difference between using the coarsest and finest discretization had little effect on the source voxel absorbed dose. The local percent differences show that the converged GBBS consistently underestimates MC in the source voxel; the bias is approximately -7% for 42
65 1.0 MeV photons & electrons and worsens to approximately -15% for 10 kev photons & electrons across all materials studied. In addition to absorbed dose values, for the photon sources, Table 3 lists GBBS KERMA and its percent difference from MC absorbed dose. The GBBS KERMA calculations exhibited much better agreement with MC absorbed doses than the GBBS absorbed doses for the 100 kev (0.3% vs -9.9%)and 10 kev (-1.4% vs -15.3%) photon sources in soft tissue. For low energy photon sources (0.1 MeV, 0.01 MeV), the GBBS agreement with MC absorbed dose in the source voxel was improved to be within 3.5% when using KERMA reaction rate instead of the absorbed dose from the energy deposition reaction rate. Table 4 lists GBBS percent differences from MC for voxel-s-values near the source (000,001,011) in soft tissue for the mono-energetic electrons and photons. Table 4 also lists differences reported by Pacilio et al 103 between modern radiation transport codes. In the source voxel, the magnitude of differences we report for the GBBS are slightly larger in magnitude than those reported by Pacilio. For 1 MeV electrons and photons, the magnitude of GBBS percent differences reported in 001 and 011 are comparable to the percent differences reported by Pacilio et al. For the 100 kev electrons, the magnitude of GBBS percent differences is much improved while the 100 kev photons have slightly worse agreement with the differences reported by Pacilio et al in modern radiation transport codes Geant4 and MCNP4C. The GBBS percent differences from MC and published data for 90 Y and the full 131 I spectra by summing the 3 simulated components (beta + auger & IC electrons + 43
66 gamma & x-rays) are listed in Table 5. The coarse GBBS 90 Y calculation was within 6.5% for 000, 001, and 011, while the finest GBBS 90 Y calculation was within 9.5% of all published and MC data. Excluding Bolch et al, the coarsest and finest GBBS 131 I were within 7.1% and 6.0%, respectively, of published and MC data for 000, 001, and 011. To provide additional context for differences from the GBBS, the differences between published values and MC can be calculated from Table 5. The spread in MC and published values was 4% for 90 Y in 000, 001, and 011. For 131 I, the spread in MC and published values was 2%, 15%, and 25% for 000,001, and 011, respectively. Excluding Bolch et al, the spread in 131 I published and MC data was 2%, 2%, and 7% for 000,001, and 011, respectively. 44
67 Figure 9. GBBS vs MC % differences for the finest (M 2 E 2 P 6 S 16 ) GBBS voxel-svalues for electron sources (a,c,e) and photon sources (b,d,f) in soft tissue (a,b), bone (c,d) and lung (e,f). 1 MeV = red circles, 0.1 MeV = green diamonds,
68 MeV = purple squares, 90 Y = orange pentagons, and 131 I = blue. Blue triangles are the 131 I auger + IC electron component and blue x s are used for the 131 I beta and gamma+xray component. 46
69 MC (mgy/mbq-s) Soft Tissue photons electrons discrete Coarsest GBBS (mgy/mbq-s) β Coarsest GBBS vs MC (%) (KERMA) Finest GBBS (mgy/mbq-s) Finest GBBS vs MC (%) 1.0 MeV MeV MeV I Y I MeV MeV MeV I MeV NA MeV NA MeV NA I NA electrons discrete β 1.0 MeV MeV MeV I Y I Bone photons (KERMA) 1.0 MeV MeV MeV NA NA I MeV NA MeV NA MeV NA NA NA I NA Lung electrons discrete β 1.0 MeV MeV MeV I Y
70 photons (KERMA) 131 I MeV MeV MeV I MeV NA MeV NA MeV NA I NA Table 3. Absorbed dose values by emission type (discrete electrons (monoenergetics, auger + IC, continuous electron (beta), discrete photons) in the source voxel (000) for MC and GBBS for the coarsest (M 0 E 0 P 0 S 4 ) and finest (M 2 E 2 P 6 S 16 ) discretizations. MC absorbed dose is taken as the truth in the percent difference comparisons. The table also includes GBBS approximated absorbed dose for photon sources via KERMA cross sections. Comparisons were not performed for the coarse GBBS 10 kev photon because the solution did not converge. 48
71 Electrons Photons Energy (MeV) MC σ (%) Coarse GBBS vs MC (%) Fine GBBS vs MC (%) Geant4 vs MC* (%) MCNP4C vs MC* (%) ijk < < < < < < NA NA NA NA NA NA < < < < < < < NA NA 001 < NA NA 011 < NA NA *Values estimated from Pacilio et al Figures 3a and Figure 3b. NA values were not calculated by Pacilio et al. Table 4. Summary of differences between GBBS and MC absorbed doses near the source voxel for mono-energetic electron and photon sources. For reference, we also list differences for Geant4 vs MC and MCNP4C vs MC taken from Pacilio et al. 49
72 Coarsest GBBS Finest GBBS vs Lanconelli et al 104 vs Amato et al 111 vs Bolch et al 15 vs MC ijk 90 Y I Table 5. Percent differences for the coarsest and finest GBBS voxel-s-values (000, 001, and 011) relative to published data for the full radionuclide spectra (beta + auger & IC electrons + gamma & x-rays) and our DOSXYZnrc MC. vs Lanconelli et al 104 vs Amato et al 111 vs Bolch et al 15 vs MC ATTILA and MC Interface Simulations The MC and finest GBBS absorbed doses to voxels in both planes along the interface were in good qualitative agreement (Figure 10 and Figure 11). The artifact previously explained for 1MeV electrons in uniform material is also seen in Figure 10. Local percent differences in Figure 12 and Figure 13 show that differences at the interface were similar to differences observed in the uniform material simulations. The differences are quantified near the source in Table 6, which are similar to the differences reported for uniform material. 50

. a) L_S electrons. b) L_S photons.")

73 Figure 10. Lung-soft tissue interface planes showing finest discretized GBBS (circles or triangles) with MC (lines). a) L_S electrons. b) L_S photons. c) S_L electrons. d) S_L photons. Left of the dashed line indicates the source plane (z = 0) and right of the line indicates (z = +1). Legend identical to Figure 8. 51

 S_B photons.")
74 Figure 11. Bone-soft tissue interface planes showing finest discretized GBBS (circles or triangles) with MC (lines). a) B_S electrons. b) B_S photons. c) S_B electrons. d) S_B photons. Left of the dashed line indicates the source plane (z = 0) and right of the line indicates (z = +1). Legend identical to Figure 8. 52
75 Figure 12. Lung-soft tissue interface planes showing percent difference for each plane. a) L_S electrons. b) L_S photons. c) S_L electrons. d) S_L photons. Left of the dashed line indicates the source plane (z = 0) and right of the line indicates (z = +1). Legend identical to Figure 8 with1 MeV = red, 0.1 MeV = green, 0.01 MeV = purple, 90 Y = orange, and 131 I = blue. Triangles and dashed line represent the 131 I auger + IC electrons. 53
76 Figure 13. Bone-soft tissue interface planes showing percent difference for each plane. a) B_S electrons. b) B_S photons. c) S_B electrons. d) S_B photons. Left of the dashed line indicates the source plane (z = 0) and right of the line indicates (z = +1). Legend identical to Figure 8 with1 MeV = red, 0.1 MeV = green, 0.01 MeV = purple, 90 Y = orange, and 131 I = blue. Triangles and dashed line represent the 131 I auger + IC electrons. 54
77 GBBS vs MC (%) Electrons Photons Continuous Discrete ijk L_S S_L B_S S_B 1 MeV * * MeV * * MeV * * I * * I * * Y * * MeV * * MeV * *
78 0.01 MeV * * I * * Table 6. GBBS absorbed dose percent differences from MC by emission type (discrete-energy electrons (mono-energetics, auger + IC), continuous-energy electron (beta), discrete-energy photons) near the source voxel in the source material (000,001,011) and across the interface in the other material (001*,011*) Discussion To benchmark our MC models, we first compared our DOSXYZnrc MC voxel-svalues with published data generated using DOSXYZnrc, Geant4, and EGS4. Pacilio et al 103 characterized differences of a few percent (-3.5% to +4%) for mono-energetic electrons and differences up to 7% for mono-energetic photons in a 3 mm source voxel. In general, our comparisons agreed with Pacilio et al, but we did note discrepancies between our data and Lanconelli et al for radionuclides with nonnegligible auger or internal conversion electron emissions ( 153 Sm, 177 Lu). This was surprising because both used DOSXYZnrc. A possible explanation for the difference is that Lanconelli et al may not have included the auger and conversion electron component in their voxel-s-values. This reasoning is supported by the fact that our differences in the source voxel are approximately the percentage contribution of auger 56
79 and internal conversion electrons to the beta + auger + IC energy released per disintegration. From RADTABS, values for the 153 Sm ( 177 Lu, 131 I, 90 Y) average energy per disintegration released by betas and auger plus conversion electrons were (133.3, 181.9, 933.0) kev and 46.3 (14.7, 10.0, 0.2) kev, respectively. Assuming all electron energy is deposited locally and all x-rays and gammas escape, then the auger and internal conversion electrons contribute 17% (46.3/( )) for 153 Sm, 10% for 177 Lu, 5% for 131 I, and 0% for 90 Y. Applying this correction to the source voxel would improve agreement to within 5%. For voxel-s-values, the range of absorbed doses can span several orders of magnitude over a few millimeters. Our percent difference figures show large differences, but these are very similar in magnitude to the differences encountered by several publications comparing absorbed dose calculations 103,111,135 Previous work in external beam and sealed source brachytherapy has found minimal differences between ATTILA and other transport codes. Gifford et al 12 scored photon KERMA in a plane around an ovoid containing a 137 Cs source and found differences between ATTILA and MCNPX to be on the order of 2-5%. The same study compared ATTILA with EGS4 for an 18 MV percent depth dose curve in a heterogeneous phantom and found the largest difference was ATTILA overestimating the EGS4 values by only 2.2%. An additional study by Gifford et al 13 compared ATTILA with MCNPX photon KERMA around an 192 Ir source and found 98% of voxels to be within 5% of MCNPX, although there were localized differences of -7% beyond the source tip and differences over +5% near the source shown graphically. Vassiliev et 57
80 al 14 compared ATTILA with EGSnrc for clinical patient cases treated with 6 MV photon beams and reported >98% of voxels had passing gamma indices 110 for 3%/3 mm. Previous publications with the GBBS focused on external beam and high energy sealed source brachytherapy. In this work, we found that differences exist between MC and GBBS in the nuclear medicine energy regime. Gifford et al 12 suggested that differences in cross sections used by the GBBS and MC over the energy range of interest in external beam and high energy brachytherapy were minimal. Our results suggest that the differences in cross sections become noticeable at lower electron energies including the nuclear medicine energy regime. We hypothesize that these differences manifest in the energy reaction rate cross sections, which are used to convert the local electron spectra to absorbed dose, calculated by ZERKON/CEPXS. Comparing both KERMA and absorbed dose GBBS calculations with MC absorbed doses for low energy photon sources (0.1 MeV, 0.01 MeV) (where KERMA is a good approximation to dose) showed that the KERMA reaction rate agreed within 3.3% for the MC absorbed dose, but the GBBS absorbed doses, using the energy reaction rate cross section, produced lower absorbed doses with larger magnitude differences. To determine whether the differences in absorbed dose were from transport or the energy reaction rate cross sections, we ran ATTILA simulations with electron transport energy cutoff > max energy in the problem (i.e., no transport performed) for mono-energetic electrons of 1 MeV, 0.1 MeV, and 0.01 MeV; for these simulations we expected the energy deposited in the source voxel to equal the mono-energetic electron energy. However, the observed differences without transport were -6.5%, -7.5%, and -13.5% for 1 MeV, 0.1 MeV, and 0.01 MeV, 58
81 respectively. The differences persisted without transport, providing additional evidence that the energy reaction rate cross sections may be the reason for differences, but further investigation is required to reconcile the differences. Convergence and bias are two separate, but related phenomena. A process can converge and still have bias. Bias implies that the process converged to a different value from the truth. For example, having differences in cross sections will lead to such biases for both deterministic and stochastic transport codes. At such low energies and at such small scales it is difficult to have an absolute truth. Given EGSnrc s extensive benchmarking and reputation for accurate condensed history electron transport, we chose it as the standard, but differences will still exist among modern radiation transport codes 103,105,136. Similar to MC, convergence with the GBBS is not constant throughout space. GBBS absorbed doses converge faster closer to the source as can be seen in Figure 7a and Table 3 where there is little change between the coarsest and finest discretizations this change decreases further at lower energies. Taking MC as the truth, GBBS biases increase in magnitude in the source voxel at lower energies. To achieve an identical level of convergence as the source voxel in a voxel far away from the source, MC requires the simulation of many more source particles to achieve similar convergence. Similarly, the GBBS requires additional angular discretization or a first-scattered distributed source with ray-tracing to achieve convergence. When moving to patient-specific calculations, the discretization at distance, and corresponding ray effects, will be less important because the source will be distributed spatially and the absorbed dose in a voxel will be dominated by the local activity. 59
82 Yoriyaz et al 105 investigated absorbed dose fractions for spheres of material and found maximum differences between MCNP and GEANT4 to be 5% for photons and 10% for electrons their geometry is approximately equivalent to the source voxel in this work. Our GBBS results in the source voxel, for the full 90 Y and 131 I spectra listed in Table 5, are similar to the differences they reported. Pacilio et al 103 estimated differences on the order of 5% in the source voxel and much larger in surrounding voxels. It is important to note that the uncertainties in cross sections increase at lower energies, so different models can give quite different results. The magnitude can seem alarming to those with backgrounds in radiation oncology transport for megavoltage photon beams, but one has to interpret these differences in the proper context, which we have tried to provide by reporting differences between other modern radiation transport codes in the nuclear medicine energy regime. Voxel-S-values are typically calculated once and then used in a convolution. As such, these are reference values and their computation time is irrelevant. We calculated voxel-s-values with GBBS because voxel-s-values are widely understood in the nuclear medicine community and the results are often tabulated, which enables quantitative comparisons. We want to emphasize that the purpose of this work was to perform a low-level benchmark of the GBBS against MC in the therapeutic nuclear medicine energy regime. We have previously shown clinically feasible calculation times with adaptive tetrahedral meshing on patient scans 137, but this is a separate issue and will be addressed Chapter 3. We are of the opinion that matching voxel boundaries by forcing at least 6 tetrahedrons per voxel is not an efficient use of tetrahedrons. This was done to ensure the benchmarking elucidated differences underlying the transport 60
83 and cross-sections used in the GBBS and not differences due to mismatched source and scoring geometries. The purpose of this chapter was to benchmark the GBBS against MC using voxel-s-values. It should be noted that by matching the voxel boundaries, the GBBS calculates absorbed dose at a level finer than the voxel in addition to the linear variation across a tetrahedron there exist multiple tetrahedrons (>= 6) in each voxel. This allows one to investigate the spatial distribution within each voxel. We did not investigate intra-voxel distributions here, but want to point out that the additional runtime incurred by finer meshes delivers additional information not found in the MC simulations. Similarly, intra-voxel information could be obtained with MC by decreasing the scoring voxel sizes at the expense of calculation time and memory requirements. We found only one study 104 in the literature that provided tabulated voxel-svalues in a material other than soft tissue. As nuclear medicine continues to adopt voxel-level dosimetry, the use of multiple material-based kernels may provide a reasonable intermediate step towards full-transport solutions; this could have an immediate impact on 90 Y microsphere therapy or 131 I therapy of metastatic lung nodules, where lung and liver or lung and tumor are, respectively, the regions of interest. Such kernels may also be important for bone-seeking radiopharmaceuticals with bone and soft tissue interfaces. Believing that differences in material and density will play a role moving forward we compared the GBBS with MC at multiple interfaces (lung soft tissue, soft tissue lung, bone soft tissue, soft tissue bone) to capture the aforementioned clinical uses. In addition, we supplied tabulated mono-energetics (10 kev, 100 kev, 1 MeV) and individual components (auger + IC, beta, x-ray + 61
84 gammas) of 153 Sm, 131 I, 177 Lu, and 99m Tc for MC, adding to the tabulated data available to researchers. One strength of our study is that we matched scoring geometry between transport codes. This was essential for evaluating voxel-s-values for nuclear medicine sources where the absorbed dose gradients are very large; previous studies of the GBBS did not follow such a methodology. Furthermore, we ensured the source voxel was sufficiently converged by comparing multiple phase-space variable discretizations. An important distinction of this work relevant to nuclear medicine is that previous studies exclusively used photon sources with either KERMA reaction rates for sealed sources or energy deposition reaction rates for megavoltage photon beams with partialcoupling (photons electrons), but in this work we investigated both electron and photon sources with full-coupling. In this work, we made sure to sufficiently capture source spectral shapes and significant discrete radiations through the energy group discretizations. It should be noted that previous studies of GBBS for radiotherapy used much coarser energy group structures then we did and reported excellent agreement. This suggests that optimization of group structure (minimizing number of energy groups) may lead to good agreement with MC, but it is unclear if such solutions will be converged in the energy discretization variable. It may also be possible to combine all the sources (gamma + x- ray, beta, auger + IC electrons) into a single source for use with the GBBS when simulations are performed with full-coupling. This would be accomplished by mapping the corresponding emission to the correct energy group and applying normalization factors to account for branching ratios. 62
85 The purpose of this work was not to report on speed, but one potential advantage of the GBBS in radiation oncology is its speed and accuracy. Providing voxel-level absorbed dose maps from nuclear medicine tomographic scans in a timely matter will help the adoption of voxel-level dosimetry for nuclear medicine departments. Our GBBS calculation times on a 24-core (two 12-core AMD 6174) machine ranged from 2 minutes for the coarsest discretizations to 20 minutes for the intermediate discretizations, and up to a few days for the finest. The coarsest calculations required a couple gigabytes of RAM whereas the finest required around 60 GB of RAM. A modern deterministic code such as ATTILA has several adaptable (space & energy) options for controlling levels of discretization. Nuclear medicine absorbed dose calculations depend on radionuclide spectra and spatial distributions of activity, material, and density. An advantage of ATTILA is its use of an unstructured tetrahedral mesh. However, in this work the advantage of accurately approximating general geometries through unstructured tetrahedral meshing was negated; we forced tetrahedrons to not cross voxel boundaries to avoid geometric source specification errors and absorbed dose scoring errors when comparing with MC. Future work should investigate relaxing the voxel-matching tetrahedral mesh generation used in this work. Resolving the activity, material, and density in space through adaptive tetrahedral meshing will be a necessary step for using ATTILA on patient data sets. 63
86 2.5. Conclusion We calculated MC voxel-s-values in soft tissue, lung, and bone for 1) monoenergetic electrons and photons and 2) individual radionuclide components (beta, auger + IC, gamma + x-ray) for 99m Tc, 131 I, 177 Lu, 153 Sm, and 90 Y. When evaluating voxel-s-values, it is important to test radionuclides that have significant contributions from all possible emissions (e.g. 90 Y and 131 I have negligible to small auger + IC electron yields, but 177 Lu and 153 Sm have significant auger+ic electron yields). A GBBS has been benchmarked against MC in the nuclear medicine regime and has been shown to be suitable for absorbed dose calculations. Unlike previous dosimetry studies with the GBBS we 1) removed geometrical errors by decomposing voxels into tetrahedrons, which was necessary due to the large dose gradients in nuclear medicine and 2) investigated both electron and photon sources with fullcoupling. The results of this study lead naturally to several additional areas of investigation, including the use of GBBS for patient-specific absorbed doses from unsealed sources. Investigation of GBBS computation time is also warranted and can include studies of 1) relaxing the tetrahedral mesh to not match voxels exactly; 2) coarsening energy group structures for each radionuclide; 3) setting energy group dependent SN and PN; and 4) combining all of the auger + IC electrons, betas, and gamma + x-ray emissions into a single fully-coupled source. 64
87 Chapter 3: Feasibility of fast and accurate GBBS calculations on clinical data through adaptive tetrahedral meshing of emission and transmission images 3.1 Introduction Voxel-level absorbed dose calculations in nuclear medicine have been around for decades, but their use has primarily been in retrospective research studies 15,42,43,65, ,124. Emission image quality continues to improve with better sensitivity and spatial resolution due to hardware and reconstruction algorithms. The advancements in targeted pharmaceutical development and radiopharmaceuticals are occurring in parallel to the improvements in image quality. Voxel-level dosimetry is not used clinically at most institutions. Instead, the standard of practice S-values based on reference human stylized phantoms are typically used. The S-values are more relevant for radiation protection and have known limitations including 1) assuming a uniform distribution of activity throughout an organ; 2) geometry not accurately representing the patient; and 3) an overly simplistic tumor model consisting of a sphere that does not contribute/receive energy to/from other organs. There has been active development of more sophisticated anthropomorophic phantoms, but these are again for population based protection or diagnostic studies. Consequently, there is a need for patient-specific voxel-level absorbed dose calculations in the clinic. Although Monte Carlo (MC) 138 and convolution methods (voxel-s-values or dose point kernels) 15 are prevalent in the nuclear medicine literature for voxel-level absorbed 65
88 doses, other methods exist. Sanchez-Garcia has recently implemented collapsed-cone calculations, common in external beam, for unsealed sources 60,61. The use of complete local absorption has also been used for pure beta emitters such as 90 Y 122,123,139. In Chapter 2 we performed a low-level evaluation of the deterministic grid-based Boltzmann solver (GBBS) ATTILA (Varian Medical Systems, Palo Alto, CA) showing that it can be used for voxel-level absorbed doses. However, this was a low-level study that only investigated two simple sources and scoring geometries: a voxel source in uniform media and a single source voxel at an interface of two media. The GBBS spatial discretization requires an unstructured tetrahedral mesh, but most medical images consist of structured hexahedral meshes (i.e. voxels). In the previous study we ensured 1) that GBBS geometry matched voxel geometry by not allowing tetrahedrons to cross voxel boundaries; and 2) that the solution was converged due to discretization parameters (space, angle, energy) in and around the source voxel. The GBBS was not designed for use with the structured hexahedral meshes common to medical imaging; forcing at least 6 tetrahedrons per voxel to avoid geometric differences in radiation transport between MC and GBBS is neither feasible nor efficient on patient scans. The objective of this work is to show that fast and accurate absorbed dose calculations are possible with the GBBS for patient-specific nuclear medicine dosimetry at the voxel-level. We accomplish this by 1) calculating our gold standard MC absorbed dose in each voxel from the SPECT/CT; 2) generating an adaptive tetrahedral mesh based on the SPECT/CT voxel geometry; 3) calculating absorbed 66
89 dose with the GBBS based on the adaptive mesh; and 4) comparing GBBS absorbed doses with MC absorbed doses. 3.2 Methods and Materials Patient Data Using UT MD Anderson Cancer Center Institutional Review Board protocol DR , we retrospectively selected a post-therapy 90 Y bremsstrahlung SPECT/CT for a patient treated with glass microspheres at our institution. Uptake is exhibited primarily in the liver, and tumor and normal liver were the volumes of interest (VOI). A pre-therapy Na 131 ISPECT/CT for a patient treated with Na 131 I was also selected from our clinical database. Uptake was seen in metastatic tumors in the lung; both lungs and the tumors were VOIs DOSXYZnrc Monte Carlo (MC) The EGSnrc 128 (v ) user code DOSXYZnrc 127 was used as the MC gold standard for comparisons with the GBBS code. EGSnrc is a general purpose radiation transport code with improved low energy support compared with EGS4, 129 and DOSXYZnrc allows scoring in voxel geometry Transport Parameters All electrons and photons were tracked down to kinetic energies of 1 kev. The simulation parameters were set to all the advanced options including bound Compton scattering, Rayleigh scattering, atomic relaxations, electron impact ionization, XCOM photon cross sections 132, spin effects, exact boundary crossing, and PRESTA-II 128,
90 Sources and Spectra The 90 Y and 131 I radionuclide spectra were obtained from RADTABS software. 130 The simulated auger component was the collapsed auger electrons listed in the *.RAD file output by RADTABS. We did not simulate the gamma and x-ray emissions or auger and conversion electrons for 90 Y because their contributions are negligible for dosimetry. The sources were decomposed into the following components: 1) discrete gamma + x-ray, 2) continuous beta, and 3) discrete auger + conversion electrons. A single MC simulation was performed for each component. The individual MC simulations were performed using 1E+09 source particles. The total absorbed dose was calculated by weighting the individual components by their respective branching ratios Mapping of CT to Density and Material CT numbers were mapped to mass density based on a matched peak energy (130 kvp) CT scan of a CIRS material phantom. The mapped density was used directly in the MC simulation. Material was determined by mapping the density to one of four materials: air 140 (0.001 to g/cc), lung 100 (0.130 to g/cc), soft tissue 131 (0.605 to g/cc), and cortical bone 100 ( >1.101 g/cc) GBBS ATTILA ATTILA (version 8.0.0) was the GBBS used in this work. ATTILA has been used to calculate absorbed doses from external megavoltage photon beams 12,14, as 68
91 well as high energy gamma emitting sealed sources ( 137 Cs, 192 Ir). 12,13 ATTILA discretizes space, angle, and energy to solve the linear Boltzmann Transport equation for photons and the linear Boltzmann-Fokker-Planck Transport equation for charged particles. It solves for the energy and angular dependent particle flux Ψ(r, E, Ω ) throughout space Adaptive Tetrahedral Mesh Generation An adaptive mesh must capture the source, material, and density distributions sufficiently to have minimal effect on the calculated absorbed dose. To meet this goal our mesh generation is based on both the emission and transmission image. The computer program TetGen (v1.5.0) 141,142 was used to generate tetrahedral meshes. TetGen has been used by one group to model brachytherapy applicators 143 from CAD, but in this work we used it to transform the SPECT/CT into a tetrahedral mesh. This was accomplished by defining a mesh-sizing function L(i, j, k) at each voxel centroid of the SPECT/CT. The mesh sizing function returns a target tetrahedral edge length, and these edge lengths are interrogated by TetGen during its internal mesh generation and optimization process. A mesh-sizing function was defined within a bounding box on the SPECT/CT. The bounding box was selected to encompass the entire patient body on CT. A fine background mesh with a node at every SPECT/CT voxel centroid was then created. The background mesh is not used in the GBBS calculation. It is a temporary construct that enables geometry matching when defining L(i, j, k) for use with TetGen. This 69
92 Fraction of Total Counts allows image processing on the SPECT and CT in voxel geometry to drive the tetrahedral mesh adaptation. Two mesh-sizing functions were derived from the input MC activity and material distributions, which were generated from the SPECT/CT. The first, L ACT (i, j, k), was derived directly from the activity distribution. Voxels with higher counts or activity are more important than lower ones. We plotted the normalized cumulative count histogram weighted by counts; this generates a monotonically increasing curve that is normalized to the total number of counts. For the initial definition, we then assigned bands (every 10%) of voxels from the cumulative distribution to target tetrahedral lengths ranging from 0.5 cm (highest activity voxels) to 8.0 cm for the (lowest activity voxels). Figure 14 shows a the normalized cumulative count histogram weighted by counts for the 90 Y SPECT used to assign L ACT (i, j, k). 70
93 Figure 14. Example illustration showing how L ACT (i, j, k) is determined from the input activity distribution. I use the fraction of total counts, not fraction of volume to determine thresholds for assigning tetrahedral edge lengths. 4 mm and 8 mm are not shown due to space constraints on the graph. The second mesh-sizing function was based on the material distribution from MC. First, L MAT (i, j, k) was set to an edge length based on the material. A pseudogradient magnitude, MAT(i, j, k), was calculated from the MC material distribution. This quantity was based on the 26 neighbors around a voxel; if a neighbor differed from the central voxel then a value of 1 was added to the pseudo-gradient magnitude. The corresponding magnitudes ranged from 0 to 26. The pseudo-gradient magnitude was used to define a multiplicative factor, α `MAT (i, j, k) to increase sampling at interfaces. The material specified edge length and multiplicative factor were used to define the CT based mesh-sizing function as L CT (i, j, k) = L MAT (i, j, k) α `MAT (i, j, k). The final mesh-sizing function input to TetGen was defined as L(i, j, k) = min (L ACT (i, j, k), L CT (i, j, k)). The output of TetGen was visually compared with the original SPECT/CT and manual adjustments were made to L ACT (i, j, k) to reduce the number of tetrahedra to approximately 70,000. Our previous low-level benchmarking showed run times of a few minutes with a similar number of tetrahedra, coarse energy group structure (30 e-, 30 photon), S 4, and P 0 scatter expansion. The final parameters used to determine the mesh sizing function are list in Table 7. The only difference between the two cases was in the L ACT (i, j, k). 71
94 Normalized Cumulative Activity Band (%) 90 Y LACT (i, j, k) (cm) 131 I LACT (i, j, k) (cm) MAT(i, j, k) L MAT (i, j, k) (cm) MAT(i, j, k) α `MAT (i, j, k) Air 8.0 < Lung Soft Tissue 2.0 > Bone Table 7. Parameters used in determining the final 90 Y and 131 I mesh-sizing functions Mapping of source, material, and density to the tetrahedral mesh After the mesh generation, each tetrahedron was assigned the counts (source), material, and density from the nearest voxel in the corresponding MC input distribution. The shortest distance between tetrahedron centroid and voxel centroid was used to determine the nearest voxel. The GBBS, in its current form, requires the user to explicitly list material-density pairs (e.g. (tissue,0.99), (tissue,1.00), (tissue,1.01), ). For 90 Y microspheres, minimal absorbed dose differences within the liver have been shown when using a nominal density 139,144. Thus we used a single nominal density for each material: air = g/cc, lung = 0.26 g/cc, soft tissue = 1.04 g/cc, and bone=1.85 g/cc. For the Na 131 I 72
95 SPECT/CT, densities were quantized at every 0.05 g/cc which lead to 42 unique material-density pairs. For each material-density pair, a region was defined in the GBBS that included the corresponding tetrahedra Cross Sections and Energy Groups ATTILA requires multi-group energy cross sections, which were generated using ZERKON (Varian Medical Systems, Palo Alto, CA), which is an extension of CEPXS. 68 CEPXS has been benchmarked against several other codes suggesting it sufficiently accounts for electron and photon interactions. 69 For cross section generation, fullcoupling was used for both photon and electron sources with a Legendre expansion of order 7. Cross sections were generated for air, soft tissue, lung, and bone matching the atomic composition used in the MC simulations. Cross section files were generated for each radionuclide emission component with approximately 30 energy groups for electrons and 30 energy groups for photons Transport parameters Three GBBS calculations were performed on the adaptive mesh for the 90 Y patient scan summarized in Table 8. Only the beta spectra of the 90 Y source was considered. The electron transport cut-off energy of 200 kev was the same for each 90 Y calculation. The first calculation ConvergenceWithBrem was run until the default stopping criterion of 10 4 was achieved. The stopping criteria is defined as the change in the scalar flux from the previous iteration normalized to the current iteration scalar flux, and the maximum value over all tetrahedrons is used in the evaluation of 73
96 convergence. The WithBrem calculation performs some photon transport, but not to convergence. Instead, we chose to terminate the simulation after two outer iterations. The NoBrem calculation only performs one single outer iteration. Calculation Name S N P N pcut (MeV) Outer iterations ConvergenceWithBrem WithBrem * NoBrem * * indicates early termination due to set number of outer iterations being exceeded Table 8. Summary of the different parameters used for the multiple 90 Y GBBS calculations. In practice, the number of outer iterations will be determined by convergence properties. In this work we forced early termination. The use of early termination means the GBBS did not converge according to its internal stopping criterion, but the convergence criterion may be too strict or rigorous and not a good surrogate for clinical accuracy requirements. It should be noted that early termination is routinely used in clinical practice when performing iterative reconstructions of emission images. Five GBBS calculations were performed for the 131 I patient scan. The electron transport cut energy was set 0.1 MeV and the scatter expansion was isotropic P 0 for all 131 I GBBS simulations. They are listed in Table 9. The Auger+IC calculation was the auger and internal conversion electron component of the 131 I decay, while the Beta calculation was for the beta component. Multiple angular quadrature orders were investigated for the gamma + x-ray component. 74
97 Calculation Name S N pcut (MeV) Outer iterations Auger+IC Beta Gamma+xray Gamma+xray Gamma+xray Table 9. Summary of the different parameters used for the multiple 131 I GBBS calculations Post-processing to calculate absorbed doses for comparison with MC During post-processing ATTILA computes the energy dependent scalar flux, Φ(r, E), from Ψ(r, E, Ω ). The GBBS employs a linear discontinuous finite element method for spatial discretization. Consequently, the solution varies linearly across a tetrahedron. To make voxel-level comparisons with MC, the GBBS must calculate an effective voxel dose. This was accomplished by reporting absorbed doses at the centroids specified by the voxels. Absorbed dose point edits in the GBBS calculate the energy reaction rate at the point in space and then divide the energy deposited by the mass in a 1 cc sphere with density defined by the tetrahedron in which the point lays. Further details of calculating reaction rates as post-processing steps are not replicated here because they have been listed and described in previous publications
98 3.2.5 Analysis Adaptive tetrahedral meshes were displayed in Paraview 145 and compared to the corresponding SPECT/CT slice. The percent difference in mean absorbed dose between GBBS and MC was recorded for all VOIs. A line profile was drawn on an axial slice through the tumor for the 90 Y case and both MC and GBBS dose profiles were plotted. Qualitative visual comparisons were performed for dose volume histograms. The GBBS and MC coronal 131 I absorbed dose distributions were inspected for notable differences. Finally, the wall clock time for the GBBS transport was recorded for both patient scans. 3.3 Results Y Tetrahedral Mesh Figure 15 shows the 90 Y SPECT/CT compared with the adaptive tetrahedral mesh. The mesh contained 67,000 tetrahedra and the adaptation performed as expected. The tumor with high uptake has increased sampling. Tetrahedra are larger in air, and the interfaces are reasonably represented as shown by the lung soft tissue interfaces, ribs, and spine. 76


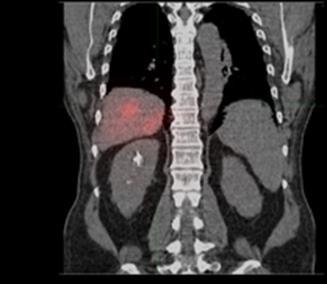


99 Tetrahedra Activity SPECT/CT Tetrahedra Material 77
100 Figure 15. Sample axial and coronal planes of the adaptive tetrahedral mesh (a,c,d,b) compared with SPECT/CT (b,e) for the 90 Y microsphere patient. The material mapping (a,d) and activity mapping (c,f) have good qualitative agreement. Material colors blue, cyan, beige, and red were representative of air, lung, soft tissue, and bone, respectively. The tetrahedral activity mapping is displayed on a log scale. The dashed line in (b) is plotted as a dose profile in Figure 16b Y GBBS calculations and comparison with MC The multiple GBBS calculations yielded results similar to MC, but some GBBS calcuations took substantially longer than the fastest ones. The NoBrem transport was fastest and only took 34 seconds whereas the ConvergenceWithBrem took 165 seconds. Results from the NoBrem are shown in the remainder of the manuscript. Excellent agreement was found between the GBBS and MC as demonstrated by the dose volume histogram (DVH) and line profile comparison in Figure 16. In addition, the differences between GBBS and MC for mean absorbed dose to VOIs are within 3.5% as shown in Table
101 Figure 16. Dose volume histograms for the 90 Y patient (a) showing excellent agreement between MC and the GBBS ATTILA in the tumor and normal liver. A dose line profile (b) also shows excellent agreement of the GBBS with MC across the tumor. 79
102 VOI Mean absorbed dose percent difference. (100*(GBBS-MC)/MC) Tumor 1.0 Liver -0.6 Right Lung -1.0 Left Lung 3.4 Table 10. Summary of percent differences between GBBS and MC for 90 Y patient tumor and normal tissue VOIs I Tetrahedral Mesh Figure 17 shows that the 131 I tetrahedral mesh had good agreement with the SPECT/CT. The mesh contained 69,000 tetrahedra. Tumor nodules in both lungs had increased sampling with smaller tetrahedra, and the lung-soft tissue interfaces and bone were well resolved. 80


103 Tetrahedra Material SPECT/CT 81
104 Figure 17. Coronal plane comparing the 131 I tetrahedral mesh with the SPECT/CT. The material color definitions are the same as those used in Figure I GBBS calculations and comparison with MC The Auger+IC and Beta calculations each took 2 minutes for transport. The three gamma+xray calculations took 5, 10, and 30 minutes with longer run times for larger S N. All subsequent 131 I GBBS analysis was performed using the total absorbed dose by combing the Auger+IC, Beta, and gamma+xray4 calculations. Mean absorbed doses to VOIs were within 4.5% of MC (Table 11), and the GBBS dose volume histograms matched MC well, but they were slightly lower (Figure 18). The GBBS being slightly lower is consistent with the results from our previous benchmarking in Chapter 2. 82
105 VOI Mean absorbed dose percent difference. (100*(GBBS-MC)/MC) Tumor Tumor Right Lung -2.6 Left Lung -2.3 Table 11. Summary of percent differences between GBBS and MC for 131 I patient tumor and normal lung VOIs. Figure 18. MC (solid) curves are slightly higher than the GBBS (dashed) DVH curves for the 131 I patient tumor and normal lung VOIs. 83

106 Differences between GBBS and MC are noted in the coronal plane shown in Figure 19. The GBBS absorbed dose matches MC well near and around the tumors, but differences < 25 Gy do exist just outside the patient body. These differences seen lateral to the spleen and liver and on either side of the neck are likely due to a combination of differences in material assignment just outside the patient and ray effects. They have no clinical importance, and could be simply removed by masking absorbed doses to exist only within the patient s body. Figure 19. Qualitative visual comparison of GBBS (a) and MC (b) absorbed dose distribution for 131 I in the coronal plane through tumors and lungs. 84
107 3.4 Discussion When relaxing the tetrahedral meshing from the exact matching of voxel geometry, the GBBS can be used to generate fast and accurate absorbed doses for targeted radionuclide therapies. GBBS DVHs were virtually indistinguishable from MC DVHs for both the 90 Y and 131 I patient scans. The percent differences of GBBS from MC for mean absorbed doses of organs and tumors were also within a few percent. This is not entirely surprising given that we previously found good agreement for 90 Y and 131 I. A unique contribution of this work lies in its approach to adaptive tetrahedral mesh generation using a patient s emission (SPECT or PET) and transmission (CT) images. The adaptive mesh generation was performed to create a spatial discretization used by the GBBS that enabled fast and accurate absorbed dose calculations. Although a more rigorous and in-depth optimization can be performed, we believe this to be a good starting point that produces excellent quantitative comparisons with MC. In addition, others interested in radiation transport of unsealed sources in patients will likely find our adaptive tetrahedral mesh approach useful because both Geant4 and MCNP have recently implemented support for unstructured tetrahedral meshes. Our approach for adaptive meshing needs to be further investigated for automation and robustness. In this work, we customized the activity mapping for both the 90 Y and 131 I patient scans. As such, the current method is not automatic and requires some manual intervention. Nevertheless, we have shown in this work that it is possible to generate fast and accurate, relative to MC, GBBS absorbed doses. 85
108 Activity, material, and density distributions drove the mesh generation in this work. However, there is additional information that could be incorporated into the mesh generation including 1) gradients from the SPECT; 2) error metrics from the GBBS when performing iterative refinement; and 3) pre-segmented volumes of interest. The incorporation of additional data should be a future area of study. Bone marrow and kidneys are typically the dose limiting tissues in nuclear medicine. We have only shown comparisons of voxel-level absorbed dose. Advances in imaging and development of models that tie macroscopic images to red marrow toxicity will be needed to further improve the state of voxel-level dosimetry. However, the biological effective dose at a macroscopic level has been shown to be useful when predicting kidney toxicity 97,146. Consequently, there is still tremendous value in voxellevel absorbed doses. 3.5 Conclusion Our implementation of GBBS with adaptive meshing showed that fast and accurate patient-specific voxel-level absorbed dose calculations are feasible for clinical nuclear medicine dosimetry. 86
109 Chapter 4: Biases and variability in tumor and non-tumoral absorbed doses from clinical dosimetry models applied to post-therapy 90 Y SPECT/CT 4.1. Introduction The use of 90 Y microspheres is an established palliative therapy for primary hepatocellular carcinoma (HCC) and metastatic disease found in the liver (e.g. metastatic colorectal cancer) 147. The standard dosimetry model for both glass and resin 90 Y microsphere devices is extremely coarse 80,81 ; it assumes uniform uptake of microspheres in the entire target volume including the tumors. There are, however, differences in dosimetry models between glass and resin microspheres: glass uses the MIRD model 80 (STD) and resin uses the empirical or body surface area (BSA) model 81. The dosimetry is designed to keep mean lung doses below Gy and to maintain mean whole liver doses below a certain threshold 148. Current microsphere dosimetry models are focused on safety and not on ensuring that targets receive tumorcidal absorbed doses. Nevertheless, 90 Y therapies have shown promising clinical results An alternative, but much less frequently used, dosimetry method for resin microspheres is the partition model 159 (PM), where the non-tumoral liver (NT) and tumors (T) are separated with a fixed concentration of microsphere uptake in each compartment. The PM is an improvement over STD or BSA, but it also has major limitations. For patients with multiple tumors, it is unable to account for variable tumor microsphere concentration and therefore it can only provide an average absorbed dose to all the tumors meaning individual tumors may be assigned an incorrect mean absorbed dose. Even in the best case of a single tumor, the PM assumes uniform uptake within T and NT and therefore only reports mean absorbed doses to both T and NT; thus the PM is 87
110 unable to account for the heterogeneity of dose within T or NT compartments. When estimating the T-to-NT ratio (TNR) as required by PM, the NT uptake is often estimated using a single volume of interest (VOI) placed in either the T, NT, or both on the SPECT image as opposed to VOIs that represent the entire NT or T. This type of haphazard sampling increases the uncertainty or variability in reported PM absorbed doses. From radiation oncology, we expect the minimum absorbed dose to tumor to be a better predictor of response than the mean absorbed dose, but the PM is not designed to calculate the minimum. In spite of these limitations, the PM has been used to assess response to therapy and some studies have shown that when tumors exceeded a mean absorbed dose threshold, the patients had improved progression free and overall survivals ,154. Most 90 Y dosimetry and treatment planning studies have been based on the STD or PM, but recently several groups have investigated voxel-level dosimetry, including Monte Carlo (MC), for 90 Y 60,104,112,122,135,139, Transitioning to new dosimetry models is difficult and requires acquiring a new clinical intuition. Thus, comparing currently accepted dosimetry models with future voxel-based models is a necessary step towards clinical adaptation and implementation. An important motivation for this work is to demonstrate the salient concept that 100 Gy as calculated by STD does not equal 100 Gy calculated by PM does not equal 100 Gy by voxel-based dosimetry. All dosimetry models have biases and uncertainties, and transformations or mappings are necessary to provide a consistent frame of reference (i.e. equivalent ) for absorbed doses across dosimetry models. External beam radiation therapy has progressed through such growing pains, and sealed source brachytherapy is undergoing a similar 88
111 transformation 55. Therefore, there is a critical need to understand both fundamental and quantitative differences between voxel-level dosimetry models and both STD and PM. The goal of this work is to highlight limitations of STD and PM in estimating T and NT absorbed doses by comparing them with MC. We compare mean T and NT absorbed doses between STD, PM, and MC to elucidate correlations and assess the value of using STD and PM to predict mean MC dose estimates for an individual patient s T and NT. We also quantify variability in PM T and NT absorbed dose due to uncertainty in NT uptake estimation. We perform a separate subset of analyses for the best case scenario of a solitary tumor, as well as, the more realistic cases involving multiple tumors Materials and Methods Patient Data We retrospectively analyzed imaging data from 19 hepatocellular cancer (HCC) patients treated with 90 Y glass microspheres. During planning the administered activity was determined using the STD model described in the device package insert 80 to deliver Gy to the target volume (mass); this dosimetry model assumes the activity is uniformly delivered to the entire target mass (whole liver, single lobe, or segment) excluding the lung shunt fraction (LS). The liver volume used in the planning calculation was determined from an anatomic diagnostic scan (contrast-enhanced CT or magnetic resonance image). The planned activity was adjusted to account for LS, which was obtained from a planar 99m Tc MAA imaging study. 89
112 This retrospective study was approved by the UT MD Anderson Cancer Center Institutional Review Board protocol DR The average administered activity was 3.14 ± 1.29 GBq (N=19) and the average target mass was 1.81 ± 0.66 kg (N=19). Quantitative 90 Y SPECT/CT post-therapy imaging was performed a few hours after the therapeutic interventional procedure. All dosimetric analysis in this work was performed using the post-therapy quantitative 90 Y SPECT/CT. Registration and segmentation was performed using MiM Maestro v6.4. The diagnostic CT or MRI scan was rigidly registered to the CT from the 90 Y SPECT/CT scan. The interventional radiologist segmented up to three tumors on attenuation CT from the SPECT/CT using information from the registered diagnostic scan as a guide. Each segmented tumor was required to be greater than 2.5 cm in diameter. The limit on number of tumors was set arbitrarily as a practical limit; the tumor diameter was chosen because the spatial resolution of our 90 Y SPECT has been measured as 20 mm full-width half maximum in water Dosimetry Models Applied to Post-Therapy Imaging We applied three dosimetry models to each patient s treatment based on the posttherapy imaging. The administered activity (A), and T and NT VOIs (and thus masses, M), were kept constant between the models. STD combines NT with T as a single target (T+NT) shown in equation [1]. Throughout this chapter all masses, absorbed doses, and activities have units of kilograms, Grays, and Giga-Becquerels, respectively, unless stated otherwise. We did not apply a LS correction for this investigation, as the accuracy of MAA planar LS is questionable 163, and in Chapter 5 we show that lung absorbed doses 90
113 are very sensitive to the liver-lung interface 139 and likely overestimate the lung absorbed dose. [1] D T+NT = A M T+NT Unlike STD, PM calculates separate absorbed doses for T and NT. This is accomplished through the measurement of a TNR from the activity distribution the same distribution used for MC. Equations [2] and [3] describe the PM absorbed dose calculation. [2] D T = A TNR M NT + M T TNR [3] D NT = A M NT + M T TNR Voxel-level absorbed doses were obtained using the EGSnrc (v ) user code DOSXYZnrc, which models radiation transport via MC 127,128. Several researchers have used MC for 90 Y voxel-based dosimetry 103,104,111,122,139,160. Voxel-level dosimetry requires calibration of the reconstructed SPECT. In this work we performed a self-calibration; we exploited the fact that the administered activity was contained within the SPECT field of view and calculated patient-specific calibration factors by dividing the administered activity by the total counts in the SPECT. We multiplied the SPECT by this factor to convert the SPECT to activity. We then assumed 91
114 no biological clearance and converted the activity in a voxel to the total number of disintegrations assuming a physical half-life of 64.1 h Assessing Partition Model variability PM absorbed doses depend explicitly on TNR estimation, which represents a source of variability. We assessed variation in the TNR by calculating four different TNRs for each patient. This was done by varying the estimate of NT uptake (i.e., the denominator in TNR). We estimated the NT uptake using the entire NT VOI and three spherical VOIs (d=2.5 cm) that were placed by an interventional radiologist in the NT compartment. In reality, there is also variability in T uptake (i.e., the numerator in TNR) depending on if a sphere is used to sample the T uptake, anatomic VOIs are used versus SPECT thresholding for T delineation, and inclusion or exclusion of necrotic cores. For simplicity we did not vary T uptake; rather we used the volume-weighted average activity concentration based on anatomic segmentation including necrotic cores. Four TNR estimates lead to four PM absorbed doses (PMNT, PMS1, PMS2, PMS3) for both T and NT. The variation in T and NT absorbed dose for each patient was shown using a box and whisker plot. We summarized the coefficient of variation (COV) seen in a given patient s absorbed dose estimates for the following subsets: all cases, cases with a single tumor, and cases with multiple tumors. Throughout this Chapter, the reported PM absorbed doses were calculated using the TNR based on the entire NT compartment unless stated otherwise. To provide context for the contributing uncertainties in PM absorbed doses, we performed an uncertainty analysis for T and NT derived from equations [2] and [3]. 92
115 Uncertainties in activity (ΔA), target mass segmentation (ΔM T ), and non-tumoral liver mass segmentation (ΔM NT ) were estimated at the 95% level (e.g., ΔA = 1.96σ A ) from the literature. TNR uncertainty was based on the measured average TNR COV across all patients. Assuming normally distributed uncertainties and that input variables are uncorrelated, we estimated PM uncertainty for both tumor absorbed dose (ΔPM T ) and non-tumoral liver absorbed dose (ΔPM NT ). Equations [4] through [8] describe the formulas and terms used for the PM T absorbed dose uncertainty analysis, while equations [9] through [13] were used for PM NT analysis. Nominal values of activity, masses, and TNR from our patient study were used to estimate absolute uncertainty for an average patient. [4] (ΔPM T ) 2 ( PM 2 T A ) (ΔA) 2 + ( PM 2 T ) (ΔM M NT ) 2 + ( PM 2 T ) (ΔM NT M T ) 2 + ( PM 2 T T TNR ) (ΔTNR) 2 [5] PM T A ΔA TNR (M NT + M T TNR) ΔA [6] PM T A TNR ΔM M NT NT (M NT + M T TNR) 2 ΔM NT [7] PM T M T ΔM T A TNR2 (M NT + M T TNR) 2 ΔM T [8] PM T TNR ΔTNR A M NT (M NT + M T TNR) 2 ΔTNR 93
116 [9] (ΔPM NT ) 2 ( PM 2 NT A ) (ΔA) 2 + ( PM 2 NT ) (ΔM M NT ) 2 + ( PM 2 NT ) (ΔM NT M T ) 2 + ( PM 2 NT T TNR ) (ΔTNR) 2 [10] PM NT A ΔA (M NT + M T TNR) ΔA [11] PM NT M NT ΔM NT A (M NT + M T TNR) 2 ΔM NT [12] PM NT M T ΔM T A TNR (M NT + M T TNR) 2 ΔM T [13] PM NT TNR ΔTNR A M T (M NT + M T TNR) 2 ΔTNR Using linear regression to transform Standard and Partition Model absorbed doses to Monte Carlo absorbed doses We compared the STD and PM absorbed doses to individual tumors (T) and nontumoral liver (NT) with their corresponding mean MC absorbed doses. Correlations 94
117 between MC and STD and between MC and the four PM absorbed doses were calculated using the freely available R statistical software (v3.2.1) 164. Using R, we performed bootstrapping 165 to empirically estimate the following parameters associated with linear regressions: mean slope and intercept, 95% confidence intervals (95%CI) on mean and slope, and 95% prediction intervals (95%PI). 10,000 linear regressions were performed for each study. The 95%PI were calculated by recording residuals from points that were not selected during a linear regression to generate a distribution of residuals; percentiles were extracted from the distribution. For both T and NT on each subset of patients (single tumor, multiple tumor, all), we performed analysis using four models: Base STD, Base, Base & TNR, Base & 5% MC, Base & TNR & 5% MC. Base STD is a bootstrapped linear regression of MC vs STD. The Base calculation is a bootstrapped linear regression of MC vs PMNT. Base & TNR incorporates TNR variability in PM by bootstrapping linear regressions of MC vs a random sample PM value from PMNT, PMS1, PMS2, or PMS3. Base & 5% MC is a bootstrapped linear regression of the MC vs PMNT where the MC value is resampled from a Gaussian with a mean of the individual MC estimate and a sigma equal to 5% of the individual MC estimate. 5% was selected because differences in modern radiation transport codes in nuclear medicine are a few percent 103. Base & TNR & 5% MC is a bootstrapped linear regression that incorporates the variability in both PM and MC. We report relative differences between the dosimetry models by calculating the percent difference in mean absorbed dose between STD and MC, and PM and MC for both T and NT, choosing MC as the reference. 95
118 4.3. Results STD, PM, and MC mean absorbed doses to tumor and non-tumoral liver Figure 20 summarizes the absorbed doses for both T and NT calculated using STD, PM, and MC dosimetry models. The mean and standard deviation of the distributions in Figure 20 are listed in Table 12. For T, PM reported the highest absorbed doses and STD reported the lowest. For NT, STD reported the largest absorbed dose estimates and MC reported the smallest. 96
119 Figure 20. Box and whisker plots summarizing absorbed dose to a) T and b) NT calculated using STD (orange triangles), PM (purple circles), and average MC (green circles). The red line is the median. The top and bottom of the box represent the 1 st (Q1) and 3 rd quartile (Q3). The whiskers extend to the largest (or smallest) value within 1.5*(Q3-Q1) + Q3 for largest (Q1 1.5*(Q3-Q1) for smallest). Outliers beyond the whiskers are marked as crosses. Individual data points are plotted to the left of the boxplots. 97
120 Subset VOI STD (Gy) PM (Gy) MC (Gy) ALL T 89 ± ± ± 91 (N=37) NT 89 ± ± 37 (N=19) 48 ± 22 (N=19) SINGLE T 86 ± 32 (N=7) 304 ± 246 (N=7) 171 ± 128 (N=7) NT 86 ± 32 (N=7) 72 ± 45 (N=7) 41 ± 23 (N=7) MULTI T 91 ± ± ± 77 (N=30) NT 91 ± ± 33 (N=12) 52 ± 21 (N=12) Table 12. The mean ± sd of absorbed doses using STD, PM, and MC for T and NT Variability of PM absorbed doses due to TNR variability from NT uptake estimation Variability in PM absorbed doses for T and NT is shown in Figure 21. T absorbed dose ranged from 185 to 538 Gy for case 7, while NT ranged from 31 to 166 Gy for case 4. Table 13 summarizes the variability by reporting the average COV in TNR and the corresponding average COV in PM T and NT absorbed doses. The COV was largest for TNR and smallest for NT. On average, the subset of single tumor cases exhibited higher COV than multiple tumor cases; T exhibited higher COV than NT. 98
 T and b) NT.")

121 Figure 21. Boxplots showing variation in the distribution of PM absorbed doses for a) T and b) NT. The variation is solely due to differences in estimating the NT activity concentration using full NT or one of three spheres in NT. Indices 1-7 represent single tumor cases, and the remaining (8-19) cases had multiple tumors. Boxplots are defined as explained in Figure
122 Subset TNR COV PM NT COV PM T COV Single T (N=7) 0.58 ± ± ± 0.27 Multi T (N=12) 0.43 ± ± ± 0.16 All (N=19) 0.48 ± ± ± 0.20 Table 13. The mean ± sd COV over the patients. These are COV values averaged over the multiple patients in each subset. Relative 95% uncertainty in parameters used to estimate uncertainty in the PM calculations were taken from the literature with ΔA 10%, 166 ΔM T 30% 50%, 167 ΔM NT 25%, 168 and ΔTNR % = 94% which was estimated from Table 13. Nominal values for uncertainty in PM T and PM NT, individual components of the total uncertainty, and total estimated uncertainty are listed in Table 14. The nominal values were taken from this study and used to calculate an estimate of the PM uncertainty for an average patient. 100
123 Nominal Input & 95% uncertainty estimate PM components of 95% uncertainty Total PM 95% uncertainty Quantity PM T PM NT A (GBq) 3 3 ΔA (GBq) M NT (kg) ΔM NT (kg) M T (kg) ΔM T (kg) 0.12, , 0.2 TNR 5 5 ΔTNR PM X A ΔA 23 5 PM X ΔM M NT NT PM X -42,-70-8,-13 ΔM M T T PM X TNR ΔTNR ΔPM X (Gy) 99,113 28,30 *PM X indicates PM T or PM NT. Table 14. Nominal values of activity, mass, and TNR from this study and their corresponding absolute uncertainties used to estimate uncertainty in PM absorbed doses. Two values are listed for ΔM T corresponding to 30% and 50%. Estimates of PM absorbed dose uncertainty are listed for individual components* and the total in quadrature at the 95% uncertainty level Using linear regression to transform individual patient s Standard and Partition Model absorbed doses to Monte Carlo absorbed doses The results of the correlation analyses are listed in Table 15. For T, STD and MC absorbed doses were not correlated. For the subset of single tumor patients, we 101
124 observed that MC and PMS2 were not correlated for NT. The remaining investigated correlations in Table 15 were statistically significant (p<0.05). The correlation coefficient was generally highest for the single tumor subset and higher for NT compared to T. NT T Subset Correlating r (95% CI) r (95% CI) MC vs (0.935,0.999) (0.973,0.999) MC vs (0.658,0.992) (0.594,0.990) MC vs 0.518* (-0.386,0.914) (0.870,0.997) MC vs (0.805,0.996) (0.391,0.983) MC vs STD (0.331,0.980) 0.635* (-0.226,0.939) MC vs (0.803,0.984) (0.658,0.913) MC vs (0.704,0.975) (0.435,0.840) MC vs (0.719,0.976) (0.452,0.846) MC vs (0.810,0.985) (0.575,0.887) MC vs STD (0.490,0.951) * (-0.381,0.339) MC vs (0.875,0.981) (0.810,0.947) MC vs (0.762,0.963) (0.647,0.894) MC vs (0.484,0.907) (0.583,0.872) MC vs (0.823,0.973) (0.647,0.894) MC vs STD (0.616,0.935) 0.162* (-0.171,0.462) *indicates that p value of correlation was not statistically significant at the level of Single Multiple All Table 15. Correlations of MC absorbed dose with PM and STD for multiple subsets for both T and NT. Linear regressions for MC as a function of PM and STD were evaluated for the three subsets of patients (single, multiple, all). MC and the four PM absorbed doses are plotted in Figure 22 with two selected linear regressions: the best case single tumor subset (BASE), and the full variability for multiple tumor subset (BASE & TNR & 5% MC). For clarity, the others were not plotted, but their results are included in Table 16. Figure 22 shows that for tumors there was a large change in bias (slope, intercept) and uncertainty (95%PI) when going from the best case single tumor BASE regression to 102


125 the more realistic multiple tumor case BASE & TNR & 5% MC. 103
126 Figure 22. Linear regressions of the mean MC absorbed doses as a function of PM for a) T absorbed doses and b) NT absorbed doses. We plotted the linear fits for the following cases: BASE for the subset of single tumor patients (red) and BASE & TNR & 5% MC for the subset of multiple tumor patients (blue). The four symbols represent the multiple PM absorbed dose calculations and the lines correspond to fits and their 95%PI. Table 16 shows the slope and intercept of the linear correlation together with the 95%CI of the linear transformation of absorbed dose estimates for STD to MC and PM to MC. For no scenario is the slope near unity, which implies that the absorbed dose estimates are drastically different between models. For T the BASE STD calculation is a useless model for predicting MC absorbed doses due to the large 95%CI in model parameters and correspondingly large 95%PI; this is in agreement with the fact that no correlations were found between STD and MC for T. For NT, the BASE STD is marginally meaningful due to the large 95%CI and 95%PI relative to the corresponding transformed PM absorbed doses. 104
127 Bias Uncertainty Subset Bootstrapped linear regression Slope ± 95% Intercept ± 95% PI (Gy) model for predicting MC CI (MC/PM) 95% CI (Gy) Tumors Non-tumoral Liver Single Tumor (N=7) Multi Tumor (PMN=12, All Tumor (PMN=19, MCN=37) Single Tumor (N=7) Multi Tumor (N=12) All Tumor (N=19) Base STD 2.10± ±218 ±290 Base 0.51± ±19 ±46 Base & TNR 0.48± ±25 ±133 Base & 5% MC 0.51± ±24 ±52 Base & TNR & 5% MC 0.48± ±27 ±132 Base STD -0.10± ±106 ±192 Base 0.56±0.22 9±32 ±95 Base & TNR 0.34± ±17 ±140 Base & 5% MC 0.56±0.21 9±33 ±98 Base & TNR & 5% MC 0.34± ±17 ±138 Base STD 0.59± ±125 ±230 Base 0.53± ±17 ±77 Base & TNR 0.39± ±15 ±126 Base & 5% MC 0.53± ±18 ±79 Base & TNR & 5% MC 0.39± ±16 ±128 Base STD 0.67± ±31 ±34 Base 0.51±0.05 4±5 ±8 Base & TNR 0.40± ±11 ±17 Base & 5% MC 0.52±0.09 3±7 ±10 Base & TNR & 5% MC 0.41± ±12 ±18 Base STD 0.78± ±47 ±28 Base 0.60±0.16 4±11 ±17 Base & TNR 0.53± ±7 ±15 Base & 5% MC 0.60±0.17 4±11 ±19 Base & TNR & 5% MC 0.53± ±7 ±16 Base STD 0.70± ±21 ±23 Base 0.57±0.09 4±6 ±15 Base & TNR 0.47± ±6 ±18 Base & 5% MC 0.56±0.10 5±7 ±16 Base & TNR & 5% MC 0.47± ±6 ±18 105
128 Table 16. Bootstrapped linear regressions for five models showing the bias (slope and intercept) with 95%CI and uncertainty in transforming STD or PM to MC. The BASE for single tumor subsets had the smallest 95%PI of 46 Gy; this was expected to be the best case when comparing MC with PM. For T, moving to the BASE for multiple tumor subsets showed an increase of slope by around 10% compared to the single tumor subset, and more importantly the 95%PI increased to 95 Gy this increase was expected since the PM is not designed to properly account for multiple tumors. TNR variability found in the BASE & TNR and BASE & TNR & 5% MC T regressions is responsible for the large increases in uncertainty or the 95%PI; 95%PI increases from 46 Gy to 133 Gy and 95 Gy to 140 Gy for the single tumor and multiple tumor subsets, respectively. TNR variability also causes a large change in bias for T in multiple tumor subsets because the slope changes from 0.56 to 0.34, a difference of - 40%. For NT, the BASE for single tumor subsets had the smallest 95%PI of 8 Gy; the BASE for multiple tumor subsets had a 95%PI of 17 Gy. TNR variability has less effect on NT with 95%PI of approximately 17 Gy, and slopes changing from 0.51 to 0.41 and 0.60 to 0.53 for single and multiple tumor subsets, respectively. Table 17 shows PM and STD absorbed doses relative to MC values. PM absorbed doses on average overestimated MC by 70% for single tumor cases and 100% for multiple tumor cases. The standard deviation of the PM vs MC differences was 25% and 120% for T absorbed doses for single and multiple tumor cases, 106
129 respectively. PM NT average differences were 70% for single tumors and 50% for multiple tumor cases; the standard deviation of these differences stayed around 25%. Single Tumor Cases Multiple Tumor Cases All Cases PM vs MC STD vs MC T 69.6% ± 24.3% (N=7) 104.2% ± 118.8% (N=30) 97.6% ± 107.9% (N=37) NT 70.9% ± 26.3% (N=7) 55.7% ± 22.8% (N=12) 61.3% ± 24.6% (N=19) T -22.6% ± 68.7% (N=7) 29.7% ± 98.3% (N=30) 19.8% ± 94.9% (N=37) NT 144.6% ± 85.2% (N=7) 95.6% ± 71.5% (N=12) 113.7% ± 78.3% (N=19) Table 17. The mean ± sd of percent differences from MC for STD and PM. For STD vs MC, the T average differences were -20% for single T and 30% for multiple T, but they had large standard deviations of 70% and 100% respectively. For STD vs MC, NT average differences were 150% for single tumors and 100% for multiple tumors; the corresponding standard deviations of 85% and 70%, respectively indicated large individual differences from MC Discussion This work represents the first investigation on comparing both STD and PM with MC voxel-level dosimetry from post-therapy 90 Y SPECT/CT imaging using anatomic VOIs registered from diagnostic CT scans. This work is important because it highlights differences in clinically relevant 90 Y microsphere dosimetry models. Strengths of our 107
130 study include the use of post-therapy imaging, identical VOIs were used for all dosimetry models, MC absorbed doses, and subset analyses for patients with single tumor and multiple tumors. In this work we have demonstrated a critical aspect of 90 Y microsphere dosimetry, i.e., that using different dosimetry models (STD, PM, and MC) on the same input image with matched VOIs can result in substantial differences in absorbed dose estimates. In this work we transformed PM and STD absorbed doses to a common frame of reference -- MC. The biases and uncertainties that result in the transformed absorbed doses are largely a result of limitations inherent in the models: STD does not separate T and NT while PM depends on TNR and doesn t handle multiple tumors with varying TNRs well. When viewing the transformed PM and STD results in Table 16, we consider the slope and intercept as bias and the 95%PI as uncertainty. The table represents a mapping of the PM and STD to a common dosimetry model voxel-level MC. If the 95%CI is large on the slope and intercept, then the transformation is unreliable; this can be seen with STD for tumors. For 90 Y microsphere therapy, we are interested in individual absorbed doses; thus the resulting 95%PI of the transformation is important. Interpreting the transformations in this manner leads to the following observations: STD is not useful for tumor dosimetry, PM performs better than STD, PM single tumor performs better than PM multiple tumor, and TNR variability adds substantial uncertainty in absorbed doses. Different dosimetry models output dramatically different absorbed dose estimates; consequently caution is warranted when comparing tumor dose response or toxicity data between studies that use different models. One possible explanation for the large differences between PM and MC is calibration. PM and STD 108
131 have an implicit calibration based on the delineated total volume T + NT. Thus, all activity (excluding the LS contribution if modeled) is forced to be in the VOIs. Modifying VOIs will change this implicit calibration which is problematic the absorbed dose calculation should be separate from and not dependent on T + NT segmentation. The eventual goal is to estimate absolute true absorbed doses. However, the reported absorbed doses also depend on factors other than the dosimetry model. There may be additional biases and uncertainties stemming from image quality and registration; for example, finite spatial resolution, noise, motion, and scatter and attenuation compensation introduce errors. SPECT self-calibration also has limitations where insufficient scatter compensation may lead to biases. We have matched the imaging and VOI definition in this analysis to focus on differences in dosimetry models. Using published data and results from our patient study, we estimated PM uncertainty for an average patient. The analysis showed that TNR variability is currently the dominant factor, even when assuming 50% variability in tumor masses. However, Chiesa et al 162 showed differences of ~200% in tumor masses between SPECT and anatomical tumor delineation. An additional complicating factor is that the uncertainties in T and NT will be coupled with TNR. This coupling results from a limitation that PM, similar to STD, uses the segmentation to explicitly calculate the absorbed dose whereas voxel-level dosimetry requires segmentation for reporting of absorbed doses. The wide range of tumor response absorbed doses reported for glass microspheres summarized by Cremonesi et al 161 is due to several factors. Clinical endpoint, MAA distributions not matching 90 Y distributions, SPECT versus CT delineation, dosimetry model, and other factors affect the response modelling. Our 109
132 results quantify a portion of the variability due to PM when using spheres to estimate NT. However, it is clear that much more work is required to quantify biases and variability to refine methodology and improve the consistency of reporting. Such consistency may not be important for palliative intent, but for 90 Y microsphere therapy to move towards a local control or curative intent, it will be essential to understand and reduce biases and variability Conclusion Moving from STD or PM to voxel-based dosimetry models will require careful interpretation and understanding of differences between the models. Most importantly, physicists and clinicians should be aware that in practice 100 Gy STD, 100 Gy PM, and 100 Gy MC are not equivalent. Although voxel dosimetry based on 90 Y SPECT/CT has limitations, at present it may be the most appropriate model to calculate tumor and nontumoral absorbed doses. All dosimetry models have biases and uncertainties, and transformations or mappings must be implemented to provide a consistent frame of reference when comparing absorbed doses across dosimetry models. 110
133 Chapter 5: Comparing voxel-based absorbed dosimetry methods in tumors, liver, lung, and at the liver-lung interface for 90Y microsphere selective internal radiation therapy. This chapter is based upon the following publication: Justin K. Mikell, Armeen Mahvash, Wendy Siman, Firas Mourtada, and S. Cheenu Kappadath. Comparing voxel-based absorbed dosimetry methods in tumors, liver, lung, and at the liver-lung interface for 90Y microsphere selective internal radiation therapy. EJNMMI Physics (2015) 2:16 DOI /s y 139. This is an Open Access article distributed under the terms of the Creative Commons Attribution License ( which permits unrestricted use, distribution, and reproduction in any medium, provided the original work is properly credited. The Creative Commons Public Domain Dedication waiver ( applies to the data made available in this article, unless otherwise stated. 5.1 Introduction Liver-directed selective internal radiation therapy (SIRT) has experienced clinical growth in recent years for the management of both hepatocellular carcinomas and metastatic disease from colorectal cancer, breast cancer, and neuro-endocrine tumors. Methods to calculate the administered activity for SIRT rely on body surface area and the assumption that activity is distributed uniformly throughout the liver, while the absorbed dose to the lung is based on the lung shunt (LS) 80,81. A major limitation of these models is that they do not separate tumors from normal liver (NL) and are more 111
134 accurately characterized as safety planning methods rather than treatment planning. The partition model 159 offers an improvement in that it separates tumors from NL, but it simplistically models all tumors as a single entity having a singular uptake fraction and assumes uniform activity distribution throughout the tumor and NL compartments. Recent progress in post-therapy quantitative 90 Y imaging with SPECT/CT and PET/CT has facilitated voxel-level absorbed dose calculations. Voxel-based absorbed dose calculations are affected by the 90 Y image quality in terms of quantitative accuracy and spatial resolution. Unlike other models, voxel-based absorbed dose calculations do not require tumor burden, tumor segmentation or tumor uptake fraction as inputs for estimating absorbed dose at each voxel. Organ-at-risk and tumor segmentation are still necessary in voxel-based dosimetry, but segmentation is performed to report on the calculated absorbed doses and not to explicitly calculate the absorbed dose. Voxel-based dosimetry methods (VBDM) allow the absorbed dose calculation to be independent of the tumor and organ-at-risk segmentation. There are several methods to calculate voxel-based absorbed doses for SIRT. However, little has been published in the literature comparing different VBDM, and the comparisons have been confined to the liver 144. Lung dosimetry is of importance for SIRT because absorbed dose to lung often limits the deliverable activity. The lung shunt fraction can be estimated using 99mTc MAA with planar (or sometimes SPECT) imaging 169,170. In some instances, 99mTC-MAA SPECT/CT is performed to assess extra-hepatic uptake and these can in principle be used for therapy planning mTc MAA SPECT scans have superior image quality compared to post-therapy bremsstrahlung 90Y SPECT scans, but there are studies showing MAA does not 112
135 reliably predict the distribution of delivered 90Y microspheres 171. To our knowledge, no previous study has reported the use of VBDM for determining absorbed dose to lung and explored the implications of different VBDM in the liver-lung interface region 172,173. Both the EANM 169 and AAPM 170 provide guidance for clinical standard of practice 90Y microsphere therapy, but neither document addresses the effect of different voxelbased dosimetry methods which are under investigation. In this study, we investigated differences among four VBDM for tumor, liver, and lung absorbed doses based on 90 Y bremsstrahlung SPECT/CT imaging. Accuracy of the different methods at the liver-lung interface was estimated for different spatial resolutions and LS. Patient data was analyzed to determine the sensitivity of NL, right lung (RL), and total liver mean absorbed dose (AD ) to the liver-lung interface. 5.2 Methods and Materials Patient Data Patient data were processed to assess the impact of the different VBDM on absorbed dose calculations under realistic clinical situations. Accurate comparisons between dosimetry models can be achieved by using the same input patient data (administered activity and SPECT/CT images) into all of the VBDM. A total of 17 posttherapy 90 Y SPECT/CT scans were selected for this study using a UT MD Anderson Cancer Center Institutional Review Board approved retrospective chart review protocol (DR ), and informed consent requirement was waived. The mean administered activity was 2.81 ± 1.04 GBq (range 1.13 to 5.21 GBq). The administered activities were based on the package insert for the treatment device: ~120 Gy to treatment 113
136 volume for glass microspheres. Adjustments were made to the activity based on the LS fraction that was estimated by the 99m Tc MAA scans. Diagnostic CT or magnetic resonance images were manually registered to the SPECT/CT to aid in tumor delineation. A single interventional radiologist segmented the liver and tumors for all patients using the co-registered CT and/or magnetic resonance images. NL was generated by subtracting the tumor contours from the liver contour. RL was segmented using region growing in MIM Maestro v6.2 (MIM Software); RL was then inspected and manually adjusted by a physicist. The 90 Y SPECT/CT scans were acquired on a Symbia T16 (Siemens Medical Solutions) with medium-energy low-penetration collimation. SPECT data were acquired with a kev primary window and kev scatter window for 128 views over 360 degrees with 28 s/view. A three-dimensional (3D) ordered-subset expectation maximization (Flash3D, Siemens Medical Solutions) SPECT reconstruction was performed using 4 iterations and 8 subsets and a 9.6 mm FWHM Gaussian postfilter. The reconstructed isotropic voxel size was 4.8 mm. The reconstruction modeled geometric collimator response, CT-based attenuation correction using effective energy of the primary energy window width, and an energy window-based scatter correction 174. The spatial resolution of the reconstruction was estimated to be 20 mm FWHM using an 90 YCl2 line source in cold background. Activity in each voxel (A ijk ) was calculated by converting reconstructed SPECT counts to activity through a self-calibration factor defined as Administered Activity/ Total Counts. We have assumed that all administered activity was within the SPECT field of view because most of the lung was included in the SPECT field of view; no 114
137 correction for LS was applied. The Total Counts = C ijk where C ijk represents the reconstructed counts in a voxel and the summation is over the entire SPECT volume. Absorbed dose volume histograms of tumor, NL, and RL were generated for each patient and each VBDM. Correlations of AD from local deposition (LD), soft-tissue kernel (SK), and soft-tissue kernel with density correction (SKD) with Monte Carlo (MC) were investigated for tumor, NL, and RL. A qualitative evaluation of differences in the isodose distributions was also performed Voxel-Based Dosimetry Methods Investigated: Monte Carlo (MC), Softtissue kernel with density correction (SKD), soft-tissue kernel (SK), and local deposition (LD) Four VBDM were investigated to calculate voxel-based absorbed doses for SIRT: Monte Carlo (MC), soft-tissue kernel with density correction (SKD), soft-tissue kernel (SK), and local deposition (LD). MC was performed with the EGSnrc 128 user code DOSXYZnrc 127. All electrons and photons were tracked down to kinetic energies of 1 kev. The simulation parameters included bound Compton scattering, Rayleigh scattering, atomic relaxations, Beithe-Heiler bremsstrahlung cross sections, simple bremsstrahlung angular sampling, spin effects, exact boundary crossing, and PRESTA- II 128,129. Voxel-level material (M ijk ), activity (A ijk ), and density (ρ ijk ) distributions were derived from quantitative 90 Y bremsstrahlung SPECT/CT. ρ ijk was determined from the CT using a scanner- and technique-specific linear lookup table based on electron density phantom scans. M ijk was generated by mapping ρ ijk to one of four materials (air 175, lung 100, soft tissue 131, or bone 100 ) based on density ranges. 115
138 We assume that 90 Y microspheres have no biological clearance, so the total number of disintegrations in a voxel is given by N ijk = A ijk T 1/2 ln(2) where T 1/2 is the physical half-life of 90 Y (64.1 h). The 90 Y β emission has a maximum energy of 2.28 MeV, corresponding to a maximum range of 11 mm in soft tissue 130, but the range increases to 44 mm in lung with density 0.26 g/cc. Table 18 summarizes the different VBDM investigated in this work. Absorbed doses calculated using MC are a function of material, total number of disintegrations, density, and the energy spectra of the beta particle emitted. Patient MC simulations were performed using 10 9 histories. LD requires only the average energy of the beta particle and mass of each voxel. For SK and SKD, the absorbed dose soft tissue kernel was generated from MC simulations in an infinite soft-tissue medium with density of 1.04 g/cc using 2x10 9 histories; it was validated by comparing with Lanconelli et al The simulation yielded statistical uncertainty 0.002% in the source voxel and 2.5% at 40 mm. The kernel had isotropic voxel size of 4.8 mm matching the reconstructed SPECT. SK and SKD were calculated by convolving the total number of disintegrations with the kernel; convolutions were performed in IDL v8.2 (Exelis Visual Information Solutions). SKD was then scaled by the ratio of kernel density to voxel density
139 VBDM Functional Form Notes Monte Carlo (MC) F(M ijk, N ijk, ρ ijk, E 90Y ) E 90Y is the beta energy spectra per disintegration Local Deposition (LD) N ijk E avg ρ ijk ΔV E avg (0.937 MeV) is the average energy of the beta particle per disintegration. ΔV is the volume of a voxel. Soft-tissue Kernel (SK) N ijk K i j k K i j k is obtained from a MC simulation of infinite uniform softtissue material with density of 1.04 g/cc. Soft-tissue Kernel with Density Correction (SKD) 1.04 (N ijk K i j k ) ρ ijk Assumes ρ ijk is in units of g/cc * denotes convolution. Table 18. Characteristics of the different VBDM investigated. 117
140 5.2.3 Assessing sensitivity of non-tumoral liver (NL), right lung (RL), and total liver mean absorbed dose to the liver-lung interface To assess sensitivity of NL, RL, and total liver AD to the liver-lung interface in patient data, we generated remainder VOI for total liver, NL, and RL by excluding regions extending 1, 2, or 3 cm from the liver-lung interface into both the liver and lung. The sensitivity of AD on segmentation was analyzed in Excel by plotting the AD to the original VOI as a function of the AD to the remainder VOIs, and fitting a line to the data. Figure 23 shows an example of how the remainder VOIs were determined. 118
 on the accuracy of voxel-based dosimetry method (VBDM) at the liver-lung interface Simulations were performed to")
141 Figure 23. Sagittal view through liver and RL illustrating excluded regions from the liver-lung interface. Remainder RL (red), excluded RL (yellow), excluded liver (blue), and remainder liver (pink) Simulation to estimate the impact of spatial resolution and lung shunt (LS) on the accuracy of voxel-based dosimetry method (VBDM) at the liver-lung interface Simulations were performed to estimate errors in the absorbed dose calculations around the liver-lung interface for the different VBDM as a function of spatial resolution and LS. We used a slab geometry with multiple spatial resolutions and LS; this simple simulation had two compartments (liver and lung) shown in Figure 24 and did not use 119

142 patient data. We placed a uniform amount of activity in the liver compartment representing a true activity distribution. To simulate limited spatial resolution, the activity in the liver was convolved with a Gaussian FWHM of 10 or 20 mm causing count spill-out of the liver and spill-in to the lung; spill-out from the lung into the liver also occurs for non-zero LS fractions. MC, SK, SKD, and LD voxel-level absorbed doses were then calculated on the three activity distributions (0, 10, 20 mm FWHM) and were normalized to the input activity. A similar process was carried out for the lung. Figure 24. Schematic geometry of the simulations for the liver-lung interface with uniform activity in the slab representing either the liver (a) or lung (b). Arbitrary lung shunt fractions (LS) were achieved through superposition of individual voxel-based dosimetry methods (VBDM) for both liver and lung. Finite spatial resolution was modeled through Gaussian blurring. Data were averaged in the orange region to generate 1D absorbed dose profiles along the dashed line. 120
143 The density of soft tissue and lung was set to 1.04 g/cc 131 and 0.26 g/cc 100, respectively. A newer ICRP report 176 lists the density of lung as 0.25 g/cc, but we do not expect results to change significantly due to a 0.01 g/cc difference in density. The simulation volume consisted of mm isotropic voxels. These voxels were padded such that the total dimensions were cm 3 approximating an infinite phantom. One-dimensional (1D) line profiles along the z axis were generated by averaging the central 7 7 voxels in each x-y plane. For the three spatial resolutions, the liver and lung VBDM absorbed doses were combined via superposition by weighting the lung component by LS and the liver by 1- LS. We investigated LS of 1, 10, and 20%. For quantitative comparison between VBDM, we defined the true absorbed dose distribution as the MC profile of 0 mm FWHM for a given LS; specifically, distance intervals along the 1D profile for which the different calculations agreed within ±10% of the truth are reported. 5.3 Results Comparing soft-tissue kernel with density correction (SKD), soft-tissue kernel (SK), and local deposition (LD) with Monte Carlo (MC) for patients Figure 25 illustrates the salient differences in the apparent absorbed dose distribution stemming from the four VBDM; it shows the different absorbed dose calculations throughout the RL and liver on a coronal CT slice for a patient. The isodose curves deep within the liver were nearly identical for all four methods. The 20 Gy line extended furthest in the lung for SKD and LD followed by MC and then SK (least penetration into lung). The LD isodose distribution was very similar to the SKD 121
144 distribution. There was an unequivocal qualitative difference in the lung absorbed dose distribution when SK was compared with MC, LD, or SKD, owing to the fact that SK assumes soft-tissue density of 1.04 g/cc regardless of the true density and material composition. 122

145 Figure 25. A coronal plane through the RL and liver illustrating salient differences between the four different voxel-based dosimetry methods (VBDM): (a) Monte Carlo (MC) (b) local deposition (LD) (c) soft-tissue kernel (SK) (d) soft- 123
146 tissue kernel with density correction (SKD). The tumor (shaded in cyan) is 5.2 cm in length in the cranial-caudal direction. The correlations in absorbed dose as estimated using LD, SK, and SKD in relation to the true values from MC are shown in Figure 26. All the correlations had R 2 > Slopes of the fit lines ranged from 0.98 to 1.00 for tumors and NL. For RL AD, the slopes were 0.88, 0.90, and 2.32 for SKD, LD, and SK respectively. The summary of percent differences relative to MC are listed in Table 19. AD to tumors and NL using LD, SK, and SKD were within 5% of MC. For AD to RL, LD had the best agreement (17% on average) with MC, whereas SK had the poorest agreement (-60% on average). 124
147 Figure 26. The correlation of patient absorbed doses from Monte Carlo (MC) with those from local deposition (LD) (green triangles), soft-tissue kernel (SK) (red squares), and soft-tissue kernel with density correction (SKD) (blue diamonds) for (a) tumor AD (N=31), (b) non-tumoral liver (NL) AD (N=17), and (c) right lung (RL) AD (N=17) shown together with their linear fits. The gray dashed line represents the line of equivalence. 125
148 SKD vs. MC SK vs. MC LD vs. MC tumor AD -0.2% ± 0.3%, [-1.7%, 0.0%] 1.6% ± 1.2%, [-2.6%, 3.1%] 0.9% ± 1.2%, [-0.4%, 4.7%] NL AD -0.3% ± 0.1%, [-0.5%, -0.1%] 1.5% ± 0.7%, [-0.6%, 2.3%] -0.1% ± 0.5%, [-1.3%, 0.6%] RL AD 19.6% ± 9.9%, [7.3%, 48.3%] -60.2% ± 3.7%, [-65.8%, -52.7%] 17.4% ± 9.4%, [6.5%, 45.1%] *μ ± σ, [min, max] of (100 (calculation MC)/MC) Table 19. Percent differences in AD when using SKD, SK, and LD compared with MC Sensitivity of total liver, non-tumoral liver (NL), and right lung (RL) mean doses to the liver-lung interface Figure 27 shows the MC AD to the RL when regions extending 1, 2, or 3 cm from the liver-lung interface were excluded from both the liver and lung VOIs. The sensitivity was similar for all VBDM. For total liver the slopes were 0.94, 0.87, and 0.74 when excluding 1, 2, and 3 cm from the interface, respectively; NL was less sensitive with slopes of 0.97, 0.94, and 0.92 respectively, and RL was the most sensitive with 126
149 slopes of 1.43, 1.89, and 2.14, respectively. The RL AD sensitivity to the liver-lung interface was seen as a strong departure from the line of equivalence (Figure 27). Excluding up to 3 cm of the liver-lung interface for the total liver and NL resulted in average differences of 4.1% and 6.9%, respectively, from the original AD to VOIs (without excluded regions), suggesting relative insensitivity to the interface region. On the contrary, excluding up to 3 cm of the interface for the RL led to an average difference of -48.4% from the original AD, suggesting that RL AD is very sensitive to the interface region. Figure 27. The MC AD to the patients right lung (RL) (N=17) when regions extending 1 cm (blue circle), 2 cm (red x), or 3 cm (green pentagon) from the liver-lung interface were excluded from the original RL VOI, shown together with the linear fit. The gray dashed line represents the line of equivalence. 127
150 5.3.3 Effect of spatial resolution and lung shunt (LS) on accuracy of the voxelbased dosimetry method (VBDM) at the liver-lung interface Figure 28 shows the percent differences of the different absorbed dose calculations relative to the truth (MC of true activity distributions) for different LS and different FWHM. LD is not displayed since the differences were similar to SKD. Errors on the liver side of the interface were generally within 30% and approached 0 as the blurring decreased to 0 and moved away from the interface deeper into the liver. Near the lung interface, errors for 20 mm FWHM blurring and 1% LS were within 20% when using SK compared to errors over 200% for MC and SKD. Table 20 lists the distance intervals where agreement with MC was within 10%; on the liver side, agreement to within 10% for all methods was found beyond 4, 6, and 12 mm from the interface for 0, 10, and 20 mm FWHM blurring, respectively, and a LS from 1% to 20%. For MC, LD, and SKD in the lung, agreement was found beyond 26, 31, and 39 mm for 0, 10, and 20 mm FWHM blurring, respectively. 128
151 Figure 28. 1D profiles from VBDM simulations with different spatial resolution (20 mm FWHM (blue), 10 mm FWHM (red), 0 mm FWHM (orange)) at the liver-lung interface, showing percentage differences from MC without blurring. Local deposition (LD) is omitted since it was similar to Soft-tissue kernel with density 129
152 correction (SKD). LS is 1% in (a) Monte Carlo (MC), (b)skd, and (c) soft-tissue kernel (SK). Lung shunt (LS) is 20% in (d) MC, (e) SKD, and (f) SK. 130
153 VBDM LS (%) Blurring FWHM (mm) (-, ) (-,-4) U (31, ) (-,-12) U (39, ) MC 10 (-, ) (-, -3) U (-2, -1) U (17, ) (-,-11) U (-2,-1) U (26, ) 20 (-, ) (-, 0) U (11, ) (-, -10) U (-2,-1) U (21, ) LD 1 (-, -4) U (-2,-1) U (26, ) (-,-4) U (-2,-1) U (7,8) U(26, ) (-,-11) U (-2,-1) U (24, ) 10 (-, 0) U (11, ) (-, -5) U (-2,-1) U (7, ) (-,-11) U (-2,-1) U (19, ) 20 (-, ) (-,-5) U (-2,-1) U (8, ) (,-9) U (-2,-1) U (16, ) SKD 1 (-,-2) U (4,5) U (23, ) (-,-6) U (-2,-1) U (10,11) U (23, ) (-, -11) U (-2,-1) U (29, ) 10 (-, -1) U (6, ) (-,-6) U(-2,-1) U(11, ) (-,-11) U (-2,-1) U (23, ) 20 (-, -1) U (7, ) (-, -6) U (-2,-1) U (11, ) (-,-10) U (-2,-1) U (21, ) SK 1 (-, -2) (-, -6) (-, -11) U (-0.5, 2) U (9, 13) 10 (-, -2) (-, -6) (-, -11) 20 (-, -2) (-, -6) (-, -10) *The true absorbed dose distribution was MC with FHWM=0. We employed interval notation (e.g. (x1, x2) (x3, x4). 131
154 Table 20. Intervals in millimeters where the VBDM were accurate to within 10% as a function of lung shunt (LS) and FWHM, where positions 0 represents liver, positions > 0 represents lung, and 0 represents the liver-lung interface. SK approximated the true absorbed dose near the lung interface well for 1% LS with blurring of 10 mm and 20 mm, but significantly underestimated the absorbed dose at the lung interface and deep into the lung for the higher LS. MC matched the true lung absorbed dose better for the higher LS and lower blurring. SKD and LD overestimated near the lung interface compared to MC, but they both approached the true value deep (>39 mm) within lung. LD, SK, SKD, and MC approached the same value deep (>12 mm) within the liver, and they were all similar on the liver side of the interface, with MC performing slightly better than the others given a larger FWHM. On the liver side of the interface, LD, SK, and SKD all underestimated the absorbed dose similarly when the activity distribution was blurred. Figure 29 provides context for the relative differences in Figure 28 by showing line profiles of absorbed dose in arbitrary units for the VBDM with different lung shunt fractions and spatial resolutions. Figure 29 can be used to estimate absolute errors in the absorbed dose near the interface. For example, if one assumes the absorbed dose within the liver far from the interface is 80 Gy, then the SKD absorbed dose in the lung at 7 mm from the interface for LS = 1% and FWHM = 20 mm, would be 9.4E- 15/1.1E-14 * 80 Gy 68 Gy whereas the true value would be 1.9E-15/1.1E-14 * 80 Gy = 14 Gy. 132
155 Figure 29. 1D dose distributions at the liver-lung interface to compare the four VBDMs for different spatial resolution and LS. LS is 1% in (a) 0 mm FWHM, (b) 10 mm FWHM, and (c) 20 mm FWHM, while LS is 20% in (d) 0 mm FWHM, (e) 10 mm FWHM, and (f) 20 mm FWHM. * A.U. = Arbitrary Units. 133
156 5.4 Discussion Our NL and tumor absorbed dose results are similar to those reported by Dieudonne et al. 144 ; both studies showed better agreement with MC when using SKD instead of SK. Our work adds to the body of knowledge on 90 Y dosimetry in part by assessing absorbed dose differences in patient data due to differences in methodology. We also included LD voxel-based estimates in our comparison; these estimates are relevant since investigators have recently begun using LD in voxel-based absorbed dose calculations following SIRT 123,177. Lung dosimetry is also of central importance in SIRT because lung absorbed dose limits the administered activity of 90 Y and can prevent patients from receiving adequate therapeutic tumor absorbed doses. However, to date, no work has compared VBDM for the lung and in the liver-lung interface based on 90 Y bremsstrahlung SPECT/CT imaging. The correlations of local deposition (LD), soft-tissue kernel (SK), and soft-tissue kernel with density correction (SKD) with Monte Carlo (MC) for mean absorbed dose to tumors, NL, and RL could potentially be used to convert mean absorbed doses between the different voxel-based dosimetry methods (VBDM) for our image acquisition protocol. Regarding absorbed doses in the lung, SKD and LD both overestimate the lung dose by 15-20% relative to MC, while SK underestimates by 60%. The reason for the underestimation by SK is that SK never truly encounters lung tissue - everything, including the lung, is treated as 1.04 g/cc soft tissue. Consequently, the isodose curves are significantly contracted in the lung because they see a density and mass four times that of lung on average; this effectively reduces spatial transport and the local absorbed 134
157 doses. For activity placed in the lung or near the liver-lung interface, MC will transport the betas. Due to the lower density of lung, the transport distance can be significant - on the order of a few cm. Thus, MC will transport the electron and the corresponding energy deposition will occur over several centimeters. In contrast, LD assumes all the electron energy is deposited locally within the voxel. Because the electrons and their energy are not being spread out spatially with LD, the local energy density increases which causes the absorbed dose to increase; this explains why LD is greater than MC in the lung. A similar explanation holds for SKD; the only difference being that the energy is spread out over a spatial kernel corresponding to 1.04 g/cc soft-tissue which will be a smaller region (~1 cm) than MC will transport the electron and its energy in lung (~ 4 cm). The sensitivity of the patients RL, NL, and total liver AD to the liver-lung interface agrees with the trend that larger distances from the interface are required in lung (relative to liver) to reach accurate absorbed doses. The RL AD decreased by ~50% (8.8 ± 5.4 Gy to 4.2 ± 2.3 Gy) when 3 cm of the interface was excluded, whereas the total liver AD only increased by ~3% (45.1 ± 12.7 Gy to 46.6 ± 15.0 Gy) for a similar interface exclusion. From a clinical perspective, this finding highlights that the liver AD is not sensitive to the interface region, but RL AD is sensitive to the interface and the community needs to establish standards and guidelines for lung segmentation to ensure proper reporting of lung absorbed doses when using VBDM. These findings call for careful consideration of lung dose based on post-therapy Y90 imaging (and to a lesser degree pre-therapy 99m Tc-MAA) for cumulative lung dose calculation as part of repeat treatments where cumulative lung dose is not to exceed 50 Gy. Patient 135
158 respiratory motion further degrades the effective spatial resolution at the liver-lung interface because motion correction techniques are not available in commercial SPECT/CT systems. The simulated estimates of accuracy for MC, LD, SK, and SKD around the liverlung interface as a function of LS and spatial resolution FWHM showed that all four VBDM investigated are within 10% of the true liver absorbed dose when deeper than 12 mm from the liver-lung interface; this distance is expected to increase for larger FWHM and lower LS. Using MC, LD, or SKD, a similar accuracy was achieved in the lung when deeper than 39 mm from the interface. SK is not suitable for estimating accurate deep lung absorbed doses, but in the special case where LS is small and FWHM is large, SK may provide accurate estimates in close proximity to the liver-lung interface; this transient accuracy occurs due to SK errors in lung dosimetry cancelling errors due to count spill-in/out at the interface. For the clinical results (tumors, NL, and RL), we have only investigated differences among VBDM in this work. Although we estimated accuracy of VBDM at the liver-lung interface through simulations, we have not performed such simulations for patient data. Future work should include the use of virtual phantoms where the true activity distribution is known followed by imaging simulation and application of VBDM to estimate true accuracy of such methods in patients. Some have argued that LD may be preferable to transport (SK, SKD, or MC) for pure-beta emitters such as 90 Y 122 ; radiation transport spreads 90 Y beta energy deposition locally at ~5 mm scale in soft-tissue. Their rationale is that the finite spatial 136
159 resolution of the imaging system (typically >10 mm in emission imaging) can account for beta radiation transport. However realistic particle transport will depend on tissue type and density (e.g., soft tissue vs. lung). Although not discussed here, the collapsed cone convolution is another VBDM that is accurate at the lung-soft tissue interface for SIRT 60. Our results on accuracy suggest that if one uses VBDM, then to reduce errors in absorbed dose estimates at the interface, the effective spatial resolution (physical spatial resolution and motion blurring) at the liver-lung interface should be minimized. Improvements in SPECT image quality would provide improved voxel-based activity distribution, especially at the liver-lung interface. One limitation of our study stems from the use of a free-breathing CT scan as part of the SPECT/CT scan. Consequently, the contoured liver/lung interface could be from any point of the respiratory cycle. In the analysis of the interface on patient data, the results must be viewed critically since there is not a straightforward method to determine the correct spatial location or a reference volume for the lung. We have only estimated errors in 1D absorbed doses for misplaced activity at the lung-liver interface due to effective spatial resolution, not the change in activity due to incorrect attenuation correction at the interface. Future work could involve analysis with some respiratory motion management such as breath hold, average CT, or 4D-CT. There was also uncertainty in the delineation of the tumor, liver, and lung and registration errors between the diagnostic contrast scan and the attenuation scan from the SPECT. Our RL segmentation methodology was similar to that of Busse et al., who reported that region growing resulted in an average error of 7% for lung mass estimates based on 137
160 free-breathing CT scans of the thorax 178. We would like to point out that the patient data analysis was based on a single SPECT/CT model and customized imaging protocol and segmentation by a single physician using data from our institution. There are limitations to all imaging acquisition and reconstruction protocols. Differences at the liver-lung interface depend on several parameters including spatial resolution, respiratory motion, activity distribution near the interface, free-breathing CT vs average CT vs breath-hold CT, and the corresponding scatter and attenuation compensations during reconstruction. Consequently, the magnitude of the sensitivity of right lung, total liver, and non-tumoral liver absorbed dose to the liver-lung interface may change if PET/CT or a different SPECT/CT acquisition protocol or reconstruction algorithm such as Rong et al. 179 is used. In this work we have investigated differences among four VBDM for tumor, liver, and lung absorbed doses based on a given 90Y bremsstrahlung SPECT/CT imaging technique; the magnitude of the clinical findings in this work may change with different acquisition or reconstruction protocols, but the trends in sensitivity to the interface should hold. Thus, these findings are not restricted to any one specific Y90 image generation technique. SPECT calibration is important for reconstructing quantitative images. We estimated the 95% confidence interval in our self-calibration to be ~10%, based on 25 different patient scans. The purpose of this work was to investigate differences between VBDM, and thus by design the administered activity and total SPECT counts were the same between different VBDM. Therefore, the results of this work are not sensitive to the uncertainties in SPECT self-calibration. 138
161 5.5 Conclusion Voxel-based dosimetry was performed using post-therapy 90 Y bremsstrahlung SPECT/CT. Multiple VBDM (MC, LD, SKD, SK) were investigated and compared to MC for AD for tumor, NL, and RL. Differences were equivalent (<5%) for tumor and NL AD, with SKD agreeing best with MC. Larger differences were found for the RL AD, with LD agreeing best with MC and SK producing dramatically incorrect values deep in the lung. Simulations of the liver-lung interface for multiple effective spatial resolutions and LS were used to estimate nominal distance from the liver-lung interface where accuracy within 10% was achieved deep within the liver, and deep within the lung. Finite spatial resolution was shown to cause RL AD estimates to be sensitive to the liver-lung interface region. 139
162 Chapter 6: Absorbed dose response for hepatocellular carcinoma (HCC) tumors based on post-therapy 90Y SPECT/CT 6.1 Introduction Liver cancer accounts for 748,000 new cancer cases every year making it the 6th most diagnosed cancer throughout the world 71,72. It is almost always fatal, with survival rates on the order of a few percent; liver cancers are estimated to cause 696,000 deaths per year globally - trailing only the number of deaths from lung (1,380,000) and stomach (738,000) cancers. 72 Consequently, investigations to improve the efficacy of liver-directed therapies is of the utmost importance for the global population. Radioembolization is currently a promising palliative therapy for both hepatocellular carcinoma (HCC) and metastatic colorectal cancer in the liver 149,154,155,180. Unfortunately, package insert dosimetry models used clinically (body surface area (BSA), single compartment MIRD (STD), and three compartment partition model MIRD (PM)) are very simplistic and have several limitations. The limitations range from not being patient specific for BSA to not separating tumor and non-tumoral liver for STD, and the PM s inability to handle multiple tumors with variable tumor to normal liver uptake ratios. Voxel-level dosimetry overcomes many of the limitations in current clinical dosimetry models. Furthermore, linear quadratic radiobiological modeling that incorporates dose rate effects, repair kinetics, and radiosensitivity may be applied to compute a biological effective dose (BED) 46,121,161,181 from 90 Y microsphere absorbed 140
163 dose. The BED can then be transformed to an equivalent 2 Gy per fraction absorbed dose (EQD2) 182, which is the fractionation scheme for the majority of published radiation therapy tumor and normal tissue response data. Such transformations may yield additional insight into differences between radioembolization and external beam; the BED or EQD2, in theory, will enable clinicians to use the large amount of response data generated in radiation oncology. 99m Tc MAA is not a perfect surrogate for 90 Y microspheres, and the concordance rate between the 99m Tc MAA treatment planning SPECT and the post therapy 90 Y SPECT or PET scan has been investigated by several authors 121,171, The lack of concordance may be due to several factors, including: changes in the tumor vasculature; flow dynamics during delivery; catheter positions; the size, shape, and number of MAA relative to microspheres; and the biological breakdown of MAA once infused. Given the potential lack of concordance, tumor dose response should be investigated using an estimate of the therapeutic activity distribution based on posttherapy imaging and not pre-therapy planning images. The objective of this work was to retrospectively investigate HCC tumor dose response on patients treated with glass microspheres with voxel-level dosimetry based on post-therapy 90 Y bremsstrahlung SPECT/CT. To accomplish the objective, response criteria (RECIST, WHO, modified RECIST) were modeled as a univariate function of a single dosimetric quantity for each of the following: mean voxel-level absorbed dose, multiple dose volume histogram (DVH) coverage parameters, mean voxel-level BED, and multiple BED DVH coverage parameters. 141
164 6.2 Methods & Materials Patient Data This retrospective study was approved by the University of Texas MD Anderson Cancer Center Institutional Review Board (protocol DR ). Twenty-one patients with HCC were treated with glass microspheres using package insert STD dosimetry 186. The average ± standard deviation of administered activity was 3.15 ± 1.22 GBq with a minimum of 1.13 GBq and maximum of 7.47 GBq. Post-therapy imaging was performed using quantitative bremsstrahlung SPECT/CT on a Siemens Symbia T6 with attenuation, scatter, and geometric resolution compensations, and self-calibration 174. All registration and segmentation was performed using MiM Maestro v6.5. The CT portion of the post-therapy SPECT/CT was rigidly registered with a diagnostic contrast enhanced CT or MRI. An interventional radiologist segmented the total liver and right and left lobe volumes of interest (VOI), using the CT from the post-therapy SPECT/CT; up to three tumors were delineated using the registered diagnostic scan to aid tumor localization on the CT from posttherapy SPECT/CT. In total, 37 tumors were segmented. Normal liver was segmented by subtraction of the tumors from the total liver. Normal left or normal right lobe was created in a similar manner Response Criteria Follow-up diagnostic scans were performed every 3 months after therapy. Response was assessed on the 3 or 6 month scans. The following criteria were used to determine response: 1) response evaluation criteria in solid tumors (RECIST) 187,188 ; 2) 142
165 world health organization (WHO) 189 ; and 3) modified RECIST (mrecist) 190. RECIST looks at changes in the longest diameter (1D), whereas WHO is the product of the longest diameter and corresponding perpendicular diameter (2D). RECIST and WHO are both anatomic morphological response metrics based on size. mrecist incorporates necrosis, which appears as non-enhancing portions of the HCC tumor on follow-up contrast CT imaging, into the evaluation of response. Differences between RECIST and WHO are shown graphically in Figure 1 in the review by Suzuki et al 191, and the difference between RECIST and mrecist for HCC is clearly demonstrated in Figure 1 of Lencioni and Llovet 190. The European Association for the Study of the Liver (EASL) response criteria 192 was not investigated in this study; it is a two-dimensional (similar to WHO) measurement that accounts for necrosis, non-enhancing HCC tumor regions on follow-up contrast CT imaging. Tumor response was initially classified as either progressive disease (PD), stable disease (SD), partial response (PR), or complete response (CR). Due to the low number of tumors investigated, the classifications were coarsened to non-responders (NR = PD+SD) and responders (R = PR + CR) Dosimetric Quantities Voxel-level absorbed dose and biological effective dose Voxel-level dose calculations were carried out with the EGSnrc 128 user code DOSXYZnrc 127. Previous work 139 by our group describes the process in more detail. The voxel-level absorbed doses were converted to BED assuming continuous 143
166 irradiation (τ1 2 eff = 64.1 h) for the linear quadratic model, with α of 15 Gy and 2.5 Gy β and repair half-lives (τ1 repair) of 1.5 h and 2.5 h for HCC tumors and normal liver 2 tissues, respectively. The BED formalism detailed by Prideaux et al 46 was followed in this work, and the radiobiological parameters for HCC were taken from Tai et al 193. The average absorbed dose and average BED were reported for each tumor DVH and BEDVH metrics Cumulative absorbed dose volume histograms (DVH) and cumulative BED DVH (BEDVH) were calculated from the corresponding voxel-level distributions. In addition to the mean absorbed dose (mean D) and mean BED, coverage metrics from both were extracted: D70, D90, BED70, and BED90. DXX and BEDXX should be interpreted as the absorbed dose or BED that covers XX percent of the given VOI volume. For example, D0 is the maximum absorbed dose, and D100 is the minimum absorbed dose. D90 represents the absorbed dose that encompasses 90% of the VOI volume Data Analysis Summary data All analysis was performed in the R statistical computing environment 164 version The number of responders for each response criteria were tabulated. Distributions of responders and non-responders were summarized in box plots. A twotailed t-test with unequal variance ($ output <- t.test(dose_responder,dose_ nonresponder)) was applied to test if the mean of responder and non-responder distributions were different at a 0.05 level of significance; multiple dosimetric quantities were investigated. 144
167 Logistic Regression Univariate logistic regression was applied to generate HCC tumor dose response curves and included 95% confidence intervals. Odds ratios, 95% confidence interval for odds ratios, Wald test p-values, and the p-values from likelihood ratio tests were performed. Statistical significance at the 0.05 level is assumed. In addition, the dosimetric value that yielded 50% chance of response (d 50% ) and the normalized doseresponse gradient (γ 50% ) were also reported, as these are common in the doseresponse literature 194,195. Further explanation of logistic regression is contained in the appendix. Tabulated values were calculated according to the following R code: $ output <- glm(response~dose, family=binomial(link= logit )) $ OR_95CI <- exp(cbind(or=coef(output), confint(output))) $ OR_95CI <- OR_95CI["xi",] $ WaldPVal <- (summary(output))$coefficients["xi","pr(> z )"] $ LLRpvalue <- with(output, pchisq(null.deviance - deviance, df.null - df.residual, lower.tail = FALSE)) The variable response is a vector consisting of the values R or NR, and it has a length equal to the number of tumors. The variable dose is a vector the same length of response and contains the dosimetric value for each tumor. This process was repeated for different dosimetric values. As a result, the dose variable would contain corresponding mean D, D70, D90, mean BED, BED70, or BED90. Fit curves and 95% confidence bands were generated based on the values output by the following R code: $ output <- glm(response~dose, family=binomial(link="logit")) $ x <- seq(mindose,maxdose,1) $ pmodel <- predict(output, list(response=x), type="link", se.fit=true) 145
168 $ y <- plogis(pmodel$fit) $ yll <- plogis(pmodel$fit - (1.96 * pmodel$se.fit)) $ yul <- plogis(pmodel$fit + (1.96 * pmodel$se.fit)) Receiver operating curve Receiver operating curves were generated using the proc 196 library in R. Area under the curve and its 95% confidence interval were calculated for each response metric for the dosimetric quantities. A best threshold dosimetric quantity was also selected and the corresponding specificity and sensitivity was tabulated. The ROC values were generated with the following R code: $ rocobj <- roc(response,dose, percent = TRUE) $ aucarr <- ci.auc(rocobj) $ aucll <- aucarr[1] $ auc <- aucarr[2] $ aucul <- aucarr[3] $ bestthresh <- coords(rocobj, "best") $ thresh <- bestthresh[1] $ SP <- bestthresh[2] $ SE <- bestthresh[3] 6.3 Results Box plots, t-tests, and summary of dosimetric quantities Figure 30 shows the responders and non-responders in boxplots for mean, 90% coverage, and 70% coverage for both absorbed dose and BED. In general, WHO and RECIST produced similar distributions. Compared to mrecist, WHO and RECIST have non-responders with larger values for dosimetric quantities; these can be seen as points beyond the whiskers on the box plots. For the response metrics shown, the 146
169 responder median dosimetric quantity was greater than the corresponding nonresponder distribution. 147
170 Figure 30. Boxplots summarizing the mrecist, WHO, and RECIST tumor responders (R) and non-responders (NR) for mean absorbed dose (a), mean BED (b), D90 (c), BED90 (d), D70 (e), and BED70 (f). The summary of responder and non-responder, and corresponding p-value from the t-test are listed in Table 21. The results show that only mrecist criteria provided statistically significant different means in the responder and non-responder for all the voxel-level dosimetric quantities investigated (both absorbed dose and BED). The mean of the responder distribution was greater than the non-responder distribution for all response criteria investigated. BED values were always larger in magnitude than the corresponding absorbed dose values. 148
171 Dosimetric quantity Response criteria Non-responder Distribution Responder Distribution (Gy) (Gy) mean sd min max mean sd min Max Dmean D mrecist D BEDmean BED BED Dmean D D WHO BEDmean BED BED Dmean D D RECIST BEDmean BED BED p-value 149
172 Table 21. Summary of the dosimetric quantity responder and non-responder distributions and the corresponding p-value of t-test between the two distributions for mrecist, WHO, and RECIST response criteria Logistic Regression The summary of the logistic regression is listed in Table 22. The odds ratios for all regressions were greater than unity, indicating that a unit increase of the dosimetric quantity results in an increase of the odds by a constant factor, but statistical significance was only found for mrecist response criteria. 150
173 Dosimetric quantity Response criteria Odds Ratio 2.5% Odds Ratio 97.5% Odds Ratio Wald p-value Likelihood ratio p-value Dmean <0.001 D mrecist D <0.001 BEDmean <0.001 BED BED <0.001 Dmean D D WHO BEDmean BED BED Dmean D RECIST D BEDmean BED BED
174 Table 22. Summary of logistic regressions for predicting response criteria from dosimetric quantities. The logistic regression fits with corresponding 95% confidence intervals are plotted in Figure 31. Plots with WHO criteria were omitted because they are similar to the RECIST plots shown. The other coverage metrics were not shown because they are also similar to the mean plots shown. To achieve a 50% chance of mrecist response, the mean absorbed dose is 115 Gy, while the mean BED is 175 Gy. The probability of a 50% chance of RECIST response doesn t change much over the range of mean absorbed dose or mean BED, and this is consistent with not finding statistically significant regressions as determined by the likelihood ratio. 152
 & (b) and mean BED (c) & (d)")
175 Figure 31. Logistic Regressions for the mean absorbed dose (a) & (b) and mean BED (c) & (d) for mrecist response criteria (a) & (c) and RECIST (b) & (d). The 153
176 dashed line represents the fit from the regression. The shaded area represents the 95% confidence interval. Responders are jittered as points near the top of the plots, while non-responders are near the bottom. Both RECIST and WHO did not have statistically significant regressions with dosimetric quantities investigated Receiver Operating Curve Table 23 summarizes the ROC analysis performed. Excluding the threshold values, ROC results for the mean absorbed dose, D90, and D70 are match the corresponding BED quantities well. Using the dosimetric quantities with mrecist, specificity approaches 100% while the sensitivity is approximately 70% for the thresholds chosen. The AUC for mrecist is higher than both WHO and RECIST. The AUC for WHO and RECIST were very similar. Figure 32 shows the ROC curves, including thresholds, for the same quantities depicted in Figure
177 Dosimetric quantity Response criteria RECIST WHO mrecist AUC 2.5% AUC 97.5% AUC best Threshold (Gy) Threshold specificity Threshold sensitivity Dmean D D BEDmean BED BED Dmean D D BEDmean BED BED Dmean D D BEDmean BED BED70 Table 23. Summary of ROC analysis for the response and dosimetric quantities investigated. 155
 & (b) and mean")
 & (d). The solid line represent the ROC.")
178 Figure 32. ROC curves for the mean absorbed dose (a) & (b) and mean BED (c) & (d) for mrecist response criteria (a) & (c) and RECIST (b) & (d). The solid line represent the ROC. The shaded region represents the 95% confidence interval 156
179 for the ROC. The area under the curve is indicated on the plots, and the best threshold is circled with corresponding specificity and sensitivity. Both RECIST and WHO shapes were similar with large confidence intervals. 6.4 Discussion In this retrospective study we have compiled data showing that disease specific response criteria mrecist can be used to separate responders and non-responders according to voxel-level absorbed doses or biological effective doses. This is not entirely surprising given that mrecist, relative to WHO and RECIST, has shown better correlation with overall survival and progression-free survival in HCC patients treated with transarterial chemoembolization Thus, the fact that statistically significant correlations of absorbed dose with mrecist were found is encouraging, because from basic radiobiology we expect the probability of tumor response to increase as the absorbed dose increases. More specifically, this is one of the first works to generate absorbed dose-response curves for HCC treated with glass spheres using post-therapy 90 Y bremsstrahlung SPECT/CT. The majority of the response literature to date has been performed using the planned 99m Tc MAA SPECT/CT 150,152,155,156,161. Emission image quality, primarily driven by spatial resolution, patient motion near the liver dome, and imperfect scatter corrections, is currently the limiting factor in voxel-level dosimetry. Due to such limitations, it is unlikely that a voxel-level absorbed dose calculated on a post-therapy SPECT or PET would equal a pre-therapy voxel- 157
180 level absorbed dose. Although image quality will continue to improve, in the interim the community needs to further investigate and determine appropriate methods for mapping voxel-level dosimetric quantities between bremsstrahlung, PET, and MAA 99m Tc. The dose response curves generated in this work are likely specific to our posttherapy imaging protocol due to the image quality limitations. However, such curves may still be very useful to clinicians and patients. Given that the current clinical standard of practice requires prescribing based on rudimentary package insert dosimetry models, the use of post-therapy dosimetry with prediction of tumor response may be beneficial to a select number of patients and change their management. For example, if a tumor is judged not likely to respond then an additional therapeutic procedure could be suggested or performed. Furthermore, in the context of valuebased medicine, predicted response probabilities based on post-therapy imaging could be used as a quality metric. The distribution of responders ( jitter points near top of the plots in Figure 31) and distribution of non-responders (jitter points near bottom of the plots in Figure 31) aren t that different between mrecist and RECIST; the only noticeable difference is a few non-responders with large mean absorbed dose or BED compared to mrecist. Given that tabulated data were trending towards RECIST and WHO being predictive or response, it is possible that a larger sample size will demonstrate statistical significance. It is encouraging for mrecist response criteria that the higher absorbed doses were assigned as responders taking into consideration that larger absorbed 158
181 doses should provide more tumor cell killing which can lead to necrosis with the breakdown of peripheral vasculature. In addition to the dose-response curves, the ROC analysis in this work was performed to investigate how well (specificity, sensitivity) various thresholds separate responders from non-responders for a given dosimetric quantity. The corresponding AUC values can be useful in determining the dosimetric quantity that best discriminates between responder and non-responder. There is no discernible difference between using an absorbed dose metric or a biological effective dose metric for gauging any of the response criteria. In other words, it doesn t appear that biological effective dose has an advantage for predicting mrecist, WHO, or RECIST relative to physical absorbed dose. However, the BED may be prove to be more useful in fractionated administrations, combinations of radiotherapy 161, or comparing external beam with 90 Y microsphere therapy. This was a retrospective study based on a limited sample size. Future work should increase the number of patients and tumors evaluated. Only univariate regressions were performed, but there is additional information (demographics, pathology, functional imaging, etc.) that may be incorporated to create an improved response model. 6.5 Conclusion Both absorbed dose and biological effective dosimetric quantities were able to predict mrecist response. Dose response curves were generated for HCC tumors. These curves are likely specific to our institution and imaging protocol. Thus future work 159
182 should increase the number of tumors and test the robustness of the dose response curves. 160
183 Chapter 7: Discussion 7.1 Summary This work had two main goals: 1) to demonstrate that a deterministic grid-based Boltzmann solver (GBBS) can be used for voxel-level absorbed dose calculations with accuracy comparable to Monte Carlo (MC) and 2) to assess the value of voxel-level absorbed dose calculations for 90 Y microsphere patients. The first goal was tested using specific aims one (Chapter 2) and two (Chapter 3). Specific aim one matched scoring geometry (voxels) between the GBBS and MC in soft-tissue, lung, and bone. Classic voxel-s-value geometry was extended to interface geometry where absorbed dose differences were comparable to those in uniform media, which were approximately 6% between GBBS and Monte Carlo for 90 Y and 131 I. Specific aim 2 showed that the use of adaptive tetrahedral meshing, decreasing angular quadrature order, and increasing electron energy transport cuts for the GBBS on 90 Y microsphere and 131 I patient SPECT/CT s enabled fast (<10 minutes) and accurate (mean absorbed doses within 5% of MC and cumulative GBBS DVHs overlaid MC DVHs) absorbed dose calculations on a desktop computer. Adaptive meshing was necessary to reduce the GBBS s memory requirements, as using 6 tetrahedrons per voxel throughout the entire scan led to unacceptable memory requirements and computation times. The clinical value of voxel-level absorbed doses for 90 Y microspheres was investigated in specific aim 3 in Chapters 4, 5, and 6. Chapter 4 quantified differences 161
184 between single compartment MIRD (STD), three compartment partition model MIRD (PM), and Monte Carlo voxel-level absorbed doses (MC). This was on performed on post-therapy 90 Y bremsstrahlung SPECT/CT using identical volumes of interest as input to each dosimetry model for each patient. Bootstrapped linear regressions were performed to empirically quantify bias (slope & intercept) and uncertainty (95% prediction intervals) in transforming the STD and PM absorbed doses to mean MC voxel-level absorbed doses. The STD was unable to predict MC tumor doses. Uncertainties in predicted MC tumor absorbed doses from PM ranged from ± 46 Gy for single tumor cases with no TNR variability to ± 140 Gy for multiple tumor cases with TNR variability. Both STD and PM were able to predict non-tumoral liver absorbed doses with uncertainties in the predicted MC absorbed dose of ± 23 Gy and ± 18 Gy, respectively. PM TNR variability caused a large change in the bias as indicated by the slope changing from 0.56 to 0.34 when mapping PM to MC for multiple tumors. Chapter 5 investigated multiple voxel-level dosimetry methods for 90 Y microsphere therapy. Differences in absorbed doses to tumors, liver, and at the liverlung interface between MC, soft tissue kernel (SK), soft tissue kernel with density correction (SKD), and local deposition (LD) were reported. SKD, SK, and LD were within 5% of MC for tumor and non-tumoral liver mean absorbed doses. LD and SKD overestimated right lung absorbed dose compared to MC on average by 17% and 20%, respectively. SK underestimated the right lung absorbed dose on average by -60% due to the assumption of soft tissue density in lung. An interesting result of the study suggests that the community needs to be very careful about interpreting lung absorbed doses, which can often limit the amount of administered activity. The absorbed dose to 162
185 lung was sensitive to lung segmentation near the liver-lung interface. Excluding 1, 2, and 3 cm of the right lung near the liver-lung interface changed the resulting mean right lung absorbed dose by -22%, -38%, and -48% respectively. In Chapter 6, an interventional radiologist (AM) segmented multiple hepatocellular carcinoma (HCC) tumors on post-therapy 90 Y bremsstrahlung SPECT/CT with the aid of a registered diagnostic scan. Tumor response was assessed using RECIST, WHO, and modified RECIST criteria. Logistic regressions were performed to generate HCC tumor-response curves as a function of mean MC voxellevel absorbed doses, DVH metrics (D0,D10, D90,D100), mean MC biological effective dose (BED), and BED DVH metrics (BEDVH0, BEDVH10, BEDVH90, BEDVH100). The results showed that MC mean, BED mean, DVH metrics, and BEDVH metrics all could be used to predict modified RECIST response. This is an important contribution because it 1) provides an absorbed dose that can be transformed into a planning target absorbed dose for a given probability of tumor response and 2) it provides a mechanism to predict tumor response the day after therapy, and this enables the physician to prescribed other treatment options if probability of response is deemed too low. The hypothesis of this work was a deterministic grid-based Boltzmann solver can calculate voxel-level absorbed doses for nuclear medicine applications within 5% of Monte Carlo. Data obtained from the low-level benchmarking in aim 1 do not support the hypothesis. Differences between the GBBS and MC were slightly outside the 5% range; they were 6% for 90 Y and 131 I and slightly larger (7% to 15%) for monoenergetics 163
186 with decreasing energy. To decrease this to within 5%, further investigation of the energy reaction rate calculated by the cross-section generating code is suggested. Data obtained from patient calculations in specific aim 2 support the hypothesis with mean voxel-level absorbed doses agreeing within 5% and differences between dose volume histograms metrics agreeing within 5%. The value of voxel-level absorbed doses for 90 Y microspheres was demonstrated by 1) highlighting limitations, including large inherent variability, in current clinical dosimetry models, 2) showing small differences between voxel-level absorbed dosimetry methods in the liver, and 3) generating dose response curves for hepatocellular carcinoma tumors. 7.2 Listed Contributions of this Dissertation Physics Contributions 1) Identification of missing auger and conversion electron emissions in freely available voxel-s-values. 2) Low-level benchmarking of GBBS in nuclear medicine regime. 3) Methodology for adaptive tetrahedral meshing based on SPECT/CT to enable fast and accurate GBBS absorbed doses in patients Clinical Contributions 164
187 1) Demonstration of large potential differences (factor of 2) between clinical dosimetry models and voxel-level absorbed doses. The partition model was shown to have large variability based on single sphere sampling of normal liver for TNR estimation, and the single compartment model was not predictive of tumor absorbed doses. 2) MC, SKD, SK, and LD were all equivalent in the liver, but large differences can exist in the lung. Furthermore, we quantified sensitivity of lung absorbed dose to the liverlung interface. Specifically, the mean right lung absorbed dose can changes by up to - 48% when excluding 3 cm of the lung near the interface. 3) Absorbed dose response curves were generated for HCC tumors using post-therapy 90 Y bremsstrahlung imaging. 7.3 Future Directions Opportunities for the GBBS unique to radioembolization and nuclear medicine Much value has been added to radiation oncology through the use of more accurate radiation transport. Furthermore, having the ability to harness accurate transport in a clinically feasible time frame is important for practical applications. This will likely also be the case for radioembolization and nuclear medicine. The main goal of this work was to introduce the GBBS to the nuclear medicine community. Consequently, there are several optimization opportunities that have not 165
188 been fully or rigorously explored. First, a more rigorous optimization for runtime and accuracy for each radionuclide can be performed by varying energy group structure (bin edges, bin widths), energy and spatially dependent angular quadrature order (SN) and scattering order (PN), and tetrahedral meshing. Second, combining all electron sources (Auger, conversion electrons, betas) and photon sources (gammas, x-rays) into a single source compatible with the GBBS should be implemented to improve calculation times. Given that the benchmarking study of the GBBS compared to MC showed absorbed dose differences up to approximately 15% at low energies (10 kev), investigation of the cross-section generating code ZERKON and CEPXS 68 is warranted. Specifically, the energy reaction rates used to convert scalar flux to absorbed doses should be studied. The deterministic GBBS does not have to be used alone. Instead, a hybrid deterministic-stochastic transport approach can be taken to solve problems. One example of such a hybrid approach is using the GBBS to generate weight windows for variance reduction in MC for both absorbed dose calculations and imaging simulations. This dissertation applied the GBBS to reconstructed patient scans, but the GBBS can be applied even earlier in the process. Thus, using the GBBS as a forward projector during reconstruction should enable more accurate scatter estimates and allow for absorbed dose rate calculations simultaneously because the GBBS solves for the angular flux throughout space. For example, the GBBS has recently shown such improvements in scatter modeling when incorporated into cone beam CT 166
189 reconstructions 202. In addition, there is much concern over absorbed doses from diagnostic scans, and returning an absorbed dose map with the reconstructed image would 1) show physicians and patients their spatial absorbed dose estimates and 2) aid in the long term study of radiation induced cancers by providing more accurate absorbed dose maps that can be accumulated over time. Biological effective doses depend on absorbed dose rate. The GBBS is an iterative solver, and this may be advantageous with multi-time point data. There is likely to be some spatial correlation between multiple time points when acquiring emission scans to determine kinetics for therapeutic procedures. Thus, the GBBS may be used to calculate absorbed dose rates at the multiple time points using an initial solution based on the solved angular flux from the previous time point. Such an approach may yield faster computations for later time points. Another area of investigation should include the use of the GBBS for pairedtransport techniques to improve modeling of response. The GBBS solves for the angular flux throughout space. The energy spectra at a given spatial location can be coupled to a lower-level model. For example, in bone, mapping the spectra to a marrow source and trabecular bone surface source 203,204 may offer some improvements in modeling hematological toxicities. 167
190 7.3.2 Continued translation of Radiation Oncology methods to radioembolization and nuclear medicine The work in this dissertation can be broadly described as translating radiation oncology methods to 90Y microspheres and nuclear medicine. It makes sense to generate dose-response curves for both tumor and normal liver with the uncertainty in concordance between MAA and 90 Y scans removed, but providing a useful and predictive planning tool could benefit patients tremendously. This work only investigated results from post-therapy bremsstrahlung SPECT/CT. Closing the feedback loop and producing correlations with treatment planned 99 Tc MAA SPECT/CTs need to be studied to make a more useful tool for clinicians. Specifically, absorbed dose response curves generated with post-therapy imaging should be transformed to the planned absorbed doses based on MAA. One of the largest uncertainties in radiation oncology is tumor segmentation. It is likely that such uncertainties will also be important for 90Y microsphere therapies when implementing an anatomic segmentation on contrast CT or MRI. The sensitivity of reported absorbed doses to segmentation uncertainties (inter and intra user variability) needs to investigated. Absorbed dose gradients, compared to external beam, are larger in 90Y microspheres and nuclear medicine, so the effect may be quite large. Simple methods from radiation oncology can be applied to 90Y microspheres. For example, minimizing the time between planning SPECT/CT and administration. There are logistics involved requiring the ordering of microspheres depending on glass 168
191 or resin. Similar to sealed source LDR brachytherapy, real-time planning and administration may be possible. The use of image registration to objectively reproduce catheter tip position between the MAA and administration of microspheres may increase the concordance rate of MAA and 90Y distributions. Registration of planned and treatment-day fluoroscopic images or cone beam CT may be aided by implanting a radiopaque fiducial in the hepatic artery during planning. Current SPECT and PET image acquisitions are 20 minutes to 1 h in duration. This means there is 1) anatomic mismatch between the single time point CT used in the iterative reconstructions, and 2) the activity concentration is blurred out in the liverlung interface dependent on the magnitude of the motion. Being able to deconvolve this motion blurring will help provide more accurate quantitative inputs. Applying respiratory management techniques (4DCT, cinect, etc) from Radiation Oncology to SPECT and PET acquisitions should be investigated. Voxel-level absorbed doses from either 90 Y microspheres or therapeutic nuclear medicine procedures may allow for combinations with external beam or sealed source brachytherapy from radiation oncology. Generating biological effective doses and corresponding equivalent absorbed dose in 2 Gy per fraction for tumors and normal liver will aid in implementing such a method. In such a treatment combination, the microspheres can be administered and then post-therapy imaging can be used to determine if tumors were undertreated or had a low probability of response. Given this information, a boost from radiation oncology can be planned. In theory, this is possible because the 90 Y therapy has 1) decreased the effective target size and 2) decreased 169
192 the amount of absorbed dose that needs to be delivered. Investigating the feasibility of this approach needs to be studied. 170
193 Appendix A1: Estimating the in-vivo accuracy of local deposition approximation and Monte Carlo for 90Y absorbed dose calculations in tissue as a function of voxel size and spatial resolution. A1.1 Introduction In the current state of emission imaging for both PET and SPECT, several authors have shown that the complete local deposition (LD) of energy in the voxel divided by the mass of the voxel is an excellent approximation to Monte Carlo (MC) absorbed doses in the liver or soft-tissue. The accuracy of the approximation will depend on 1) the voxel size, with smaller voxel sizes allowing more betas from the 90Y to escape, and 2) the spatial resolution used to image the in-vivo activity distribution, which transports activity outside the source voxel also known as partial volume effect. In uniform distributions, voxels that are more than 1.28 FWHM from an edge will be in equilibrium and not suffer from partial volume or misplacing of the activity. A1.2 Methods & Materials For the 1, 2, 4, 8, 16, 32, and 64 mm voxel sizes we performed the following steps: 1) A blank activity volume was generated matching the voxel size selected 2) 90 Y was uniformly distributed in the central voxel 3) DOSXYZnrc MC simulation was performed in soft tissue and the resulting absorbed dose in the source voxel was taken as the true absorbed dose (MC_0). 171
194 4) Local Deposition was calculated in the source voxel (LD_0). 5) For 1, 2, 5, 10, and 20 mm FWHM the following was performed: 5a) Apply a Gaussian blur with FWHM to the activity distribution in 2 above to generate a blurred distribution. 5b) Perform MC simulation and record absorbed dose in source voxel on the blurred distribution to obtain MC_FWHM. 5c) Calculate LD using the blurred distribution to obtain LD_FWHM Percent difference curves were then plotted by calculating: 100 (X MC_0) MC_0 where X=LD_FWHM or MC_FWHM. 172
195 A1.3 Results The percent difference curve is plotted in Figure 33. For large spatial resolutions LD and MC track each other very closely over all voxel sizes investigated. The difference between LD and MC becomes more pronounced at smaller voxel sizes and smaller FHWM. LD eventually overestimates the absorbed dose by 40% for 8 mm voxels with a 1 mm FWHM, the error becomes even more positive for smaller voxel sizes. For clinical PET imaging, perhaps a voxel size of 2 mm is used with a FWHM of 5 mm. In this regime, errors are dominated by the spatial resolution. LD_5 does marginally improve the agreement from -90% to -80%. Results are similar for MAA SPECT imaging with a voxel size of 4 mm and FWHM of 10 mm. It is important to note that this analysis is only for the source voxel in a single unrealistic geometry. 173
196 Figure 33. Absolute percent differences from the truth for local deposition (solid curves) and MC (dashed) are plotted for multiple spatial resolutions (FWHM=1 mm (green), 5 mm (red), 10 mm (orange), and 20 mm (purple)). The percent difference for each calculation is relative to the corresponding voxel size MC simulation with no spatial blurring. MC_0 is not shown because it is the truth. 174
 as a function of an individual dosimetric quantity (mean absorbed")
197 A2: Explanation for the rationale, implementation strategy, and interpretation of logistic regression parameters for dose-response curve. In Chapter 6 of this dissertation, I used univariate logistic regression to predict HCC tumor response (1=response, 0=no response) as a function of an individual dosimetric quantity (mean absorbed dose (D), D70, D90, mean BED, BED70, BED90) associated with the tumor. Linear regression would be the simplest first choice for predicting the response, and the linear regression of mrecist response as a function of mean D is shown below in Figure 34. Figure 34. Linear regression of mrecist tumor response as a function of mean tumor absorbed dose. Notice how the line does not fit the tumor response data well. In addition, the line continues to +/- infinity whereas the response is bounded between 0 (non-responder) and 1 (responder). 175
198 Linear regression is intended for predicting a continuous dependent variable, and not a discrete (binary in this case) dependent variable. If we now bin the data to estimate the probability of response (R/(NR+R)) in each bin and perform a linear regression of the probability of response as a function of mean D at the center of each bin (Figure 35), then the corresponding linear regression will be more appropriate because we are now predicting a continuous variable (probability of response). The slope from the resulting linear regression shows that a unit increase in mean D causes a constant increase of the probability of response. However, the predicted probability still goes beyond the accepted limits of 0 and 1. An additional limitation of this approach is a binning scheme must be employed and the corresponding estimated probabilities may be sensitive to the binning. Figure 35. Linear regression of the binned (5 bins) probability of mrecist tumor response as a function of mean tumor absorbed dose. Unfortunately, using linear regression still causes the predicted probability to extend beyond 0 and 1; the selection and sensitivity of bin edges to determine the fraction of responders 176
199 is also problematic. Notice how the linear fit performs better on the probability of response from binned data compared to the pure binary response data shown in Figure 34. There are several functions that follow a sigmoidal shape and can be used to model response including Poisson, logistic, and probit 195. In this work, I employed the logistic function, shown below, which has the following properties: 1) lim x + p(x) = 1 2) lim x p(x) = 0 3) p(x) ε [0,1] x ε (, + ) p(x) = ex 1 + e x = e x When modeling a binary response probability as a function of continuous variable, the logistic function transforms/maps the continuous input variable, x, to a continuous probability that ranges from 0 to 1. Notice how using the logistic function solves the issue encountered with linear regression of binned probabilities: mapped/transformed probabilities no longer go below 0 or above 1. The next step is to find the coefficients (β 0, β 1 ) that make the pairs of mean D and response the most likely to have occurred. This is done through maximum likelihood estimation. The maximum likelihood estimation provides values of β 0 and β 1 given the pairs of data, and the resulting logistic function is shown below: 1 p(d) = 1 + e (β 0+β 1 d) 177
200 Regarding interpretation of the β 0 and β 1 obtained from maximum likelihood estimation, we start with the realization that the absorbed dose given by β 0 β 1 corresponds to a 50% probability of response. p ( β 0 β 1 ) = e (β 0+β 1 β 0 β 1 ) = e 0 = 0.5 Next, I derive the odds, log odds, and their corresponding ratios starting from the logistic function: 1 p(d) = 1 + e (β 0+β 1 d) (1 + e (β 0+β 1 d) ) p(d) = 1 (e (β 0+β 1 d) ) p(d) = 1 p(d) e (β 0+β 1 d) = 1 p(d) p(d) e (β 0+β 1 d) = e β 0e β 1d = p(d) 1 p(d) = ODDS(d) This last equation represents the odds: the ratio of the probability of response (p(d)) to the probability of no response (1 p(d)). The log odds is calculated by taking the logarithm of both sides: β 0 + β 1 d = ln ( p(d) ) = ln (ODDS(d)) 1 p(d) To get to the log odds ratio, I start with the difference between the log odds at d+1 and the log odds at d, and then show the interpretation for β 1 : (β 0 + β 1 (d + 1)) (β 0 + β 1 d) = ln(odds(d + 1)) ln(odds(d)) 178
201 ln(odds(d)) + β 1 = ln(odds(d + 1)) ODDS(d + 1) β 1 = ln ( ) ODDS(d) This expression shows that the coefficient, β 1, from the logistic regression is equal to the log of the ratio of the odds at d+1, p(d+1) p(d), to the odds at d,. This is known as 1 p(d+1) 1 p(d) the log odds ratio. The equation preceding it shows that increasing the dose by a single unit, regardless of the dose level, changes the log odds by a constant, β 1. Exponentiating each side of the equation yields: e β 1 = ODDS(d + 1) ODDS(d) ODDS(d) e β 1 = ODDS(d + 1) The factor e β 1 represents the odds ratio which is the ratio of the odds at d+1 to the odds at d. Thus, for a single unit increase of d, irrespective of the current dose level, the odds at d+1 will differ from the odds at d by the constant factor e β 1. In the dose response literature 195, dose corresponding to 50% response and a measure of steepness of the curve is often reported. I previously showed the absorbed dose corresponding to 50% chance of response was (d 50% = β 0 β 1 ). Now, I derive the maximum slope of the regression. 1 p(d) = 1 + e (β 0+β 1 d) p (d) = β 1 e (β 0+β 1 d) (1 + e (β 0+β 1 d) ) 2 179
202 p (d) = β 1 2 e (β 0+β 1 d) (1 + e (β 0+β 1 d) ) 3 [1 e (β 0+β 1 d) ] p (d) = 0 [1 e (β 0+β 1 d) ] = 0 e (β 0+β 1 d) = 1 d = β 0 β 1 The slope is maximum at d = d 50% = β 0, and it has a value of β 1. The normalized β 1 4 dose-response gradient, γ = d p (d), is used frequently in the response literature 194,195 to represent the steepness of the curve. It is the product of slope and dose, and it represents the increase in response given a 1% increase in dose 194,195. At d 50%, γ 50% = d 50% p (d 50% ) = β 0 β 1 β 1 4 = β 0 4. Now, we can recast the logistic function in terms of d 50% and γ 50%. 1 p(d) = 1 + e (β 0+β 1 d) p(d) = p(d) = p(d) = e β 0(1+ β 1 β 0 d) e β 0(1 d d 50% ) e 4γ 50%(1 d d 50% ) This parameterization described by Bentzen and Tucker 195 for the logistic regression coefficients (β 0, β 1 ) yields a more intuitive interpretation. d 50% represents the absorbed dose level for a 50% chance of response, and γ 50% describes the steepness of the 180
203 response curve at d 50%. Thus, d 50% shifts the curve left and right, while γ 50% controls how quickly it changes from non-responder to responder; the influence of these parameters is shown in Figure 36. Figure 36. Example logistic functions that have been parameterized by different values of d 50% and γ 50% ; solid (d 50% = 200 Gy, γ 50% = 4), dashed (d 50% = 200 Gy, γ 50% = 1), dotted (d 50% = 100 Gy, γ 50% = 4), dot-dash (d 50% = 100 Gy, γ 50% = 1). Notice how d 50% controls the inflection point location of the sigmoidal curve while γ 50% controls the steepness, or how rapidly it changes from 0 to 1. Figure 37 below shows the dose-response curve for mean absorbed obtained through logistic regression. Notice how the probabilities are between 0 and 1, and the 181
204 parameterization of β 0 and β 1 as d 50% and γ 50% are more intuitive for interpreting the curve. Figure 37. The logistic regression for predicting mrecist given the mean absorbed dose. β 0 = [ 5. 78, 1. 10], β 1 = [0. 009, ] yields d 50% = 118 Gy and a normalized dose-response gradient of γ 50% =
205 Appendix A3: Steps to validate dose-response curve In a retrospective analysis of HCC tumors treated with 90 Y glass microspheres, I generated a dose-response curve shown in Figure 38. How would one go about validating this curve? I list an outline of validation steps below and go into more detail on increasing the sample size after the list. The remainder of items on the list are for future study and are provided as one potential path for validating the 90 Y dose response curve. 1) reduce 95% confidence interval on logistic regression by increasing sample size 2) obtain an independent data set to -validate that a logistic regression using independent data is not statistically significant from the original regression -estimate the true predictive accuracy of the original logistic regression 3) test robustness of acquiring the input data -sensitivity of dosimetric quantity (e.g. mean absorbed dose) - to segmentation of tumors (inter/intra observer variability) - to dose calculation method -assessing response -inter/intra observer variability - contrast CT vs MRI 183
206 - 90 Y SPECT/CT acquisition and reconstruction parameters - 90 Y SPECT/CTvs 90 Y PET/CT - minimum tumor size included in study (confounding variables e.g. volume) - liver and tumor motion due to respiration 4) investigate subsets of patient data, as current patient demographics may be quite heterogeneous - cirrhotic vs non-cirrhotic livers - liver disease stage -prior therapy 5) To exclude selection bias that is common in a retrospective study, prospectively use the dose-response curve to assess its prediction accuracy. 6) Perform a two arm prospective clinical trial where patients are randomly assigned to an additional treatment or control group. Treatment Arm: use the dose-response curve to administer additional activity to boost tumors that are classified as non-responders, Control arm: no additional activity is administered. Compare the tumor response rates between the two arms, with the hope that the treatment arm response rate will be statistically significantly higher than the control arm. 7) Using biological effective doses compare the dose response curve for HCC obtained from 90 Y post-therapy imaging to one from external beam. 184
 of the MAA absorbed dose to the 90 Y SPECT/CT absorbed dose.")
207 8) Generate dose-response curves using the planning image from 99m Tc MAA SPECT/CT and derive a transformation based on physical parameters (spatial resolution, scatter, etc.) of the MAA absorbed dose to the 90 Y SPECT/CT absorbed dose. If the dose-response is real and you investigate a subset of patients with concordant MAA and 90 Y scans under the assumption that MAA is reliable surrogate for microspheres, then a transformation based on physical parameters should exist between the plan and post-therapy scan. Notice that the 95% confidence interval is still quite large given our current data, so the first step would entail reducing that interval. This will be accomplished by increasing the sample size, which is currently N=35. Figure 38. Statistically significant linear regression of modified RECIST criteria as a function of mean absorbed dose. 185
208 To estimate the sample size needed to reduce the 95% confidence interval, I perform simulations that randomly draw from simulated responder and non-responder absorbed dose distributions based on my current distributions. From the current data, responders have a mean of 178 Gy and standard deviation of 110 Gy, while nonresponders have a mean of 80 Gy and standard deviation of 29 Gy. In addition, 45% of the data are responders and 55% are non-responders. When I generate a sample, 45% of the time I will select a responder from Normal(178, 80) and 55% of the time I will select a responder from Normal(80, 29). I will simulate 20, 40, 100, and 1000 samples and apply the logistic regression to the resulting data (Figure 39). From the resulting logistic regressions I calculate d 50% = β 0 /β 1 and γ 50% = β 0 /4 as described by Bentzen and Tucker. 195 I then propagate the standard errors on β 0 and β 1, through to estimate standard errors for both d 50% and γ 50% (Table 24). An alternative to propagating standard errors would have been to perform thousands of simulations with the same number of samples and estimate standard errors from histograms of the quantities of interest (β 0, β 1, d 50%, γ 50% ). se(d 50% ) = ( se(β 2 0) ) + ( β 2 0 β 2 1 β se(β 1)) 1 se(γ 50% ) = ( se(β 2 0) ) 4 186

209 Our data shows that a d 50% around 120 Gy is likely. Decreasing the uncertainty, (standard error), in this value will be important, as currently it is on the order of 50 Gy which is approximately 40%. Applying clinical intuition, an uncertainty on the order of 10 Gy in mean absorbed dose using voxel-level dosimetry on post-therapy imaging would seem reasonable and correspond to just under 8% relative uncertainty. Thus, a future study would require approximately 1000 tumors according to the simulations studies. 187
 β 1 ± se(β 1 ) d 50% ± se(d 50% ) γ 50% ± se(γ 50% ) 20-8.17 ± 3.53 0.060 ± 0.028 136 ± 87 Gy 2.04 ± 0.88 40-3.82 ± 1.21 0.034 ± 0.")
210 Figure 39. Illustration showing how increasing the sample size will decrease the 95% confidence interval in our fit. Clockwise from upper left N=20, 40, 100, and All data were simulated as described previously. N β 0 ± se(β 0 ) β 1 ± se(β 1 ) d 50% ± se(d 50% ) γ 50% ± se(γ 50% ) ± ± ± 87 Gy 2.04 ± ± ± ± 51 Gy ± ± ± ± 37 Gy ± ± ± ± 11 Gy ± Table 24. Data showing how varying the number of samples affects the standard errors on the coefficients and the corresponding d 50% and γ 50%. All data in this 188
8/1/2017. Disclosures. Outline. SAM Imaging Education Course 90Y-Microsphere Therapy: Emerging Trends and Future Directions
 SAM Imaging Education Course Y-Microsphere Therapy: Emerging Trends and Future Directions Matt Vanderhoek, PhD Henry Ford Health System, Detroit, MI Vanessa Gates, MS Northwestern University, Chicago,
Y90 SIRT Therapy Dosimetric Aspects
 Y90 SIRT Therapy Dosimetric Aspects David Chee-Eng Ng MBBS, BSc, MSc, MRCP, FAMS, FRCP (Edin) Head and Senior Consultant, Department of Nuclear Medicine and PET Singapore General Hospital Adjunct Assistant
Review of TG-186 recommendations
 Review of TG-186 recommendations Implementation of advanced brachytherapy dose calculation algorithms beyond TG-43 Rowan M. Thomson Carleton Laboratory for Radiotherapy Physics Carleton University Ottawa
Precision of pre-sirt predictive dosimetry
 International Course on THERANOSTICS AND MOLECULAR RADIOTHERAPY Precision of pre-sirt predictive dosimetry Hugo Levillain Department of Nuclear Medicine Medical Physics Jules Bordet Institute, Université
Calculation methods in Hermes Medical Solutions dosimetry software
 Calculation methods in Hermes Medical Solutions dosimetry software Helena McMeekin MSc. Clinical Applications Scientist, Hermes Medical Solutions MRTDosimetry Scientific Workshop The Principals and Clinical
Chapter 19: Radionuclide Therapy
 Chapter 19: Radionuclide Therapy Slide set of 40 slides based on the chapter authored by G. Flux and Y. Du of the publication (ISBN 978 92 0 143810 2): Nuclear Medicine Physics: A Handbook for Teachers
Quantitative Theranostics in Nuclear Medicine
 Quantitative Theranostics in Nuclear Medicine M. Lassmann Klinik und Poliklinik für Nuklearmedizin Direktor: Prof. Dr. A. Buck Contents What is Theranostics? Potential Targets Basic Principles of Quantitative
Future Needs for Standards in 90 Y Microsphere Therapy. CIRMS 2012 Reed Selwyn, PhD, DABR 24 October 2012
 Future Needs for Standards in 90 Y Microsphere Therapy CIRMS 2012 Reed Selwyn, PhD, DABR 24 October 2012 Objectives I. General Description Microsphere Distribution Product Comparison II. Dosimetry Models
A Real-Time Monte Carlo System for Internal Dose Evaluation Using an Anthropomorphic Phantom with Different Shapes of Tumors Inserted
 A Real-Time Monte Carlo System for Internal Dose Evaluation Using an Anthropomorphic Phantom with Different Shapes of Tumors Inserted J. Wu, S. J. Chang, B. J. Chang, I. J. Chen, J. H. Chiu Health Physics
The Management of Imaging Procedure Dose Nuclear Medicine Dose Indices
 The Management of Imaging Procedure Dose Nuclear Medicine Dose Indices Wesley E. Bolch, PhD, PE, DABHP, FHPS, FAAPM Director, Advanced Laboratory for Radiation Dosimetry Studies Department of Biomedical
Physical Bases : Which Isotopes?
 Physical Bases : Which Isotopes? S. Gnesin Institute of Radiation Physics, Lausanne University Hospital, Lausanne, Switzerland 1/53 Theranostic Bruxelles, 2 Octobrer 2017 Theranostic : use of diagnostic
Dosimetry Optimization System and Integrated Software (DOSIS): a comparison against Fluka code results over a standard phantom
: a comparison against Fluka code results over a standard phantom") Dosimetry Optimization System and Integrated Software (DOSIS): a comparison against Fluka code results over a standard phantom Institute of Physics E. Gaviola - CONICET & LIIFAMIRX - Laboratorio de Investigación
Dosimetry Optimization System and Integrated Software (DOSIS): a comparison against Fluka code results over a standard phantom Institute of Physics E. Gaviola - CONICET & LIIFAMIRX - Laboratorio de Investigación
Nuclear Medicine and PET. D. J. McMahon rev cewood
 Nuclear Medicine and PET D. J. McMahon 150504 rev cewood 2018-02-15 Key Points Nuclear Medicine and PET: Imaging: Understand how Nuc Med & PET differ from Radiography & CT by the source of radiation. Be
Standardization of Radiopharmaceutical Dosimetry
 Standardization of Radiopharmaceutical Dosimetry Jonathon A. Nye, PhD Department of Radiology and Imaging Sciences Emory University SEAAPM 2011 Myrtle Beach, SC Review of Dosimetry Nomenclature Dose Gray
SELECTIVE INTERNAL RADIATION THERAPY FOR TREATMENT OF LIVER CANCER
 SELECTIVE INTERNAL RADIATION THERAPY FOR TREATMENT OF LIVER CANCER SIR-Spheres*: A New Treatment Option for Non-Resectable Liver Tumors Treatment Overview SIRT: Selective Internal Radiation Therapy Concept
A. DeWerd. Michael Kissick. Larry. Editors. The Phantoms of Medical. and Health Physics. Devices for Research and Development.
 Larry Editors A. DeWerd Michael Kissick The Phantoms of Medical and Health Physics Devices for Research and Development ^ Springer Contents 1 Introduction to Phantoms of Medical and Health Physics 1 1.1
Selective Internal Radiation Therapy. Jefferson R. Pagsisihan, MD, DPSNM The Medical City St. Luke s Medical Center
 Selective Internal Radiation Therapy Jefferson R. Pagsisihan, MD, DPSNM The Medical City St. Luke s Medical Center S Selective Internal Radiation Therapy catheter-based liver directed modality for patients
Follow this and additional works at: Part of the Medicine and Health Sciences Commons
 Texas Medical Center Library DigitalCommons@TMC UT GSBS Dissertations and Theses (Open Access) Graduate School of Biomedical Sciences 8-2012 EVALUATION OF THE EFFECTIVENESS OF ANISOTROPIC ANALYTICAL ALGORITHM
Clinical Implementation of patient-specific dosimetry, comparison with absorbed fraction-based method
 Clinical Implementation of patient-specific dosimetry, comparison with absorbed fraction-based method George Sgouros, Ph.D. Russell H. Morgan Dept of Radiology & Radiological Science Johns Hopkins University,
Dose distribution and dosimetry parameters calculation of MED3633 palladium-103 source in water phantom using MCNP
 Iran. J. Radiat. Res., 2006; 4 (1): 15-19 Dose distribution and dosimetry parameters calculation of MED3633 palladium- source in water phantom using MCNP A.A. Mowlavi 1*,A. Binesh 2, H. Moslehitabar 3
SIRT Dosimetry: Sometimes Less Is More
 SIRT Dosimetry: Sometimes Less Is More Navesh K. Sharma, DO, PhD Assistant Professor, Departments of Radiation Oncology, Diagnostic Radiology and Nuclear Medicine Medical Director, Radiation Oncology,
Biases affecting tumor uptake measurements in FDG-PET
 Biases affecting tumor uptake measurements in FDG-PET M. Soret, C. Riddell, S. Hapdey, and I. Buvat Abstract-- The influence of tumor diameter, tumor-tobackground activity ratio, attenuation, spatial resolution,
Overview of Clinical and Research Activities at Georgetown University Hospital
 Overview of Clinical and Research Activities at Georgetown University Hospital Dalong Pang, Ph.D. Department of Radiation Medicine Georgetown University Hospital Clinical Operation Two Varian linear accelerators
Martin Law, PhD, DABSNM, DABMP Physicist ic Radiology/QMH
 A practical measure in personnel dose reduction for 90 Y-micropsheres liverdirected radioembolization: from radiology department to patient ward Martin Law, PhD, DABSNM, DABMP Physicist ic Radiology/QMH
Dosimetry (Dose Estimation) of Internal Emitters. Outline. For Radiation Effects, is Dose the only Answer? Estimation of Dose and not Dosimetry
 of Internal Emitters. Outline. For Radiation Effects, is Dose the only Answer? Estimation of Dose and not Dosimetry") Dosimetry (Dose Estimation) of Internal Emitters. Lawrence E. Williams, PhD City of Hope National Medical Center Duarte CA 91010 lwilliams@coh.org Outline 1. Dose Estimation Formula D = S*Ã 2. Determination
Dosimetry (Dose Estimation) of Internal Emitters. Lawrence E. Williams, PhD City of Hope National Medical Center Duarte CA 91010 lwilliams@coh.org Outline 1. Dose Estimation Formula D = S*Ã 2. Determination
Use Of MCNP With Voxel-Based Image Data For Internal Dosimetry Applications
 Use Of MCNP With Voxel-Based Image Data For Internal Dosimetry Applications The Monte Carlo Method: Versatility Unbounded In A Dynamic Computing World Chattanooga, TN, USA, April 17-21, 2005 M. G. Stabin
Strategic Research Agenda of EURAMED, highlighting synergies
 Strategic Research Agenda of EURAMED, highlighting synergies Christoph Hoeschen Otto-von-Guericke University Magdeburg on behalf of the steering committee The Strategic Research Agenda Common Strategic
NIA MAGELLAN HEALTH RADIATION ONCOLOGY CODING STANDARD. Dosimetry Planning
 NIA MAGELLAN HEALTH RADIATION ONCOLOGY CODING STANDARD Dosimetry Planning CPT Codes: 77295, 77300, 77301, 77306, 77307, 77321, 77316, 77317, 77318, 77331, 77399 Original Date: April, 2011 Last Reviewed
Dosimetry benchmark for MBDCA
 Clinical implementation for advanced brachytherapy dose calculation algorithms beyond the TG-43 formalism: Dosimetry benchmark for MBDCA F. Ballester PhD University of Valencia, Spain Disclosure Research
Theranostics in Nuclear Medicine
 Theranostics in Nuclear Medicine Patrick FLAMEN, MD, PhD Head Nuclear Medicine Institut Jules Bordet Université Libre de Bruxelles (U.L.B.) n Theranostics in Nuclear Medicine n A form of (nuclear) diagnostic
The Clinical Utility of Yttrium-90 PET after SIRT
 The Clinical Utility of Yttrium-90 PET after SIRT Dr Yung Hsiang Kao Department of Nuclear Medicine Austin Health Melbourne, Australia 2 nd Asia Pacific Symposium on Liver-Directed Y-90 Microspheres Therapy
MEDICAL MANAGEMENT POLICY
 PAGE: 1 of 8 This medical policy is not a guarantee of benefits or coverage, nor should it be deemed as medical advice. In the event of any conflict concerning benefit coverage, the employer/member summary
Publishable JRP Summary Report for JRP HLT11 MetroMRT Metrology for Molecular Radiotherapy Background
 Publishable JRP Summary Report for JRP HLT11 MetroMRT Metrology for Molecular Radiotherapy Background The medical treatment modality of molecular radiotherapy (MRT), or nuclear medicine therapy, has been
Radioembolization with Lipiodol for the Treatment of Hepatocellular Carcinoma and Liver Metastases
 Radioembolization with Lipiodol for the Treatment of Hepatocellular Carcinoma and Liver Metastases Pr Francesco Giammarile CHLS Lyon Faculté de Lyon Sud «Aut tace aut loquere meliora silentio» Malignant
ICRP Recommendations Evolution or Revolution? John R Cooper Main Commission
 ICRP Recommendations Evolution or Revolution? John R Cooper Main Commission 3 September 2009 ICRP Recommendations 1. Reasons for new Recommendations 2. Summary of health risks 3. Summary of changes to
Chapters from Clinical Oncology
 Chapters from Clinical Oncology Lecture notes University of Szeged Faculty of Medicine Department of Oncotherapy 2012. 1 RADIOTHERAPY Technical aspects Dr. Elemér Szil Introduction There are three possibilities
EN TERAPIA METAByLICA NO ESTrNDAR CON 177 Lu, 90 Y y 223 Ra
 Jornada científica RADIOFuSICA DE LA DOSIMETRuA INTERNA EN LOS PROCEDIMIENTOS TERAPÉUTICOS CON RADIOFrRMACOS DOSIMETRIA FuSICA Y CLuNICA EN TERAPIA METAByLICA NO ESTrNDAR CON 177 Lu, 90 Y y 223 Ra Pablo
Dose Estimates for Nuclear Medicine Procedures: What are they? Where do they come from?
 Dose Estimates for Nuclear Medicine Procedures: What are they? Where do they come from? SNM Continuing Education Lecture Salt Lake City, UT -- June 6, 2010 Darrell R. Fisher Pacific Northwest National
PROGRAMME Day 1. Friday 26 th October Session (presentation summaries attached) Speakers
 Speakers") PROGRAMME Day 1 Friday 26 th October Session (presentation summaries attached) Speakers 09:00 09:15 Summer School 2018 Welcome Julia Green 09:15 10:15 Session 1 Introduction (1.0hrs) 1.1 What a Quantitative
PROGRAMME Day 1 Friday 26 th October Session (presentation summaries attached) Speakers 09:00 09:15 Summer School 2018 Welcome Julia Green 09:15 10:15 Session 1 Introduction (1.0hrs) 1.1 What a Quantitative
Inhomogeneity effect in Varian Trilogy Clinac ix 10 MV photon beam using EGSnrc and Geant4 code system
 Journal of Physics: Conference Series PAPER OPEN ACCESS Inhomogeneity effect in Varian Trilogy Clinac ix 10 MV photon beam using EGSnrc and Geant4 code system To cite this article: S Yani et al 2016 J.
RADIOTHERAPY: TECHNOLOGIES AND GLOBAL MARKETS
 RADIOTHERAPY: TECHNOLOGIES AND GLOBAL MARKETS HLC176A February 2015 Neha Maliwal Project Analyst ISBN: 1-62296-043-2 BCC Research 49 Walnut Park, Building 2 Wellesley, MA 02481 USA 866-285-7215 (toll-free
Radiotherapy physics & Equipments
 Radiotherapy physics & Equipments RAD 481 Lecture s Title: An Overview of Radiation Therapy for Health Care Professionals Dr. Mohammed Emam Vision :IMC aspires to be a leader in applied medical sciences,
Clinical Impact of Couch Top and Rails on IMRT and Arc Therapy
 Texas Medical Center Library DigitalCommons@TMC UT GSBS Dissertations and Theses (Open Access) Graduate School of Biomedical Sciences 8-2011 Clinical Impact of Couch Top and Rails on IMRT and Arc Therapy
ICRP 128 ICRP ICRP ICRP 1928
 ICRP 1928 129 ICRP 1928 ICRP ICRP ICRP 1928 129 ICRP 129 ICRP 128 Radiological Protection in Cone Beam Computed Tomography (CBCT) Radiation Dose to Patients from Radiopharmaceuticals: A Compendium of Current
Comparison of dosimetry parameters of two commercially available Iodine brachytherapy seeds using Monte Carlo calculations
 Iran. J. Radiat. Res., 21; 7 (4): 217-222 Comparison of dosimetry parameters of two commercially available Iodine brachytherapy seeds using Monte Carlo calculations Downloaded from ijrr.com at 6:52 +33
Computer based delineation and follow-up multisite abdominal tumors in longitudinal CT studies
 Research plan submitted for approval as a PhD thesis Submitted by: Refael Vivanti Supervisor: Professor Leo Joskowicz School of Engineering and Computer Science, The Hebrew University of Jerusalem Computer
Nuclear Oncology Applications
 Nuclear Oncology Applications Michael G. Stabin Vanderbilt University Nashville, TN XX Congresso Brasileiro de Física Médica e Simpósio Internacional de Proteção Radiológica em Medicina 12 a 15/Ago/2015
IN VIVO IMAGING Proton Beam Range Verification With PET/CT
 IN VIVO IMAGING Proton Beam Range Verification With PET/CT Antje-Christin Knopf 1/3 K Parodi 2, H Paganetti 1, T Bortfeld 1 Siemens Medical Solutions Supports This Project 1 Department of Radiation Oncology,
BORDET DEPARTMENT RADIATION ONCOLOGY
 BORDET DEPARTMENT RADIATION ONCOLOGY The Radiation Oncology Department has been providing patients with high quality, tailored radiation oncology care for the last 60 years in a multidisciplinary setting
7/13/2015. Current Trends in Yttrium-90 Microsphere Therapy Planning and Dosimetry. Educational Objectives TRANS-ARTERIAL LIVER-DIRECTED THERAPIES
 Current Trends in Yttrium-90 Microsphere Therapy Planning and Dosimetry Armeen Mahvash, MD S. Cheenu Kappadath, PhD The University of Texas MD Anderson Cancer Center, Houston, Texas AAPM Annual Meeting
IART and EBRT, an innovative approach
 External beam radiotherapy and nuclear medicine therapy: which kind of integration? Mahila Ferrari mahila.ferrari ferrari@ieo.it A different NM and RT integration... Radionuclide therapy combined to EBRT
Disclosures. I am on the Onyx speaker bureau I am a paid consultant to. Boston Scientific CeloNova Cook MDS Nordion Sirtex
 Disclosures I am on the Onyx speaker bureau I am a paid consultant to Boston Scientific CeloNova Cook MDS Nordion Sirtex Comparing Y90 Devices Matthew S. Johnson MD, FSIR Indiana University School of Medicine
Application of the Commission's Recommendations for the Protection of People in
 ICRP Publication 127 ICRP Publication 126 ICRP Publication 125 ICRP Publication 124 ICRP Publication 123 ICRP Publication 122 ICRP Publication 121 ICRP Publication 120 ICRP 2011 Proceedings Radiological
Isoeffective Dose Specification of Normal Liver in Yttrium-90 Microsphere Radioembolization*
 Isoeffective Dose Specification of Normal Liver in Yttrium-90 Microsphere Radioembolization* Barry W. Wessels, Ph.D 1 ; Amilia G. Di Dia, PhD 2 ;Yiran Zheng, PhD 1 Marta Cremonesi, PhD 2 1 University Hospitals
A comparative dosimetric analysis of the effect of heterogeneity corrections used in three treatment planning algorithms
 The University of Toledo The University of Toledo Digital Repository Theses and Dissertations 2010 A comparative dosimetric analysis of the effect of heterogeneity corrections used in three treatment planning
Application of 3D Printing to Molecular Radiotherapy Phantoms. Nick Calvert Nuclear Medicine Group The Christie NHS Foundation Trust, Manchester
 Application of 3D Printing to Molecular Radiotherapy Phantoms Nick Calvert Nuclear Medicine Group The Christie NHS Foundation Trust, Manchester Molecular Radiotherapy Radionuclide administered to patient
Imaging of Radiation Dose Using Cherenkov Light
 Imaging of Radiation Dose Using Cherenkov Light Eric Brost 1, Yoichi Watanabe 1, Fadil Santosa 2, Adam Green 3 1 Department of Radiation Oncology, University of Minnesota 2 Institute for Mathematics and
SIRT in Neuroendocrine Tumors
 SIRT in Neuroendocrine Tumors Marnix G.E.H. Lam, MD PhD Professor of Nuclear Medicine AVL Amsterdam UMC Utrecht ENETS Center of Excellence, The Netherlands Disclosure of speaker s interests Consultant
Open Access. Justin K Mikell 1,2, Armeen Mahvash 3, Wendy Siman 1,2, Firas Mourtada 4 and S Cheenu Kappadath 1,2*
 Mikell et al. EJNMMI Physics (2015) 2:16 DOI 10.1186/s40658-015-0119-y Open Access Comparing voxel-based absorbed dosimetry methods in tumors, liver, lung, and at the liver-lung interface for 90 Y microsphere
Radionuclide Therapy: History, Present and Future Promise. History of Radionuclide (RN) Therapy. History of RN Therapy 8/2/2017
 Therapy. History of RN Therapy 8/2/2017") Radionuclide Therapy: History, Present and Future Promise Bennett S. Greenspan, MD, MS Professor, Dept. of Radiology, MCG / AU President, SNMMI AAPM Annual Meeting, Denver, CO History Symposium 8/02/2017
Radionuclide Therapy: History, Present and Future Promise Bennett S. Greenspan, MD, MS Professor, Dept. of Radiology, MCG / AU President, SNMMI AAPM Annual Meeting, Denver, CO History Symposium 8/02/2017
Molecular Imaging Guided Therapy: The Perfect Storm. David M Schuster, MD Emory University Department of Radiology Atlanta, GA
 Molecular Imaging Guided Therapy: The Perfect Storm David M Schuster, MD Emory University Department of Radiology Atlanta, GA Talk can be found at radiology.emory.edu Let s start with a case 74 year
A TREATMENT PLANNING STUDY COMPARING VMAT WITH 3D CONFORMAL RADIOTHERAPY FOR PROSTATE CANCER USING PINNACLE PLANNING SYSTEM *
 Romanian Reports in Physics, Vol. 66, No. 2, P. 394 400, 2014 A TREATMENT PLANNING STUDY COMPARING VMAT WITH 3D CONFORMAL RADIOTHERAPY FOR PROSTATE CANCER USING PINNACLE PLANNING SYSTEM * D. ADAM 1,2,
Overview Therapeutic Radiopharmaceuticals in Nuclear Medicine Definition: Characteristics of the Ideal Therapeutic Radiopharmaceutical
 Overview After reviewing this tutorial, the users should be able to list the most important characteristics of the ideal therapeutic radiopharmaceutical and briefly discuss each of these as it relates
Digital film dosimetry in radiotherapy and the development of analytical applications software
 University of Wollongong Research Online University of Wollongong Thesis Collection 1954-2016 University of Wollongong Thesis Collections 2005 Digital film dosimetry in radiotherapy and the development
Tracking Doses in the Pediatric Population
 Tracking Doses in the Pediatric Population Frederic H. Fahey DSc Boston Children s Hospital Harvard Medical School frederic.fahey@childrens.harvard.edu Disclosures Sadly, none that pay me any money! SNMMI
Downloaded from by guest on 18 November 2018
 Radiation Protection Dosimetry Vol. 105, No. 1 4, pp. 581 586 (2003) Published by Nuclear Technology Publishing 2003 Nuclear Technology Publishing ASSESSMENTS FOR HIGH DOSE RADIONUCLIDE THERAPY TREATMENT
Knowledge-Based IMRT Treatment Planning for Prostate Cancer: Experience with 101. Cases from Duke Clinic. Deon Martina Dick
 Knowledge-Based IMRT Treatment Planning for Prostate Cancer: Experience with 101 Cases from Duke Clinic by Deon Martina Dick Department of Medical Physics Duke University Date: Approved: Joseph Lo, Chair
try George Sgouros, Ph.D. Russell H. Morgan Dept of Radiology & Radiological Science Baltimore MD
 Bexxar Dosimet try George Sgouros, Ph.D. Russell H. Morgan Dept of Radiology & Radiological Science Johns Hopkins University, School of Medicine Baltimore MD Clinical i l Experi ience with anti- CD-20
Can we deliver the dose distribution we plan in HDR-Brachytherapy of Prostate Cancer?
 Can we deliver the dose distribution we plan in HDR-Brachytherapy of Prostate Cancer? Dimos Baltas Dept. of Medical Physics & Engineering, Strahlenklinik, Klinikum Offenbach GmbH 63069 Offenbach, Germany
PHYS 383: Applications of physics in medicine (offered at the University of Waterloo from Jan 2015)
") PHYS 383: Applications of physics in medicine (offered at the University of Waterloo from Jan 2015) Course Description: This course is an introduction to physics in medicine and is intended to introduce
PHYS 383: Applications of physics in medicine (offered at the University of Waterloo from Jan 2015) Course Description: This course is an introduction to physics in medicine and is intended to introduce
A Snapshot on Nuclear Cardiac Imaging
 Editorial A Snapshot on Nuclear Cardiac Imaging Khalil, M. Department of Physics, Faculty of Science, Helwan University. There is no doubt that nuclear medicine scanning devices are essential tool in the
Typical PET Image. Elevated uptake of FDG (related to metabolism) Lung cancer example: But where exactly is it located?
 Lung cancer example: But where exactly is it located?") Typical PET Image Elevated uptake of FDG (related to metabolism) Lung cancer example: But where exactly is it located? PET/CT Oncology Imaging Anatometabolic fusion images are useful in the management
Typical PET Image Elevated uptake of FDG (related to metabolism) Lung cancer example: But where exactly is it located? PET/CT Oncology Imaging Anatometabolic fusion images are useful in the management
Dr. Th. Leventouri. 777 Glades Road Boca Raton, FL Tel: Fax:
 Dr. Th. Leventouri Professor of Physics Director, Medical Physics Program Department of Physics Director, Center for Biomedical and Materials Physics Charles E. Schmidt College of Science 777 Glades Road
Minimizing Unnecessary Radiation Exposure to Healthcare Professionals and Patients Imagine where we can go.
 ALARA & RADIATION SAFETY Minimizing Unnecessary Radiation Exposure to Healthcare Professionals and Patients Imagine where we can go. What is ALARA? As Low As Reasonably Achievable The use of radiation
The Role of Monte Carlo and other Advanced Dose Calculation Algorithms for Breast APBI
 The Role of Monte Carlo and other Advanced Dose Calculation Algorithms for Breast APBI Luc Beaulieu, Ph.D. Associate Prof, Département de physique, Université Laval Researcher, Centre de recherche en cancérologie
Publishable Summary for 15HLT06 MRTDosimetry Metrology for clinical implementation of dosimetry in molecular radiotherapy
 Publishable Summary for 15HLT06 MRTDosimetry Metrology for clinical implementation of dosimetry in molecular radiotherapy Overview The overall aim of this project is to provide the metrology for the clinical
Third announcement. Joint FMU-ICRP Workshop on Radiological Protection in Medicine. Tuesday, October 3, 2017
 ICRP ref: 4852-9144-9932 Third announcement Joint FMU-ICRP Workshop on Radiological Protection in Medicine Tuesday, October 3, 2017 Organised by Fukushima Medical University (FMU) and the International
First, how does radiation work?
 Hello, I am Prajnan Das, Faculty Member in the Department of Radiation Oncology at The University of Texas MD Anderson Cancer Center. We are going to talk today about some of the basic principles regarding
Reproducibility of Uptake Estimates in FDG PET: a Monte Carlo study
 Reproducibility of Uptake Estimates in FDG PET: a Monte Carlo study Juliette Feuardent, Marine Soret, Irène Buvat 1 Abstract Tumor glucose metabolism measurements from Fluoro-deoxyglucose (FDG) Positron
Recent proceedings in Brachytherapy Physics
 Recent proceedings in Brachytherapy Physics Frank-André Siebert UKSH, Campus Kiel, Germany Clinic of Radiotherapy Dept. Medical Physics Physical characteristics of brachytherapy (Courtesy Luc Beaulieu,
Facilitating Lu 177 Personalized Dosimetry for Neuroendocrine Tumours CANM 2017
 Facilitating Lu 177 Personalized Dosimetry for Neuroendocrine Tumours CANM 2017 CANM ANNUAL SCIENTIFIC MEETING APRIL 20-23, 2017 TORONTO, ONTARIO I do not have a financial interest, arrangement or affiliation
Accuracy Requirements and Uncertainty Considerations in Radiation Therapy
 Departments of Oncology and Medical Biophysics Accuracy Requirements and Uncertainty Considerations in Radiation Therapy Introduction and Overview 6 August 2013 Jacob (Jake) Van Dyk Conformality 18 16
Technical Study. Institution University of Texas Health San Antonio. Location San Antonio, Texas. Medical Staff. Daniel Saenz. Niko Papanikolaou.
 Technical Study Stereotactic Radiosurgery with Elekta Versa HD and Monaco Accuracy of a single isocenter, multiple brain metastases VMAT plan delivered to a pseudo-patient dosimetric gel phantom Institution
ROPES eye plaque dosimetry: commissioning and verification of an ophthalmic brachytherapy treatment planning system
 University of Wollongong Research Online Faculty of Engineering and Information Sciences - Papers: Part A Faculty of Engineering and Information Sciences 2013 ROPES eye plaque dosimetry: commissioning
Impact of ICRP-89 Based Models on Dose Estimates for Radiopharmaceuticals and CT Exams. Stabin MG, Kost SD, Clark JH, Pickens DR, Price RR, Carver DE
 Impact of ICRP-89 Based Models on Dose Estimates for Radiopharmaceuticals and CT Exams Stabin MG, Kost SD, Clark JH, Pickens DR, Price RR, Carver DE Vanderbilt University, Nashville, TN, USA Abstract New
Development of a portable gamma imaging system for absorbed radia4on dose control in targeted radionuclide therapy
 Development of a portable gamma imaging system for absorbed radia4on dose control in targeted radionuclide therapy PhD Student Group IIRIC (Instrument. & Imagerie Radio-isotopique Clinique) L. Ménard,
ADVANCES IN RADIATION TECHNOLOGIES IN THE TREATMENT OF CANCER
 ADVANCES IN RADIATION TECHNOLOGIES IN THE TREATMENT OF CANCER Bro. Dr. Collie Miller IARC/WHO Based on trends in the incidence of cancer, the International Agency for Research on Cancer (IARC) and WHO
Calibration of TLD700:LiF for Clinical Radiotherapy Beam Modalities & Verification of a High Dose Rate Brachytherapy Treatment Planning System
 Calibration of TLD700:LiF for Clinical Radiotherapy Beam Modalities & Verification of a High Dose Rate Brachytherapy Treatment Planning System James D Rijken Thesis submitted for the degree of Master of
Radionuclides in Medical Imaging. Danielle Wilson
 Radionuclides in Medical Imaging Danielle Wilson Outline Definitions History and development Radionuclide applications & techniques in imaging Conclusion Definition #1 : Radionuclide An unstable nucleus
Hong Kong Association of Medical Physics. Guide to Candidates
 Hong Kong Association of Medical Physics Certification of Medical Physicists Professional Assessment Guide to Candidates PA App Form (r2017.1) Contents Chapter 1 p. 3 Professional Assessment System and
Radiation Safety for New Medical Physics Graduate Students
 Radiation Safety for New Medical Physics Graduate Students John Vetter, PhD Medical Physics Department UW School of Medicine & Public Health Background and Purpose of This Training This is intended as
Dose differences between the three dose calculation algorithms in Leksell GammaPlan
 JOURNAL OF APPLIED CLINICAL MEDICAL PHYSICS, VOLUME 15, NUMBER 5, 2014 Dose differences between the three dose calculation algorithms in Leksell GammaPlan Andy (Yuanguang) Xu, 1a Jagdish Bhatnagar 1, Greg
Ritu Raj Upreti, S. Dayananda, R. L. Bhalawat*, Girish N. Bedre*, D. D. Deshpande
 60 Original Article Evaluation of radiograph-based interstitial implant dosimetry on computed tomography images using dose volume indices for head and neck cancer Ritu Raj Upreti, S. Dayananda, R. L. Bhalawat*,
Transition to Heterogeneity Corrections. Why have accurate dose algorithms?
 Transition to Heterogeneity Corrections Eric E. Klein, M.S., Washington University, St. Louis, MO Craig Stevens, M.D., Ph.D., MD Anderson Cancer Center, Houston, TX Nikos Papinikolou, Ph.D., University
Advanced Technology Consortium (ATC) Credentialing Procedures for 3D Conformal Therapy Protocols 3D CRT Benchmark*
 Credentialing Procedures for 3D Conformal Therapy Protocols 3D CRT Benchmark*") Advanced Technology Consortium (ATC) Credentialing Procedures for 3D Conformal Therapy Protocols 3D CRT Benchmark* Purpose: To evaluate an institution s 3D treatment planning process and the institution
Advanced Technology Consortium (ATC) Credentialing Procedures for 3D Conformal Therapy Protocols 3D CRT Benchmark* Purpose: To evaluate an institution s 3D treatment planning process and the institution
Improving clinical brachytherapy: dosimetry & verification
 1/XXX Improving clinical brachytherapy: dosimetry & verification Organ Frank motion Verhaegen, in radiotherapy Gabriel Fonseca, Murillo Bellezzo, Shane White, Guillaume Landry, Brigitte Reniers nada* MAASTRO
Dosimetry in Life Sciences
 The level of those capital requirements is formidable and can very well be one of the limits to the growth of nuclear power in these countries. The outlook for funding may not be very encouraging and concessionary
Measurement of organ dose in abdomen-pelvis CT exam as a function of ma, KV and scanner type by Monte Carlo method
 Iran. J. Radiat. Res., 2004; 1(4): 187-194 Measurement of organ dose in abdomen-pelvis CT exam as a function of ma, KV and scanner type by Monte Carlo method M.R. Ay 1, M. Shahriari 2, S. Sarkar 3, P.
Steven G. Marsh MS, DABMP, Medical Health Physics RSO - Baystate Health Springfield, MA
 Steven G. Marsh MS, DABMP, Medical Health Physics RSO - Baystate Health Springfield, MA Radioactive Materials License: NRC or Agreement State Broad Scope & Medical Component Limited License Regulations
Goals and Objectives: Head and Neck Cancer Service Department of Radiation Oncology
 Goals and Objectives: Head and Neck Cancer Service Department of Radiation Oncology The head and neck cancer service provides training in the diagnosis, management, treatment, and follow-up care of head