CITY OF MAPLE RIDGE DRINKING WATER QUALITY REPORT 2017
|
|
|
- Jerome Paul
- 5 years ago
- Views:
Transcription


1 CITY OF MAPLE RIDGE DRINKING WATER QUALITY REPORT 2017 May 2018
2 Table of Contents List of Abbreviations... 2 Executive Summary Introduction Background Source Water Distribution System Facility Maintenance Re-Chlorination Stations Regulated Drinking Water Quality Parameters Water Quality Sampling and Monitoring Bacteriological Monitoring and Results Escherichia Coli Total Coliform Frequency of Monitoring Samples Unregulated Drinking Water Quality Parameters Free Chlorine Turbidity Heterotrophs Disinfection Byproducts ph Metals Temperature Vinyl Chloride Response to Potential Contamination Public Health Message from the Medical Health Officer Conclusion Appendix A: Sampling Station Locations Appendix B: Residual Free Chlorine Figures Appendix C: Disinfection By-Products and ph Appendix D: Metals and Vinyl Chloride Appendix E: Metals without Maximum Concentration Guidelines Appendix F: Free Chlorine and Turbidity Charts Appendix G: Weekly Sample Lab Results Appendix H: Preventing Water-Borne Infections for People with Weakened Immune Systems
3 List of Abbreviations L = litre ml = milliliter g = gram mg = milligram μg = microgram ppb = parts per billion C = degree Celsius E. coli = Escherichia coli NTU = Nephelometric Turbidity Units HPC = heterotrophic plate count CFU = colony-forming unit THM = triohalomethane HAA = haloacetic acid USEPA = United States Environmental Protection Agency Cl2 = chlorine MF = membrane filtration EOCP = Environmental Operators Certification Program 2

4 Executive Summary The City of Maple Ridge (City) is a distributor of water that is supplied and treated by Metro Vancouver from its Coquitlam Lake source. In 2017, the City distributed water to approximately 80,000 people. In accordance with the requirements of the BC Drinking Water Protection Regulation, the City sends drinking water samples from 20 locations to a laboratory for analysis. Test results are communicated to the City and the Fraser Health Authority every week and documented in this annual report. In 2017, the City s water met all regulatory requirements for drinking water quality set out in the BC Drinking Water Protection Regulation: No samples tested positive for E. coli For each 30-day period, over 90% of samples had 0 total coliform per 100mL, and no sample had more than 10 total coliform per 100mL In monitoring unregulated drinking water quality parameters, the City follows the 2008 Water Quality Monitoring and Reporting Plan for Metro Vancouver and Member Municipalities and compares laboratory results to Health Canada s recommendations for drinking water quality. In 2017, City water did not exceed any maximum limits recommended by Health Canada for these unregulated parameters with the exception of temperature. Coquitlam Lake (Source Water for Maple Ridge) 3
5 1.0 Introduction The City operates a Municipal Water Utility under the provisions of the provincial Local Government Act, the BC Drinking Water Protection Act, and the BC Drinking Water Protection Regulation. These obligate the City to meet several requirements, including: Operating the utility under a permit granted by the Provincial Ministry of Health Services Engaging in water quality monitoring The roles and responsibilities for the Province, Fraser Health Authority, and Metro Vancouver/City of Maple Ridge (Water System Owners) are shown in Figure 1. Ministry of Healthy Living and Sport Creates and owns Drinking Water Protection Act and Regulation Health Authority Administration & Enforcement of Legislation/Regulations Water System Owners Provision of Safe Drinking Water + Notification of Water Quality Problems Figure 1: Agency Responsibilities for Water Quality 4

6 2.0 Background The City is supplied with water from protected and undeveloped Metro Vancouver watersheds. Drinking water is conveyed to Maple Ridge through large diameter Metro Vancouver transmission mains then approximately 400km of municipal water distribution pipes. 2.1 Source Water Metro Vancouver supplies water to the City through a series of pipes linking Maple Ridge to the Coquitlam, Seymour and Capilano watersheds (Figure Two). While the Coquitlam watershed is the primary source of water for Maple Ridge, Metro Vancouver has the ability to convey water from the Seymour/Capilano watersheds to Maple Ridge in the event of a service disruption at the Coquitlam source. Metro Vancouver operates an ultra violet (UV) light water treatment facility at the Coquitlam watershed which disinfects water prior to it entering the distribution system. Information on how Metro Vancouver treats source water is available at (search the website using the key words drinking water treatment processes ). Figure 2: Regional Water Supply System (source: 5
7 2.2 Distribution System The City distributes water to businesses, institutions and over 80,000 residents. Water distribution infrastructure includes approximately 400km of water mains, 19,000 service connections, 8 pump stations and 10 reservoir tanks. The Municipality also operates 6 re-chlorination stations to boost residual chlorine levels in the distribution system. The distribution system is managed by a team of professionals within the City s Public Works and Development Services Division, under the leadership of the General Manager of Public Works and Development Services. System operators are Environmental Operators Certification Program Level 4 compliant. The system is regulated by Maple Ridge s Water Service Bylaw Facility Maintenance Water quality is influenced by water system maintenance and improvement strategies that are implemented by the City s Operations and Engineering Departments. Water main flushing is a method of cleaning water mains. Flushing involves manipulating valves and discharging water through fire hydrants or blow off points. The discharged water carries sediment and other solids with it, thus cleaning the mains. The City cleaned 68km of water mains using this method in The City currently cleans its reservoir tanks on a 5 year cycle. 2.4 Re-Chlorination Stations Chlorine levels are continually monitored at 6 re-chlorination stations throughout the distribution system. Additional chlorine is automatically injected into the drinking water at these locations if detected chlorine levels are low. The re-chlorination stations are inspected daily and adjusted as necessary. 6
8 3.0 Regulated Drinking Water Quality Parameters The Province sets out drinking water quality requirements in its Drinking Water Protection Regulation. This section reports on the quality of the City s drinking water in relation to those regulations. 3.1 Water Quality Sampling and Monitoring Water quality is monitored for regulatory compliance on a weekly basis at the City s 20 sampling locations. Sampling locations and codes are shown graphically in Appendix A. Samples are sent to the Metro Vancouver laboratory for analysis. Metro Vancouver staff members analyze the samples and communicate results to City and Fraser Health staff. Responses to undesirable results would range from re-sampling to flushing water mains to possibly issuing a boil water advisory, depending on sample result confirmation and which water quality variable the exceedance is related to. The monitoring program indicates drinking water quality within municipal water mains. However, it does not provide information on the quality of drinking water within buildings where water quality can change significantly due to pipe material, standing time, temperature, and other factors. It can be assumed that samples taken within buildings would have a different quality of water compared to samples taken directly from municipal water mains. The City is not responsible for water quality on private property. 3.2 Bacteriological Monitoring and Results The BC Drinking Water Protection Regulation requires the City to carry out routine sampling and testing for Escherichia coli (E. coli) and total coliform bacteria. These are considered indicator organisms because their presence or absence provides an indication of overall microbial water quality. Figures 3 and 4 show Metro Vancouver Laboratory technicians processing a water sample and testing it for the presence of coliform bacteria Escherichia Coli E. coli is a type of coliform bacteria present exclusively in the feces of humans and other animals. The existence of E. coli in a water sample indicates recent fecal contamination and the possible presence of intestinal disease-causing bacteria, viruses, and protozoa. The BC Drinking Water Protection Regulation standard for E. coli is none detectable per 100 ml. In 2017, no samples tested positive for E. coli. 7


9 Figure 3: Metro Vancouver Laboratory technician processing water sample in preparation for coliform bacteria check Figure 4: Metro Vancouver Laboratory technician checking water sample for coliform bacteria Total Coliform The total coliform group includes various types of bacteria with similar characteristics. Members of this group range from being fecal-specific, such as E. coli, to being widely distributed throughout water, soil, and vegetation. The BC Drinking Water Protection Regulation standards for total coliform are described in Table 1. Table 1: BC Drinking Water Protection Regulation Standards for Total Coliform Occurrence Standard More than 1 sample in a 30 day At least 90% of samples have 0 total coliform per 100mL period and no sample has more than 10 total coliform per 100mL In 2017, two samples had detectable total coliform per 100mL. However, for each 30 day period, over 90% of samples had 0 total coliform per 100mL. Also, no sample had more than 10 total coliform per 100mL. Thus City water met BC Drinking Water Protection Regulation requirements for total coliform bacteria in Upon receiving results for samples taken at Stations MPR 440 and 441 indicating the presence of Total Coliforms, City crews were dispatched to flush water mains in the area and confirm that chlorine and turbidity were at expected levels. After flushing was completed, repeat samples were sent to the Metro Vancouver Laboratory for analysis to confirm water quality. The Fraser Health Authority was notified immediately regarding the Total Coliform laboratory results. Table 2 lists the annual number of samples found to contain total coliform between 2006 and
10 3.2.3 Frequency of Monitoring Samples Table 2: Total Coliform Results by Year Year Number of Samples with Total Coliform The monitoring frequency for the detection of E. coli and total coliforms is stipulated by the BC Drinking Water Protection Regulation. Current requirements are identified in Table 3. With a total of 20 weekly sampling sites at various points in the City s water distribution system, the average number of monthly samples (87) exceeds the stipulated value of 80 (based on a directly serviced population of approximately 80,000). As the City s population grows, additional sampling sites will be added. Table 3: Monitoring Frequency for the detection of E. coli and total coliforms Population Served Target No. of Samples per Month Less than 5, ,000 to 90,000 1 per 1,000 of population More than 90, plus 1 per 10,000 of population in excess of 90,000 9
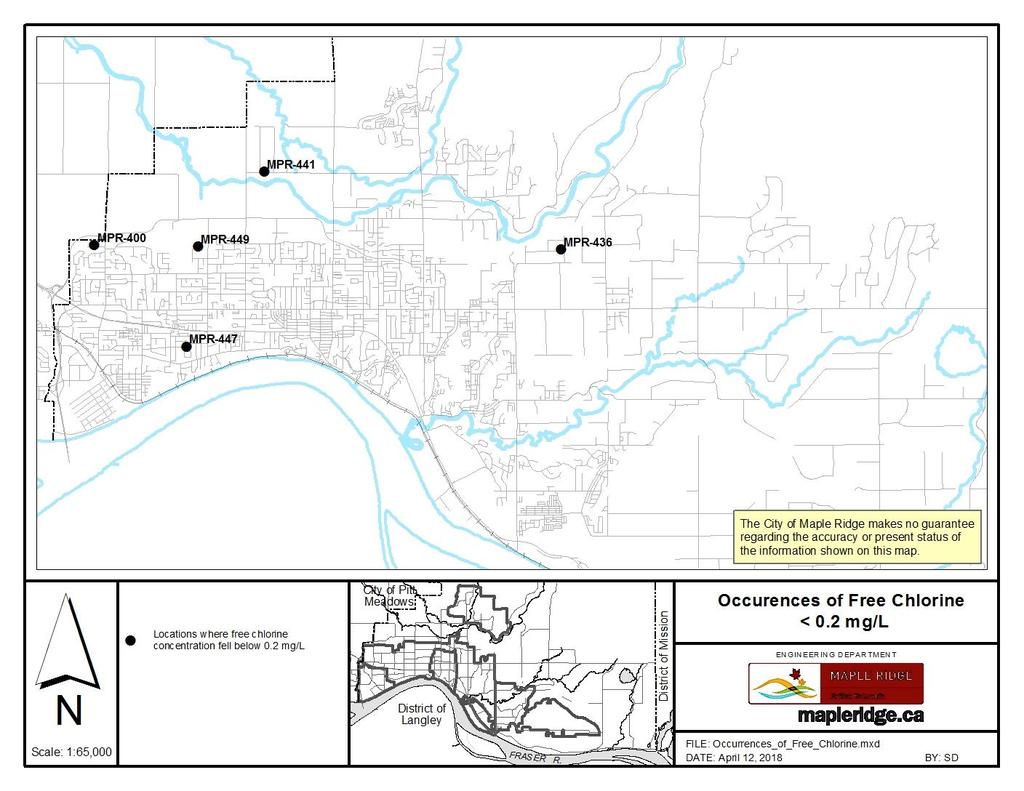
11 4.0 Unregulated Drinking Water Quality Parameters This section reports on water quality parameters that are not regulated through legislation. 4.1 Free Chlorine In the Guidelines for Canadian Drinking Water Quality, Health Canada states that for health considerations, a guideline value [maximum acceptable concentration level for chlorine] is not necessary due to low toxicity at concentrations found in drinking water. With respect to a minimum chlorine concentration, no regulations exist for British Columbia. However, Health Canada reports the following: the U.S. Environmental Protection Agency (EPA) Surface Water Treatment Rule requires a minimum disinfectant residual of 0.2 mg/l for water entering the distribution system and that a detectable level be maintained throughout the distribution system. The World Health Organization (WHO) has suggested that, for areas with little risk of cholera or related outbreaks, a free chlorine residual range of mg/l be maintained at all points in the supply. In general, a free chlorine residual of 0.2 mg/l is considered a minimum level for the control of bacterial regrowth in the distribution system. 1 Health Canada also reports that free chlorine concentrations in most Canadian drinking water distribution systems range from 0.04 to 2.0 mg/l. 2 Residual chlorine concentrations are affected by various parameters such as water age, turbidity, pipe material, and temperature. Table 4 and the maps in Appendix B show that: In 2017, the average free chlorine residual at all stations in Maple Ridge was greater than 0.2 mg/l. Station 441 had the fewest number of samples with chlorine residuals greater than 0.2 mg/l. Detailed free chlorine residual data is charted in Appendix F and tabulated in Appendix G. 4.2 Turbidity Turbidity, measured in Nephelometric Turbidity Units (NTU), is a measure of water clarity. There are no provincial guidelines for turbidity within a distribution system. Average turbidity values at sample stations are documented in Table 4. Detailed turbidity data for 2017 is charted in Appendix F and tabulated in Appendix G. Variations in turbidity within a distribution system are normal. Higher levels may be associated with turbidity in source water or local system events such as high flow rates from unidirectional flushing, fire-fighting, or water main breaks. In the event that a high level of turbidity is detected, the City will determine whether this is expected due to system operations. If the event is unexpected, the City will confirm the turbidity level and flush mains should high turbidity persist. 1 Guidelines for Canadian Drinking Water Quality - Guideline Technical Document - Chlorine - (Health Canada, 2009) 2 Guidelines for Canadian Drinking Water Quality - Guideline Technical Document - Chlorine - (Health Canada, 2009) 10
12 Station Total Samples Taken Table 4: 2017 Chlorine Residual and Turbidity Results by Site Average Free Chlorine in mg/l Average Turbidity in NTU Samples Taken with Free Chlorine Greater Than or Equal to 0.2 mg/l (#) Samples Taken with Free Chlorine Less Than 0.2 mg/l (#) Samples Taken with Free Chlorine Greater Than or Equal to 0.2 mg/l (%) Samples Taken with Free Chlorine Less Than 0.2 mg/l (%) MPR % 2% MPR % 0% MPR % 0% MPR % 0% MPR % 0% MPR % 0% MPR % 4% MPR % 0% MPR % 0% MPR % 0% MPR % 0% MPR % 65% MPR % 0% MPR % 0% MPR % 0% MPR % 0% MPR % 0% MPR % 2% MPR % 0% MPR % 6% 4.3 Heterotrophs Heterotophs are microorganisms requiring organic carbon for growth. Health Canada does not suggest a maximum acceptable concentration for heterotrophs. Instead, it recommends that increases in heterotrophic plate count (HPC) concentrations above baselines levels be considered undesirable. Table 5 shows the annual number of samples with HPCs over 500 CFU/mL between 2006 and In response to HPC counts at or above this level, the City will re-test and flush water mains. HPC data for each sample taken in 2017 is provided in Appendix G. 11
13 Table 5: HPC Results by Year Year Number of Samples with HPC > 500 CFU/mL Disinfection Byproducts Disinfection byproducts such as trihalomethanes (THMs) and haloacetic acids (HAAs) can form when chlorine used to disinfect drinking water reacts with naturally occurring organic matter. Health risks may be associated with long-term exposure to high levels of THMs and HAAs. Trihalomethanes Health Canada considers THMs to be possibly carcinogenic to humans. Health Canada also reports that High Levels of THMs may also have an effect on pregnancy. A California study found that pregnant women who drank large amounts of tap water with high THMs had an increased risk of miscarriage. These studies do not prove that there is a link between THMs and cancer or miscarriage. However, they do show the need for further research in this area to confirm potential health effects. 3 Health Canada recommends that the running average (last 4 quarters) for Total THMs remain below 100 ppb. Quarterly samples were taken at four sites for THM analysis. The running quarterly average THM concentration in the samples remained below 100 ppb at all locations. Detailed THM test results are provided in Appendix C. Haloacetic acids Health Canada considers HAAs to be possibly carcinogenic to humans. Health Canada recommends that the running average (last 4 quarters) total HAA concentration be below 80 ppb. Quarterly samples were taken at four sites for HAA analysis. The running quarterly average HAA concentration remained below 80 ppb at all locations. Detailed HAA test results are provided in Appendix C. 3 Health Canada Website accessed January
14 Temperature (Degree Celsius) City of Maple Ridge 4.5 ph ph is a measure of the acid-base equilibrium of water. ph is of concern in a water distribution system because at low values water becomes corrosive and at high values chlorine disinfection is less efficient. Health Canada indicates that an acceptable ph range for drinking water is ph units. 6 distribution system samples were tested for ph. Test results ranged of 7.2 to 7.4 ph units (see Appendix C). 4.6 Metals The City tested samples at 3 monitoring sites for concentrations of various metals. Test results are shown in Appendix D, along with maximum concentration limits suggested by Health Canada and the U.S. Environmental Protection Agency (USEPA). USEPA values are referenced only where Health Canada does not recommend a limit. As shown in Appendix D, all measured metal concentrations were below the limits recommended by Health Canada and the USEPA. Neither Health Canada nor the USEPA suggest drinking water quality guidelines for calcium, cobalt, magnesium, molybdenum, nickel or potassium. Additional information related to concentrations of these metals is provided in Appendix E. 4.7 Temperature Health Canada recommends a temperature of less than 15 C for drinking water. Water temperature exceeding this objective can result in the growth of nuisance organisms that could lead to unpleasant tastes and odors. Figure 5 shows average monthly drinking water temperatures in Maple Ridge. In August and September the average monthly temperatures were 16.5 and 16.9, exceeding Health Canada s recommendation. Detailed temperature information is provided in Appendix G Average Monthly Drinking Water Temperature Jan Feb Mar Apr May Jun Jul Aug Sep Oct Nov Dec Figure 5: Average Monthly Drinking Water Temperature Chart 13
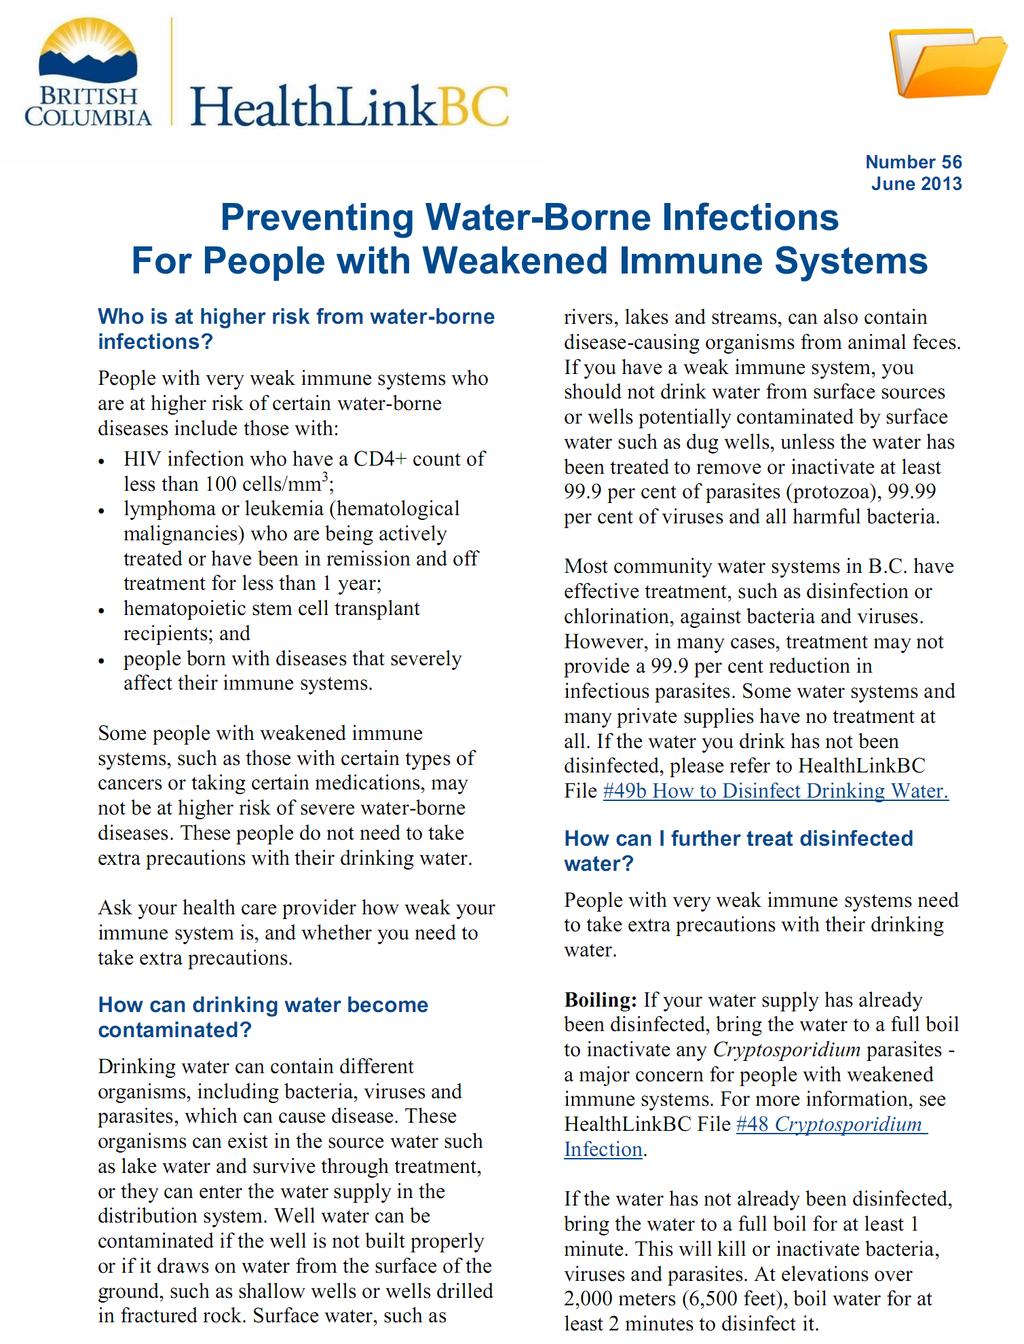
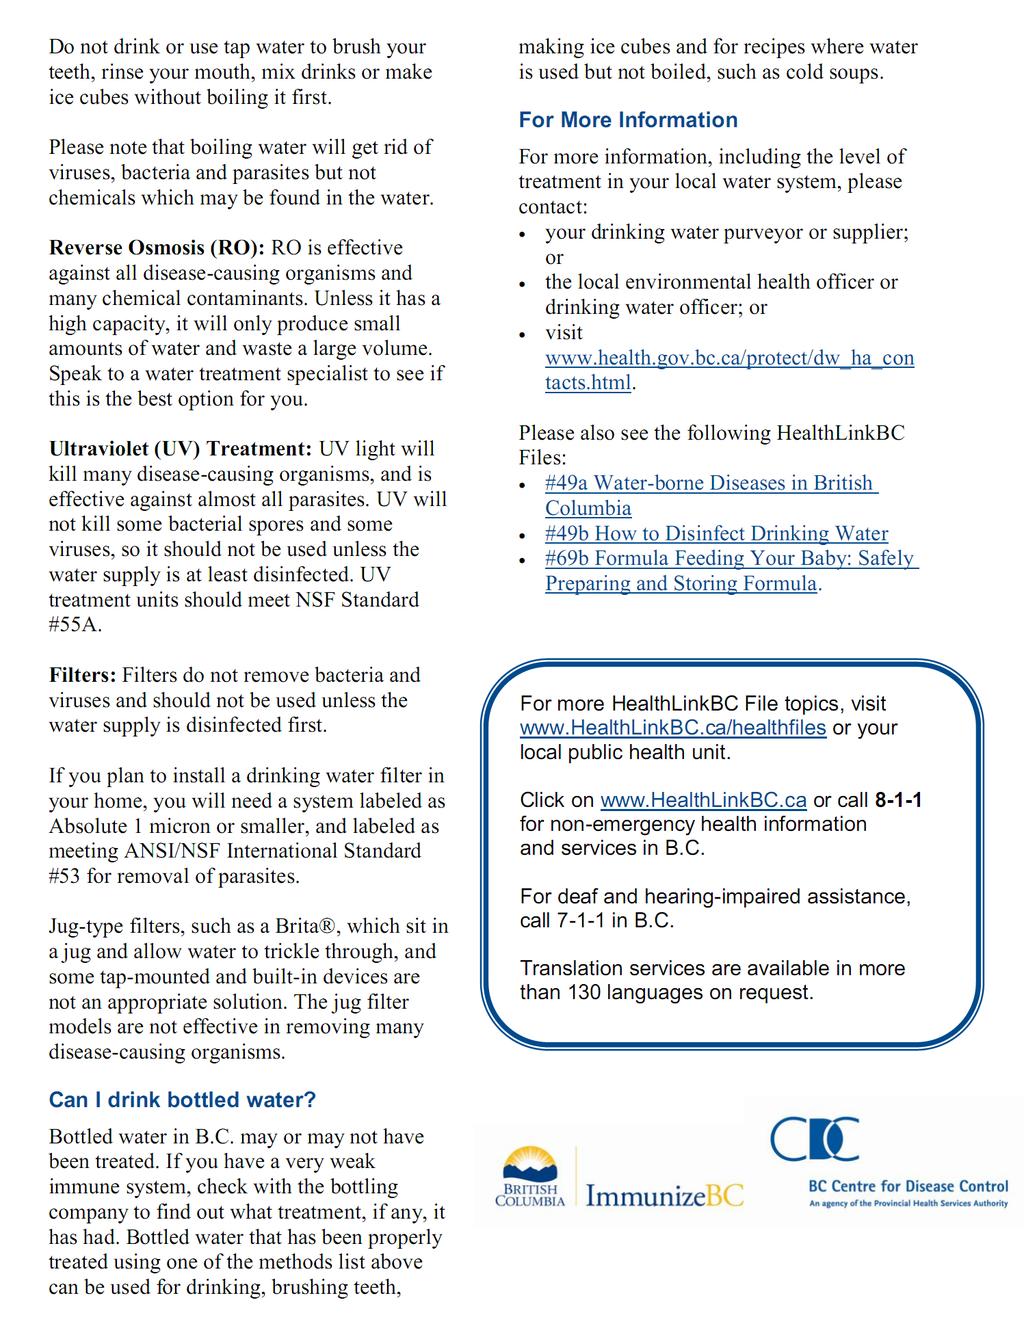
15 4.8 Vinyl Chloride The concentration of vinyl chloride was tested in 6 samples during As indicated in Appendix D, all results were non-detectable (less than 1 μg/l), less than the Health Canada Guideline of 2 μg/l. 5.0 Response to Potential Contamination In the event that contaminants are detected in the water distribution system, a series of protocols will be carried out to communicate the event to City and Fraser Health Authority staff. The City and Fraser Health will then work together to confirm the incident, determine the nature of the risk to public health, and issue public notices as appropriate. Depending on the level of risk a water quality advisory, boil water notice, or do-not-use water notice could be issued. Public notices would be communicated through various media. The City s contamination response plan is embedded in emergency planning documents which are available to water system users upon request. 6.0 Public Health Message from the Medical Health Officer Fraser Health s Medical Health Officer has requested that a fact sheet entitled Preventing Water-Borne Infections for People with weakened Immune Systems be included in this report. The fact sheet is presented in Appendix H. Additionally, the Medical Health Officer has requested the following message be included in this report: Anytime the water in a particular faucet has not been used for six hours or longer, flush your coldwater pipes by running the water until you notice a change in temperature. (This could take as little as five to thirty seconds if there has been recent heavy water use such as showering or toilet flushing. Otherwise, it could take two minutes or longer.) The more time water has been sitting in your home s pipes, the more lead it may contain. Use only water from the cold-tap for drinking, cooking, and especially making baby formula. Hot water is likely to contain higher levels of lead. The two actions recommended above are very important to the health of your family. They will probably be effective in reducing lead levels because most of the lead in household water usually comes from the plumbing in your house, not the local water supply. 7.0 Conclusion The City monitored drinking water quality in 2017 in accordance with Provincial regulations. Over 1,000 drinking water samples were obtained from the municipal water distribution system at 20 locations throughout the City. Metro Vancouver Laboratory testing indicated that all samples met the BC Drinking Water Protection Regulation standards and did not exceed Health Canada guidelines with the exception of temperature. 14
16 Appendix A: Sampling Station Locations 15
17 16
18 Appendix B: Residual Free Chlorine Figures 17
19 18
20 19
21 20
22 Appendix C: Disinfection By-Products and ph 21
23 Bromodichloromethane Bromoform Chlorodibromomethane Chloroform Total Trihalomethanes Running Average (Last 4 Quarters) Dibromoacetic Acid Dichloroacetic Acid Monobromoacetic Acid Monochloroacetic Acid Trichloroacetic Acid Total Haloacetic Acid Running Average (Last 4 Quarters) PH Units City of Maple Ridge THM (ppb) HAA (ppb) Sample Site Sample Location Date Sampled Maxi mum Acceptabl e Concentrati on (Heal th Canada Gui del i nes for Canadian Drinking Water Quality )Ma MPR Ave. East of 241A St. 31/05/2016 <1 <1 < < < MPR Ave. East of 241A St. 30/08/ <1 < < < MPR Ave. East of 241A St. 18/10/2016 <1 <1 < < < MPR Ave. East of 241A St. 28/02/2017 <1 <1 < < <1 < MPR Ave. East of 241A St. 16/05/2017 <1 <1 < < < MPR Ave. East of 241A St. 22/08/2017 <1 <1 < < <1 < MPR Ave. East of 241A St. 28/11/2017 <1 <1 < < < MPR St. South of Abernethy Way 31/05/2016 <1 <1 < <0.5 9 < MPR St. South of Abernethy Way 30/08/ <1 < < < MPR St. South of Abernethy Way 18/10/ <1 < < < MPR St. South of Abernethy Way 28/02/2017 <1 <1 < < <1 < MPR St. South of Abernethy Way 16/05/ <1 < < <1 < MPR St. South of Abernethy Way 22/08/2017 <1 <1 < < <1 < MPR St. South of Abernethy Way 28/11/2017 <1 <1 < < <1 < MPR Ave. West off 256 St. 31/05/2016 <1 <1 < < < MPR Ave. West off 256 St. 30/08/ <1 < < < MPR Ave. West off 256 St. 18/10/ <1 < < < MPR Ave. West off 256 St. 28/02/2017 <1 <1 < < < MPR Ave. West off 256 St. 16/05/ <1 < < < MPR Ave. West off 256 St. 22/08/2017 <1 <1 < < <1 < MPR Ave. West off 256 St. 28/11/2017 <1 <1 < < < MPR Ave. 31/05/2016 <1 <1 < < < MPR Ave. 30/08/ <1 < < < MPR Ave. 18/10/2016 <1 <1 < < < MPR Ave. 28/02/2017 <1 <1 < < <1 < MPR Ave. 16/05/2017 <1 <1 < < <1 < MPR Ave. 22/08/2017 <1 <1 < < <1 < MPR Ave. 28/11/2017 <1 <1 < < <1 <
24 Appendix D: Metals and Vinyl Chloride 23
25 none none none none none none none none 1000 none none none none none 200, Aluminium Total (µg/l) Antimony Total (µg/l) Arsenic Total (µg/l) Barium Total (µg/l) Boron Total (µg/l) Cadmium Total (µg/l) Calcium Total (µg/l) Chromium Total (µg/l) Cobalt Total (µg/l) Copper Total (µg/l) Iron Total (µg/l) Lead Total (µg/l) Magnesium Total (µg/l) Manganese Total (µg/l) Mercury Total (µg/l) Molybdenum Total (µg/l) Nickel Total (µg/l) Potassium Total (µg/l) Selenium Total (µg/l) Silver Total (µg/l) Sodium Total (µg/l) Zinc Total (µg/l) City of Maple Ridge Metal Concentration Sample Name Sample Location Sampled Date Maximum Acceptable Concentration (Guidelines for Canadian Drinking Water Quality) Maximum Acceptable Concentration (USEPA National Secondary Drinking 100 Water Regulations) Reason Guideline Established - Health (H) or Aesthetic (A) A H H H H H H A A H A H H A A A MPR-431 Dewdney Trunk 201B St. 2-May <0.5 < <10 < < < <0.05 <0.5 < <0.5 < <3.0 MPR St. South of Abernethy Way 2-May <0.5 < <10 < < < <0.05 <0.5 < <0.5 < < St. South of MPR-435 Abernethy Way- 2-May <0.5 < <10 < < < <0.05 <0.5 < <0.5 < <3.0 Field Duplicate MPR th Ave and Willow Place 2-May <0.5 < <10 < < < <0.05 <0.5 < <0.5 < <3.0 MPR-431 Dewdney Trunk 201B St. 24-Oct <0.5 < <10 < < < <0.05 <0.5 < <0.5 < <3.0 MPR St. South of Abernethy Way 24-Oct <0.5 < <10 < < < <0.05 <0.5 < <0.5 < MPR th Ave and Willow Place 24-Oct <0.5 < <10 < < < <0.05 <0.5 < <0.5 <
26 Sample Site Number Vinyl Chloride Concentration S ample Reported Name S ampled date Vinyl Chloride (μg/ L) MPR-431 Dewdney Trunk 201B St. 13-Jun-17 <0.40 MPR-431 Dewdney Trunk 201B St. 14-Nov-17 <0.40 MPR St. South of Abernethy Way 13-Jun-17 <0.40 MPR St. South of Abernethy Way 14-Nov-17 <0.40 MPR th Ave and Willow Place 13-Jun-17 <0.40 MPR th Ave and Willow Place 14-Nov-17 <
27 Appendix E: Metals without Maximum Concentration Guidelines Neither Health Canada nor the USEPA suggest maximum concentration guidelines for calcium, cobalt, magnesium, molybdenum, nickel, or potassium in drinking water. Additional information related to these metals is provided below. Calcium Health Canada reports there is no evidence of adverse health effects specifically attributable to calcium in drinking water. Insufficient data are available to set a specific value for an aesthetic objective for calcium in drinking water. A guideline for calcium has therefore not been specified Measurements of water samples collected from 71 municipalities across Canada showed that the mean calcium concentrations were 21,400 μg/l for distributed water. 4 Cobalt Neither Health Canada nor the USEPA publish a drinking water quality standard for cobalt. However, as a point of reference one might consider that the BC Ministry of Environment recommends that the maximum concentration of total cobalt should not exceed 110 μg/l to protect aquatic life in the freshwater environment from acute effects of cobalt. 5 Magnesium Health Canada reports there is no evidence of adverse health effects specifically attributable to magnesium in drinking water. A guideline for magnesium has therefore not been specified. Two national surveys of drinking water supplies, encompassing 115 municipalities across Canada, were conducted in 1976 and 1977; magnesium concentrations in distributed water ranged from 200 to 59,500 μg/l. 6 Molybdenum Neither Health Canada nor the USEPA publish a drinking water quality standard for Molybdenum. However, as a point of reference one might consider that the BC Ministry of Environment recommends a maximum of 50 μg/l for various water uses such as irrigation and drinking water for livestock. 7 Nickel Neither Health Canada nor the USEPA publish a drinking water quality standard for nickel. However, as a point of reference one might consider that the BC Ministry of Environment recommends a maximum concentration of 8.3 μg/l nickel for marine aquatic life. 8 4 Guidelines For Canadian Drinking Water Quality Supporting Documents Calcium, Health Canada (1978, updated 1987) 5 Ambient Water Quality Guidelines for Cobalt Overview Report, BC Ministry of Environment (2004) 6 Guidelines For Canadian Drinking Water Quality Supporting Documents- Magnesium, Health Canada (1978, updated 1987) 7 Water Quality Criteria for Molybdenum Overview Report, BC Ministry of Environment (1986) 8 A compendium of Working Water Quality Guidelines for British Columbia, BC Ministry of Environment (2008) 26
28 Potassium Neither Health Canada nor the USEPA publish a drinking water quality standard for potassium. However, as a point of reference one might consider that the BC Ministry of Environment recommends a maximum concentration of 373, 000 μg/l potassium for freshwater aquatic live. 9 9 A Compendium of Working Water Quality Guidelines for British Columbia, BC Ministry of Environment (2008) 27
29 Appendix F: Free Chlorine and Turbidity Charts 28
30 mg/l Free Chlorine / Nephelometric Turbidity Units mg/l Free Chlorine / Nephelometric Turbidity Units City of Maple Ridge Free Chlorine & Turbidity Data for Sample Site MPR-400 Free Chlorine Turbidity Target Chlorine Concentration Jan Feb Mar Apr May Jun Jul Aug Sep Oct Nov Dec 2017 Free Chlorine & Turbidity Data for Sample Site MPR Free Chlorine Turbidity Target Chlorine Concentration Jan Feb Mar Apr May Jun Jul Aug Sep Oct Nov Dec 29
31 mg/l Free Chlorine / Nephelometric Turbidity Units mg/l Free Chlorine / Nephelometric Turbidity Units City of Maple Ridge Free Chlorine & Turbidity Data for Sample Site MPR-432 Free Chlorine Turbidity Target Chlorine Concentration Jan Feb Mar Apr May Jun Jul Aug Sep Oct Nov Dec Free Chlorine & Turbidity Data for Sample Site MPR-433 Free Chlorine Turbidity Target Chlorine Concentration Jan Feb Mar Apr May Jun Jul Aug Sep Oct Nov Dec 30
32 mg/l Free Chlorine / Nephelometric Turbidity Units mg/l Free Chlorine / Nephelometric Turbidity Units City of Maple Ridge Free Chlorine & Turbidity Data for Sample Site MPR-434 Free Chlorine Turbidity Target Chlorine Concentration Jan Feb Mar Apr May Jun Jul Aug Sep Oct Nov Dec Free Chlorine & Turbidity Data for Sample Site MPR-435 Free Chlorine Turbidity Target Chlorine Concentration Jan Feb Mar Apr May Jun Jul Aug Sep Oct Nov Dec 31
33 mg/l Free Chlorine / Nephelometric Turbidity Units mg/l Free Chlorine / Nephelometric Turbidity Units City of Maple Ridge Free Chlorine & Turbidity Data for Sample Site MPR-436 Free Chlorine Turbidity Target Chlorine Concentration Jan Feb Mar Apr May Jun Jul Aug Sep Oct Nov Dec Free Chlorine & Turbidity Data for Sample Site MPR-437 Free Chlorine Turbidity Target Chlorine Concentration Jan Feb Mar Apr May Jun Jul Aug Sep Oct Nov Dec 32
34 mg/l Free Chlorine / Nephelometric Turbidity Units mg/l Free Chlorine / Nephelometric Turbidity Units City of Maple Ridge Free Chlorine & Turbidity Data for Sample Site MPR-438 Free Chlorine Turbidity Target Chlorine Concentration 1.4 Highest Turbidity was 3.9 NTU on December 5, Jan Feb Mar Apr May Jun Jul Aug Sep Oct Nov Dec Free Chlorine & Turbidity Data for Sample Site MPR-439 Free Chlorine Turbidity Target Chlorine Concentration Jan Feb Mar Apr May Jun Jul Aug Sep Oct Nov Dec 33
35 mg/l Free Chlorine / Nephelometric Turbidity Units mg/l Free Chlorine / Nephelometric Turbidity Units City of Maple Ridge Free Chlorine & Turbidity Data for Sample Site MPR-440 Free Chlorine Turbidity Target Chlorine Concentration Jan Feb Mar Apr May Jun Jul Aug Sep Oct Nov Dec Free Chlorine & Turbidity Data for Sample Site MPR-441 Free Chlorine Turbidity Target Chlorine Concentration 1.2 Highest Turbidity was 2.6 NTU on June 20, Jan Feb Mar Apr May Jun Jul Aug Sep Oct Nov Dec 34
36 mg/l Free Chlorine / Nephelometric Turbidity Units mg/l Free Chlorine / Nephelometric Turbidity Units City of Maple Ridge Free Chlorine & Turbidity Data for Sample Site MPR-442 Free Chlorine Turbidity Target Chlorine Concentration Jan Feb Mar Apr May Jun Jul Aug Sep Oct Nov Dec Free Chlorine & Turbidity Data for Sample Site MPR-443 Free Chlorine Turbidity Target Chlorine Concentration Jan Feb Mar Apr May Jun Jul Aug Sep Oct Nov Dec 35
37 mg/l Free Chlorine / Nephelometric Turbidity Units mg/l Free Chlorine / Nephelometric Turbidity Units City of Maple Ridge Free Chlorine & Turbidity Data for Sample Site MPR-444 Free Chlorine Turbidity Target Chlorine Concentration Jan Feb Mar Apr May Jun Jul Aug Sep Oct Nov Dec Free Chlorine & Turbidity Data for Sample Site MPR-445 Free Chlorine Turbidity Target Chlorine Concentration Jan Feb Mar Apr May Jun Jul Aug Sep Oct Nov Dec 36
38 mg/l Free Chlorine / Nephelometric Turbidity Units mg/l Free Chlorine / Nephelometric Turbidity Units City of Maple Ridge Free Chlorine & Turbidity Data for Sample Site MPR-446 Free Chlorine Turbidity Target Chlorine Concentration Jan Feb Mar Apr May Jun Jul Aug Sep Oct Nov Dec Free Chlorine & Turbidity Data for Sample Site MPR-447 Free Chlorine Turbidity Target Chlorine Concentration Jan Feb Mar Apr May Jun Jul Aug Sep Oct Nov Dec 37
39 mg/l Free Chlorine / Nephelometric Turbidity Units mg/l Free Chlorine / Nephelometric Turbidity Units City of Maple Ridge Free Chlorine & Turbidity Data for Sample Site MPR-448 Free Chlorine Turbidity Target Chlorine Concentration Jan Feb Mar Apr May Jun Jul Aug Sep Oct Nov Dec Free Chlorine & Turbidity Data for Sample Site MPR-449 Free Chlorine Turbidity Target Chlorine Concentration 1.2 Highest Turbidity was 2.4 NTU on April 18, Jan Feb Mar Apr May Jun Jul Aug Sep Oct Nov Dec 38
40 Appendix G: Weekly Sample Lab Results 39
41 Sample name Sample reported name Sampled Date Cl 2 Free mg/l E. coli MF/ 100mLs HPC CFU/ml s Temp C Total Coliform MF/100 mls MPR-400 Powell Ave. West of 203rd Street 3-Jan <1 <2 6 < MPR-400 Powell Ave. West of 203rd Street 10-Jan <1 <2 8 < MPR-400 Powell Ave. West of 203rd Street 17-Jan <1 2 7 < MPR-400 Powell Ave. West of 203rd Street 24-Jan <1 <2 7 < MPR-400 Powell Ave. West of 203rd Street 31-Jan <1 <2 7 <1 0.2 MPR-400 Powell Ave. West of 203rd Street 7-Feb <1 <2 6 < MPR-400 Powell Ave. West of 203rd Street 14-Feb <1 <2 7 < MPR-400 Powell Ave. West of 203rd Street 21-Feb <1 <2 7 < MPR-400 Powell Ave. West of 203rd Street 28-Feb <1 <2 7 < MPR-400 Powell Ave. West of 203rd Street 7-Mar <1 <2 7 < MPR-400 Powell Ave. West of 203rd Street 14-Mar <1 <2 7 < MPR-400 Powell Ave. West of 203rd Street 21-Mar <1 <2 7 < MPR-400 Powell Ave. West of 203rd Street 28-Mar <1 <2 8 < MPR-400 Powell Ave. West of 203rd Street 4-Apr <1 <2 8 < MPR-400 Powell Ave. West of 203rd Street 11-Apr <1 <2 9 < MPR-400 Powell Ave. West of 203rd Street 18-Apr <1 <2 8 < MPR-400 Powell Ave. West of 203rd Street 25-Apr <1 <2 9 < MPR-400 Powell Ave. West of 203rd Street 2-May <1 <2 9 < MPR-400 Powell Ave. West of 203rd Street 9-May <1 <2 10 < MPR-400 Powell Ave. West of 203rd Street 16-May <1 <2 10 < MPR-400 Powell Ave. West of 203rd Street 23-May <1 <2 12 < MPR-400 Powell Ave. West of 203rd Street 30-May <1 <2 11 < MPR-400 Powell Ave. West of 203rd Street 6-Jun <1 <2 12 < MPR-400 Powell Ave. West of 203rd Street 13-Jun < <1 0.2 MPR-400 Powell Ave. West of 203rd Street 20-Jun <1 <2 13 <1 0.2 MPR-400 Powell Ave. West of 203rd Street 27-Jun <1 <2 12 < MPR-400 Powell Ave. West of 203rd Street 4-Jul <1 <2 13 < MPR-400 Powell Ave. West of 203rd Street 11-Jul < <1 0.2 MPR-400 Powell Ave. West of 203rd Street 18-Jul < < MPR-400 Powell Ave. West of 203rd Street 25-Jul <1 <2 16 < MPR-400 Powell Ave. West of 203rd Street 1-Aug < < MPR-400 Powell Ave. West of 203rd Street 8-Aug < < MPR-400 Powell Ave. West of 203rd Street 15-Aug < < MPR-400 Powell Ave. West of 203rd Street 22-Aug < < MPR-400 Powell Ave. West of 203rd Street 29-Aug < <1 0.2 MPR-400 Powell Ave. West of 203rd Street 5-Sep < < MPR-400 Powell Ave. West of 203rd Street 12-Sep < < MPR-400 Powell Ave. West of 203rd Street 19-Sep < <1 0.3 MPR-400 Powell Ave. West of 203rd Street 26-Sep < < Turb. NTU 40
42 Sample name Sample reported name Sampled Date Cl 2 Free mg/l E. coli MF/ 100mLs HPC CFU/ml s Temp C Total Coliform MF/100 mls MPR-400 Powell Ave. West of 203rd Street 3-Oct < < MPR-400 Powell Ave. West of 203rd Street 10-Oct < < MPR-400 Powell Ave. West of 203rd Street 17-Oct < < MPR-400 Powell Ave. West of 203rd Street 24-Oct <1 <2 13 < MPR-400 Powell Ave. West of 203rd Street 31-Oct < < MPR-400 Powell Ave. West of 203rd Street 7-Nov < < MPR-400 Powell Ave. West of 203rd Street 14-Nov < < MPR-400 Powell Ave. West of 203rd Street 21-Nov < <1 0.4 MPR-400 Powell Ave. West of 203rd Street 28-Nov < < MPR-400 Powell Ave. West of 203rd Street 5-Dec < <1 0.6 MPR-400 Powell Ave. West of 203rd Street 12-Dec < < MPR-400 Powell Ave. West of 203rd Street 19-Dec <1 NA 9 < MPR-400 Powell Ave. West of 203rd Street 27-Dec <1 NA 8 < MPR-431 Dewdney Trunk 201B St. 3-Jan <1 <2 6 < MPR-431 Dewdney Trunk 201B St. 10-Jan <1 <2 4 < MPR-431 Dewdney Trunk 201B St. 17-Jan <1 <2 4 < MPR-431 Dewdney Trunk 201B St. 24-Jan <1 <2 4 < MPR-431 Dewdney Trunk 201B St. 31-Jan <1 <2 5 < MPR-431 Dewdney Trunk 201B St. 7-Feb <1 <2 4 < MPR-431 Dewdney Trunk 201B St. 14-Feb <1 <2 4 < MPR-431 Dewdney Trunk 201B St. 21-Feb <1 <2 5 < MPR-431 Dewdney Trunk 201B St. 28-Feb <1 <2 5 < MPR-431 Dewdney Trunk 201B St. 7-Mar <1 <2 5 < MPR-431 Dewdney Trunk 201B St. 14-Mar-17 1 <1 <2 5 < MPR-431 Dewdney Trunk 201B St. 21-Mar <1 <2 6 <1 0.3 MPR-431 Dewdney Trunk 201B St. 28-Mar <1 <2 7 < MPR-431 Dewdney Trunk 201B St. 4-Apr <1 <2 7 < MPR-431 Dewdney Trunk 201B St. 11-Apr <1 <2 7 < MPR-431 Dewdney Trunk 201B St. 18-Apr <1 <2 7 < MPR-431 Dewdney Trunk 201B St. 25-Apr <1 <2 8 < MPR-431 Dewdney Trunk 201B St. 2-May <1 <2 8 < MPR-431 Dewdney Trunk 201B St. 9-May <1 <2 9 < MPR-431 Dewdney Trunk 201B St. 16-May <1 <2 10 < MPR-431 Dewdney Trunk 201B St. 23-May <1 <2 10 < MPR-431 Dewdney Trunk 201B St. 30-May <1 <2 11 < MPR-431 Dewdney Trunk 201B St. 6-Jun < <1 0.3 MPR-431 Dewdney Trunk 201B St. 13-Jun <1 <2 13 <1 0.4 MPR-431 Dewdney Trunk 201B St. 20-Jun <1 <2 13 < MPR-431 Dewdney Trunk 201B St. 27-Jun < < Turb. NTU 41
43 Sample name Sample reported name Sampled Date Cl 2 Free mg/l E. coli MF/ 100mLs HPC CFU/ml s Temp C Total Coliform MF/100 mls MPR-431 Dewdney Trunk 201B St. 4-Jul <1 <2 13 < MPR-431 Dewdney Trunk 201B St. 11-Jul <1 <2 14 < MPR-431 Dewdney Trunk 201B St. 18-Jul <1 <2 15 < MPR-431 Dewdney Trunk 201B St. 25-Jul <1 <2 17 < MPR-431 Dewdney Trunk 201B St. 1-Aug <1 <2 17 < MPR-431 Dewdney Trunk 201B St. 8-Aug <1 < < MPR-431 Dewdney Trunk 201B St. 15-Aug <1 < < MPR-431 Dewdney Trunk 201B St. 22-Aug <1 <2 19 < MPR-431 Dewdney Trunk 201B St. 29-Aug <1 <2 18 < MPR-431 Dewdney Trunk 201B St. 5-Sep < < MPR-431 Dewdney Trunk 201B St. 12-Sep <1 <2 18 < MPR-431 Dewdney Trunk 201B St. 19-Sep <1 <2 18 < MPR-431 Dewdney Trunk 201B St. 26-Sep <1 <2 17 < MPR-431 Dewdney Trunk 201B St. 3-Oct <1 <2 17 < MPR-431 Dewdney Trunk 201B St. 10-Oct <1 <2 15 <1 0.3 MPR-431 Dewdney Trunk 201B St. 17-Oct <1 <2 14 < MPR-431 Dewdney Trunk 201B St. 24-Oct <1 <2 12 < MPR-431 Dewdney Trunk 201B St. 31-Oct < < MPR-431 Dewdney Trunk 201B St. 7-Nov <1 <2 11 < MPR-431 Dewdney Trunk 201B St. 14-Nov <1 <2 10 < MPR-431 Dewdney Trunk 201B St. 21-Nov <1 <2 9 < MPR-431 Dewdney Trunk 201B St. 28-Nov <1 <2 8 < MPR-431 Dewdney Trunk 201B St. 5-Dec <1 <2 8 < MPR-431 Dewdney Trunk 201B St. 12-Dec <1 <2 7 < MPR-431 Dewdney Trunk 201B St. 19-Dec <1 NA 8 <1 0.6 MPR-431 Dewdney Trunk 201B St. 27-Dec <1 NA 6 < MPR Ave. 3-Jan <1 <2 5 < MPR Ave. 10-Jan <1 <2 4 < MPR Ave. 17-Jan <1 <2 5 < MPR Ave. 24-Jan <1 <2 4 < MPR Ave. 31-Jan <1 <2 5 < MPR Ave. 7-Feb <1 <2 4 < MPR Ave. 14-Feb <1 <2 4 < MPR Ave. 21-Feb <1 <2 5 < MPR Ave. 28-Feb <1 <2 5 < MPR Ave. 7-Mar <1 <2 5 < MPR Ave. 14-Mar <1 <2 6 < MPR Ave. 21-Mar <1 <2 6 <1 0.4 MPR Ave. 28-Mar <1 <2 7 < Turb. NTU 42
44 Sample name Sample reported name Sampled Date Cl 2 Free mg/l E. coli MF/ 100mLs HPC CFU/ml s Temp C Total Coliform MF/100 mls MPR Ave. 4-Apr <1 <2 7 <1 0.4 MPR Ave. 11-Apr <1 <2 7 < MPR Ave. 18-Apr <1 <2 8 <1 1.1 MPR Ave. 25-Apr <1 <2 9 < MPR Ave. 2-May <1 <2 9 < MPR Ave. 9-May <1 <2 10 < MPR Ave. 16-May <1 <2 9 < MPR Ave. 23-May <1 LA 11 < MPR Ave. 30-May <1 <2 12 < MPR Ave. 6-Jun <1 <2 12 < MPR Ave. 13-Jun <1 <2 12 < MPR Ave. 20-Jun <1 <2 12 < MPR Ave. 27-Jun <1 <2 12 < MPR Ave. 4-Jul <1 <2 13 < MPR Ave. 11-Jul <1 <2 15 < MPR Ave. 18-Jul <1 <2 15 < MPR Ave. 25-Jul <1 <2 15 <1 0.3 MPR Ave. 1-Aug <1 <2 16 < MPR Ave. 8-Aug <1 <2 16 <1 0.3 MPR Ave. 15-Aug <1 < < MPR Ave. 22-Aug <1 <2 17 < MPR Ave. 29-Aug < < MPR Ave. 5-Sep < < MPR Ave. 12-Sep <1 <2 17 < MPR Ave. 19-Sep <1 <2 16 < MPR Ave. 26-Sep < < MPR Ave. 3-Oct <1 <2 15 < MPR Ave. 10-Oct < < MPR Ave. 17-Oct <1 <2 14 < MPR Ave. 24-Oct <1 <2 12 < MPR Ave. 31-Oct <1 <2 12 < MPR Ave. 7-Nov <1 <2 10 < MPR Ave. 14-Nov <1 <2 10 < MPR Ave. 21-Nov <1 <2 9 < MPR Ave. 28-Nov <1 2 9 <1 1.1 MPR Ave. 5-Dec <1 <2 8 <1 0.7 MPR Ave. 12-Dec <1 <2 7 < MPR Ave. 19-Dec <1 NA 7 < MPR Ave. 27-Dec <1 NA 6 < Turb. NTU 43
45 Sample name Sample reported name Sampled Date Cl 2 Free mg/l E. coli MF/ 100mLs HPC CFU/ml s Temp C Total Coliform MF/100 mls MPR St. North of 130 Ave. 3-Jan <1 <2 4 < MPR St. North of 130 Ave. 10-Jan <1 <2 4 < MPR St. North of 130 Ave. 17-Jan <1 <2 5 < MPR St. North of 130 Ave. 24-Jan <1 <2 4 < MPR St. North of 130 Ave. 31-Jan <1 <2 5 < MPR St. North of 130 Ave. 7-Feb <1 2 4 < MPR St. North of 130 Ave. 14-Feb <1 <2 4 < MPR St. North of 130 Ave. 21-Feb <1 <2 5 < MPR St. North of 130 Ave. 28-Feb <1 <2 5 < MPR St. North of 130 Ave. 7-Mar <1 <2 5 < MPR St. North of 130 Ave. 14-Mar <1 <2 5 < MPR St. North of 130 Ave. 21-Mar <1 <2 5 < MPR St. North of 130 Ave. 28-Mar <1 <2 6 < MPR St. North of 130 Ave. 4-Apr <1 <2 6 < MPR St. North of 130 Ave. 11-Apr <1 <2 7 < MPR St. North of 130 Ave. 18-Apr <1 <2 7 < MPR St. North of 130 Ave. 25-Apr <1 <2 7 < MPR St. North of 130 Ave. 2-May <1 <2 7 < MPR St. North of 130 Ave. 9-May <1 <2 8 < MPR St. North of 130 Ave. 16-May <1 2 8 < MPR St. North of 130 Ave. 23-May <1 <2 8 < MPR St. North of 130 Ave. 30-May <1 <2 9 < MPR St. North of 130 Ave. 6-Jun <1 <2 10 < MPR St. North of 130 Ave. 13-Jun < <1 0.3 MPR St. North of 130 Ave. 20-Jun <1 <2 10 < MPR St. North of 130 Ave. 27-Jun < < MPR St. North of 130 Ave. 4-Jul <1 <2 11 < MPR St. North of 130 Ave. 11-Jul <1 <2 12 < MPR St. North of 130 Ave. 18-Jul <1 <2 13 < MPR St. North of 130 Ave. 25-Jul <1 <2 13 < MPR St. North of 130 Ave. 1-Aug <1 <2 14 < MPR St. North of 130 Ave. 8-Aug <1 < < MPR St. North of 130 Ave. 15-Aug <1 < <1 0.3 MPR St. North of 130 Ave. 22-Aug <1 <2 15 < MPR St. North of 130 Ave. 29-Aug < < MPR St. North of 130 Ave. 5-Sep <1 <2 16 < MPR St. North of 130 Ave. 12-Sep <1 <2 16 < MPR St. North of 130 Ave. 19-Sep <1 <2 15 < MPR St. North of 130 Ave. 26-Sep <1 <2 15 < Turb. NTU 44
46 Sample name Sample reported name Sampled Date Cl 2 Free mg/l E. coli MF/ 100mLs HPC CFU/ml s Temp C Total Coliform MF/100 mls MPR St. North of 130 Ave. 3-Oct < < MPR St. North of 130 Ave. 10-Oct < < MPR St. North of 130 Ave. 17-Oct <1 <2 13 < MPR St. North of 130 Ave. 24-Oct <1 <2 11 < MPR St. North of 130 Ave. 31-Oct <1 <2 11 < MPR St. North of 130 Ave. 7-Nov <1 <2 10 <1 0.4 MPR St. North of 130 Ave. 14-Nov <1 2 9 < MPR St. North of 130 Ave. 21-Nov <1 <2 8 < MPR St. North of 130 Ave. 28-Nov <1 <2 6 < MPR St. North of 130 Ave. 5-Dec <1 <2 7 < MPR St. North of 130 Ave. 12-Dec <1 <2 7 < MPR St. North of 130 Ave. 19-Dec <1 NA 6 < MPR St. North of 130 Ave. 27-Dec <1 NA 5 < MPR Ave. East of 241A St. 3-Jan <1 <2 5 < MPR Ave. East of 241A St. 10-Jan <1 <2 5 < MPR Ave. East of 241A St. 17-Jan <1 <2 5 < MPR Ave. East of 241A St. 24-Jan <1 <2 5 < MPR Ave. East of 241A St. 31-Jan <1 <2 5 < MPR Ave. East of 241A St. 7-Feb <1 <2 4 < MPR Ave. East of 241A St. 14-Feb <1 <2 4 < MPR Ave. East of 241A St. 21-Feb <1 <2 6 < MPR Ave. East of 241A St. 28-Feb <1 <2 5 < MPR Ave. East of 241A St. 7-Mar <1 2 5 < MPR Ave. East of 241A St. 14-Mar <1 <2 6 < MPR Ave. East of 241A St. 21-Mar <1 <2 6 < MPR Ave. East of 241A St. 28-Mar <1 <2 7 < MPR Ave. East of 241A St. 4-Apr <1 <2 7 < MPR Ave. East of 241A St. 11-Apr <1 <2 8 < MPR Ave. East of 241A St. 18-Apr <1 <2 8 < MPR Ave. East of 241A St. 25-Apr <1 <2 9 < MPR Ave. East of 241A St. 2-May <1 <2 8 < MPR Ave. East of 241A St. 9-May <1 <2 9 <1 0.3 MPR Ave. East of 241A St. 16-May <1 <2 10 < MPR Ave. East of 241A St. 23-May <1 <2 10 <1 0.4 MPR Ave. East of 241A St. 30-May < < MPR Ave. East of 241A St. 6-Jun < <1 0.4 MPR Ave. East of 241A St. 13-Jun <1 <2 12 <1 0.3 MPR Ave. East of 241A St. 20-Jun <1 <2 12 < MPR Ave. East of 241A St. 27-Jun <1 <2 12 < Turb. NTU 45
47 Sample name Sample reported name Sampled Date Cl 2 Free mg/l E. coli MF/ 100mLs HPC CFU/ml s Temp C Total Coliform MF/100 mls MPR Ave. East of 241A St. 4-Jul <1 <2 13 <1 0.4 MPR Ave. East of 241A St. 11-Jul < < MPR Ave. East of 241A St. 18-Jul <1 <2 15 < MPR Ave. East of 241A St. 25-Jul < < MPR Ave. East of 241A St. 1-Aug <1 <2 16 < MPR Ave. East of 241A St. 8-Aug <1 < < MPR Ave. East of 241A St. 15-Aug <1 < < MPR Ave. East of 241A St. 22-Aug <1 <2 17 < MPR Ave. East of 241A St. 29-Aug <1 <2 17 < MPR Ave. East of 241A St. 5-Sep <1 <2 18 < MPR Ave. East of 241A St. 12-Sep < < MPR Ave. East of 241A St. 19-Sep <1 <2 17 < MPR Ave. East of 241A St. 26-Sep <1 <2 16 < MPR Ave. East of 241A St. 3-Oct <1 <2 16 < MPR Ave. East of 241A St. 10-Oct < < MPR Ave. East of 241A St. 17-Oct <1 <2 14 < MPR Ave. East of 241A St. 24-Oct < < MPR Ave. East of 241A St. 31-Oct <1 <2 12 < MPR Ave. East of 241A St. 7-Nov <1 <2 10 <1 0.4 MPR Ave. East of 241A St. 14-Nov <1 <2 10 < MPR Ave. East of 241A St. 21-Nov <1 <2 9 <1 0.7 MPR Ave. East of 241A St. 28-Nov <1 4 8 <1 0.8 MPR Ave. East of 241A St. 5-Dec <1 <2 8 < MPR Ave. East of 241A St. 12-Dec <1 <2 7 < MPR Ave. East of 241A St. 19-Dec <1 NA 7 < MPR Ave. East of 241A St. 27-Dec <1 NA 6 < MPR St. South of Abernethy Way 3-Jan <1 <2 6 <1 0.7 MPR St. South of Abernethy Way 10-Jan <1 <2 5 < MPR St. South of Abernethy Way 17-Jan <1 <2 5 < MPR St. South of Abernethy Way 24-Jan <1 <2 4 < MPR St. South of Abernethy Way 31-Jan <1 <2 5 < MPR St. South of Abernethy Way 7-Feb <1 <2 5 < MPR St. South of Abernethy Way 14-Feb <1 <2 4 < MPR St. South of Abernethy Way 21-Feb <1 <2 6 < MPR St. South of Abernethy Way 28-Feb <1 <2 5 < MPR St. South of Abernethy Way 7-Mar <1 <2 5 < MPR St. South of Abernethy Way 14-Mar <1 <2 6 < MPR St. South of Abernethy Way 21-Mar <1 <2 6 < MPR St. South of Abernethy Way 28-Mar <1 <2 7 < Turb. NTU 46
48 Sample name Sample reported name Sampled Date Cl 2 Free mg/l E. coli MF/ 100mLs HPC CFU/ml s Temp C Total Coliform MF/100 mls MPR St. South of Abernethy Way 4-Apr <1 <2 7 < MPR St. South of Abernethy Way 11-Apr <1 <2 8 < MPR St. South of Abernethy Way 18-Apr <1 <2 8 < MPR St. South of Abernethy Way 25-Apr <1 <2 9 < MPR St. South of Abernethy Way 2-May <1 <2 9 < MPR St. South of Abernethy Way 9-May <1 <2 10 < MPR St. South of Abernethy Way 16-May <1 <2 10 < MPR St. South of Abernethy Way 23-May <1 <2 10 < MPR St. South of Abernethy Way 30-May <1 <2 11 < MPR St. South of Abernethy Way 6-Jun <1 <2 12 < MPR St. South of Abernethy Way 13-Jun <1 <2 12 < MPR St. South of Abernethy Way 20-Jun <1 <2 11 < MPR St. South of Abernethy Way 27-Jun <1 <2 11 < MPR St. South of Abernethy Way 4-Jul <1 <2 11 < MPR St. South of Abernethy Way 11-Jul <1 <2 12 < MPR St. South of Abernethy Way 18-Jul <1 <2 15 < MPR St. South of Abernethy Way 25-Jul <1 <2 13 < MPR St. South of Abernethy Way 1-Aug <1 <2 14 < MPR St. South of Abernethy Way 8-Aug < < MPR St. South of Abernethy Way 15-Aug < < MPR St. South of Abernethy Way 22-Aug <1 <2 15 <1 0.3 MPR St. South of Abernethy Way 29-Aug <1 LA 15 < MPR St. South of Abernethy Way 5-Sep <1 <2 16 < MPR St. South of Abernethy Way 12-Sep <1 <2 16 < MPR St. South of Abernethy Way 19-Sep <1 <2 15 < MPR St. South of Abernethy Way 26-Sep <1 <2 17 < MPR St. South of Abernethy Way 3-Oct <1 <2 15 < MPR St. South of Abernethy Way 10-Oct <1 <2 14 < MPR St. South of Abernethy Way 17-Oct <1 <2 13 < MPR St. South of Abernethy Way 24-Oct <1 <2 12 < MPR St. South of Abernethy Way 31-Oct <1 <2 11 < MPR St. South of Abernethy Way 7-Nov <1 <2 10 < MPR St. South of Abernethy Way 14-Nov <1 <2 9 < MPR St. South of Abernethy Way 21-Nov <1 <2 8 < MPR St. South of Abernethy Way 28-Nov <1 2 7 <1 0.9 MPR St. South of Abernethy Way 5-Dec <1 2 7 < MPR St. South of Abernethy Way 12-Dec <1 <2 7 < MPR St. South of Abernethy Way 19-Dec <1 NA 6 < MPR St. South of Abernethy Way 27-Dec <1 NA 5 < Turb. NTU 47
49 Sample name Sample reported name Sampled Date Cl 2 Free mg/l E. coli MF/ 100mLs HPC CFU/ml s Temp C Total Coliform MF/100 mls MPR Ave. West of Ansell St. 3-Jan <1 <2 5 < MPR Ave. West of Ansell St. 10-Jan <1 <2 5 < MPR Ave. West of Ansell St. 17-Jan <1 <2 4 < MPR Ave. West of Ansell St. 24-Jan <1 <2 4 < MPR Ave. West of Ansell St. 31-Jan <1 <2 5 < MPR Ave. West of Ansell St. 7-Feb <1 <2 4 < MPR Ave. West of Ansell St. 14-Feb <1 <2 4 < MPR Ave. West of Ansell St. 21-Feb <1 <2 5 < MPR Ave. West of Ansell St. 28-Feb <1 <2 5 <1 0.3 MPR Ave. West of Ansell St. 7-Mar <1 <2 5 <1 0.3 MPR Ave. West of Ansell St. 14-Mar <1 <2 6 < MPR Ave. West of Ansell St. 21-Mar <1 <2 7 < MPR Ave. West of Ansell St. 28-Mar <1 2 7 < MPR Ave. West of Ansell St. 4-Apr <1 <2 7 <1 0.3 MPR Ave. West of Ansell St. 11-Apr <1 <2 8 < MPR Ave. West of Ansell St. 18-Apr <1 <2 8 < MPR Ave. West of Ansell St. 25-Apr <1 <2 10 < MPR Ave. West of Ansell St. 2-May <1 <2 9 < MPR Ave. West of Ansell St. 9-May <1 <2 12 < MPR Ave. West of Ansell St. 16-May <1 <2 12 <1 0.2 MPR Ave. West of Ansell St. 23-May <1 <2 13 < MPR Ave. West of Ansell St. 30-May <1 <2 13 < MPR Ave. West of Ansell St. 6-Jun <1 <2 12 < MPR Ave. West of Ansell St. 13-Jun <1 <2 14 < MPR Ave. West of Ansell St. 20-Jun <1 <2 14 < MPR Ave. West of Ansell St. 27-Jun < <1 0.3 MPR Ave. West of Ansell St. 4-Jul <1 <2 13 < MPR Ave. West of Ansell St. 11-Jul <1 <2 13 < MPR Ave. West of Ansell St. 18-Jul-17 1 <1 <2 14 < MPR Ave. West of Ansell St. 25-Jul <1 <2 15 < MPR Ave. West of Ansell St. 1-Aug <1 <2 15 < MPR Ave. West of Ansell St. 8-Aug <1 < <1 0.2 MPR Ave. West of Ansell St. 15-Aug <1 < < MPR Ave. West of Ansell St. 22-Aug <1 <2 15 < MPR Ave. West of Ansell St. 29-Aug <1 <2 18 < MPR Ave. West of Ansell St. 5-Sep <1 <2 16 < MPR Ave. West of Ansell St. 12-Sep <1 <2 17 < MPR Ave. West of Ansell St. 19-Sep <1 <2 16 < MPR Ave. West of Ansell St. 26-Sep <1 <2 17 < Turb. NTU 48
50 Sample name Sample reported name Sampled Date Cl 2 Free mg/l E. coli MF/ 100mLs HPC CFU/ml s Temp C Total Coliform MF/100 mls MPR Ave. West of Ansell St. 3-Oct < < MPR Ave. West of Ansell St. 10-Oct < <1 0.2 MPR Ave. West of Ansell St. 17-Oct < < MPR Ave. West of Ansell St. 24-Oct < < MPR Ave. West of Ansell St. 31-Oct < < MPR Ave. West of Ansell St. 7-Nov <1 > < MPR Ave. West of Ansell St. 14-Nov <1 > < MPR Ave. West of Ansell St. 21-Nov < < MPR Ave. West of Ansell St. 28-Nov < < MPR Ave. West of Ansell St. 5-Dec < <1 1.4 MPR Ave. West of Ansell St. 12-Dec < < MPR Ave. West of Ansell St. 19-Dec <1 NA 7 < MPR Ave. West of Ansell St. 27-Dec <1 NA 6 < MPR Ave. 3-Jan <1 <2 5 < MPR Ave. 10-Jan <1 <2 5 < MPR Ave. 17-Jan <1 <2 5 < MPR Ave. 24-Jan <1 <2 4 < MPR Ave. 31-Jan <1 <2 5 < MPR Ave. 7-Feb <1 2 4 < MPR Ave. 14-Feb <1 <2 4 <1 0.3 MPR Ave. 21-Feb <1 <2 5 < MPR Ave. 28-Feb <1 <2 5 < MPR Ave. 7-Mar <1 <2 5 < MPR Ave. 14-Mar <1 <2 5 < MPR Ave. 21-Mar <1 2 6 < MPR Ave. 28-Mar <1 <2 7 < MPR Ave. 4-Apr <1 <2 7 < MPR Ave. 11-Apr <1 2 7 < MPR Ave. 18-Apr <1 <2 8 <1 1.2 MPR Ave. 25-Apr <1 <2 8 < MPR Ave. 2-May <1 <2 9 < MPR Ave. 9-May <1 <2 10 < MPR Ave. 16-May <1 <2 10 < MPR Ave. 23-May <1 <2 10 < MPR Ave. 30-May <1 <2 11 < MPR Ave. 6-Jun <1 <2 11 < MPR Ave. 13-Jun <1 <2 11 < MPR Ave. 20-Jun <1 <2 12 < MPR Ave. 27-Jun < < Turb. NTU 49
51 Sample name Sample reported name Sampled Date Cl 2 Free mg/l E. coli MF/ 100mLs HPC CFU/ml s Temp C Total Coliform MF/100 mls MPR Ave. 4-Jul < < MPR Ave. 11-Jul <1 <2 13 < MPR Ave. 18-Jul <1 <2 14 < MPR Ave. 25-Jul <1 <2 14 <1 0.3 MPR Ave. 1-Aug < < MPR Ave. 8-Aug <1 < < MPR Ave. 15-Aug <1 <2 15 < MPR Ave. 22-Aug <1 <2 14 < MPR Ave. 29-Aug <1 <2 16 < MPR Ave. 5-Sep <1 <2 16 < MPR Ave. 12-Sep <1 <2 16 < MPR Ave. 19-Sep <1 <2 15 < MPR Ave. 26-Sep < < MPR Ave. 3-Oct < < MPR Ave. 10-Oct <1 <2 14 < MPR Ave. 17-Oct <1 <2 13 < MPR Ave. 24-Oct <1 <2 12 < MPR Ave. 31-Oct <1 <2 11 < MPR Ave. 7-Nov <1 <2 10 < MPR Ave. 14-Nov <1 2 9 < MPR Ave. 21-Nov <1 <2 9 <1 0.5 MPR Ave. 28-Nov <1 <2 8 <1 0.7 MPR Ave. 5-Dec <1 <2 8 < MPR Ave. 12-Dec <1 <2 7 < MPR Ave. 19-Dec <1 NA 6 < MPR Ave. 27-Dec <1 NA 5 < MPR Ave. West off 256 St. 3-Jan <1 <2 6 < MPR Ave. West off 256 St. 10-Jan <1 <2 5 < MPR Ave. West off 256 St. 17-Jan <1 <2 5 <1 0.2 MPR Ave. West off 256 St. 24-Jan <1 <2 4 < MPR Ave. West off 256 St. 31-Jan <1 <2 5 < MPR Ave. West off 256 St. 7-Feb <1 <2 4 < MPR Ave. West off 256 St. 14-Feb <1 <2 4 < MPR Ave. West off 256 St. 21-Feb <1 <2 5 < MPR Ave. West off 256 St. 28-Feb <1 <2 5 < MPR Ave. West off 256 St. 7-Mar <1 <2 5 < MPR Ave. West off 256 St. 14-Mar <1 2 5 < MPR Ave. West off 256 St. 21-Mar <1 <2 6 < MPR Ave. West off 256 St. 28-Mar <1 <2 6 < Turb. NTU 50
52 Sample name Sample reported name Sampled Date Cl 2 Free mg/l E. coli MF/ 100mLs HPC CFU/ml s Temp C Total Coliform MF/100 mls MPR Ave. West off 256 St. 4-Apr <1 <2 7 < MPR Ave. West off 256 St. 11-Apr <1 2 7 < MPR Ave. West off 256 St. 18-Apr <1 <2 8 < MPR Ave. West off 256 St. 25-Apr <1 <2 8 < MPR Ave. West off 256 St. 2-May <1 <2 9 < MPR Ave. West off 256 St. 9-May < <1 0.5 MPR Ave. West off 256 St. 16-May <1 <2 10 < MPR Ave. West off 256 St. 23-May <1 <2 9 < MPR Ave. West off 256 St. 30-May <1 <2 11 < MPR Ave. West off 256 St. 6-Jun <1 <2 11 < MPR Ave. West off 256 St. 13-Jun <1 <2 12 < MPR Ave. West off 256 St. 20-Jun <1 <2 12 < MPR Ave. West off 256 St. 27-Jun <1 <2 11 < MPR Ave. West off 256 St. 4-Jul <1 <2 16 < MPR Ave. West off 256 St. 11-Jul <1 <2 13 <1 0.3 MPR Ave. West off 256 St. 18-Jul <1 <2 15 < MPR Ave. West off 256 St. 25-Jul <1 <2 14 < MPR Ave. West off 256 St. 1-Aug <1 <2 15 < MPR Ave. West off 256 St. 8-Aug <1 < <1 0.2 MPR Ave. West off 256 St. 15-Aug <1 < < MPR Ave. West off 256 St. 22-Aug <1 <2 16 < MPR Ave. West off 256 St. 29-Aug <1 <2 16 < MPR Ave. West off 256 St. 5-Sep <1 <2 18 < MPR Ave. West off 256 St. 12-Sep <1 <2 16 < MPR Ave. West off 256 St. 19-Sep <1 <2 17 < MPR Ave. West off 256 St. 26-Sep <1 <2 17 < MPR Ave. West off 256 St. 3-Oct <1 <2 15 < MPR Ave. West off 256 St. 10-Oct <1 <2 14 < MPR Ave. West off 256 St. 17-Oct <1 <2 13 < MPR Ave. West off 256 St. 24-Oct <1 <2 12 < MPR Ave. West off 256 St. 31-Oct <1 <2 12 < MPR Ave. West off 256 St. 7-Nov <1 <2 10 < MPR Ave. West off 256 St. 14-Nov <1 2 9 < MPR Ave. West off 256 St. 21-Nov <1 <2 9 < MPR Ave. West off 256 St. 28-Nov <1 <2 9 < MPR Ave. West off 256 St. 5-Dec <1 <2 8 <1 3.9 MPR Ave. West off 256 St. 12-Dec <1 <2 7 < MPR Ave. West off 256 St. 19-Dec <1 NA 6 < MPR Ave. West off 256 St. 27-Dec <1 NA 5 < Turb. NTU 51
53 Sample name Sample reported name Sampled Date Cl 2 Free mg/l E. coli MF/ 100mLs HPC CFU/ml s Temp C Total Coliform MF/100 mls MPR A St. (W. of 256 St.) 3-Jan <1 <2 5 < MPR A St. (W. of 256 St.) 10-Jan <1 <2 4 < MPR A St. (W. of 256 St.) 17-Jan <1 <2 4 < MPR A St. (W. of 256 St.) 24-Jan <1 <2 3 <1 0.5 MPR A St. (W. of 256 St.) 31-Jan <1 <2 4 < MPR A St. (W. of 256 St.) 7-Feb <1 <2 3 < MPR A St. (W. of 256 St.) 14-Feb <1 <2 3 < MPR A St. (W. of 256 St.) 21-Feb <1 <2 4 < MPR A St. (W. of 256 St.) 28-Feb <1 <2 4 < MPR A St. (W. of 256 St.) 7-Mar <1 <2 4 < MPR A St. (W. of 256 St.) 14-Mar <1 <2 5 < MPR A St. (W. of 256 St.) 21-Mar <1 <2 6 < MPR A St. (W. of 256 St.) 28-Mar <1 <2 7 < MPR A St. (W. of 256 St.) 4-Apr <1 <2 8 < MPR A St. (W. of 256 St.) 11-Apr <1 <2 8 < MPR A St. (W. of 256 St.) 18-Apr <1 <2 8 < MPR A St. (W. of 256 St.) 25-Apr <1 <2 10 <1 0.5 MPR A St. (W. of 256 St.) 2-May <1 <2 10 < MPR A St. (W. of 256 St.) 9-May <1 <2 12 < MPR A St. (W. of 256 St.) 16-May <1 <2 12 < MPR A St. (W. of 256 St.) 23-May <1 <2 13 < MPR A St. (W. of 256 St.) 30-May <1 <2 16 < MPR A St. (W. of 256 St.) 6-Jun <1 <2 16 < MPR A St. (W. of 256 St.) 13-Jun < <1 0.3 MPR A St. (W. of 256 St.) 20-Jun <1 <2 16 < MPR A St. (W. of 256 St.) 27-Jun <1 <2 17 < MPR A St. (W. of 256 St.) 4-Jul <1 <2 19 < MPR A St. (W. of 256 St.) 11-Jul <1 <2 20 < MPR A St. (W. of 256 St.) 18-Jul <1 <2 20 < MPR A St. (W. of 256 St.) 25-Jul <1 <2 19 < MPR A St. (W. of 256 St.) 1-Aug <1 <2 20 < MPR A St. (W. of 256 St.) 8-Aug <1 < < MPR A St. (W. of 256 St.) 15-Aug <1 < < MPR A St. (W. of 256 St.) 22-Aug <1 <2 19 <1 0.2 MPR A St. (W. of 256 St.) 29-Aug <1 <2 19 < MPR A St. (W. of 256 St.) 5-Sep <1 <2 19 < MPR A St. (W. of 256 St.) 12-Sep <1 <2 18 < MPR A St. (W. of 256 St.) 19-Sep < < MPR A St. (W. of 256 St.) 26-Sep <1 <2 17 < Turb. NTU 52
54 Sample name Sample reported name Sampled Date Cl 2 Free mg/l E. coli MF/ 100mLs HPC CFU/ml s Temp C Total Coliform MF/100 mls MPR A St. (W. of 256 St.) 3-Oct < < MPR A St. (W. of 256 St.) 10-Oct < < MPR A St. (W. of 256 St.) 17-Oct < < MPR A St. (W. of 256 St.) 24-Oct < < MPR A St. (W. of 256 St.) 31-Oct < <1 0.6 MPR A St. (W. of 256 St.) 7-Nov < < MPR A St. (W. of 256 St.) 14-Nov < < MPR A St. (W. of 256 St.) 21-Nov < < MPR A St. (W. of 256 St.) 28-Nov <1 <2 9 < MPR A St. (W. of 256 St.) 5-Dec <1 <2 8 <1 0.7 MPR A St. (W. of 256 St.) 12-Dec <1 <2 7 < MPR A St. (W. of 256 St.) 19-Dec <1 NA 6 < MPR A St. (W. of 256 St.) 27-Dec <1 NA 5 < MPR Ave. 3-Jan <1 <2 5 < MPR Ave. 10-Jan <1 <2 4 < MPR Ave. 17-Jan <1 <2 4 < MPR Ave. 24-Jan <1 <2 4 < MPR Ave. 31-Jan <1 <2 5 < MPR Ave. 7-Feb <1 <2 4 < MPR Ave. 14-Feb <1 <2 3 < MPR Ave. 21-Feb <1 <2 5 < MPR Ave. 28-Feb <1 2 5 < MPR Ave. 7-Mar <1 <2 4 < MPR Ave. 14-Mar <1 < MPR Ave. 21-Mar <1 2 5 < MPR Ave. 28-Mar <1 2 6 < MPR Ave. 4-Apr <1 <2 6 < MPR Ave. 11-Apr-17 1 <1 <2 7 < MPR Ave. 18-Apr <1 <2 7 <1 1.1 MPR Ave. 25-Apr <1 <2 7 < MPR Ave. 2-May <1 <2 7 < MPR Ave. 9-May <1 <2 8 < MPR Ave. 16-May <1 <2 8 < MPR Ave. 23-May <1 <2 9 < MPR Ave. 30-May <1 <2 10 < MPR Ave. 6-Jun <1 <2 10 < MPR Ave. 13-Jun <1 <2 10 < MPR Ave. 20-Jun <1 <2 10 < MPR Ave. 27-Jun <1 <2 10 < Turb. NTU 53
55 Sample name Sample reported name Sampled Date Cl 2 Free mg/l E. coli MF/ 100mLs HPC CFU/ml s Temp C Total Coliform MF/100 mls MPR Ave. 4-Jul <1 <2 11 < MPR Ave. 11-Jul <1 <2 12 < MPR Ave. 18-Jul <1 <2 12 < MPR Ave. 25-Jul <1 <2 14 < MPR Ave. 1-Aug <1 <2 14 < MPR Ave. 8-Aug <1 <2 14 < MPR Ave. 15-Aug <1 LA 14.3 < MPR Ave. 22-Aug <1 <2 15 < MPR Ave. 29-Aug <1 <2 15 < MPR Ave. 5-Sep <1 <2 16 < MPR Ave. 12-Sep <1 <2 16 <1 0.4 MPR Ave. 19-Sep <1 <2 15 < MPR Ave. 26-Sep <1 <2 15 < MPR Ave. 3-Oct < < MPR Ave. 10-Oct <1 <2 13 < MPR Ave. 17-Oct <1 <2 13 < MPR Ave. 24-Oct <1 <2 11 <1 0.6 MPR Ave. 31-Oct <1 <2 11 < MPR Ave. 7-Nov <1 <2 10 < MPR Ave. 14-Nov <1 <2 8 < MPR Ave. 21-Nov <1 <2 8 < MPR Ave. 28-Nov <1 <2 7 < MPR Ave. 5-Dec <1 <2 7 < MPR Ave. 12-Dec <1 <2 7 < MPR Ave. 19-Dec <1 NA 6 < MPR Ave. 27-Dec <1 NA 5 < MPR Cedar Way 3-Jan <1 <2 5 < MPR Cedar Way 10-Jan <1 <2 4 < MPR Cedar Way 17-Jan <1 <2 3 < MPR Cedar Way 24-Jan <1 <2 4 < MPR Cedar Way 31-Jan <1 <2 4 < MPR Cedar Way 7-Feb <1 <2 3 < MPR Cedar Way 14-Feb <1 <2 3 < MPR Cedar Way 21-Feb <1 6 5 < MPR Cedar Way 28-Feb <1 <2 5 < MPR Cedar Way 7-Mar <1 2 5 < MPR Cedar Way 14-Mar <1 < MPR Cedar Way 21-Mar <1 <2 6 < MPR Cedar Way 28-Mar <1 <2 8 < Turb. NTU 54
56 Sample name Sample reported name Sampled Date Cl 2 Free mg/l E. coli MF/ 100mLs HPC CFU/ml s Temp C Total Coliform MF/100 mls MPR Cedar Way 4-Apr <1 <2 8 < MPR Cedar Way 11-Apr <1 4 8 < MPR Cedar Way 18-Apr <1 <2 9 <1 0.6 MPR Cedar Way 25-Apr <1 <2 10 <1 0.4 MPR Cedar Way 2-May <1 <2 10 < MPR Cedar Way 9-May <1 <2 12 < MPR Cedar Way 16-May < < MPR Cedar Way 23-May <1 <2 14 <1 0.3 MPR Cedar Way 30-May <1 <2 15 < MPR Cedar Way 6-Jun < < MPR Cedar Way 13-Jun <1 <2 16 < MPR Cedar Way 20-Jun <1 <2 15 <1 2.6 MPR Cedar Way 27-Jun <1 <2 16 < MPR Cedar Way 4-Jul <1 <2 17 < MPR Cedar Way 11-Jul <1 <2 17 < MPR Cedar Way 18-Jul < < MPR Cedar Way 25-Jul < < MPR Cedar Way 1-Aug <1 <2 18 < MPR Cedar Way 8-Aug <1 < < MPR Cedar Way 15-Aug < < MPR Cedar Way 22-Aug <1 <2 19 < MPR Cedar Way 29-Aug < < MPR Cedar Way 5-Sep <1 <2 19 < MPR Cedar Way 12-Sep < < MPR Cedar Way 19-Sep-17 0 < < MPR Cedar Way 26-Sep <1 <2 17 < MPR Cedar Way 3-Oct < < MPR Cedar Way 10-Oct < < MPR Cedar Way 17-Oct < < MPR Cedar Way 24-Oct < < MPR Cedar Way 31-Oct < < MPR Cedar Way 7-Nov < < MPR Cedar Way 14-Nov < < MPR Cedar Way 21-Nov < <1 0.7 MPR Cedar Way 28-Nov < <1 0.7 MPR Cedar Way 5-Dec < < MPR Cedar Way 12-Dec <1 6 8 < MPR Cedar Way 19-Dec <1 NA 7 < MPR Cedar Way 27-Dec <1 NA 6 < Turb. NTU 55
57 Sample name Sample reported name Sampled Date Cl 2 Free mg/l E. coli MF/ 100mLs HPC CFU/ml s Temp C Total Coliform MF/100 mls MPR-442 Princess Ditton St. 3-Jan <1 <2 6 < MPR-442 Princess Ditton St. 10-Jan <1 <2 5 < MPR-442 Princess Ditton St. 17-Jan <1 2 5 < MPR-442 Princess Ditton St. 24-Jan <1 <2 5 < MPR-442 Princess Ditton St. 31-Jan <1 <2 5 < MPR-442 Princess Ditton St. 7-Feb <1 <2 5 < MPR-442 Princess Ditton St. 14-Feb <1 <2 4 < MPR-442 Princess Ditton St. 21-Feb <1 <2 6 < MPR-442 Princess Ditton St. 28-Feb <1 <2 6 < MPR-442 Princess Ditton St. 7-Mar <1 <2 5 < MPR-442 Princess Ditton St. 14-Mar <1 <2 6 < MPR-442 Princess Ditton St. 21-Mar <1 <2 6 < MPR-442 Princess Ditton St. 28-Mar <1 <2 7 < MPR-442 Princess Ditton St. 4-Apr <1 <2 7 < MPR-442 Princess Ditton St. 11-Apr <1 <2 8 < MPR-442 Princess Ditton St. 18-Apr <1 <2 8 < MPR-442 Princess Ditton St. 25-Apr <1 <2 9 < MPR-442 Princess Ditton St. 2-May <1 <2 9 < MPR-442 Princess Ditton St. 9-May <1 <2 10 < MPR-442 Princess Ditton St. 16-May <1 <2 10 < MPR-442 Princess Ditton St. 23-May <1 <2 10 < MPR-442 Princess Ditton St. 30-May < < MPR-442 Princess Ditton St. 6-Jun <1 <2 12 < MPR-442 Princess Ditton St. 13-Jun <1 <2 12 < MPR-442 Princess Ditton St. 20-Jun <1 <2 13 < MPR-442 Princess Ditton St. 27-Jun < < MPR-442 Princess Ditton St. 4-Jul <1 <2 14 <1 0.3 MPR-442 Princess Ditton St. 11-Jul <1 <2 15 < MPR-442 Princess Ditton St. 18-Jul <1 <2 15 < MPR-442 Princess Ditton St. 25-Jul <1 <2 15 < MPR-442 Princess Ditton St. 1-Aug <1 <2 16 < MPR-442 Princess Ditton St. 8-Aug <1 < < MPR-442 Princess Ditton St. 15-Aug <1 < < MPR-442 Princess Ditton St. 22-Aug <1 <2 18 < MPR-442 Princess Ditton St. 29-Aug <1 <2 17 < MPR-442 Princess Ditton St. 5-Sep <1 <2 19 < MPR-442 Princess Ditton St. 12-Sep < < MPR-442 Princess Ditton St. 19-Sep < < MPR-442 Princess Ditton St. 26-Sep <1 <2 16 < Turb. NTU 56
58 Sample name Sample reported name Sampled Date Cl 2 Free mg/l E. coli MF/ 100mLs HPC CFU/ml s Temp C Total Coliform MF/100 mls MPR-442 Princess Ditton St. 3-Oct < < MPR-442 Princess Ditton St. 10-Oct <1 <2 15 < MPR-442 Princess Ditton St. 17-Oct <1 <2 14 < MPR-442 Princess Ditton St. 24-Oct <1 <2 13 < MPR-442 Princess Ditton St. 31-Oct <1 <2 13 < MPR-442 Princess Ditton St. 7-Nov < < MPR-442 Princess Ditton St. 14-Nov < < MPR-442 Princess Ditton St. 21-Nov <1 <2 10 < MPR-442 Princess Ditton St. 28-Nov <1 <2 10 < MPR-442 Princess Ditton St. 5-Dec <1 <2 9 <1 0.6 MPR-442 Princess Ditton St. 12-Dec <1 <2 8 < MPR-442 Princess Ditton St. 19-Dec <1 NA 8 < MPR-442 Princess Ditton St. 27-Dec <1 NA 7 < MPR Donovan 3-Jan <1 <2 5 < MPR Donovan 10-Jan <1 2 4 < MPR Donovan 17-Jan <1 <2 5 < MPR Donovan 24-Jan <1 <2 5 < MPR Donovan 31-Jan <1 <2 5 < MPR Donovan 7-Feb <1 <2 4 < MPR Donovan 14-Feb <1 <2 4 < MPR Donovan 21-Feb <1 <2 5 < MPR Donovan 28-Feb-17 1 <1 <2 5 < MPR Donovan 7-Mar <1 <2 5 < MPR Donovan 14-Mar <1 <2 6 < MPR Donovan 21-Mar <1 2 7 < MPR Donovan 28-Mar <1 4 7 < MPR Donovan 4-Apr <1 <2 8 < MPR Donovan 11-Apr <1 <2 8 < MPR Donovan 18-Apr <1 <2 8 < MPR Donovan 25-Apr <1 <2 9 < MPR Donovan 2-May <1 <2 9 < MPR Donovan 9-May <1 <2 10 < MPR Donovan 16-May <1 <2 10 < MPR Donovan 23-May <1 <2 10 < MPR Donovan 30-May <1 <2 11 < MPR Donovan 6-Jun <1 <2 11 < MPR Donovan 13-Jun <1 <2 12 < MPR Donovan 20-Jun <1 LA 12 < MPR Donovan 27-Jun <1 <2 12 <1 0.4 Turb. NTU 57
59 Sample name Sample reported name Sampled Date Cl 2 Free mg/l E. coli MF/ 100mLs HPC CFU/ml s Temp C Total Coliform MF/100 mls MPR Donovan 4-Jul <1 <2 12 < MPR Donovan 11-Jul <1 <2 14 < MPR Donovan 18-Jul < < MPR Donovan 25-Jul <1 <2 15 < MPR Donovan 1-Aug <1 <2 16 <1 0.3 MPR Donovan 8-Aug <1 < < MPR Donovan 15-Aug <1 <2 16 < MPR Donovan 22-Aug <1 <2 17 <1 0.2 MPR Donovan 29-Aug <1 <2 16 < MPR Donovan 5-Sep-17 1 <1 <2 18 < MPR Donovan 12-Sep <1 <2 17 < MPR Donovan 19-Sep <1 <2 17 < MPR Donovan 26-Sep <1 <2 17 < MPR Donovan 3-Oct < < MPR Donovan 10-Oct <1 <2 14 < MPR Donovan 17-Oct <1 <2 14 < MPR Donovan 24-Oct <1 <2 12 < MPR Donovan 31-Oct <1 <2 12 < MPR Donovan 7-Nov < < MPR Donovan 14-Nov <1 <2 9 < MPR Donovan 21-Nov <1 <2 9 < MPR Donovan 28-Nov <1 <2 8 < MPR Donovan 5-Dec <1 <2 8 < MPR Donovan 12-Dec <1 <2 7 < MPR Donovan 19-Dec <1 NA 7 < MPR Donovan 27-Dec <1 NA 5 < MPR-444 Foreman 232nd St. 3-Jan <1 <2 4 < MPR-444 Foreman 232nd St. 10-Jan <1 <2 4 < MPR-444 Foreman 232nd St. 17-Jan <1 <2 4 < MPR-444 Foreman 232nd St. 24-Jan <1 <2 4 < MPR-444 Foreman 232nd St. 31-Jan <1 <2 5 < MPR-444 Foreman 232nd St. 7-Feb <1 <2 4 < MPR-444 Foreman 232nd St. 14-Feb <1 <2 4 < MPR-444 Foreman 232nd St. 21-Feb <1 <2 5 <1 0.4 MPR-444 Foreman 232nd St. 28-Feb <1 <2 5 < MPR-444 Foreman 232nd St. 7-Mar <1 2 5 < MPR-444 Foreman 232nd St. 14-Mar <1 <2 5 < MPR-444 Foreman 232nd St. 21-Mar <1 <2 6 < MPR-444 Foreman 232nd St. 28-Mar <1 <2 7 < Turb. NTU 58
60 Sample name Sample reported name Sampled Date Cl 2 Free mg/l E. coli MF/ 100mLs HPC CFU/ml s Temp C Total Coliform MF/100 mls MPR-444 Foreman 232nd St. 4-Apr <1 <2 7 < MPR-444 Foreman 232nd St. 11-Apr <1 <2 7 < MPR-444 Foreman 232nd St. 18-Apr <1 <2 8 < MPR-444 Foreman 232nd St. 25-Apr <1 2 9 <1 0.4 MPR-444 Foreman 232nd St. 2-May <1 <2 9 < MPR-444 Foreman 232nd St. 9-May <1 <2 10 < MPR-444 Foreman 232nd St. 16-May <1 <2 10 < MPR-444 Foreman 232nd St. 23-May <1 <2 10 < MPR-444 Foreman 232nd St. 30-May <1 <2 12 < MPR-444 Foreman 232nd St. 6-Jun <1 <2 12 < MPR-444 Foreman 232nd St. 13-Jun <1 <2 13 < MPR-444 Foreman 232nd St. 20-Jun <1 <2 12 < MPR-444 Foreman 232nd St. 27-Jun <1 <2 12 < MPR-444 Foreman 232nd St. 4-Jul <1 <2 13 < MPR-444 Foreman 232nd St. 11-Jul < < MPR-444 Foreman 232nd St. 18-Jul < < MPR-444 Foreman 232nd St. 25-Jul < < MPR-444 Foreman 232nd St. 1-Aug <1 <2 15 < MPR-444 Foreman 232nd St. 8-Aug <1 < < MPR-444 Foreman 232nd St. 15-Aug <1 < < MPR-444 Foreman 232nd St. 22-Aug <1 <2 16 < MPR-444 Foreman 232nd St. 29-Aug <1 <2 16 < MPR-444 Foreman 232nd St. 5-Sep < < MPR-444 Foreman 232nd St. 12-Sep < <1 0.3 MPR-444 Foreman 232nd St. 19-Sep <1 <2 16 < MPR-444 Foreman 232nd St. 26-Sep < < MPR-444 Foreman 232nd St. 3-Oct <1 <2 15 < MPR-444 Foreman 232nd St. 10-Oct <1 <2 14 < MPR-444 Foreman 232nd St. 17-Oct <1 <2 14 < MPR-444 Foreman 232nd St. 24-Oct <1 <2 12 < MPR-444 Foreman 232nd St. 31-Oct <1 <2 12 < MPR-444 Foreman 232nd St. 7-Nov <1 <2 10 < MPR-444 Foreman 232nd St. 14-Nov <1 <2 9 < MPR-444 Foreman 232nd St. 21-Nov <1 <2 9 < MPR-444 Foreman 232nd St. 28-Nov <1 <2 8 < MPR-444 Foreman 232nd St. 5-Dec <1 <2 8 < MPR-444 Foreman 232nd St. 12-Dec <1 <2 7 < MPR-444 Foreman 232nd St. 19-Dec <1 NA 7 < MPR-444 Foreman 232nd St. 27-Dec <1 NA 5 < Turb. NTU 59
61 Sample name Sample reported name Sampled Date Cl 2 Free mg/l E. coli MF/ 100mLs HPC CFU/ml s Temp C Total Coliform MF/100 mls MPR th Ave. and 266 St. 3-Jan <1 <2 4 < MPR th Ave. and 266 St. 10-Jan <1 <2 5 < MPR th Ave. and 266 St. 17-Jan <1 <2 5 < MPR th Ave. and 266 St. 24-Jan <1 <2 5 < MPR th Ave. and 266 St. 31-Jan <1 <2 5 < MPR th Ave. and 266 St. 7-Feb <1 <2 4 < MPR th Ave. and 266 St. 14-Feb <1 <2 4 < MPR th Ave. and 266 St. 21-Feb <1 <2 5 < MPR th Ave. and 266 St. 28-Feb <1 <2 5 <1 0.3 MPR th Ave. and 266 St. 7-Mar <1 <2 5 < MPR th Ave. and 266 St. 14-Mar <1 <2 6 < MPR th Ave. and 266 St. 21-Mar <1 <2 6 < MPR th Ave. and 266 St. 28-Mar <1 <2 7 < MPR th Ave. and 266 St. 4-Apr <1 <2 7 < MPR th Ave. and 266 St. 11-Apr <1 <2 8 < MPR th Ave. and 266 St. 18-Apr <1 <2 8 < MPR th Ave. and 266 St. 25-Apr-17 1 <1 2 9 < MPR th Ave. and 266 St. 2-May <1 <2 9 < MPR th Ave. and 266 St. 9-May <1 <2 11 < MPR th Ave. and 266 St. 16-May <1 <2 11 <1 0.3 MPR th Ave. and 266 St. 23-May < <1 0.6 MPR th Ave. and 266 St. 30-May <1 <2 13 < MPR th Ave. and 266 St. 6-Jun <1 <2 14 < MPR th Ave. and 266 St. 13-Jun <1 <2 15 <1 0.4 MPR th Ave. and 266 St. 20-Jun <1 <2 14 < MPR th Ave. and 266 St. 27-Jun <1 <2 13 < MPR th Ave. and 266 St. 4-Jul < < MPR th Ave. and 266 St. 11-Jul <1 <2 17 < MPR th Ave. and 266 St. 18-Jul <1 <2 18 < MPR th Ave. and 266 St. 25-Jul <1 <2 17 < MPR th Ave. and 266 St. 1-Aug <1 <2 17 < MPR th Ave. and 266 St. 8-Aug <1 <2 18 < MPR th Ave. and 266 St. 15-Aug <1 < < MPR th Ave. and 266 St. 22-Aug <1 <2 18 <1 0.2 MPR th Ave. and 266 St. 29-Aug <1 <2 18 < MPR th Ave. and 266 St. 5-Sep <1 <2 19 < MPR th Ave. and 266 St. 12-Sep-17 1 <1 <2 19 < MPR th Ave. and 266 St. 19-Sep < <1 0.2 MPR th Ave. and 266 St. 26-Sep < < Turb. NTU 60
62 Sample name Sample reported name Sampled Date Cl 2 Free mg/l E. coli MF/ 100mLs HPC CFU/ml s Temp C Total Coliform MF/100 mls MPR th Ave. and 266 St. 3-Oct < <1 0.3 MPR th Ave. and 266 St. 10-Oct < < MPR th Ave. and 266 St. 17-Oct < < MPR th Ave. and 266 St. 24-Oct < < MPR th Ave. and 266 St. 31-Oct < < MPR th Ave. and 266 St. 7-Nov < < MPR th Ave. and 266 St. 14-Nov <1 <2 10 < MPR th Ave. and 266 St. 21-Nov < < MPR th Ave. and 266 St. 28-Nov < < MPR th Ave. and 266 St. 5-Dec <1 2 9 < MPR th Ave. and 266 St. 12-Dec < <1 0.5 MPR th Ave. and 266 St. 19-Dec <1 NA 7 < MPR th Ave. and 266 St. 27-Dec <1 NA 7 < MPR th Ave and Willow Place 3-Jan < <1 0.3 MPR th Ave and Willow Place 10-Jan <1 <2 5 < MPR th Ave and Willow Place 17-Jan <1 <2 4 < MPR th Ave and Willow Place 24-Jan <1 <2 4 < MPR th Ave and Willow Place 31-Jan <1 <2 5 < MPR th Ave and Willow Place 7-Feb <1 <2 4 < MPR th Ave and Willow Place 14-Feb <1 <2 4 <1 0.3 MPR th Ave and Willow Place 21-Feb <1 <2 5 <1 1.2 MPR th Ave and Willow Place 28-Feb <1 6 5 < MPR th Ave and Willow Place 7-Mar <1 <2 4 < MPR th Ave and Willow Place 14-Mar <1 <2 5 < MPR th Ave and Willow Place 21-Mar <1 <2 5 < MPR th Ave and Willow Place 28-Mar <1 <2 6 < MPR th Ave and Willow Place 4-Apr <1 <2 7 < MPR th Ave and Willow Place 11-Apr <1 <2 7 < MPR th Ave and Willow Place 18-Apr <1 <2 7 < MPR th Ave and Willow Place 25-Apr <1 <2 8 <1 0.6 MPR th Ave and Willow Place 2-May <1 <2 8 < MPR th Ave and Willow Place 9-May <1 <2 10 < MPR th Ave and Willow Place 16-May <1 <2 10 < MPR th Ave and Willow Place 23-May <1 <2 11 < MPR th Ave and Willow Place 30-May <1 <2 13 <1 0.4 MPR th Ave and Willow Place 6-Jun <1 <2 13 < MPR th Ave and Willow Place 13-Jun <1 <2 13 < MPR th Ave and Willow Place 20-Jun < < MPR th Ave and Willow Place 27-Jun <1 <2 13 <1 0.3 Turb. NTU 61
63 Sample name Sample reported name Sampled Date Cl 2 Free mg/l E. coli MF/ 100mLs HPC CFU/ml s Temp C Total Coliform MF/100 mls MPR th Ave and Willow Place 4-Jul <1 <2 14 < MPR th Ave and Willow Place 11-Jul <1 <2 15 < MPR th Ave and Willow Place 18-Jul <1 <2 15 < MPR th Ave and Willow Place 25-Jul <1 <2 15 < MPR th Ave and Willow Place 1-Aug <1 <2 16 < MPR th Ave and Willow Place 8-Aug < < MPR th Ave and Willow Place 15-Aug <1 < <1 0.3 MPR th Ave and Willow Place 22-Aug <1 <2 17 < MPR th Ave and Willow Place 29-Aug < < MPR th Ave and Willow Place 5-Sep <1 <2 17 < MPR th Ave and Willow Place 12-Sep <1 <2 17 < MPR th Ave and Willow Place 19-Sep < < MPR th Ave and Willow Place 26-Sep <1 <2 15 < MPR th Ave and Willow Place 3-Oct <1 <2 14 < MPR th Ave and Willow Place 10-Oct <1 <2 13 < MPR th Ave and Willow Place 17-Oct <1 <2 12 < MPR th Ave and Willow Place 24-Oct <1 <2 12 < MPR th Ave and Willow Place 31-Oct < < MPR th Ave and Willow Place 7-Nov <1 <2 9 < MPR th Ave and Willow Place 14-Nov <1 <2 9 < MPR th Ave and Willow Place 21-Nov <1 <2 8 < MPR th Ave and Willow Place 28-Nov <1 <2 9 < MPR th Ave and Willow Place 5-Dec-17 1 <1 <2 8 < MPR th Ave and Willow Place 12-Dec <1 <2 8 < MPR th Ave and Willow Place 19-Dec <1 NA 7 < MPR th Ave and Willow Place 27-Dec <1 NA 6 < MPR St. 3-Jan <1 <2 5 < MPR St. 10-Jan <1 <2 4 < MPR St. 17-Jan <1 <2 4 < MPR St. 24-Jan <1 <2 4 < MPR St. 31-Jan <1 <2 5 < MPR St. 7-Feb <1 <2 4 < MPR St. 14-Feb <1 <2 4 < MPR St. 21-Feb <1 <2 5 < MPR St. 28-Feb <1 <2 5 <1 0.3 MPR St. 7-Mar <1 <2 5 < MPR St. 14-Mar <1 4 6 < MPR St. 21-Mar <1 <2 6 < MPR St. 28-Mar <1 <2 7 < Turb. NTU 62
64 Sample name Sample reported name Sampled Date Cl 2 Free mg/l E. coli MF/ 100mLs HPC CFU/ml s Temp C Total Coliform MF/100 mls MPR St. 4-Apr <1 <2 8 < MPR St. 11-Apr <1 <2 8 < MPR St. 18-Apr <1 <2 8 < MPR St. 25-Apr <1 <2 9 < MPR St. 2-May <1 <2 9 <1 0.3 MPR St. 9-May <1 <2 10 < MPR St. 16-May <1 <2 11 < MPR St. 23-May <1 <2 11 < MPR St. 30-May <1 <2 13 < MPR St. 6-Jun <1 <2 12 < MPR St. 13-Jun <1 <2 12 < MPR St. 20-Jun < < MPR St. 27-Jun <1 <2 13 < MPR St. 4-Jul <1 <2 14 < MPR St. 11-Jul <1 <2 16 < MPR St. 18-Jul <1 <2 15 < MPR St. 25-Jul <1 <2 16 < MPR St. 1-Aug <1 <2 16 < MPR St. 8-Aug <1 < < MPR St. 15-Aug < < MPR St. 22-Aug <1 <2 17 < MPR St. 29-Aug <1 <2 17 < MPR St. 5-Sep <1 <2 18 < MPR St. 12-Sep <1 <2 17 < MPR St. 19-Sep <1 <2 17 < MPR St. 26-Sep <1 <2 16 < MPR St. 3-Oct < <1 0.3 MPR St. 10-Oct < < MPR St. 17-Oct <1 <2 14 < MPR St. 24-Oct <1 <2 12 < MPR St. 31-Oct < < MPR St. 7-Nov <1 <2 10 < MPR St. 14-Nov <1 <2 9 < MPR St. 21-Nov <1 <2 9 < MPR St. 28-Nov <1 <2 8 < MPR St. 5-Dec <1 <2 8 < MPR St. 12-Dec <1 <2 7 < MPR St. 19-Dec <1 NA 7 < MPR St. 27-Dec <1 NA 5 < Turb. NTU 63
65 Sample name Sample reported name Sampled Date Cl 2 Free mg/l E. coli MF/ 100mLs HPC CFU/ml s Temp C Total Coliform MF/100 mls MPR th St. & McClure 3-Jan <1 <2 5 < MPR th St. & McClure 10-Jan <1 <2 4 < MPR th St. & McClure 17-Jan <1 <2 5 < MPR th St. & McClure 24-Jan <1 <2 4 < MPR th St. & McClure 31-Jan <1 <2 5 < MPR th St. & McClure 7-Feb <1 <2 4 < MPR th St. & McClure 14-Feb <1 <2 4 < MPR th St. & McClure 21-Feb <1 <2 6 < MPR th St. & McClure 28-Feb <1 <2 5 < MPR th St. & McClure 7-Mar <1 <2 5 < MPR th St. & McClure 14-Mar <1 <2 6 < MPR th St. & McClure 21-Mar <1 <2 6 < MPR th St. & McClure 28-Mar <1 <2 7 < MPR th St. & McClure 4-Apr <1 2 8 < MPR th St. & McClure 11-Apr <1 <2 8 < MPR th St. & McClure 18-Apr <1 <2 8 <1 0.5 MPR th St. & McClure 25-Apr <1 2 9 < MPR th St. & McClure 2-May <1 <2 9 < MPR th St. & McClure 9-May <1 <2 10 < MPR th St. & McClure 16-May <1 <2 11 < MPR th St. & McClure 23-May <1 <2 13 < MPR th St. & McClure 30-May <1 <2 14 < MPR th St. & McClure 6-Jun <1 <2 13 < MPR th St. & McClure 13-Jun <1 <2 14 < MPR th St. & McClure 20-Jun <1 <2 14 < MPR th St. & McClure 27-Jun <1 <2 13 < MPR th St. & McClure 4-Jul <1 <2 14 < MPR th St. & McClure 11-Jul <1 <2 16 < MPR th St. & McClure 18-Jul <1 <2 17 < MPR th St. & McClure 25-Jul <1 <2 16 < MPR th St. & McClure 1-Aug < < MPR th St. & McClure 8-Aug <1 < < MPR th St. & McClure 15-Aug <1 < < MPR th St. & McClure 22-Aug <1 <2 18 < MPR th St. & McClure 29-Aug < < MPR th St. & McClure 5-Sep <1 <2 18 < MPR th St. & McClure 12-Sep <1 <2 18 < MPR th St. & McClure 19-Sep < < MPR th St. & McClure 26-Sep <1 <2 16 < Turb. NTU 64
66 Sample name Sample reported name Sampled Date Cl 2 Free mg/l E. coli MF/ 100mLs HPC CFU/ml s Temp C Total Coliform MF/100 mls MPR th St. & McClure 3-Oct <1 <2 16 < MPR th St. & McClure 10-Oct <1 <2 15 < MPR th St. & McClure 17-Oct <1 <2 14 < MPR th St. & McClure 24-Oct <1 <2 13 < MPR th St. & McClure 31-Oct <1 <2 12 < MPR th St. & McClure 7-Nov < <1 0.4 MPR th St. & McClure 14-Nov <1 <2 10 < MPR th St. & McClure 21-Nov < < MPR th St. & McClure 28-Nov <1 <2 9 < MPR th St. & McClure 5-Dec <1 <2 9 < MPR th St. & McClure 12-Dec <1 <2 7 < MPR th St. & McClure 19-Dec <1 NA 7 < MPR th St. & McClure 27-Dec <1 NA 6 < MPR-449 Meadow Brook North of Douglas 3-Jan <1 2 5 <1 0.2 MPR-449 Meadow Brook North of Douglas 10-Jan <1 <2 6 < MPR-449 Meadow Brook North of Douglas 17-Jan <1 6 5 <1 0.2 MPR-449 Meadow Brook North of Douglas 24-Jan <1 <2 5 < MPR-449 Meadow Brook North of Douglas 31-Jan <1 <2 5 < MPR-449 Meadow Brook North of Douglas 7-Feb <1 <2 4 < MPR-449 Meadow Brook North of Douglas 14-Feb <1 <2 4 < MPR-449 Meadow Brook North of Douglas 21-Feb <1 <2 6 < MPR-449 Meadow Brook North of Douglas 28-Feb <1 <2 6 < MPR-449 Meadow Brook North of Douglas 7-Mar <1 <2 6 < MPR-449 Meadow Brook North of Douglas 14-Mar <1 <2 7 <1 0.4 MPR-449 Meadow Brook North of Douglas 21-Mar <1 2 7 < MPR-449 Meadow Brook North of Douglas 28-Mar <1 <2 8 < MPR-449 Meadow Brook North of Douglas 4-Apr <1 <2 8 < MPR-449 Meadow Brook North of Douglas 11-Apr <1 <2 9 < MPR-449 Meadow Brook North of Douglas 18-Apr <1 <2 8 <1 2.4 MPR-449 Meadow Brook North of Douglas 25-Apr < <1 0.4 MPR-449 Meadow Brook North of Douglas 2-May <1 <2 10 < MPR-449 Meadow Brook North of Douglas 9-May <1 <2 12 < MPR-449 Meadow Brook North of Douglas 16-May <1 <2 12 < MPR-449 Meadow Brook North of Douglas 23-May <1 <2 12 < MPR-449 Meadow Brook North of Douglas 30-May <1 <2 13 < MPR-449 Meadow Brook North of Douglas 6-Jun <1 <2 14 <1 0.3 MPR-449 Meadow Brook North of Douglas 13-Jun <1 <2 15 < MPR-449 Meadow Brook North of Douglas 20-Jun <1 <2 15 < MPR-449 Meadow Brook North of Douglas 27-Jun <1 <2 15 < Turb. NTU 65
67 Sample name Sample reported name Sampled Date Cl 2 Free mg/l E. coli MF/ 100mLs HPC CFU/ml s Temp C Total Coliform MF/100 mls MPR-449 Meadow Brook North of Douglas 4-Jul <1 <2 16 <1 0.3 MPR-449 Meadow Brook North of Douglas 11-Jul < < MPR-449 Meadow Brook North of Douglas 18-Jul <1 <2 17 < MPR-449 Meadow Brook North of Douglas 25-Jul < < MPR-449 Meadow Brook North of Douglas 1-Aug < < MPR-449 Meadow Brook North of Douglas 8-Aug < <1 0.2 MPR-449 Meadow Brook North of Douglas 15-Aug < < MPR-449 Meadow Brook North of Douglas 22-Aug <1 <2 19 <1 0.2 MPR-449 Meadow Brook North of Douglas 29-Aug <1 <2 17 < MPR-449 Meadow Brook North of Douglas 5-Sep <1 <2 19 < MPR-449 Meadow Brook North of Douglas 12-Sep <1 <2 19 < MPR-449 Meadow Brook North of Douglas 19-Sep <1 <2 19 < MPR-449 Meadow Brook North of Douglas 26-Sep <1 <2 18 < MPR-449 Meadow Brook North of Douglas 3-Oct <1 <2 18 < MPR-449 Meadow Brook North of Douglas 10-Oct < < MPR-449 Meadow Brook North of Douglas 17-Oct <1 <2 16 < MPR-449 Meadow Brook North of Douglas 24-Oct <1 <2 15 < MPR-449 Meadow Brook North of Douglas 31-Oct <1 <2 14 < MPR-449 Meadow Brook North of Douglas 7-Nov < < MPR-449 Meadow Brook North of Douglas 14-Nov <1 <2 11 < MPR-449 Meadow Brook North of Douglas 21-Nov <1 <2 11 < MPR-449 Meadow Brook North of Douglas 28-Nov <1 <2 11 < MPR-449 Meadow Brook North of Douglas 5-Dec < < MPR-449 Meadow Brook North of Douglas 12-Dec <1 <2 9 < MPR-449 Meadow Brook North of Douglas 19-Dec <1 NA 9 < MPR-449 Meadow Brook North of Douglas 27-Dec <1 NA 8 < Turb. NTU 66
68 Appendix H: Preventing Water-Borne Infections for People with Weakened Immune Systems 67
69 68
70 69
CITY OF MAPLE RIDGE DRINKING WATER QUALITY REPORT 2016
 CITY OF MAPLE RIDGE DRINKING WATER QUALITY REPORT 2016 May 2017 Table of Contents List of Abbreviations...2 Executive Summary...3 1.0 Introduction...4 2.0 Background...5 2.1 Source Water...5 2.2 Distribution
Drinking Water Quality Report THE CORPORATION OF THE CITY OF PITT MEADOWS
 Drinking Water Quality Report - 2011 - THE CORPORATION OF THE CITY OF PITT MEADOWS DRINKING WATER QUALITY REPORT 2011 Table of Contents 1.0 EXECUTIVE SUMMARY 2.0 INTRODUCTION 3.0 BACKGROUND 3.1 REGULATING
CITY OF NEW WESTMINSTER WATER QUALITY MONITORING REPORT
 CITY OF NEW WESTMINSTER WATER QUALITY MONITORING REPORT 2016 TABLE OF CONTENTS 1.0 INTRODUCTION...3 2.0 WATER QUALITY PROGRAM...3 2.1 DRINKING WATER TREATMENT PROGRAM...4 2.2 WATER SAMPLING AND TESTING
2017 ANNUAL DRINKING WATER QUALITY REPORT
 2017 ANNUAL DRINKING WATER QUALITY REPORT ENGINEERING & PUBLIC WORKS Prepared June 4, 2018 File #: 11-5600-10/000/2018-1 Doc #: 2976324.v1 TABLE OF CONTENTS PAGE NO. Contents EXECUTIVE SUMMARY... 4 Message
University of British Columbia. Drinking Water Quality Monitoring Report 2015
 University of British Columbia Drinking Water Quality Monitoring Report 25 June 26 University of British Columbia Drinking Water Quality Monitoring Report 25 Executive Summary The University of British
This page has been intentionally left blank.
 2013 Annual Drinking Water Quality Report This page has been intentionally left blank. 1 City of Burnaby Annual Drinking Water Quality Report TABLE OF CONTENTS INTRODUCTION... 3 REGULATORY CONTEXT... 3
Bottom Ash Data Week 30
 Bottom Ash Data 2018 Week 30 The following analytical report was sent to the Ministry of Environment and Climate Change Strategy on August 14, 2018. The data represents bottom ash composite results for
Trihalomethanes (THMs): from precursors to management strategies. Maria Valdivia-Garcia (EngD candidate)
: from precursors to management strategies. Maria Valdivia-Garcia (EngD candidate)") Trihalomethanes (THMs): from precursors to management strategies Maria Valdivia-Garcia (EngD candidate) Outline 1. Background 2. Findings i) Seasonal changes ii) Dissolved Organic Carbon (DOC) character
Trihalomethanes (THMs): from precursors to management strategies Maria Valdivia-Garcia (EngD candidate) Outline 1. Background 2. Findings i) Seasonal changes ii) Dissolved Organic Carbon (DOC) character
Bottom Ash Data Week 37
 Bottom Ash Data 2018 Week 37 The following analytical report was sent to the Ministry of Environment and Climate Change Strategy on October 2, 2018. The data represents bottom ash composite results for
Bottom Ash Data Week 12
 Bottom Ash Data 2019 Week 12 The following analytical report was sent to the Ministry of Environment and Climate Change Strategy on April 11, 2019. The data represents bottom ash composite results for
KITCHENER (MANNHEIM) WATER TREATMENT PLANT DRINKING WATER SURVEILLANCE PROGRAM REPORT FOR 1993, 1994 AND 1995
 WATER TREATMENT PLANT DRINKING WATER SURVEILLANCE PROGRAM REPORT FOR 1993, 1994 AND 1995") KITCHENER (MANNHEIM) WATER TREATMENT PLANT DRINKING WATER SURVEILLANCE PROGRAM REPORT FOR 1993, 1994 AND 1995 ONTARIO MINISTRY OF ENVIRONMENT AND ENERGY Note: This report does not address the outbreak
KITCHENER (MANNHEIM) WATER TREATMENT PLANT DRINKING WATER SURVEILLANCE PROGRAM REPORT FOR 1993, 1994 AND 1995 ONTARIO MINISTRY OF ENVIRONMENT AND ENERGY Note: This report does not address the outbreak
What Can We Do About Water Quality?
 17 What Can We Do About Water Quality? David K. Beede 1 Department of Animal Science The Michigan State University Take Home Messages Abundant, high quality drinking water is the most important essential
Bottom Ash Data Week 9
 Bottom Ash Data 2018 Week 9 The following analytical report was sent to the Ministry of Environment and Climate Change Strategy on March 26, 2018. The data represents bottom ash composite results for week
Bottom Ash Data Week 17
 Bottom Ash Data 2018 Week 17 The following analytical report was sent to the Ministry of Environment and Climate Change Strategy on May 16, 2018. The data represents bottom ash composite results for week
Bottom Ash Data Week 38
 Bottom Ash Data 2018 Week 38 The following analytical report was sent to the Ministry of Environment and Climate Change Strategy on October 4, 2018. The data represents bottom ash composite results for
Bottom Ash Data Week 8
 Bottom Ash Data 2019 Week 8 The following analytical report was sent to the Ministry of Environment and Climate Change Strategy on March 6, 2019. The data represents bottom ash composite results for week
Bottom Ash Data Week 49
 Bottom Ash Data 2018 Week 49 The following analytical report was sent to the Ministry of Environment and Climate Change Strategy on December 20, 2018. The data represents bottom ash composite results for
Bottom Ash Data Week 1
 Bottom Ash Data 2019 Week 1 The following analytical report was sent to the Ministry of Environment and Climate Change Strategy on January 17, 2019. The data represents bottom ash composite results for
Bottom Ash Data Week 40
 Bottom Ash Data 2018 Week 40 The following analytical report was sent to the Ministry of Environment and Climate Change Strategy on October 25, 2018. The data represents bottom ash composite results for
Groundwater Quality Overview
 Groundwater Quality Overview Kevin Masarik Center for Watershed Science and Education & Michelle Dale Bayfield County Health Department Through the University of Wisconsin-Extension, all Wisconsin people
We are committed to becoming a watershed to Agriculture and restoring it to its rightful place in the economy. This is substantiated through our
 We are committed to becoming a watershed to Agriculture and restoring it to its rightful place in the economy. This is substantiated through our ability to Envision the Big Picture and pinpoint the inefficiencies
Risk Assessment and Characterization of Chloroform and Other Disinfection Byproducts
 Risk Assessment and Characterization of Chloroform and Other Disinfection Byproducts Jeffrey Sloan Chlorine Chemistry Council WCC Congress on Science Buenos Aires, Argentina Overview History of chlorine
AAFCO Check Sample 2015 Minerals Program. A Targeted and Engineered Concentration Program
 AAFC Check Sample 215 Minerals Program A Targeted and Engineered Concentration Program Approach: 16 Target Elements This quarterly program focuses on minerals of health and toxicological importance in
Revised 2/7/01 PATUXENT WATER FILTRATION PLANT TAP WATER ANALYSIS 2000
 PATUXENT WATER FILTRATION PLANT EPA LIMIT PHYSICAL Alkalinity mg/l 35 40 28 Color Units 0 0 0 Dissolved Solids, Total mg/l 128 139 117 Hardness mg/l 64 71 59 ph Units 8.4 8.4 8.3 Specific Conductance µ
Administrative Procedure
 Durham Catholic District School Board The Board Title: Eyewash Stations and Safety Showers Procedure #: AP414-12 Administrative Area: Policy Reference: Human Resources and Administrative Services Emergency
Scientific Facts on. Water Disinfectants. & disinfectant by-products
 page 1/13 Scientific Facts on Water Disinfectants & disinfectant by-products Source document: IPCS (2000) Summary & Details: GreenFacts Level 2 - Details on Water Disinfectants 1. What disinfectants and
TOXIC AND ESSENTIAL ELEMENTS
 TOXIC AND ESSENTIAL ELEMENTS Assessment of Key Minerals and Harmful Metals Whole Blood, Red Blood Cell and Serum Elements Urine Toxic and Essential Elements Creatinine Clearance Hair Elements Fecal Metals
Contribution of Drinking Water to Dietary Requirements of Essential Metals
 Contribution of Drinking Water to Dietary Requirements of Essential Metals Michelle Deveau Water Quality Science Division Health Canada May 7, 2008 Workshop on Health Risk Assessment of Essential Metals
FACTORS AFFECTING WATER QUALITY
 TECHNICAL PAPER WATER QUALITY PLANT HEALTH FACTORS Water quality is one of the most important factors affecting plant growth, as unwanted components in water can interfere with nutrient availability and
Lead in Drinking Water Public and Nonpublic Schools
 Lead in Drinking Water Public and Nonpublic Schools IMPORTANT NOTICE: ELEVATED WATER SAMPLE RESULT(S) Mayo Elementary School ELEVATED LEAD WATER SAMPLE RESULT(S) All Maryland public and nonpublic schools
Analyte Proficiency From All Labs # Analytes: 26 Sample # Statistical Summary # Labs Reporting: 82 Urea Issue Date : 06/30/2016
 Analyte Proficiency From All Labs # Analytes: 26 Sample # 160511 Statistical Summary # Labs Reporting: 82 Urea Issue Date : 06/30/2016 Analyte Code Analyte # Tests Submitted # Tests in Robust Calculations
Overview of the Radiation Exposure Doses of the Workers at Fukushima Daiichi Nuclear Power Station
 Click here for the corrections made < Reference > December 3, 212 Tokyo Electric Power Company Overview of the Radiation Exposure Doses of the Workers at Fukushima Daiichi Nuclear Power Station * As of
Water Quality. Ambient Water Quality Guidelines for Zinc. Overview Report. Summary
 Water Quality Ambient Water Quality Guidelines for Zinc Overview Report Prepared pursuant to Section 2(e) of the Environment Management Act, 1981 Original signed by Don Fast Assistant Deputy Minister Environment
water & dialysate testing services
 water & dialysate testing services Spectra Laboratories, the leading provider of renal-specific testing services, offers clinicians comprehensive water and dialysate testing to help monitor the safety
Biosolids Test Description Method Number Test Code Acid Hydrolyzable Phosphate SM P E-99 AHPHOS Acidity as CaCO3 SM-2310 B (4a)-97 ACID
-97 ACID") Biosolids Acid Hydrolyzable Phosphate SM-20 4500-P E-99 AHPHOS Acidity as CaCO3 SM-2310 B (4a)-97 ACID Alkalinity as CO3 SM-2320 B-97 CO3 B.O.D. (5-day) SM-5210 B-01 BOD Bromide SM-4110B-00 BR IC Cadmium
Biosolids Acid Hydrolyzable Phosphate SM-20 4500-P E-99 AHPHOS Acidity as CaCO3 SM-2310 B (4a)-97 ACID Alkalinity as CO3 SM-2320 B-97 CO3 B.O.D. (5-day) SM-5210 B-01 BOD Bromide SM-4110B-00 BR IC Cadmium
Annual Epidemiological Report
 December 2018 Annual Epidemiological Report Key Facts Cryptosporidium 1 infection in Ireland, 2017 In 2017, 589 cases of cryptosporidiosis were notified in Ireland 36 were hospitalised, with no reported
Greg Patterson C.C.A. President A&L Canada Laboratories
 Welcome Greg Patterson C.C.A. President A&L Canada Laboratories Compost Quality Consumer of the Future Population dynamics - more and more people involved in use of compost Better educated on what is expected
Laboratory Certification and Quality Assurance Office Policy on Microbiology Proficiency Testing Policy # WES
 Massachusetts Department of Environmental Protection Division of Environmental Analysis Senator William X. Wall Experiment Station Laboratory Certification and Quality Assurance Office Policy on Microbiology
USER SPECIFICATIONS FOR QUINTOLUBRIC 888 Series DESCRIPTION OF THE MOST IMPORTANT PROPERTIES AND THE POSSIBLE VARIATIONS AND TOLERANCES
 USER SPECIFICATIONS FOR QUINTOLUBRIC 888 Series OVERVIEW The QUINTOLUBRIC 888 Series of fluids are based on a synthetic organic ester, which is the main base component, plus a number of selected additives
THE CITY OF BRYANT, ARKANSAS SAMPLING AND TESTING PLAN FOR SITE SPECIFIC TESTING FOR COPPER AND ZINC BRYANT WASTEWATER TREATMENT FACILITY
 THE CITY OF BRYANT, ARKANSAS SAMPLING AND TESTING PLAN FOR SITE SPECIFIC TESTING FOR COPPER AND ZINC BRYANT WASTEWATER TREATMENT FACILITY NPDES PERMIT NO. AR342 ORIGINAL SUBMISSION DATE: NOVEMBER 16, 215
DISINFECTION BY-PRODUCTS (DBPS) IN DRINKING WATER AND THEIR ASSOCIATED HEALTH RISK: A REVIEW
 IN DRINKING WATER AND THEIR ASSOCIATED HEALTH RISK: A REVIEW") DISINFECTION BY-PRODUCTS (DBPS) IN DRINKING WATER AND THEIR ASSOCIATED HEALTH RISK: A REVIEW F. Khan & M. F. R Zuthi * Department of Civil Engineering, Chittagong University of Engineering and Technology,
DISINFECTION BY-PRODUCTS (DBPS) IN DRINKING WATER AND THEIR ASSOCIATED HEALTH RISK: A REVIEW F. Khan & M. F. R Zuthi * Department of Civil Engineering, Chittagong University of Engineering and Technology,
Studies Show Link Between Chlorinated Water and Cancer By Apollo Tuesday, January 22nd, 2013
 Studies Show Link Between Chlorinated Water and Cancer By Apollo Tuesday, January 22nd, 2013 If you visit the US Environmental Protection Agency (EPA) website and look up Chlorine, you will find under
EDUCATIONAL INFORMATION
 PHARMACEUTICALS AND PERSONAL CARE PRODUCTS (PPCPs) MONITORING PPCPs are a diverse collection of thousands of chemical substances, including prescription and over-the counter therapeutic drugs, veterinary
Region of Waterloo Public Health and Emergency Services Infectious Diseases, Dental, and Sexual Health
 Region of Waterloo Public Health and Emergency Services Infectious Diseases, Dental, and Sexual Health To: Chair Geoff Lorentz and Members of the Community Services Committee Date: March 2, 218 File Code:
Chinese Zinc Sulfate Monohydrate testing. Dick Camp Kronos Micronutrients
 Chinese Zinc Sulfate Monohydrate testing Dick Camp Kronos Micronutrients THE ISSUE Most if not all Chinese ZSM imports are not all ZSM. They are a combination of ZSM and a Non- Water-Soluble compound of
10. TRACE ELEMENTS Introduction. Trace Elements Bristol Bay Drainages
 10. TRACE ELEMENTS 10.1 Introduction The trace element studies in the Bristol Bay drainages study areas were conducted to acquire baseline data on naturally occurring constituents in upland soil, terrestrial
Federal Drinking Water Regulatory Update November 2012
 Federal Drinking Water Regulatory Update November 2012 Bruce A. Macler USEPA Region 9 macler.bruce@epa.gov 415 972-3569 EPA DW Regulatory Status Out the door UCMR3 Proposed, closed and awaiting Final Total
City of Vancouver s Response to the Opioid Crisis Fire Chief Darrell Reid Vancouver Fire & Rescue Services (VF&RS)
") City of Vancouver s Response to the Opioid Crisis Fire Chief Darrell Reid Vancouver Fire & Rescue Services (VF&RS) Vancouver Vancouver Fire Rescue Services Opioid Crisis Background Crisis Overview April
City of Vancouver s Response to the Opioid Crisis Fire Chief Darrell Reid Vancouver Fire & Rescue Services (VF&RS) Vancouver Vancouver Fire Rescue Services Opioid Crisis Background Crisis Overview April
Microbiological Safety of Drinking Water: To Your Health. Will Robertson & Dennis Neil Health Canada
 Microbiological Safety of Drinking Water: To Your Health Will Robertson & Dennis Neil Health Canada Introduction What are the pathogens? Why should we be concerned? How do they enter treated water? How
SELBY 2004 ( ) WATER SUPPLY ZONE. COMMENTARY ON WATER QUALITY
 WATER SUPPLY ZONE. COMMENTARY ON WATER QUALITY") SELBY 2004 (1806003) WATER SUPPLY ZONE. COMMENTARY ON WATER QUALITY The water supplied to the zone is classified as being hard water, which is borehole/river derived. As we have a grid system in place
SELBY 2004 (1806003) WATER SUPPLY ZONE. COMMENTARY ON WATER QUALITY The water supplied to the zone is classified as being hard water, which is borehole/river derived. As we have a grid system in place
RUSBY WOOD 2000 ( ) WATER SUPPLY ZONE. COMMENTARY ON WATER QUALITY
 WATER SUPPLY ZONE. COMMENTARY ON WATER QUALITY") RUSBY WOOD 2000 (4803137) WATER SUPPLY ZONE. COMMENTARY ON WATER QUALITY The water supplied to the zone is classified as being soft to moderately soft water, which is reservoir derived. As we have a grid
RUSBY WOOD 2000 (4803137) WATER SUPPLY ZONE. COMMENTARY ON WATER QUALITY The water supplied to the zone is classified as being soft to moderately soft water, which is reservoir derived. As we have a grid
Pure water in antiquity
 Drinking water Smart Faucet - Recognizes user (facial screening) - Delivers preferred temp, flow Pure water in antiquity 4000 BC Treatment methods (boiling, filtration) prescribed by Greeks to improve
Magellan s Transport Route Lead Monitoring Program
 Magellan s Transport Route Lead Monitoring Program Magellan s lead monitoring requirements Magellan s approval to export sealed shipments of lead carbonate through Fremantle is subject to the Interim Implementation
N.O.S. (Corrosive) Group Standard HSR002618
 Group Standard HSR002618") N.O.S. (Corrosive) Group Standard 2017 - HSR002618 GROUP STANDARD UNDER THE HAZARDOUS SUBSTANCES AND NEW ORGANISMS ACT 1996 N.O.S. (Corrosive) Group Standard 2017 N.O.S. (Corrosive) Group Standard 2017
N.O.S. (Corrosive) Group Standard 2017 - HSR002618 GROUP STANDARD UNDER THE HAZARDOUS SUBSTANCES AND NEW ORGANISMS ACT 1996 N.O.S. (Corrosive) Group Standard 2017 N.O.S. (Corrosive) Group Standard 2017
Lessons Learned From a Tier 1 Public Notice Portland Water Bureau s Experience from Two Boil Water Notices
 Lessons Learned From a Tier 1 Public Notice Portland Water Bureau s Experience from Two Boil Water Notices Scott Bradway Portland Water Bureau Water Quality Information Manager May 8, 2014 Public Notification
UNDERSTANDING YOUR WATER PROFILE PRESENTED BY POULTRY PARTNERS AND AHPD
 UNDERSTANDING YOUR WATER PROFILE PRESENTED BY POULTRY PARTNERS AND AHPD WHY DOES IT MATTER? Water intake for commercial poultry breeds is 1.5-2x greater than feed intake Commercial birds drink more now
DETERMINATION OF TRACE ELEMENTS IN WATERS AND WASTES BY INDUCTIVELY COUPLED PLASMA - MASS SPECTROMETRY EPA Method (Revision 5.
 DETERMINATION OF TRACE ELEMENTS IN WATERS AND WASTES BY INDUCTIVELY COUPLED PLASMA - MASS SPECTROMETRY EPA Method 200.8 (Revision 5.4, 1994) Table 1A. Summary of Holding Times and Preservation for Trace
BERLIN BOROUGH SCHOOL DISTRICT Where Students Discover Their Potential
 BERLIN BOROUGH SCHOOL DISTRICT Where Students Discover Their Potential Mrs. Kristen Martello Superintendent Cande Kristoff Business Administrator August 18, 2018 Berlin Borough School District 215 S. Franklin
Chapter 6 Physical and chemical quality of drinking water
 Chapter 6 Physical and chemical quality of drinking water Chapter 6 Physical and Chemical Quality of Drinking Water Chapter 6 Chapter 6 Physical and chemical quality of drinking water 6.1 Introduction
LEEDS LL CROSS GREEN 2004 ( ) WATER SUPPLY ZONE. COMMENTARY ON WATER QUALITY
 WATER SUPPLY ZONE. COMMENTARY ON WATER QUALITY") LEEDS LL CROSS GREEN 2004 (1804003) WATER SUPPLY ZONE. COMMENTARY ON WATER QUALITY The water supplied to the zone is classified as being moderately hard water, which is river/reservoir derived. As we have
LEEDS LL CROSS GREEN 2004 (1804003) WATER SUPPLY ZONE. COMMENTARY ON WATER QUALITY The water supplied to the zone is classified as being moderately hard water, which is river/reservoir derived. As we have
INTERNAL UNICEF Zambia Situation Report #2 Situation in Numbers Highlights Districts affected Cumulative cases reported Cumulative cases confirmed
 Zambia Cholera Outbreak Report UNICEF Zambia Situation Report #2 Situation in Numbers Highlights Since the 6 th epidemiological week of 206 (5 February 206), there has been a total of 66 cases of Cholera
Trouw Nutrition Canada - Laboratory. List of analyses Laboratory
 Trouw Nutrition Canada - Laboratory List of analyses Laboratory 8175 rue Duplessis St-Hyacinthe, Québec, J2R 1S5 (450) 796-2555 (450) 796-5702 (Fax) GENERAL Aluminum Amino acids profile Ash Astaxanthin
Mark Petersen & Jen Muscha. Livestock & Range Research Laboratory
 Mark Petersen & Jen Muscha USDA ARS Fort USDA-ARS F t Keogh K h Livestock & Range Research Laboratory OUTLINE Background t quality lit W Water Winter water temperature important? How much does water quality
Legionnaire s disease
 Legionnaire s disease Connecticut Environmental Health Association Meeting April 9, 2019 Paul Gacek MPH, CPH Legionellosis Surveillance Coordinator & Waterborne Disease Coordinator Epidemiology and Emerging
N.O.S. (Subsidiary Hazard) Group Standard HSR002624
 Group Standard HSR002624") N.O.S. (Subsidiary Hazard) Group Standard 2017 - HSR002624 GROUP STANDARD UNDER THE HAZARDOUS SUBSTANCES AND NEW ORGANISMS ACT 1996 N.O.S. (Subsidiary Hazard) Group Standard 2017 Pursuant to clause 5 of
N.O.S. (Subsidiary Hazard) Group Standard 2017 - HSR002624 GROUP STANDARD UNDER THE HAZARDOUS SUBSTANCES AND NEW ORGANISMS ACT 1996 N.O.S. (Subsidiary Hazard) Group Standard 2017 Pursuant to clause 5 of
Appendix D: Aerobic and Anaerobic Leaching Tests
 Appendix D: Aerobic and Anaerobic Leaching Tests This appendix contains the entire data set for the aerobic and anaerobic testing. Testing was performed for the potential components of the final media
A & L Canada Laboratories Inc Jetstream Road, London, Ontario, N5V 3P5 Telephone: (519) Fax: (519)
 Fax: (519)") Report Number: C13114-10169 Account Number: To: ESSEX-WINDSOR SWA 2136 Jetstream Road, London, Ontario, N5V 3P5 Telephone: (519) 457-2575 Fax: (519) 457-2664 For: ROW "T2-3-12" 519-776-6370 Reported Date:
Report Number: C13114-10169 Account Number: To: ESSEX-WINDSOR SWA 2136 Jetstream Road, London, Ontario, N5V 3P5 Telephone: (519) 457-2575 Fax: (519) 457-2664 For: ROW "T2-3-12" 519-776-6370 Reported Date:
Assessment of Water, Sanitation, and Hygiene Interventions in Response to an Outbreak of Typhoid Fever in Neno District, Malawi
 Assessment of Water, Sanitation, and Hygiene Interventions in Response to an Outbreak of Typhoid Fever in Neno District, Malawi Sarah D. Bennett, MD, MPH Lieutenant, U.S. Public Health Service April 13,
Sampling and Analytical Report for the Round-4, Drinking-Water Sampling Project in Evanston, Illinois
 Environmental Consultants 2830 Dairy Drive 608 224-2830 and Contractors Madison, WI 53718-6751 FAX 608 224-2839 www.scsengineers.com January 20, 2017 File No. 25216211 Mr. Dave Stoneback City of Evanston
McHenry County Norovirus Outbreaks November McHenry County Department of Health November 29,2010
 McHenry County Norovirus Outbreaks November 2010 McHenry County Department of Health November 29,2010 What is Norovirus The most common cause of gastrointestinal illness resulting from an inflammation
DEGRADATION AND REMOVAL OF TRIHALOMETHANES FROM DRINKING WATER
 DEGRADATION AND REMOVAL OF TRIHALOMETHANES FROM DRINKING WATER An Undergraduate Research Scholars Thesis by EVERETT CALEB CLAYCOMB Submitted to the Undergraduate Research Scholars program Texas A&M University
Infant TDS. Results of the ANSES study on dietary exposure of children under 3 years of age to chemical substances
 Infant TDS Results of the ANSES study on dietary exposure of children under 3 years of age to chemical substances 2010-2016 29 th Focal point meeting Uppsala, Sweden Why an infant Total Diet Study TDS
Magruder Check Sample: 2016 Year End Summary
 Magruder Check Sample: 2016 Year End Summary 14 Samples in 2016 Sample Sample Name # Tests 160111 Micro Mix 455 160211 Grade 24-25-4 595 160311 Grade 5-2-0 546 160411 Liquid Thio S 259 160511 Urea 149
Grinder-Pedersen L, Rasmussen SE, Bugel S, Jorgensen LV, Dragsted LO, Gundersen V, Sandstrom B.
 1. Organic vs. Commercially Grown Fruits and Vegetables. 2. Effect of diets based on foods from conventional versus organic production on intake and excretion of flavonoids and markers of antioxidative
COMMUNITY WATER FLUORIDATION: MYTHS AND FACTS
 Fact Sheet March 2011 COMMUNITY WATER FLUORIDATION: MYTHS AND FACTS Myth: The pharmaceutical-grade fluoride (sodium fluoride) used in dentists offices is the same kind that is used to fluoridate city drinking
EPA Clean Air Act Performance Audit Samples Stationary Source Audit Sample (SSAS) Table Revision 5, Effective April 15, 2014
 Table Revision 5, Effective April 15, 2014") Matrix EPA Clean Air Act Performance Audit Samples Page 1 of 6 Acceptance Criteria 2 ASRL 3 Inorganics in Impinger Solution EPA Method 6 and 8 4, 5 mg/dscm mg/dscm 4010 Sulfur Dioxide 50-2000 ± 15% at
Matrix EPA Clean Air Act Performance Audit Samples Page 1 of 6 Acceptance Criteria 2 ASRL 3 Inorganics in Impinger Solution EPA Method 6 and 8 4, 5 mg/dscm mg/dscm 4010 Sulfur Dioxide 50-2000 ± 15% at
TB Outbreak in a Homeless Shelter
 TB Outbreak in a Homeless Shelter Objectives Epidemiology of Outbreak Population Health Interventions Population Health Goals 2007 One active case identified Less than compliant Prolonged recovery Contact
INFLUENZA Surveillance Report Influenza Season
 Health and Wellness INFLUENZA Surveillance Report 2011 2012 Influenza Season Population Health Assessment and Surveillance Table of Contents Introduction... 3 Methods... 3 Influenza Cases and Outbreaks...
Risk to public health associated with private water supplies. Dr Emmanuel Okpo
 Risk to public health associated with private water supplies Dr Emmanuel Okpo Private Water Supply Workshop October 2013 Outline Water quality standards/drivers Contaminants (pathogens, chemicals) Population
Product Stewardship Information Sheet CH350LN
 Product Stewardship Information Sheet CH350LN Contents Product Manufacturer... 2 Food Contact... 2 European Union (EU) Food Contact... 2 US Food and Drug Administration (FDA)... 2 Canada Health Protection
INFLUENZA IN MANITOBA 2010/2011 SEASON. Cases reported up to October 9, 2010
 INFLUENZA IN MANITOBA 2/211 SEASON Cases reported up to October 9, 2 The public health disease surveillance system of Manitoba Health received its first laboratory-confirmed positive case of influenza
Trace Elements in Manure
 Trace Elements in Manure Purpose: Whenever soil profiles are examined for nutrient trace elements, it has been demonstrated that the metals tend to accumulate in the topsoil. Soil properties affect plant
Typhoid Fever Clusters in Kadoma City, Zimbabwe April 2014
 Typhoid Fever Clusters in Kadoma City, Zimbabwe April 2014 Article by Z. Jakopo 1, D. Chirundu 2, D. Bangure 3, S. Tapesana 4 1 University of Zimbabwe Dept. of Community Medicine, Zimbabwe 2 Kadoma City
Pure water in antiquity
 Drinking water Smart Faucet - Recognizes user (facial screening) - Delivers preferred temp, flow Pure water in antiquity 4000 BCE Treatment methods (boiling, filtration) prescribed by Greeks to improve
S1AN: Same as test S1A with carryover Nitrogen as Nitrate With Recommendations: $13.20 Without Recommendations: $11.50
 AGRICULTURE SOIL SOIL TEST PACKAGES S1A (Basic): Organic Matter, Available Phosphorus, (P1 Weak Bray and P2 Strong Bray) Exchangeable Potassium, Magnesium, Calcium and Hydrogen, Soil ph, Buffer Index,
Risk of Birth Defects in Australian Communities with High Levels of Brominated Disinfection By-products
 Risk of Birth Defects in Australian Communities with High Levels of Brominated Disinfection By-products Kimberly Chisholm, Angus Cook, Carol Bower, & Philip Weinstein Environmental Health Perspectives
Product Stewardship Information Sheet CH200LN-02
 Product Stewardship Information Sheet CH200LN-02 Contents Product Manufacturer... 2 Food Contact... 2 European Union (EU) Food Contact... 2 US Food and Drug Administration (FDA)... 2 Canada Health Protection
Healthcare Associated Infection Report February 2016 data
 Healthcare Associated Infection Report February 2016 data Section 1 Board Wide Issues Section 1 of the HAIRT covers Board wide infection prevention and control activity and actions. For reports on individual
Federalism Consultation for the Lead and Copper Rule Long-Term Regulatory Revisions
 Federalism Consultation for the Lead and Copper Rule Long-Term Regulatory Revisions Office of Groundwater and Drinking Water November 15, 2011 1 Purpose & Overview Purpose: To obtain input on key areas
Chloride in Drinking Water
 CONNECTICUT DEPARTMENT of PUBLIC HEALTH DRINKING WATER SECTION Chloride in Eric McPhee Supervising Environmental Analyst November 14, 2018 1 CT Department of Public Health (CT) Regulates public drinking
Global and National Trends in Vaccine Preventable Diseases. Dr Brenda Corcoran National Immunisation Office.
 Global and National Trends in Vaccine Preventable Diseases Dr Brenda Corcoran National Immunisation Office Global mortality 2008 Children under 5 years of age 1.5 million deaths due to vaccine preventable
Edward V. Krizhanovsky, Ph.D., Kamila B. Tursunova
 REPORT ON RESEARCH OF BAE SYNERGY LIQUID PREPARATION INFLUENCE ON MINERAL METABOLISM Edward V. Krizhanovsky, Ph.D., Kamila B. Tursunova Bioenergy Technologies Institute, Sveaborgskaia, 12, Saint- Petersburg,
GB Translated English of Chinese Standard: GB NATIONAL STANDARD OF THE
 Translated English of Chinese Standard: GB5009.268-2016 www.chinesestandard.net Buy True-PDF Auto-delivery. Sales@ChineseStandard.net GB NATIONAL STANDARD OF THE PEOPLE S REPUBLIC OF CHINA GB 5009.268-2016
COMPOST TECHNICAL DATA SHEET
 Date Sampled/Received: 16 Jul. 18 / 18 Jul. 18 Metro Waste Authority Yuta Naganuma 300 E. Locust Street - Suite 100 Des Moines IA 50309 Product Identification Compost Compost Sample Compost Parameters
Test Report No.T JP Date: FEB 22, 2017 Page 1 of 6
 Test Report No.T51710190051JP Date: FEB 22, 2017 Page 1 of 6 JIAN PLASTIC & METAL PRODUCTS LTD NO.3-1, SOUTH GAOBU BLVD, GAOBU TOWN, DONGGUAN CITY, GUANGDONG PROVINCE, CHINA,ZIP CODE:523278 The following
Contract: Wilton Processing Site. Contract No: D6267. Client: York Potash Ltd Title: PID Results Page 5 TEL: FAX:
 DUNELM GEOTECHNICAL & ENVIRONMENTAL LTD, FOUNDATION HOUSE, ST JOHN S ROAD, MEADOWFIELD, DURHAM, DH7 8TZ TP528 0.40m 0 TP528 1.00m 0 TP528 2.20m 0 TP528 3.00m 0 TP524 E 0.60m 0 TP524 S 0.60m 0 TP524 S 1.50m