Field Monitoring and Evaluation of Curved Girder Bridges with Integral Abutments
|
|
|
- Janice Gregory
- 5 years ago
- Views:
Transcription

1 Graduate Theses and Dissertations Iowa State University Capstones, Theses and Dissertations 2012 Field Monitoring and Evaluation of Curved Girder Bridges with Integral Abutments Gus Shryack Iowa State University Follow this and additional works at: Part of the Civil Engineering Commons Recommended Citation Shryack, Gus, "Field Monitoring and Evaluation of Curved Girder Bridges with Integral Abutments" (2012). Graduate Theses and Dissertations This Thesis is brought to you for free and open access by the Iowa State University Capstones, Theses and Dissertations at Iowa State University Digital Repository. It has been accepted for inclusion in Graduate Theses and Dissertations by an authorized administrator of Iowa State University Digital Repository. For more information, please contact
2 Field monitoring and evaluation of curved girder bridges with integral abutments by Gus L. Shryack A thesis submitted to the graduate faculty in partial fulfillment of requirements for the degree of MASTER OF SCIENCE Major: Civil Engineering (Structural Engineering) Program of Study Committee: Robert E. Abendroth, Co-Major Professor Brent M. Phares, Co-Major Professor Jeramy C. Ashlock Loren W. Zachary Iowa State University Ames, Iowa 2012 Copyright Gus L. Shryack, All rights reserved.
3 ii Table of Contents List of Figures... viii List of Tables... xv List of Variables... xvi Abstract... xx Acknowledgements... xxi Chapter 1 Introduction Background Objective and Scope Research Plan Task Group I: Information Collection... 2 Task A Technical Advisory Committee... 2 Task B Survey of available technologies... 2 Task C Review of available engineering literature... 2 Task D Inspect existing curved and chorded girder bridges Task Group II: Collect and Analyze Data on the Performance of Five or More Bridges 3 Task E Finalize an Instrumentation Plan... 3 Task F Monitor and Analyze the Behavior of the Selected Bridges... 3 Task G Develop and Validate Simple Analytical Models for the Monitored Bridges Task Group III. Develop Project Conclusions and Recommendations... 4 Task H Establish a Meeting with the TAC... 4
4 iii Task I Submit Final Report Report Organization... 4 Chapter 2 Background/Literature Review Past Work on Thermal Loading on Horizontally Curved IABs Select Past Work on Thermal Loading on Straight IABs Past Work on Thermal Loading on Horizontally Curved Non-IABs... 9 Chapter 3 Survey of States Purpose Description of Survey Information Gained Reasons for Construction Published or Unpublished Reports Additional Limitations Common Design Methods Follow-up Interview Chapter 4 In-service Bridge Inspections Bridge Location and Geometry Inspection Findings th Street Bridge Third Street Bridge Chapter 5 Experimental }rocedure... 20
5 iv 5.1 Bridge Location and Geometry Site Plan View Bridge Configurations Bridge Cross Section Girder Cross Section Pier Bearings Substructure Description Pile Geometry Long term Instrumentation and Data Collection Protocol Electronic Gauge Instrumentation Survey Instrumentation Data Collection Chapter 6 Long Term Experimental Procedure and Results Preanalysis Thermal Strains due to Solar Radiation Setting a Reference Date Effective Temperature and Effective Alpha Temperature Correction for Long Range Distance Meters (LRDM) Internal Correction External Correction Member Strains and Forces Superstructure... 50
6 v Girder Resolved Strains and Forces Typical Girder Strain Data at Gauge vs. Time Typical Girder Strains vs. Time Typical Girder Strains vs. Teff Girder Strain and Force Range Substructure Pile Resolved Strains Abutment Backwall Pressure Measured Displacements Superstructure Displacement Coordinate Systems and Coordinate Transformations Bridge 309 Benchmark Three Movements Total Change in Length Total Change in Span Length Bridge Movements Month to Month Effective Thermal Length Fixed Pier Displacement Expansion Pier Displacement Steel Pile Behavior Equivalent Cantilever Model Pile Expansion Chapter 7 Differential Abutment Pile Axial Load Investigation
7 vi 7.1 Background Model development Geometry Elements SHELL SHELL BEAM4 3-D COMBIN Material Properties Abutment Piles and Composite Girders Soil Boundary Conditions Loading Conditions Results Model without Girders Conclusions and Recommendations Chapter 8 Summary, Conclusions, and Recommendations Summary of Procedue Summary of Results Composite Girder Strains and Forces Abutment Steel Pile Strains
8 vii Abutment Backwall Pressure Bridge and Span Change in Length Abutment and Pier Displacements Effective Thermal Length Fixed and Expansion Pier Displacement Abutment Steel Pile Cantilever Model Abutment Steel Pile Strain vs. Expansion Conclusions and Recommendations Internal Composite Girder Strains and Forces Abutment Steel Pile Internal Strains Bridge and Span Change in Length References
9 viii LIST OF FIGURES Figure 4.1. North Abutment Hairline Crack Figure 4.2. North Abutment and Bottom Flange Interface Figure 4.3. Off-Ramp Slab Cracking Figure 4.4. Deck Transvers Cracking Figure 4.5. Guardrail Transverse Cracking Figure 4.6. Approach Slab/Bridge Joint Figure 4.7. North Abutment and Bottom Flange Interface Figure 4.8. Calcium Carbonate Formation Figure 4.9. Girder-to-Diaphragm Welded Connection Figure 5.1. NEMM bridge location and site layout Figure 5.2. Bridge 109 plan view Figure 5.3. Bridge 209 plan view Figure 5.4. Bridge 309 plan view Figure 5.5. Bridge 2208 plan view Figure 5.6. Bridge 2308 plan view Figure 5.7. Bridge 2408 plan view Figure 5.8. Typical bridge cross section Figure 5.9. Local Girder Coordinate System Figure Expansion pier bearing Figure Fixed pier bearing Figure Integral abutment front elevation... 30
10 ix Figure Integral abutment section A-A Figure Semi-integral abutment front elevation Figure Semi-integral abutment section A-A Figure Abutment pile coordinate system Figure Vibrating-wire strain-gauge Figure Expansion meter Figure Long range displacement meter Figure Temperature gauge Figure Bridge 109 instrumentation Figure Bridge 209 instrumentation Figure Bridge 309 instrumentation Figure Bridge 2208 instrumentation Figure Bridge 2308 instrumentation Figure Reflector Instrumentation Figure Survey benchmark Figure Reflector, TS, and BM Locations Figure 6.1. Concrete memeber Figure 6.2. Steel member Figure 6.3. Composite concrete and steel member Figure 6.4. Resolved girder forces Figure 6.5. Four equations and four unknowns Figure 6.6. Bottom east strain gauge reading... 54
11 x Figure 6.7. Top east strain gauge reading Figure 6.8. Top west strain gauge reading Figure 6.9. Bottom west strain gauge reading Figure Axial strain vs. time Figure Major axis bending vs. time Figure Top flange lateral bending vs. time Figure Bottom flange lateral bending vs. time Figure Axial strain vs. T eff Figure Major axis bending vs. T eff Figure Top flange lateral bending vs. T eff Figure Bottom flange lateral bending vs. T eff Figure Strain range calculation axial strain example Figure Axial strain range Bridge 309: Figure Axial strain range Bridge 209: Figure Axial strain range Bridge Figure Strong axis bending strain range Bridge 309: Figure Strong axis bending strain range Bridge 209: Figure Strong axis bending strain range Bridge Figure Lateral bending strain top flange range Bridge 309: Figure Lateral bending strain top flange Bridge 209: Figure Lateral bending strain top flange Bridge Figure Lateral bending strain bottom flange Bridge 309: Figure Lateral bending strain bottom flange Bridge 209:
12 xi Figure Lateral bending strain bottom flange Bridge Figure Axial force range Bridge 309: Figure Axial force range Bridge 209: Figure Axial force range Bridge Figure Strong axis moment range Bridge 309: Figure Strong axis moment range Bridge 209: Figure Strong axis bending moment range Bridge Figure Lateral bending moment top flange range Bridge 309: Figure Lateral bending moment top flange Bridge 209: Figure Lateral bending moment top flange Bridge Figure Lateral bending strain bottom flange Bridge 309: Figure Lateral bending strain bottom flange Bridge 209: Figure Lateral bending strain bottom flange Bridge Figure Abutment pile internal forces Figure Typical internal axial strain Figure Typical internal major axis bending strain Figure Typical internal minor axis bending strain Figure Typical internal torsional-warping strain Figure North-west abutment backwall pressure vs. effective temperature Figure North-east abutment backwall pressure vs. effective temperature Figure South-west abutment backwall pressure vs. effective temperature Figure South-east abutment backwall pressure vs. effective temperature Figure Assumed backfill passive stress distribution... 83
13 xii Figure Local abutment and pier coordinate systems Figure Bridge 309 Benchmark three movements Figure Total change in length Bridge Figure Total change in length Bridge Figure Total change in length Bridge Figure Total change in length Bridge Figure Total change in length Bridge Figure Total change in length Bridge Figure Change in length per span Bridge Figure Change in length per span Bridge Figure Change in length per span Bridge Figure Change in length per span Bridge Figure Change in length per span Bridge Figure Change in length per span Bridge Figure Deflected shape Bridge Figure Deflected shape Bridge Figure Deflected shape Bridge Figure Deflected shape Bridge Figure Deflected shape Bridge Figure Deflected shape Bridge Figure Bridge 109 movement north abutment west and east Figure Bridge 109 movement north pier west and east Figure Bridge 109 movement south pier west and east
14 xiii Figure Bridge 109 Movement south abutment east and west Figure Bridge 209 movement north abutment west and east Figure Bridge 209 movement north pier west and east Figure Bridge 209 movement south pier west and east Figure Bridge 209 Movement south abutment east and west Figure Bridge 309 movement north abutment west and east Figure Bridge 309 movement north pier west and east Figure Bridge 309 movement south pier west and east Figure Bridge 309 Movement south abutment east and west Figure Bridge 2208 movement north abutment west and east Figure Bridge 2208 movement north pier west and east Figure Bridge 2208 movement south pier west and east Figure Bridge 2208 Movement south abutment east and west Figure Bridge 2308 movement north abutment west and east Figure Bridge 2308 movement north pier west and east Figure Bridge 2308 movement south pier west and east Figure Bridge 2308 Movement south abutment east and west Figure Bridge 2408 movement north abutment west and east Figure Bridge 2408 movement north pier west and east Figure Bridge 2408 movement south pier west and east Figure Bridge 2408 Movement south abutment east and west Figure Bridge 109 relative displacement between fixed pier and Girder B Figure Absolute movement of bottom flange of Girder B at north pier reflector
15 xiv Figure Expansion pier displacement Figure Equivalent cantilever pile model Figure Weak axis bending strain vs. displacement SAHP Figure Weak axis bending strain vs. displacement SAHP Figure Weak axis bending strain vs. displacement SAHP Figure Weak axis bending strain vs. displacement NAHP Figure Weak axis bending strain vs. displacement NAHP Figure Weak axis bending strain vs. displacement NAHP Figure 7.1. SAHP1 axial strain vs. effective bridge temperature Figure 7.2. SAHP4 axial strain vs. effective bridge temperature Figure 7.3. SAHP6 axial strain vs. effective bridge temperature Figure 7.4. Temperature data Figure 7.5. Analytical model elevation view Figure 7.6. Analytical model plan view Figure 7.7. Analytical model end views Figure Model boundary conditions Figure 7.9. Abutment temperature gradient Figure Model deformation boundary set one Figure Axial load results boundary set one Figure Model deformation boundary set two Figure Axial load results boundary set two
16 xv LIST OF TABLES Table 2.1. Results from Table 10.1 Thanasattayawibul (2006)... 6 Table NEMM bridge geometry Table 5.2. Steel girder dimensions (all dimensions in inches) Table 5.3. Composite section properties Girder A at strain-gauge locaions Table 5.4. Composite section properties Girder D Table 6.1. Strain Range Girder A Table 6.2. Strain range Girder D Table 6.3. Force Range Girder A Table 6.4. Force range Girder D Table 6.5. Measured pile internal strain ranges Table 6.6. Calculated pile internal force ranges Table 6.7. Approximation of girder axial force from abutment backwall pressure Table 6.8. Total free expansion and measured change in length Table 6.9. Calculated average axial strain vs. measured average axial strain Table Effective Thermal Length Table 7.1. Abutment material properties ANSYS model Table 7.2. Soil properties ANSYS model
17 xvi LIST OF VARIABLES A, B, and C = gauge specific constants given by manufacturer A c A p A s B abutment Be D D 0 D i (EA) eff, E c E s G I f I ytb (steel) I ytf (steel) K K p K q K v L L L eff L cable L c L e Lg L gauge L max = the area of concrete = cross-sectional area of the pile tips = the area of the steel = width of the abutment = effective slab width, = the depth of the web = initial reading = reading at time i = effective axial rigidity = the linear elastic modulus of concrete = the linear elastic modulus of steel = correction factor that converts digits to inches (provided by manufacturer) = moment of inertia of a flange about its smaller principal axis = moment of inertia of the bottom flange for Y-axis bending = moment of inertia of the top flange for Y-axis bending = a temperature correction coefficient given by the manufacturer (digits/ C) = the coefficient of passive lateral earth pressure (psi/psi) = end-bearing soil-spring resistance = skin-friction soil-spring resistance = length of bridge along curve = length of the member = effective thermal length = the length the cable = the length of the concrete member = equivalent cantilever length = distance between equivalent Mg moments = the distance from the top of the abutment to the pressure cells = the total height of each abutment
18 xvii L p L s M M and B M f M g M lb M lt M x N P P P c P s P gauge P max P total R Ri Y(NA) Z Δ d f bw t s x x i y i = tributary pile length for each soil-skin-friction soil-spring = the length of the steel member = resulting end moment = constants for the model 1127 gauges given by the manufacturer = lateral bending moment acting on the flanges = resulting moment at location of strain gauges = lateral bending moment in the bottom flange = lateral bending moment in the top flange = strong axis bending moment = a constant of either 10 or 12 (engineer s discretion) = applied load on composite section = the internal axial force = applied unit load on concrete = applied unit load on steel = the maximum stress measured at the location of pressure cells = the approximated maximum stress at the bottom of the abutment = the total approximate force applied to each abutment = the radius of the girder = the frequency reading produced by the gauge when the vibrating wire is plucked = the distance to the neutral axis measured from the center of the bottom flange = depth from top of soil to location of desired stress (in.) = applied lateral end displacement = centerline concrete slab to centerline bottom flange = tension or compression stress due to warping of the cross-section = slab thickness = distance from center of flange to flange tip = distance from neutral axis to strain gauge i along the X-axis = distance from neutral axis to strain gauge i along the Y-axis
19 xviii ӯ = distance from the center of the bottom flange to the neutral axis α c α cable α eff α s δ δ c δ s ε current ε reference ε a ε ylt ε ylb ε i ε x ε t ΔD cable ΔD uncorrected L avg L s = the thermal expansion of concrete = the coefficient of thermal expansion of the cable = the effective thermal expansion coefficient of combined steel and concrete = the thermal expansion of steel = displacement of composite section = displacement of concrete = displacement of steel = the microstrain reading at its respective time = the microstrain reading on April 28 th, 2011 at 6 a.m. = internal axial strain = lateral bending strain in the top flange = lateral bending strain in the bottom flange = strain reading at gauge i = strong axis bending strain = internal torsional-warping strain = the correction = the reading, in inches, before a temperature correction, = the average bridge expansion computed via instrumentation data during the surveying time interval = the surveying expansion referenced to April 28 th, 2001 at 6 a.m., L s = the surveying expansion at the time of the survey on April 28 th, 2011 ΔT air ΔT eff ΔT c ΔT s Δd Δε ε r σ x = the ambient air temperature = the effective bridge temperature = the change in temperature of the concrete member = the change in temperature of the steel member = range on longitudinal movement of fixed pier or integral abutment = difference in microstrain = resistance axial strain = total horizontal stress (psi)
20 xix σ z = total vertical stress (psi) ϕ = effective friction angle of the soil (degree) ɣ = unit weight of soil (lb/in. 3 )
21 xx ABSTRACT The National Cooperative Highway Research Program (NCHRP) has shown concerns regarding the design, fabrication, and erection of horizontally curved steel girder bridges due to unpredicted girder displacements, fit-up, and locked-in stresses. Nationally, up to onequarter of steel girder bridges are being designed with horizontal curvature, an alarming figure when considering the unknown behaviors of this type of bridge. The primary objective of this work was to monitor and evaluate the behavior of four in-service, horizontally curved, steel-girder bridges with integral and semi-integral abutments. Additionally, the influence and behavior of fixed and expansion piers were considered. A number of steps were performed in order to meet the project objectives. First, a national state department survey was conducted and a literature review was performed in order to understand the state-of-art regarding these types of structures. Second, a monitoring program was developed and installed on six bridges located at the I-35, I-235, and I-80 interchange northeast of Des Moines. Third, a monthly survey was conducted on each bridge with the purpose of tracking the bridge movements, and lastly, the data gathered during the monitoring period of the project was post-processed. The following general conclusions were made from the results of the study: There was no measureable difference between the horizontally curved bridges and straight bridges used in this work with regard to bridge behavior; internal strains were recorded in the composite girders as a result of thermally induced restrained expansion and contraction, and of the recorded strains, axial strain showed the largest ranges; the bridges expanded and contracted with seasons and showed more expansion and contraction near expansion piers than fixed piers. The equivalent cantilever method of steel pile analysis fell short of accurately predicting the relationship between weak axis bending strain in the piles and the pile head displacement; the measured internal stress in the abutment piles due to expansion and contraction of the bridge were generally below 50% of yield stress; and the soil pressures on the abutment backwalls were generally below approximate passive soil pressures.
22 xxi ACKNOWLEDGEMENTS I would like to take this time to thank the people that made this work possible. First, I would like to thank my mentors Brent Phares, Lowell Greimann, and Robert Abendroth for their patience and guidance throughout my time as a graduate student at Iowa State University. Second, I would also like to thank Doug Wood and Travis Hosteng for spending countless hours on my project making sure everything ran as smoothly as possible. Third, I would like to thank Andrew Barone, Brady Bogaard, Katelyn Weiler, and Peter Moreau for assisting the project in anything that was asked. Lastly, I would like to thank everyone at InTrans for providing me with a high quality and memorable learning environment.
23 1 CHAPTER 1 INTRODUCTION This chapter presents the background to the project and the problems it addresses, the objective and scope of the project, and the research plan undertaken during the project. The final section of this chapter summarizes the organization of this report. 1.1 BACKGROUND A report published by The National Cooperative Highway Research Program (NCHRP) raised concerns regarding the design, fabrication, and erection of horizontally curved steel girder bridges. These concerns are centered around difficult-to-predict girder displacements, fit-up issues, and unintended locked-in stresses. Because curved steel girder bridges are used in up to one-quarter of the nation s steel girder bridges, having a better understanding of actual behavior and therefore having better design methodologies is of notable importance. In order to have these concerns addressed, the NCHRP developed a research problem statement and gave it high priority for funding. A major problem facing the Nation today is the need to replace large numbers of bridges. Future engineers will need to utilize cost effective and durable designs in order to meet this challenge. Bridge joints permit relative movement between bridge deck spans and abutments; however they must be continually maintained at a cost to the owner. Therefore, an urgent need exists to reduce bridge maintenance costs by eliminating or reducing deck joints. One way to achieve this is by expanding the use of integral abutments to include curved girder bridges. 1.2 OBJECTIVE AND SCOPE The combined use of horizontally curved steel girder bridges and integral abutments stands to be a promising design; however this combination is relatively new to the nation, and to Iowa. The purpose of the work summarized herein is to investigate the use of integral abutments on curved girder bridges through a monitoring and evaluation program of inservice bridges. 1.3 RESEARCH PLAN The objective of the research project was to gather information that will assist in the future design of integral-abutment, curved-girder bridges by monitoring and analyzing the
24 2 behavior of curved steel girder bridges with integral abutments. There are three general task groups for this project, each of which consists of several related tasks, as described below Task Group I: Information Collection The use of integral abutments in curved girder bridges has either not been tried with great frequency or is not well documented in the technical literature. As such, the first project task group involved collection of information on the use of these combined structural systems. The following tasks were taken to fulfill this task group s objective: Task A Technical Advisory Committee A Technical Advisory Committee (TAC) was formed to assist the ISU research team regarding issues related to curved girders, integral and semi-integral abutments, and fixed expansion piers. They also assisted in establishing performance metrics that could be used to evaluate the performance of curved-girder, integral-abutment bridges. The TAC was encouraged to provide other information they deemed useful to the research team. Task B Survey of available technologies A survey, which was sent to all the Nation s state DOTs, was conducted to determine if integral abutments have been used for horizontally curved bridges and, if so, what were the significant findings, conclusions, or recommendations regarding these types of bridges. The survey also requested that the state bridge engineers express concerns regarding potential behavioral issues and to provide any specific information related to instrumentation and monitoring of these types of bridges. Task C Review of available engineering literature Although a brief literature search and review had been performed before the project officially began, a more complete review was conducted to determine the past and present use of integral abutments for horizontally curved bridges and to uncover any concerns or problems associated with this type of bridge construction. Since significant information on curved-girder, integral-abutment bridges was not initially found in the literature, two general literature searches were conducted that individually addressed horizontally curved bridges and integral-abutment bridges separately in order to formulate potential behavioral issues and to develop a more refined project scope.
25 3 Task D Inspect existing curved and chorded girder bridges The re-alignment of the intersection of Interstates I-35, I-80 and, I-235 (Northeast Mix- Master) near Des Moines, Iowa included the demolition of the old bridges and the construction of six new bridges. Several bridge types were used in the reconstruction including curved girder bridges with integral or semi-integral abutments. For this task, two I- 235 curved girder bridges were inspected to determine if there was any evidence of problems associated with the use of integral abutments Task Group II: Collect and Analyze Data on the Performance of Five or More Bridges The reconstruction of the Northeast Mix-Master, started in 2008, provided the opportunity to monitor the behavior of curved and straight-steel girder bridges. The interchange design was planned so that semi-integral abutments with expansion joints were used in two curved-girder bridges, and integral abutments were used in two essentially identical bridges. There were six, 26-ft wide roadway bridges included in the research. Bridge characteristics are presented in Chapter 5 of this report. The following tasks highlight the steps taken by this task group: Task E Finalize an Instrumentation Plan Working with the Iowa DOT Office of Bridges and Structures, the research team developed preliminary instrumentation schemes for five of the six Northeast Mix-Master bridges. These schemes are shown in Chapter 5, along with pertinent bridge information. The instrumentation layouts typically consist of strain gauges on girders and other elements, temperature sensors, sensors utilized to monitor the differential girder-to-substructure displacement at expansion piers and semi-integral abutments, and techniques for monitoring the global movement of the substructure elements. Along with the instrumentation placed on the bridges, each of the six bridges was outfitted with eight surveying-type reflectors for the purpose of performing monthly surveys of the bridges. These reflectors were placed on the exterior girders at both abutments and both piers. The survey procedure is discussed further in Chapter 5. Task F Monitor and Analyze the Behavior of the Selected Bridges The bridges were monitored over a period of approximately 18 months. During this
26 4 period, the strains, temperatures, and displacements were recorded under a variety of loading conditions. Task G Develop and Validate Simple Analytical Models for the Monitored Bridges Using the collected data, simple analytical models were developed and validated. These models may be able to be extrapolated to other design conditions (e.g., geometry, soil conditions, etc.) that may provide information on other hypothetical situations Task Group III. Develop Project Conclusions and Recommendations The focus of this task group was to summarize the entire project with a goal of developing recommendations that will assist bridge owners with decisions regarding the combined use of curved girders and integral abutments. Task H Establish a Meeting with the TAC A final meeting with the TAC was held so that the research team could present the results of the project and some initial project conclusions. The TAC was then asked to provide detailed input at this time. Task I Submit Final Report The Final Report, presented herein, summarizing the results of the research was the final step for this task group. 1.4 REPORT ORGANIZATION Chapter 1 introduces the project including the project background, the objective and scope of the project, and the research plan. Chapter 2 presents a literature review discussing the design of horizontally-curved steel-girder bridges, the use of integral and semi-integral abutments is summarized, and circumstances where both have been used are presented. Chapter 3 summarizes a survey conducted of the nation s transportation departments in regard to their current design practices for horizontally curved, steel-girder bridges with integral and semi-integral abutments. Chapter 4 summarizes a bridge inspection conducted on two partially horizontally curved bridges with integral abutments. Chapter 5 presents the experimental procedure. Chapters 6 and 7 present the results from the testing described in Chapter 5. Lastly, Chapter 8 discusses the results of the experiments, Chapter 9 presents an analytical model from the results, and Chapter 10 presents formulated conclusions, recommendations, and suggested future work with curved-girder, integral-abutment bridges.
27 5 CHAPTER 2 BACKGROUND/LITERATURE REVIEW The design and analysis of straight, integral-abutment bridges (IABs) has a long and extensive history dating back as far as the 1930 s. These bridges came about after the introduction of the Hardy Cross Method and were considered a viable solution to overcoming the downfalls of expansion joints and expansion bearings (Tennessee DOT, 1996). Although there has been a tremendous amount of research on the thermal response of straight IABs, little attention has been paid to their horizontally curved counterparts. Research on the use of integral abutments on horizontally-curved bridges is scarce and their design is not yet well documented nor understood (Hassiotis, 2006). This chapter summarizes completed work on horizontally-curved, integral-abutment bridges. This chapter also presents work on a very abbreviated summary of select, integral-abutment bridges, and on horizontally-curved, nonintegral-abutment bridges. 2.1 Past Work on Thermal Loading on Horizontally Curved IABs The most recent study to investigate the thermal behavior of horizontally-curved, steelgirder, integral-abutment brides was completed by Doust at the University of Nebraska (Doust, 2011). In this study, a detailed investigation was conducted into the behavior of horizontally- curved, steel-girder, integral-abutment bridges and horizontally-curved, concrete slab, integral-abutment bridges using the finite-element-analysis program SAP Multiple bridges were modeled with varying horizontal curvatures and total bridge lengths. The study considered the effect of different loading conditions applied to the bridges, namely gravity loads, lateral loads (longitudinal and transverse), temperature effects, concrete shrinkage, and earth pressure. From the investigation, the author concluded that for bridges longer than a specific length, dependent mainly upon bridge curvature, the internal forces due to expansion are smaller in a horizontally-curved bridge than in a straight bridge of similar length. Regarding bridge displacement, the author was able to develop an equation to predict the direction of end displacements of a horizontally-curved, integral-abutment bridge. This was important because the author also concluded that the abutment piles should be oriented to produce strong-axis pile bending in the direction of this maximum displacement. Based on this study, orienting the piles in such a fashion will reduce the maximum bending stress in the piles.
28 6 Another study involving curved, integral-abutment bridges was presented in a dissertation by Thanasattayawibul at the University of Maryland (Thanasattayawibul, 2006). This work was a parametric study performed using a three-dimensional finite-element model to investigate the effect that different parameters would have on the behavior of horizontallycurved, steel-girder, integral-abutment bridges. Bridge length, temperature, soil profile type, span length, radius, and pile type were the defining parameters selected in this study. As a result of this study, conclusions and recommendations were made for the future research and for the design of horizontally-curved, steel-girder, integral-abutment bridges. Table 2.1 lists Thanasattayawibul s results. The left column shows the parameter being studied. The middle column shows the results of the stress intensity in the piles as related to bridge radius and span length. The right column shows the results of the lateral displacement of the bridge superstore as related to bridge radius and span length. Table 2.1. Results from Table 10.1 Thanasattayawibul (2006) Parameter Stress Intensity in the Piles Lateral Displacement of Bridge Superstructure Increase Bridge Length Temperature Increase Introduction of Predrilled Holes Increase Number of Spans Pile Type Radius Increase Large radius < small radius -up to 300 ft and 400 ft bridge lengths Small radius < large radius -between 400 ft and 1200 ft bridge lengths Large radius < small radius -50 ft and100 ft spans 100 ft spans < 50 ft spans Stress intensity reduction -small radius < large radius -100 ft span < 50 ft span Stress intensity reduction -large radius < small radius Maximum pile stress intensity -friction end-bearing Stress intensity decrease vs. bridge length range -small radius = short bridge length range vs. large radius Pile stress intensity increase -small radius < large radius Large radius < small radius -up to 400 ft and 600 ft bridge lengths Small radius < large radius -between 600 ft and 1200 ft bridge lengths Small radius < large radius -50 ft and100 ft spans 100 ft spans < 50 ft spans Lateral displacement reduction -large radius < small radius Lateral displacement reduction -large radius < small radius. Maximum superstructure lateral displacement -friction piles end-bearing pile Lateral displacement decrease vs. bridge length range -small radius = short bridge length range vs. large radius Lateral displacement increase -small radius < large radius
29 7 2.2 Select Past Work on Thermal Loading on Straight IABs ABAQUS/CAE was used to conduct numerical simulations on the response of a three span, IAB to thermal loads (Shah, 2007). The purpose of the study was to investigate the soil-structure interaction due to temperature changes on IABs with different types of soil behind the abutments and along the piles. Three different soil conditions, incorporating nonlinear soil response and three different temperature changes, were imposed on a model of the Bermis Road Bridge: F-4-20, Fitchburg, Massachusetts. The non-linear response of the soil was modeled using linear springs and an iterative equivalent linear approach. The spring stiffness was determined based on recommendations by Manuals for Design of Bridge Foundations published by National Cooperative Highway Research Program in 1991 (Barker et al., 1991). According to the study, the overall behavior of IABs is significantly affected by the type of soil surrounding the bridge abutments. As expected, an increase in soil compaction adjacent to the abutment results in smaller pile tip displacements and smaller pile bending moments. Also, at lower soil compaction levels the abutment translation tends to be larger and the abutment rotation tends to be smaller; at higher compaction levels the abutment rotation tends to be larger and the abutment translation tends to be smaller. The author also noted that vertical thermal gradient in the abutment, although considered a rigid body, produced bending of the abutment. Abendroth and Greimann (2005) conducted a thorough investigation into the thermal behavior of IABs. First, an extensive literature review was conducted on the following topics: performance of joint-less bridges, bridge field studies, pile tests (field tests and laboratory tests), analytical studies (thermal analysis and integral-bridge analytical studies), integral-abutment design models (bridge temperature, coefficient of thermal expansion and contraction for concrete, bridge displacement, pile design, and approach slabs), and flange local buckling of I-shaped beams. Next, the thermal load responses of two IABs were monitored as described by Abendroth and Greimann: Develop a bridge-monitoring program to obtain long term air and concrete temperature; pile and girder strain; longitudinal and transverse abutment displacements; relative, longitudinal displacements between the bridge girders and their pier caps; pile-
30 8 head rotation relative to the abutment pile cap; and abutment rotations in a vertical plane that is parallel to the length of the bridge (1-4). Next, finite-element models of two integral-abutment bridges were developed. These models were then calibrated and refined using the experimental results. The measured and predicted results of abutment displacements and member strains were compared to verify the accuracy of the finite-element models. Lastly, the authors developed recommendations and design procedures. The recommendations and procedures covered integral-abutment backwalls, pile caps, abutment piles, and connections; design examples were provided. Conclusions the authors drew were as follows: a good correlation exists between longitudinal displacements of the integral abutments and the recorded changes in the average bridge temperatures, the extrapolated maximum bending strains at the flange tip of the HP abutment piles exceeded the minimum yield strain of the steel at one of the bridges and was equal to approximately 73% of the minimum yield strain of the steel at the other bridge, the measured longitudinal strains in the PC girders were within acceptable limits for both bridges, and the vertical rotations and longitudinal displacements of the abutments for both bridges were over estimated by the finite-element models when compared to the measured experimental results. The authors also made a number of design recommendations from the results of their study. Please refer to Chapter 10 of Abendroth and Greimann (2005) for more details on their conclusions. In 2005 the Federal Highway Administration (FHWA), in conjunction with West Virginia University, hosted a conference on integral abutment and jointless bridges. The purpose of the conference was to establish the current practices with regard to design, maintenance and rehabilitation, and construction of integral abutment and jointless bridges and to present case studies regarding the use of IABs. Each of the topics had five to seven presentations reporting on studies completed across the United States. One example was a presentation by Frosch et al. (2005). In this study the authors, in conjunction with the Indiana DOT, instrumented four bridges in Indiana to observe the in-service behavior of straight, integral-abutment bridges. Some notable conclusions were drawn from the study. First, the movement of the abutment can be conservatively estimated using the theoretical thermal expansion and contraction of the superstructure by ΔL=α(ΔT)L. Secondly, the primary
31 9 thermal response of the abutment is to translate longitudinally and that minor abutment rotations can be ignored for analysis. Lastly, piles integrally connected with the abutment experience double curvature bending but pinned connections can be detailed to eliminate the double curvature. 2.3 Past Work on Thermal Loading on Horizontally Curved Non-IABs Hall et al. (1999) established design specifications for horizontally-curved, steel-girder bridges. This report was published by NCHRP and was based upon over one hundred studies. Section 3.4 of this report addresses thermal loads in the bridge superstructure. It states: According to the Recommended Specifications, curved bridges should be designed for the assumed uniform temperature change specified in AASHTO Article The orientation of bearing guides and the freedom of bearing movement is extremely important in determining the magnitude and direction of thermal forces that can be generated. For example, sharply skewed supports and sharp curvature can cause very large lateral thermal forces at supports if tangential movements are permitted and radial movements are not permitted. Under a uniform temperature change, orienting the bearing guides toward a fixed point and allowing the bridge to move freely along rays emanating from the fixed point will theoretically result in zero thermal forces. Other load conditions, however, can dictate the bearing orientation. The bearing restrainys and orientation, as well as the lateral stiffness of the substructure, must be considered in a thermal analysis (15). Section 3.4 of the Hall et al. report discusses the need, in certain conditions, to consider deck temperature gradients as specified by the AASHTO LRFD Specifications. If the width of the deck is less than one-fifth of the longest span, the bridge is considered narrow and uplift can occur. Section 8.3 of this report addresses thermal induced movements in the bearings and states Bearing devices should be designed to accommodate movements due to temperature changes in the superstructure and to accommodate rotations about the tangential and radial axes of the girder (25). Moorty and Roeder (1992) studied the effect various geometric parameters, orientation of the bearings, and the stiffness and resistance of the substructure had on the thermal response of curved bridges. Analytical models of a 600-ft long, three span, horizontally-curved, steel-
32 10 girder bridge had vertically varying temperature distributions applied to them. The location of the fixed point, the bearing orientation, the relative stiffness of the bearings, the stiffness of the piers, and the angle of curvature varied between models. The Sutton Creek Bridge was also used in a field study conducted by the authors to compare and validate the information provided by their models. The Sutton Creek Bridge is a 658-ft long, three-span, horizontallycurved, steel-girder bridge in the Kootenai National Forest in Montana. For the field study, the bridge temperature, the ambient air temperature, and the bridge movements were measured over a three-day period and the wind speed and cloud cover were estimated from local newspapers and radio stations. From their work, Moorty and Roeder were able to draw a number of conclusions about the design of horizontally-curved, steel-girder bridges. For example, the authors state that the method of predicting thermal movements recommended by AASHTO is reasonable for straight orthogonal bridges, but a more refined analysis may be required for skew and curved bridges. Furthermore, an increase in the curvature of the bridge results in an increase in the radial movements and stresses in the bridge. The relative stiffness of the bridge, the girder bearings, and the substructure influence the tangential and radial movements in a horizontally-curved bridge; and the transverse movements and stresses in bridges increase with an increase in the skew angle and the width of the bridge.
33 11 CHAPTER 3 SURVEY OF STATES In March of 2010, a survey of state transportation agencies regarding their experience with horizontally curved bridges with integral abutments was conducted. This chapter covers the purpose of the survey, describes the survey, and reports the information obtained by the survey. 3.1 PURPOSE The purpose of the survey was to synthesize the state-of-the-practice with regard to the design and construction of horizontally curved bridges with integral and semi-integral abutments and to gather available information on the behavior of these type of a bridges. 3.2 DESCRIPTION OF SURVEY For this survey, an online questionnaire was utilized. This format helped with distribution of the survey and helped minimize response time. The DOT s were sent an that asked for their participation in a short questionnaire along with a brief description of the questionnaire and why the survey as being conducted. The DOT s were also provided with a web page link and a password that allowed them access to the questionnaire. The survey consisted of ten questions formulated to assess the agencies experience with horizontally curved steel girder bridges with integral abutments. Following an initial evaluation of the responses, follow-up phone interviews were conducted with the states that were deemed to have the most experience. Of the 50 state agencies, a total of 27 participated, six of which were contacted for the follow-up phone interview. 3.3 INFORMATION GAINED Reasons for Construction Out of the responding agencies, those that construct horizontally curved, steel girder bridges with integral or semi-integral abutments indicated that they do so for corrosion protection and elimination of expansion joints/expansion bearings. Some agencies also indicated that they consider restrained girder ends as a benefit for both uplift and torque. Agencies that do not construct horizontally curved, steel girder bridges with integral or semiintegral abutments do so because of poor soil conditions, extreme temperature ranges,
34 12 unfamiliarity with design, concerns with additional forces on the girders, and a general lack of need for integral abutment bridges. One state indicated that, Integral abutments inhibit movements at bridge ends. This movement is necessary to dissipate energy during seismic events Published or Unpublished Reports Agencies were asked if they were aware of any published or unpublished documents that addressed the design, monitoring, or performance of horizontally curved, integral or semiintegral abutment, bridges. Pennsylvania, who was the only state that indicated that they knew of any published information, indicated that they had contracted with Penn State University to monitor four straight integral abutment bridges and to develop a design methodology based on the monitored behavior of the bridges. Vermont was the only state that was aware of any current or contemplated research regarding horizontally curved, integral or semi-integral abutment bridges. In that work a single curved girder bridge is being monitored. The monitoring began in the early winter of 2009 and, at the time of this survey, had not yet resulted in published information Additional Limitations For the most part, responding agencies do not have limitations on radius, total length, or material type for horizontally curved bridges with integral or semi-integral abutments beyond the limitations that are applicable to straight bridges with integral or semi-integral abutments. Several agencies place a limit on the skew angle and the span length, such as skew angle is limited to 30 to 45 and the span length is limited to anywhere between 250 ft to 450 ft Common Design Methods The most commonly indicated analysis method used in the design of horizontally curved bridges with integral or semi-integral abutments was the grillage method (used by 46% of the respondents). The grillage method is an analysis technique where the physical deck is idealized into an equivalent grid of structural members (Hall 1999). The next most commonly indicated analysis method was the finite element method (used by 31% of the respondents). The finite element method is a numerical technique where the structure is idealized into a mesh of elements (Hall 1999). The V-load method was cited as the third most
35 13 common analysis method (used by 27% of the respondents). The V-load method is an approximate solution that assumes a distribution of radial forces between the girders. The radial forces are a result of the need to balance axial forces acting on a horizontally curved girder. Diaphragm members are assumed to resist the radial force and, as a result, cause a moment on the inside and outside girders (Richardson 1976). Finally the M/R method, an approximate method used for box girder bridges (Hall 1999), was the least cited analysis method (used by 8% of the respondents). The M/R method is a technique that follows the logic that the difference in total bending moment between any two points is the area under the shear diagram except that it utilizes torsional moments. The total change in total torsional moment between any two points is equal to the change in area under the (M/R t) diagram between those two points (Richardson 1976). The percentage of respondents that used each respective analysis method do not sum to 100% because several (31%) respondents use more than one analysis method Follow-up Interview Personnel in six states were interviewed by telephone to get further clarification on their initial survey responses. Most of the agencies started using integral abutments in the 1970 s. Some agencies started using semi-integral abutments in the 1960 s and integral abutments later. None of the agencies have any evidence of thermal expansion performance issues associated with horizontally curved steel girder bridges with integral abutments. None of the interviewed agencies use a specific erection scheme that differs from that for a horizontally curved bridge without integral abutments. All of the agencies believe that expansion and contraction of the bridge occurs with temperature changes; however, each agency has their own method to address this matter. Tennessee is the only state that attempts to fully quantify the thermal movements. All other agencies design structural components to accommodate the thermal movements. Each of the agencies uses approach slabs that are tied to horizontally curved integral abutment bridges. Typically, reinforcing bars are designed to work as a pin connection allowing relative rotation but not translation at the slab/bridge joint. Lastly, none of the interviewed agencies had any specific limits placed on the design of these bridges. Each state allows their designers to use their judgment in design of a bridge with suggestions to guide, not limit, their design.
36 14 CHAPTER 4 IN-SERVICE BRIDGE INSPECTIONS On July 26th, 2010 two members of the research team accompanied an Iowa DOT Bridge Inspection crew while they inspected two steel girder bridges that were built in 2005 in the Des Moines, IA area. These bridges are partially curved and have integral abutments. This chapter covers the purpose of the inspection, the location and geometry of the bridges, and the inspection findings. The purpose of the visit was to identify any evidence of problems associated with the use of horizontally-curved, steel-girder bridges with integral abutments. 4.1 BRIDGE LOCATION AND GEOMETRY The first bridge inspected was Bridge No , which carries West 19th Street over I-235 in Des Moines, IA and has a horizontally curved off ramp on the northwest side of the bridge. The bridge cross section near the north abutment is comprised of ten steel girders with variable cross-sectional dimensions. The three most easterly girders are straight and the other seven girders are curved, with the degree of curvature increasing towards the westernmost exterior girder. Due to the increasing degree of curvature, the spacing between the girders also increases as the girders approach the abutment. At the section near the north abutment the bridge deck is crowned over the fourth girder from the east side of the bridge. The deck slope varies to the west of the crown, is constant at 2.5% to the east over the straight girders, and is approximately zero at the sidewalk. The second bridge inspected was Bridge No This bridge carries West 3rd Street over I-235 in Des Moines, IA and has a horizontally curved off ramp on the northeast side of the bridge. The bridge cross section near the north abutment has nine steel girders with varying cross-sectional dimensions. North of the north pier all nine girders have horizontal curvature. The curvature of the girders increases from the west to the easternmost exterior girder. As with Bridge the girder spacing increases from west to east. The bridge deck is horizontal at the sidewalk then varies while sloping to the east. 4.2 INSPECTION FINDINGS th Street Bridge While inspecting the 19 th Street Bridge, the north abutment and girders were visually inspected for cracking and other signs of damage. Also, the bridge deck and guard rail were

37 15 visually inspected. Figure 4.1 displays a typical hairline crack in the north abutment near its mid-width. This crack runs vertically along the abutment and extends roughly over about 80% of the visible height of the abutment. This cracking is typical of hairline cracking observed in the abutment. However, these cracks could not be specifically attributed to curvature of the bridge girders. Figure 4.1. North Abutment Hairline Crack Figure 4.2 displays slight cracking near the interface between the steel girders and the north abutment at the bottom flange of the steel girders. These cracks typically are oriented downward at a 45 angle from the corners of the bottom flange. These cracks appeared at each of the girder-to-north abutment connections. Figure 4.3 displays cracking in the off-ramp slab that runs perpendicular to the expansion joint. There were multiple cracks found similar to the one shown. It is interesting to note that these cracks do not follow the curve of the underlying girder. Figure 4.4 displays transverse cracking in the deck slab. The crack shown is close to the mid-span of the bridge and runs the full width from side-to-side of the bridge. This crack was not the only transverse crack found in the slab, but was the longest. Figure 4.5 displays transverse cracking in the guardrail that divides the roadway and pedestrian sidewalk. These cracks typically occur at five ft increments along the length of the barrier and occur on both sides of the bridge.


38 16 Figure 4.2. North Abutment and Bottom Flange Interface Figure 4.3. Off-Ramp Slab Cracking


39 17 Figure 4.4. Deck Transvers Cracking Figure 4.5. Guardrail Transverse Cracking Figure 4.6 shows the joint at the sidewalk between the approach slab and the bridge. Comparing Figure 4.6 to Figure 4.3 reveals that the joint at the sidewalk is open more than the expansion joints in the deck Third Street Bridge While inspecting the 3 rd Street Bridge, the north abutment and girders were checked for cracking and any signs of other types of damage. Despite the similarities in design, the West 3rd Street Bridge displayed less damage than that of the West 9th Street Bridge. However, there were some notable discoveries.


40 18 Figure 4.6. Approach Slab/Bridge Joint Figure 4.7 displays slight cracking at the joint between the steel girders and the north abutment at the bottom flange of the steel girders. These cracks run downward at a 45 angle from the corners of the bottom flange. These cracks appeared at each of the girder-to-north abutment connections. Most notably about this figure is the oxidation that has occurred around the cracks and below the girder. Figure 4.7. North Abutment and Bottom Flange Interface


41 19 Figure 4.8 is another photograph of cracking occurring in the abutment. This figure shows evidence of salt water infiltration as indicated by the formation of calcium carbonate crystals around the cracks. Figure 4.8. Calcium Carbonate Formation While on inspection, a possible fatigue crack indication, shown in Figure 4.9, was found in the girder-to-diaphragm connection of one of the horizontally curved girders. Upon further testing conducted by the Iowa DOT, the defect identified on the weld toe adjacent to the top flange on the stiffener to the web weld was the result of a lack of fusion at the weld toe. Figure 4.9. Girder-to-Diaphragm Welded Connection

42 20 CHAPTER 5 EXPERIMENTAL }ROCEDURE One of the principal aspects of this project was to monitor the behavior of horizontally curved, steel girder, integral and semi-integral abutment bridges under changes in temperature and live load. As such, six bridges constructed by the Iowa DOT were instrumented with various sensors at various locations. Behaviors under live loads were evaluated using point-in-time testing and the behaviors under temperature variations were monitored for a period of approximately 18 months. 5.1 BRIDGE LOCATION AND GEOMETRY Site Plan View The intersection of Interstate 80, Interstate 35, and Interstate 235 on the northeast side of Des Moines, also known as the North-East Mix Master (NEMM), was the location for the testing associated with this work. Overall, there were six, 26-ft-wide roadway bridges that were included in the research. The interchange layout was configured such that semi-integral abutments were used in two of the curved bridges and integral abutments were used in two of the curved bridges. In general the bridges had geometries that made them essentially mirrorimages. Two other ramp bridges at the NEMM are straight with integral abutments and are generally in this work for comparison purposes. Figure 5.1 displays the location and site layout of the NEMM. Bridge109 Bridge 309 Bridge 209 N Bridge 2208 Bridge 2308 Bridge 2408 Imagery 2011 DigitalGlobe, GeoEye, USDA Farm Service Agency, Map data 2011 Google Figure 5.1. NEMM bridge location and site layout The six bridges labeled in Figure 5.1 are part of an on ramp or an off ramp at the NEMM interchange. The Iowa DOT assigned the bridge labels, identifying them as shown in the
43 3 '-2 " 2 6 '-0 " 4 '-6 " 21 figure. The top left bridge, Bridge 109; and the bottom right bridge, Bridge 2408; are the straight, steel-girder bridges with integral abutments. The remaining four bridges are the horizontally curved, steel-girder bridges with integral and semi-integral abutments: Bridge 209, 309, 2208, and The center of curvature for each of the horizontally curved bridges is the same for all four girders of the same bridge and therefore the radii for the girders vary Bridge Configurations Bridge 109 is a one lane, three-span bridge with a straight-alignment and spans of 80 ft, 144 ft, and 80 ft, as shown in Figure 5.2. The spans are measured between the centerline of the abutments and the piers. The baseline of the bridge, a line that is a base for measurement or for construction, is located 4 ft 6 in. from the west exterior girder and the abutments and piers are skewed 15. The bridge abutments are integral abutments, the south pier is an expansion pier (EP), and the north pier is a fixed pier (FP) '-0 " 8 0 '-0 " (IA B ) B a s e lin e (E P ) G ird e r A '-0 " G ird e r B 8 0 '-0 " (F P ) (IA B ) N G ird e r C G ird e r D S. A b t. C L B rg. S. P ie r C L B rg. Figure 5.2. Bridge 109 plan view N. P ie r C L B rg. N. A b t. C L B rg. Bridge 209 is a one lane, three-span, semi-integral abutment bridge with a 1,340 ft horizontal curvature radius, and spans of 90 ft, 152 ft, and 90 ft, as shown in Figure 5.3. The spans are measured along the bridge baseline between the centerline of the abutments and the piers. The baseline is located 4 ft - 6 in. east of the centerline of the west exterior girder (i.e., Girder A). The abutments and piers are skewed at a 35 right ahead. The radius of the baseline is 1,340 ft. The abutments are semi-integral abutments, the south pier is an expansion pier, and the north pier is a fixed pier.
44 22 4 '-6 " (S IA B ) B a s e lin e 9 0 '-0 " (E P ) G ird e r A '-0 " '-0 " N P D is p G ird e r B (F P ) 9 0 '-0 " N A D is p N (S IA B ) 3 '-2 " S A D is p S. A b t. C L B rg. 35 S. P ie r C L B rg. G ird e r C G ird e r D R a d ia l L in e 35 N. P ie r C L B rg. 35 N. A b t. C L B rg. 2 6 '-0 " Figure 5.3. Bridge 209 plan view Bridge 309 is a one lane, three span, integral abutment bridge with a 950 ft horizontal baseline curvature radius, and spans of 85 ft, 149 ft, and 85 ft, as shown in Figure 5.4. The baseline is located 2 ft 6 in from the west exterior girder, measured perpendicular to the roadway. The abutments and piers are skewed at 15 left ahead. The south pier is a fixed pier and the north pier is a fixed pier. 2 '-6 " 8 5 '-0 " B a s e L in e (IA B ) '-0 " '-0 " (F P ) G ird e r A G ird e r B (F P ) 8 5 '-0 " N (IA B ) 5 '-2 " G ird e r D G ird e r C 2 6 '-0 " S. P ie r C L B rg. R a d ia l L in e N. P ie r C L B rg. 1 5 S. A b u t. C L B rg. N. A b u t. C L B rg. Figure 5.4. Bridge 309 plan view Figure 5.5 shows the plan view for Bridge This bridge is a one lane, three span bridge with a horizontal radius of 1340 ft and spans of 90 ft, 150 ft and 90 ft. The baseline is located 4 ft 6 in. west of the east exterior girder, and the abutments and piers are skewed at 35 right ahead. The abutments are integral abutments, the south pier is an expansion pier, and the north pier is a fixed pier.
45 S. A b t. C L B rg. R a d ia l L in e S. P ie r C L B rg. N. P ie r C L B rg. G ird e r D G ird e r C N. A b t. C L B rg '-0 " 3 '-2 " 4 '-6 " (IA B ) B a s e lin e 9 0 '-0 " (E P ) (F P ) G ird e r B G ird e r A '-0 " 9 0 '-0 " (IA B ) N '-0 " Figure 5.5. Bridge 2208 plan view Bridge 2308 is a one lane, three span semi-integral abutment bridge with spans of 80 ft, 142 ft and 80 ft and a horizontal curvature of 950 ft, as shown in Figure 5.6. The baseline is located 2 ft 6 in. from the east exterior girder, and the abutments and piers are skewed at 35 left ahead. The north and south piers are fixed piers. 2 6 '-0 " 15 (S IA B ) S. A b t. C L B rg S A D IS P 15 (F P ) S. P ie r C L B rg. G ird e r D G ird e r C R a d ia l L in e N. A b t. C L B rg. N. P ie r C L B rg N A D IS P (S IA B ) (F P ) 2 '-6 " 5 '-2 " B a s e lin e 8 0 '-0 " '-0 " G ird e r B G ird e r A 8 0 '-0 " N '-0 " Figure 5.6. Bridge 2308 plan view Bridge 2408 is a one lane, three span integral abutment bridge with spans of 80 ft, 144 ft and 80 ft, as shown in Figure 5.7. The abutments and piers are skewed at 15 left ahead. The south pier is a fixed pier and the north pier is an expansion pier. Geometric similarities and differences for the six brides become more apparent in a tabular presentation than with the separate plan views for these bridges that are shown in Figure 5.2 through 5.7. Table 5.1 lists the length, width, skew angle, curve, radius, spans, abutment type, and pier fixity for each bridge.
46 3 '-2 " 2 6 '-0 " 4 '-6 " '-0 " '-0 " '-0 " 8 0 '-0 " G ird e r A (IA B ) B a s e lin e (F P ) (E P ) (IA B ) G ird e r B 1 5 N N. A b t. C L B rg. G ird e r C G ird e r D N. P ie r C L B rg. S. P ie r C L B rg. S. A b t. C L B rg. Figure 5.7. Bridge 2408 plan view Table NEMM bridge geometry Design No Length (ft) Width (ft) Skew ( ) Radius (ft) N/A N/A Spans (ft) Abut. Type Integral Semi-Integral Integral Integral Semi-Integral Integral S. Pier Fixity N. Pier Fixity Expansion Fixed Fixed Expansion Fixed Fixed Fixed Expansion Fixed Fixed Fixed Expansion After an examination of Table 5.1, one will notice there are bridge pairings based on general geometry and restraint conditions. Additionally, all bridges are generally similar in terms of span lengths and total length. Bridges 109 and 2408 are both straight bridges with the same abutment type and the same skew angle. The only notable difference between these two bridges is the geographic location of their expansion and fixed piers. Bridges 209 and 2208 share similar span lengths, total length, radius of horizontal curvature, pier fixity, and skew angle. The only major difference between the two bridges is their abutment type. Bridges 309 and 2308 are almost identical to one another. The only major difference between Bridges 309 and 2308 is the abutment type.
47 Bridge Cross Section Except for the girder dimensions and diaphragm configuration, the cross-sectional properties for all six bridges are similar. Each of the bridges has a roadway width of 26 ft and a total width of 29 ft-2 in. The horizontally curved bridges have non-composite bent plate diaphragms and the straight bridges have cross frames with WT horizontal members and angle diagonal members. The typical bridge cross section is shown in Figure 5.8. The left half of the figure shows the diaphragm configuration for the horizontally curved bridges and the right side of the figure shows the cross frames of the straight bridges. 1 '-7 " 2 6 '-0 " 1 '-6 " V a r ie s V a rie s 3 '-1 " V a r ie s V a r ie s G ir d e r D G ir d e r C G ir d e r B G ir d e r A 3 G ir d e r S p a c e s A t 7 '-8 = 2 3 '-0 Figure 5.8. Typical bridge cross section For the six bridges at the NEMM, the Iowa DOT labeled the west exterior girder as Girder A and the east exterior girder as Girder D. However, in this work, the exterior girder on the outside of the curve has been labeled Girder A and the exterior girder on the inside of the curve has been labeled Girder D. Therefore, for the four horizontally curved bridges, Girder A measures the longest total length. Similarly, Girder D measures the shortest total length. The two straight bridges are labeled in a similarly consistent manner and that Girder A and Girder D have the same geometrical properties for a particular bridge. Relabeling was done to eliminate confusion while comparing results between monitored girder locations.
48 Girder Cross Section All six bridges were constructed with welded, I-shaped, plate girders. Along with the variation within a span and from span-to-span, field splices and slab haunches change the cross-sectional properties of the girders. In this work variations in slab haunches were ignored. Table 5.2 lists the girder dimension at the locations within each span that were monitored with strain-gauges. The gauge locations are discussed in Section Table 5.2. Steel girder dimensions (all dimensions in inches) Bridge Span and Girder Location North and South Span Girder A Center Span Girder A t ft b ft t w h w t fb b fb t ft b ft t w h w t fb b fb /4 16 7/ / / /4 18 7/ / / /8 20 7/ / / /4 18 7/ / /8 18 7/ /4 18 7/ /8 18 North and South Span Girder D Center Span Girder D t ft b ft t w h w t fb b fb t ft b ft t w h w t fb b fb /4 16 7/ / / /4 18 7/ / /8 18 7/ /4 18 7/ / / /4 18 7/ / /8 16 7/ /8 16 3/4 16 7/ /8 16 * - location with no strain-gauge To aid in data analysis, a local coordinate system was established for each girder as shown in Figure 5.9. In this coordinate system, while facing north, the positive X-axis direction is to the left and the positive Y-axis direction is downward. In the positive moment regions the concrete deck was made composite with the steel girders with welded shear studs. In this work it was assumed that the effective cross-section of each composite girder was symmetric about their local Y-axis. The effective slab width is considered twice the distance from the centerline of the girder to the end of the deck overhang for each bridge. A constant slab thickness of 8 in. was also assumed. The approximate cross sectional properties of Girder A and Girder D, at the location of strain-gauges, are listed in Table 5.3 and Table 5.4 respectively. For each strain-gauge location, Table 5.3 lists (EA) eff, the effective axial rigidity; (EI x ) eff, the effective flexural axial
49 27 rigidity for X-axis bending; I ytf (steel) and I ytb (steel), the moment of inertia of the top and bottom flange for Y-axis bending, respectively; and Y(NA), the distance to the neutral axis (in the Y direction) measured from the center of the bottom flange. These properties were used to calculate internal forces and moments in the girders from the measured strains. 1 2 B e 1 2 B e t s X -a x is N e u tra l A x is ӯ d where, B e = effective slab width, t s = slab thickness Figure 5.9. Local Girder Coordinate System d = centerline concrete slab to centerline bottom flange, and ӯ = distance from the center of the bottom flange to the neutral axis. Table 5.3. Composite section properties Girder A at strain-gauge locaions Bridge Y -a x is North and South Span Girder A (EA) eff (k) (EI x ) eff (k-in. 2 ) I ytf (Steel) (in. 4 ) I ybf (Steel) (in. 4 ) Y (NA) (in.) e 6 2.0e 9 8.9e 2 8.9e 2 4.0e e 6 2.5e 9 6.7e 2 6.7e 2 4.1e e 6 2.0e 9 8.9e 2 8.9e 2 3.6e e 6 2.4e 9 4.3e 2 4.9e 2 4.1e 1
50 28 Bridge Center Span Girder A (EA) eff (k) (EI x ) eff (k-in. 2 ) I ytf (Steel) (in. 4 ) I ybf (Steel) (in. 4 ) Y (NA) (in.) e 6 2.6e 9 2.6e 2 3.0e 2 4.6e e 6 2.5e 9 3.6e e 2 3.4e e 6 3.1e 9 5.8e 2 9.2e 2 3.9e e 6 2.5e 9 3.6e e 2 3.4e e 6 2.9e 9 3.6e 2 6.7e 2 3.9e 1 Table 5.4. Composite section properties Girder D North and South Span Girder D Bridge (EA) eff (k) (EI x ) eff (k-in. 2 ) I ytf (Steel) (in. 4 ) I ybf (Steel) (in. 4 ) Y (NA) (in.) e 6 1.9e 9 6.7e 2 6.7e 2 3.6e e 6 2.4e 9 4.3e 2 4.9e 2 4.1e e 6 1.9e 9 6.7e 2 6.7e 2 3.6e e 6 2.1e 9 3.0e 2 3.0e Center Span Girder D Bridge (EA) eff (k) (EI x ) eff (k-in. 2 ) I ytf (Steel) (in. 4 ) I ybf (Steel) (in. 4 ) Y (NA) (in.) e 6 2.6e 9 2.6e 2 3.0e 2 4.6e e 6 2.1e 9 3.6e 2 7.5e 2 3.5e e 6 2.9e 9 3.6e 2 6.7e 2 3.9e e 6 2.1e 9 3.6e 2 7.5e 2 3.5e e 6 2.4e 9 2.6e 2 3.8e 2 4.1e Pier Bearings Two types of pier bearings were used for the NEMM bridges studied in this work. Figure 5.10 shows an expansion pier bearing. For this pier design a curved sole plate with a pintle is welded to the girder bottom flange. The curved sole plate rests on a neoprene pad, which is on top of the pier cap. An expansion pier is designed to allow rotation about an axis perpendicular to the longitudinal direction of the girder at the pier location and translation in the longitudinal direction of the girder at the pier location. Figure 5.11 shows a fixed pier bearing. For this pier design a curved sole plate with a pintle is welded to the girder bottom flange. The curved sole plate rests on a masonry plate, which is attached to the top of the pier cap. A fixed pier is designed to allow only rotation about an axis perpendicular to the longitudinal direction of the girder at the pier location.
 On Location (b)schematic Figure 5.10.")


51 29 Translation in the longitudinal direction of the girder is restrained at the pier location. (a) On Location (b)schematic Figure Expansion pier bearing (a) On Location (b) Schematic Figure Fixed pier bearing Substructure Description The research presented in this report involved bridges with differing abutment and pier fixity conditions, as listed in Table 5.1. Each IAB at the NEMM was 29 ft 2 in. wide, the width of each maskwall measured 1 ft 7 in., and the height of each integral abutment varied from bridge to bridge. Figure 5.12 shows a typical front elevation of an IAB used at the NEMM. Each girder bears on a short length of an S3x7.5, which bears on the abutment pile cap, as shown in Figure The entire abutment is supported by vertical piles, with size and spacing varying from bridge to bridge. For clarity, the reinforcing steel in the reinforced
52 30 concrete backwall, mask wall, and pile cap are not shown. Some of the vertical reinforcing bars extend from the pile cap into the abutment backwall and mask walls to form a composite section between the pile cap and the abutment walls. 2 9 '-2 " 1 '-7 " A 1 '-7 " v a rie s B a c k w a ll M a s k w a ll (b e y o n d ) P ile C a p A # o f p ile s a n d p ile s p a c e v a rie s Figure Integral abutment front elevation B a c k w a ll G ird e r S 3 x P ile C a p H P v a rie s Figure Integral abutment section A-A
53 31 Figure 5.14 shows a typical front elevation of a SIAB used at the NEMM. Each girder bears on a curved sole plate with a pintle and a laminated neoprene pad, as shown in Figure ' 2 9 '-5 " 1' A T u rn d o w n J o in t F ille r 4' P ile C a p A # o f p ile s a n d p ile s p a c e v a rie s Figure Semi-integral abutment front elevation Not shown in these figures are the reinforcing steel in the reinforced concrete backwall, mask wall, and pile cap. For the SIAB, no vertical reinforcing bars extend from the pile cap into the backwall. Semi-integral abutments eliminate expansion joints from the bridge deck and their design is intended to eliminate bending strains in the piles due to bridge expansion and contraction because horizontal displacement can occur along the interface between the abutment backwall and pile cap Pile Geometry Each abutment of Bridge 309 (the only bridge to have instrumented substructure elements) had eight HS 10 x 57 piles. Figure 5.16 shows the global coordinate system for the north and south abutment piles of Bridge 309. For these piles, the positive X-axis direction was chosen to be in the same direction as outward expansion of the bridge and the positive Y-axis direction follows the right-hand-rule for a Cartesian coordinate system. For convenience the coordinate system originates at the top of the pile. This coordinate system
54 32 facilitates better comparisons between abutment pile bending strains and abutment displacements. B rid g e D e c k C o n s tru c tio n J o in t T u rn d o w n C u rv e d S o le P la te P in tle N e o p re n e P a d J o in t F ille r G ird e r P ile C a p 1 4 Z Figure Semi-integral abutment section A-A Y Z S N X X X X Y (b) South Abutment-Plan View (c) North Abutment-Plan View (a) South Abutment Elevation (d) North Abutment Elevation View View Figure Abutment pile coordinate system

55 LONG TERM INSTRUMENTATION AND DATA COLLECTION PROTOCOL Electronic Gauge Instrumentation Five of the six bridges described previously were instrumented with a variety of electronic devices for measuring changes in strains, displacements, and temperatures that occurred during the bridge monitoring period for the project. The most common instrument attached to the bridges was Geokon s Model 4150 vibrating-wire strain-gauge. This gauge is designed to measure load-induced strain on structural steel members. Strains are measured using the vibrating-wire principle: as the tension in a wire changes, so does its vibration frequency. A change in the vibration frequency relates to a change in strain in the wire and, therefore, any element, to which the gauge is mounted. The tension is measured by plucking the wire and measuring the resonant frequency of vibration with an electromagnetic coil positioned next to the wire (Geokon 2009c). Figure 5.17 shows a vibrating strain-gauge mounted to a piece of steel prior to the application of the protective coatings. Figure Vibrating-wire strain-gauge For this work, strain-gauges measured strains at mid-length of select girders and spans. Only the exterior girders (Girder A and Girder D) were monitored. Horizontally curved bridges were monitored at each span and one straight bridge, Bridge 109, was monitored at mid-span of the center span. At the locations monitored, four strain-gauges were attached to the inside face of the top and bottom flanges. The gauges were placed 1 in. from the flange tips and oriented to

56 34 measure the longitudinal strains. Four strain-gauges were also attached to the inside faces of both flanges of six piles of Bridge 309. These gauges were placed at a distance of 1 in. from the flange tips. The gauges were located 9 in. below the abutment pile cap. The next most common instrumentation attached to the bridges is Geokon s Model 4420vibrating wire crack meter. This instrument is designed to measure movement across joints. In the case of this work, the gauge was used to measure the movement between the bridge girders and piers and/or the bridge girders and abutments, depending on the particular bridge being monitored. Herein, this gauge is referred to as an expansion meter. The instrument consists of a vibrating-wire sensing element in series with a spring, which is connected to the wire at one end and to a connecting rod at the other end. As the connecting rod is pulled out from the gauge body, the spring is stretched causing an increase in the tension. This increase in tension is sensed by the vibrating-wire element. Since the tension in the wire is directly proportional to the spring extension, the opening of the joint can be determined (Geokon 2008). Figure 5.18 shows an expansion meter attached to the bottom of a steel girder and to the top of a semi-integral abutment. A similar detail was used to attach an expansion meter at pier loations. Figure Expansion meter An instrument that was only used on Bridge 309 is Geokon s Model 4427 vibrating-wire long range displacement meter. This instrument is designed to measure displacements of up

57 35 to 2 meters. The instrument consists of a spool on which is wound stainless-steel aircraft cable. As the bridge temperature increases, which will induce bridge expansion, the cable unwinds from the spool. When the bridge temperature decreases, which will cause the bridge contraction, the cable is rewound on the spool. The spool is connected to a lead-screw in such a way that the rotation of the spool in converted into a linear motion of the lead-screw. The lead-screw is connected to a Model 4450 vibrating-wire displacement transducer, which measures the linear motion between the two attached objects (Geokon 2009b). Figure 5.19 shows a vibrating-wire long-range displacement meter attached to the abutment backwall. To permit the measurement of relative displacements between two points that are far apart, a long steel aircraft cable was connected to the cable that extends from the reel of the transducer. Bridge 309 was instrumented with three of these sensors allowing relative movement between each of the substructure elements to be monitored. Figure Long range displacement meter Ambient air temperature was measured using Geokon s Model 4700 vibrating-wire temperature-gauge. Inside the temperature gauge is a tensioned steel wire. The body of the gauge is stainless steel, while the wire is normal grade steel. As the temperature changes the wire and the body expand and contract at differing rates, causing a change in tension in the wire. The change in tension results in a different vibrating frequency for the wire, which is converted into a temperature change (Geokon 2004). Figure 5.20 shows a gauge hanging from the bottom of one of the bridge decks.
.")
58 36 Figure Temperature gauge There were a few instrumentation devices that were attached to the bridges whose locations could not be photographed. Geokon thermistors, Model 3800, were place at middepth of the bridge decks. These gauges are typically used to measure hydration and cooling temperatures in mass concrete (Geokon 2009a). In this work the gauges measured the temperature of the deck concrete. On the back side of each abutment pile caps for Bridge 309, two Geokon vibrating-wire pressure cells, Model 4800, were attached. These gauges measure the pressure of the soil induced on the abutment backwall. Earth pressure cells are constructed by welding together the periphery of two stainless-steel plates and leaving a narrow space between them. The hollow space created by the plates is completely filled with de-aired hydraulic oil. The oil pressure is converted to an electrical signal by a hydraulically connected pressure transducer. The electrical signal is transmitted through a signal cable to the readout location (Geokon 2010). Each of the monitored bridges was instrumented in different ways depending upon individual configurations and the project goals. As shown in Figure 5.2.1, Bridge 109 had the least amount of instrumentation. Four strain-gauges were attached at mid-length of the center span on Girder A and Girder D. Also, an expansion meter 109NPDisp was mounted to the north pier to measure relative movement between Girder B and the pier (a fixed pier).


59 37 -Strain-gauge set Figure Bridge 109 instrumentation Figure 5.22 shows the instrumentation that was installed on Bridge 209. Strain-gauges were installed on the flanges of Girder A and Girder D at the mid-length of all three spans. Also, expansion meters 209SADisp, 209NPDisp, and 209NADisp were mounted to the south abutment, north pier, and north abutment, respectively. The expansion meters measured the relative movement in a direction tangential to the horizontal curve for Girder B. Relative movement was also measured between Girder B, near each end. Also relative movement between Girder B and the expansion pier was monitored. Figure Bridge 209 instrumentation Bridge 309 was the most heavily instrumented bridge. Figure 5.23 shows the location of these monitoring devices. Strain-gauges were attached to Girder A and Girder D at midlength of each span. Not shown on the figure are the strain-gauges that were attached to the three piles at each abutment. Long range displacement meters 309SAP1Disp, 309P1P2Disp, and 309NAP2Disp were mounted at the south abutment, south pier, and north abutment,


60 38 respectively, to measure the change in the chord length of each span. Two pairs of pressure cells 309SAPrW and 309SAPrE, and 309NAPrW and 309NAPrE were mounted at the third points of each abutment width and at the mid-height of the pile cap to measure soil pressure behind the south and north abutments, respectively. Lastly, temperature gauges 309ETemp and 309WTemp were installed inside the deck on the east and west side of the north pier to measure the concrete temperature and temperature gauge 309AirTemp was hung below the deck at the middle of the north pier to measure ambient air temperature. Figure Bridge 309 instrumentation As shown in Figure 5.24, the instrumentation for Bridge 2208 was similar to that used on Bridge 209, with the exception that expansion meters were not placed at the abutments. Expansion meter 2208NPDisp was mounted on the south pier to measure relative movement between Girder B and the pier, an expansion pier. Figure Bridge 2208 instrumentation Figure 5.25 shows that the Instrumentation for Bridge 2308 was similar to that used on Bridge 209, with the exception that expansion meters were not placed at either pier. Expansion meters 2308SADisp and 2308NADisp were mounted on the south and north


61 39 abutments, respectively, to measure relative movement between Girder B and the abutments. Also, temperature gauges 2308ETemp and 2308WTemp were cast inside the deck at midlength of center span to measure the concrete temperature and temperature gauge 2308AirTemp was hung below the deck mid-length of center span to measure ambient air temperature surrounding that location of the bridge. Figure Bridge 2308 instrumentation Along with all the gauges presented in this section, a data collection and storage system for each bridge was assembled, configured, and installed. The data acquisition system consisted of Campbell Scientific data loggers and associated components. The system featured solar power so that line power was not required. Data from each sensor was collected once an hour during the monitoring period Survey Instrumentation Surveying techniques were used to monitor displacements of each of the previously described six bridges. Each bridge had prism reflectors that were mounted near the bearing points of Girder A and Girder D. These reflectors were used as survey targets for monthly surveys of each bridge during the monitoring period. In total, each bridge had eight reflectors that were located at the abutments and piers. As shown in Figure 5.26, a reflector was bolted to the bottom flange of a metal channel track that was attached to the girder bottom flange. Each reflector was positioned directly below the girder web and was aligned for optimal viewing. These reflectors provided a consistent point to survey each bridge.
 were then used to establish the X, Y, Z coordinates for each reflector location. The bench marks consisted of a 3 in. dia.")
62 40 Figure Reflector Instrumentation Twelve bench marks were installed near the six bridges to establish consistent survey coordinates systems. These benchmarks (which were assumed to not move) were then used to establish the X, Y, Z coordinates for each reflector location. The bench marks consisted of a 3 in. dia. by 10 ft long steel pipe that was embedded 42 in. into the ground. The bottom of the pipe was encased into a concrete footing that rested on undisturbed soil below the frost depth. Figure 5.27a shows a bench mark post during construction. A PVC pipe was sleeved over the steel pipe to shield the steel pipes from direct sunlight that could cause a temperature gradient in the steel pipe and to shield the post from wind that could cause the post to vibrate. A survey reflector was attached to the top of each steel pipe. To shield the reflector from direct sunlight and wind, a T-shaped PVC plumbing fixture was placed over the top of the vertical PVC pipe as shown in Figure 5.27b. The goal with placing these benchmarks was to establish a set of non-moving points in the vicinity of each bridge therefore allowing movements of the bridges to be assessed. Figure 5.28 shows the relative locations of the reflectors (309P01 through 309P08) that were attached to the Bridge 309 girders, three reflectors (109BM1 though 109BM3) that were mounted to the top of bench mark posts, and the two relative positions where the

 Construction (b) Operational Figure 5.27. Survey benchmark The surveyor used a Topcon GPT-7501 Pulse Total Station to monitor the bridges during the monitoring period of the project.")
63 41 surveying instrumentation was placed (309TS1 and 309TS2) for Bridge 309. Note that the locations shown in this figure for the total station and for the bench marks were not drawn to scale. Further, this configuration is representative of that utilized at all bridges. From each total station location, the eight reflectors on the bridge girders and the three reflectors on the bench mark posts were clearly visible when viewed with the survey instrument. (a) Construction (b) Operational Figure Survey benchmark The surveyor used a Topcon GPT-7501 Pulse Total Station to monitor the bridges during the monitoring period of the project. The GPT-7501 Total Station is accurate to 1 in. at 3000 meters and comes pre-loaded with Windows CE.NET.4.2 and TopSURV 7.2 surveying software (Topcon 2007).
64 42 S. A b u t. C L B rg. S. P ie r C L B rg. G ird e r A G ird e r B N. P ie r C L B rg P P P P 0 8 N. A b u t. C L B rg P P 0 3 G ird e r C G ird e r D P P T S B M B M 2 Y -a x is T S 2 X -a x is B M 3 Figure Reflector, TS, and BM Locations Data Collection Once a month a team traveled to the NEMM. While there, the team retrieved the electronic data and surveyed the bridges in the following order: 309, 109, 2208, 2308, 2408, and 209. The survey process at each bridge took approximately one hour. Three survey cycles were completed in which the surveyor shot and recorded the relative location of the benchmark reflectors and the bridge reflectors. The data for each point were stored in the total station as slope distance, horizontal angle, and zenith angle. In all cycles the total station was rotated through 360 such that any closure error could be accounted for while postprocessing the data. After the first three cycles, the surveyor moved and re-setup the total station and repeated the process used during te first three cycles. After all six bridges were surveyed the data were transferred from the total station to a permanent storage location. The team post processed the data to transform the new survey data into a Cartesian coordinate system originating at BM1. With the Y-axis oriented from BM1 to BM2 and the X-axis 90 clockwise from the Y-axis, as shown in Figure 5.28.
65 43 CHAPTER 6 LONG TERM EXPERIMENTAL PROCEDURE AND RESULTS 6.1 PREANALYSIS Thermal Strains due to Solar Radiation During initial evaluation of data collected from the strain gauges mounted on the girders an unusual amount of outliers were noticed. It was found that the cover used to protect the strain gauges did not provide enough thermal protection when exposed to direct sunlight. The sunlight raised the temperature of the gauge significantly and resulted in what were determined to be erroneous readings. To remedy this, only girder strain-gauge data collected between 9 p.m. to 6 a.m. were considered in the analysis Setting a Reference Date Because the installed instrumentation measured changes over time a reference date is needed to be set. The reference date is the date where the sensors were essentially zeroed. The reference date was selected to be the reading at 6 a.m. April 28th, April 28th was the first date that all the measured data were believed to be high quality. Prior to this date, the team had instrumentation issues that resulted in erroneous data. No April 28th survey data were available at the 6 a.m. reference date since surveys were performed during the daylight. However, the survey from the April 28th survey was set as the reference date for the survey data. All data in this report are presented with respect to the reference date. Therefore, all date reference data presented here is equal to the difference between the instrument reading at that date and the instrument readings at the reference date. For example, the difference between the strain reading at the reference date and the current strain reading would be calculated as: Δε = ε current ε reference (6.1) where, Δε = difference in microstrain, ε current = microstrain reading at its respective time, and ε reference = microstrain reading on April 28 th, 2011 at 6 a.m.
66 44 Since there is a slight difference between the reference date for the instrumentation data and for the surveying data, to compare instrumentation data and surveying data, the difference between the reference positions of the two data sets had to be taken into account. Equation 6.3 presents the proper conversion. Effectively, equation 6.3 aligns the reference date of the survey data and the instrumentation data when they are displayed together. L s = L s + L avg (6.3) where, L s = adjusted surveying total bridge expansion referenced to April 28 th, 2010 at 6 a.m., L s = surveying total bridge expansion at the time of the survey on April 28 th, 2011; and L avg = average bridge expansion computed via instrumentation data during the surveying time interval Effective Temperature and Effective Alpha Since concrete and steel expand and contract at differing rates, it was necessary to formulate an effective coefficient of thermal expansion, α eff, to simulate the composite behavior of the bridge. In this section, the following variables will be utilized. α eff = effective thermal expansion coefficient of combined steel and concrete, A c = area of concrete, A s = area of the steel, E c = linear elastic modulus of concrete, E s = linear elastic modulus of steel, α c = thermal expansion coefficient of concrete, α s =thermal expansion coefficient of steel, L c = length of the concrete member, and ΔT c = change in temperature of the concrete member, L s = length of the steel member,
67 45 ΔT s = change in temperature of the steel member, ΔT eff = effective bridge temperature, P s = applied unit load on steel, P c = applied unit load on concrete, P = applied load on composite section, δ s = displacement of steel, δ c = displacement of concrete, and δ = displacement of composite section. Equation 6.4 has been used in previous studies and will be used herein to represent the effective thermal expansion (Abendroth 2005). ( ) ( ) (6.4) To describe the temperature of the entire bridge, an effective temperature, T eff, was derived. Figure 6.1 displays a rectangular concrete member with an axial tension load, P c, and the resulting displacement, δ c. δ c Concrete P c Figure 6.1. Concrete memeber Equation 6.5 is the governing equation that combines the change in length due to the applied load and due to a change in temperature of the concrete member. (6.5)
68 46 Figure 6.2 displays a rectangular steel member with an axial tension load, P s, and the resulting displacement, δ s. δ s Steel P s Figure 6.2. Steel member Equation 6.6 is the governing equation that combines the change in length due to applied load and due to a change in temperature of the steel member. (6.6) Next in a perfectly composite element, it is assumed that the change in lenght of the concrete member, δ c, is equal to the change in lenght of the steel member, δ s, and the length of both members, L c and L s, are also equal to L. Figure 6.3 displays a composite concrete and steel rectangular member with an axial tension, P, and a resulting change in length, δ. δ Concrete Steel P Figure 6.3. Composite concrete and steel member Considering the assumptions stated in the previous paragraphs and Equations 6.5 and 6.6 and the equation for the effective thermal expansion coefficient for combined steel and concrete (Equation 6.4). An effective bridge temperature can be derived as follows:
69 47 1. Since δ = δ s = δ c and L = L s = L c a. ( ) ( ) 2. If P c + P s = P and P = 0 for free expansion a. Then P s = -P c b. And ( ) ( ) c. Re-arranging like terms ( ) d. Lastly ( ) 3. Substitute equation from step 2d into eq. 6.5 a. ( ( ) ( ) ) b. ( ( ) ( ) ) c. ( ( ) ( ) ) By simplifying step 3c one last time equation 6.7 results. Equation 6.7 gives the free change in length of the combined concrete and steel member under a uniform temperature change. ( ) (6.7) In a similar manner: ( ) ( ) (6.8) Substituting equations 6.4 and 6.7 into equation 6.8 produces the final equation for the effective bridge temperature, ΔT eff.
70 48 ( ) ( ) (6.9) Utilizing the temperatures measured from each of the strain gauges, and from the temperatures gauges embedded in the concrete, an effective temperature could be calculated when all measurements were taken Temperature Correction for Long Range Distance Meters (LRDM) Internal Correction Temperature ranges greater than 50 Fahrenheit impact a LRDM s displacement reading (Geokon 2009). Given the expected operational temperature ranges, it was necessary to apply a temperature correction to the results. Equation 6.10 is the controlling formula for making such corrections. D corrected = D uncorrected +K(T i -T 0 )G (6.10) where, ΔD uncorrected = reading, in inches, before a temperature correction, K = a temperature correction coefficient given by the manufacturer (digits/ C), and G = correction factor that converts digits to inches (provided by manufacturer). ΔD uncorrected, and K are calculated by the following equations: D uncorrected = D i D 0 (6.11) K = MR i + B (6.12) where, D 0 = initial reading, D i = reading at time i, M and B = constants for the model 1127 gauges given by the manufacturer, and R i = the frequency reading produced by the gauge when the vibrating wire is plucked.
71 49 To calculate R i it is necessary to use equation The quadratic formula is then solved to calculate the values of R i. where, D i = AR i 2 + BR i + C (6.13) A, B, and C = gauge specific constants given by manufacturer. External Correction An external temperature correction was applied to the cable connected to the LRDMs. Specifically, as the cable s temperature rose above the initial temperature the cable would naturally lengthen. As a result, the measured value would be smaller than actual. Similarly, as the cable s temperature lowered below the initial temperature the cable would naturally shorten. As a result, the measured displacement would be greater than actual displacment. Equation 6.14 shows the appropriate correction that is applied. ΔD cable = α cable ΔT air L cable (6.14) where, ΔD cable = the correction, α cable = the coefficient of thermal expansion of the cable, ΔT air = the ambient air temperature, and L cable = the length the cable.
72 MEMBER STRAINS AND FORCES As mentioned previously, five of the six bridges in the study were instrumented with strain gauges. The data collected from these strain gauges were used to calculate the internal strains and forces induced in each bridge due to ambient temperature changes. Member strains are induced as a result of restraining temperature induced expansion and contraction of a bridge Superstructure Girder Resolved Strains and Forces As discussed previously, a girder coordinate system was established and the important girder section properties calculated. Figure 6.4 depicts the forces considered in analysis of the composite section. The forces were chosen to align with AASHTO s codified approach for calculating lateral forces due to live loading (AASHTO 4-3). Referencing Figure 6.4, the following describes each of the external forces induced on each girder, measured by each strain sensor, and then resolved using the subsequently described process: P represents the axial force induced on the entire cross-section; tension is positive. M x represents strong axis bending of the entire cross-section, M x is positive when the top flange is in compression. M lt and M lb represent lateral bending of the top and bottom flange, respectively; as is considered in AASHTO, tension in the flange tip on the outside of the curve is considered positive. According to AASHTO: (1) flange lateral bending is the bending of a flange about an axis perpendicular to the flange plane due to lateral loads applied to the flange and/or nonuniform torsion in the member (AASHTO 4-3), (2) flange lateral bending stress is the normal stress caused by flange lateral bending (AASHTO 4-3), and (3) lateral moment, M l, is the total moment about the Y-axis in the top and bottom flange and replaces combined weak axis bending plus torsional warping. For reference Equation 6.15 can be found in the AASHTO Bridge Design Guidelines (Eq. C b-1), and is used to calculate the Lateral Moment a girder cross-section due to live loading (Note: current AASHTO specifications contain no codified approach for calculating temperature induced loadings):
73 51 (6.15) where, M x = major axis bending, L = length of the member, N = a constant of either 10 or 12 (engineer s discretion), R = the radius of the girder, and D = the depth of the web. Mlt 2 1 Mx x-axis P NA d ӯ 3 4 y-axis Mlb Center of Curvature Figure 6.4. Resolved girder forces Utilizing the four measured strains at each girder cross section and the specific girder cross sectional properties, one is able to calculate the four resolved girder forces described
74 52 previously. Figure 6.5 displays a set of matrices that describe the relationship between the four known internal strains at the strain gauge locations and the four desired internal strains. ( ) [ ] ( ) { } { } Figure 6.5. Four equations and four unknowns where, ε i = strain reading at gauge i, x i = distance from neutral axis to strain gauge i along the X-axis, and y i = distance from neutral axis to strain gauge i along the Y-axis. The relationship between internal axial strain and internal axial force is described by equation The relationship between major axis bending strain and major axis bending moment is described by equation The relationship between lateral bending strain and lateral bending moment in the top and bottom flange in represented by equations 6.18 and ( ) (6.16) where, ε a = internal axial strain, and P = the internal axial force.
75 53 ( ) (6.17) where, ε x = strong axis bending strain, and M x = strong axis bending moment. (6.18) where, ε ylt = lateral bending strain in the top flange, and M lt = lateral bending moment in the top flange. (6.19) where, ε ylb = lateral bending strain in the bottom flange, and M lb = lateral bending moment in the bottom flange. Typical Girder Strain Data at Gauge vs. Time Figure 6.6 through Figure 6.9 illustrate typical girder strain gauge data versus date. Each of the figures represents a specific composite girder flange location and the illustrations represent data from the center span of Girder D on Bridge 309. Figures 6.6 through 6.9 show a strain change that cycle daily and annually. Generally speaking the daily cycle range is small compared to the annual cycle range. The bottom flange strains show a larger cycle range in both daily and annual cycles, and the bottom flange data shows more scatter than the top flange data.
76 Microstrain Microstrain /17/11 3/8/11 4/27/11 6/16/11 8/5/11 9/24/11 11/13/ Date Figure 6.6. Bottom flange east strain gauge reading /17/11 3/8/11 4/27/11 6/16/11 8/5/11 9/24/11 11/13/ Date Figure 6.7. Top flange east strain gauge reading
77 Microstrain Microstrain /17/11 3/8/11 4/27/11 6/16/11 8/5/11 9/24/11 11/13/ Date Figure 6.8. Top flange west strain gauge reading /17/11 3/8/11 4/27/11 6/16/11 8/5/11 9/24/11 11/13/ Date Figure 6.9. Bottom flange west strain gauge reading
78 Microstrain 56 Typical Girder Strains vs. Time Figure 6.10 though Figure 6.13 show the internal girder strain measurements versus time for the four calculated strains at the center span of Girder D of Bridge 309. Figure 6.10 shows internal axial strain versus time, Figure 6.11 shows strong axis bending strain versus time, Figure 6.12 shows top flange lateral bending versus time, and Figure 6.13 shows bottom flange lateral bending versus time. In each figure, the light grey data shows the strain from the life of the project and the black data with white highlights shows the daily strain cycle from specific days of the project. The data denoted by squares represent a low temperature day, the data denoted by circles represent a moderate temperature day, and the data denoted by the triangles represent a high temperature day. Figure 6.9 through 6.13 show a daily and annual cycle when compared with the date. The annual cycle range is larger than the daily cycle range for axial strain. In the case of major axis bending and lateral flange bending in both the top and bottom flanges the daily cycle range is comparable to the annual cycle range /7/11 2/26/11 4/17/11 6/6/11 7/26/11 9/14/11 11/3/11 12/23/ pm to 6 am pm to 6am pm to 6am Date Figure Axial strain vs. time
79 Microstrain Microstrain /07/11 02/26/11 04/17/11 06/06/11 07/26/11 09/14/11 11/03/11 12/23/ pm to 6 am pm to 6am pm to 6am Date Figure Major axis bending vs. time pm to 6 am pm to 6am pm to 6am /07/ /26/11 04/17/11 06/06/11 07/26/11 09/14/11 11/03/11 12/23/ Date Figure Top flange lateral bending vs. time
80 Mixrostrain /7/11-5 2/26/11 4/17/11 6/6/11 7/26/11 9/14/11 11/3/11 12/23/ pm to 6 am pm to 6am pm to 6am Date Figure Bottom flange lateral bending vs. time Typical Girder Strains vs. Teff Figure 6.14 though Figure 6.17 show the internal girder strain measurements versus the effective bridge temperature for the four calculated strains at the center span of Girder D of Bridge 309. Figure 6.14 shows internal axial strain versus effective bridge temperature, Figure 6.15 shows strong axis bending strain versus effective bridge temperature, Figure 6.16 shows top flange lateral bending versus effective bridge temperature, and Figure 6.17 shows bottom flange lateral bending versus effective bridge temperature. In each figure, the light grey data shows the strain for the entire effective bridge temperature range, and the black data with white highlights shows the strain for an effective bridge temperature for single days. As with the previous figures, the data denoted by squares represent a low temperature day, the data denoted by circles represent a moderate temperature day, and the data denoted by the triangles represent a high temperature day.
81 Microstrain Microstrain pm to 6 am pm to 6am pm to 6am T eff ( F) Figure Axial strain vs. T eff pm to 6 am pm to 6am pm to 6am T eff ( F) Figure Major axis bending vs. T eff
82 Microstrain Microstrain pm to 6 am pm to 6am pm to 6am T eff ( F) Figure Top flange lateral bending vs. T eff pm to 6 am pm to 6am pm to 6am T eff ( F) Figure Bottom flange lateral bending vs. T eff Each of the internal strains have different relationships with temperature. Axial strain exhibits a generally linear relationship with the daily and annual effective bridge temperature
83 61 cycles, and the daily range for axial strain is small compared to the annual range for axial strain. The relationship between strong axis bending strain and the annual effective temperature cycle is very difficult to describe. However, the daily range for strong axis bending strain is comparable to the annual range and displays a consistent, non-linear, relationship. Top and bottom flange lateral bending strain display a smaller daily and annual strain range compared to axial and strong axis bending strains. Top flange lateral bending strain is consistently between 5 and -5 microstrain but with no obvious relationship with temperature. Bottom flange lateral bending strain shows a somewhat linearal relationship with daily effective temperature cycles, the range of which is proportion to annual effective temperature cycles. Girder Strain and Force Range For further data analysis, the research team determined a strain range experienced at each location over an equivalent temperature change. Over the course of a year, each location experiences a change in T eff of approximately 100 F. For each strain type the range was determined similar to the results displayed in Figure In this way, the dashed lines represent the strain range over an annual effective temperature cycle. Note that this process was completed with some level of judgment involved and in many cases the upper and lower bounds did not necessarily capture all data points. Once the strain range for each internal strain was determined, the ranges were tabulated and summarized based on strain type, bridge, and span location. Table 6.1 shows the values collected for outside girder, Girder A, for each bridge. Table 6.2 shows the values collected for the inside girder, Girder D, for each bridge. All values displayed are in microstrain. Once the internal strain ranges were tabulated the internal force ranges were calculated by substituting values from Table 6.1 and Table 6.2 into equations Table 6.3 and Table 6.4 display the calculated values based on force type, bridge, and span location, for their respective girder. After the internal strain and force ranges were tabulated, the values were represented alongside their respective locations on representations of the bridges. For ease of interpretation Bridge 309 and Bridge 2308 were placed on the same graphic and Bridge 209 and Bridge 2208 were similarly compared due to their similar geometries. From the
84 Microstrain 62 illustration, the research team made observations about the nature of the results with respect to bridge configuration T eff ( F) Figure Strain range calculation axial strain example Table 6.1. Strain Range Girder A Bridge # S span C span N span Avg. ε a = P/(AE) eff 109 NA 180 NA ε x = M x y 3 /(EI x ) eff 109 NA 70 NA ε lt = M lt x 1 /E s I yt 109 NA 60 NA NA ε lb = M lb x 3 /E s I yb 109 NA NA NA NA 209 NA 20 NA NA NA NA 20 20
85 63 Bridge # S span C span N span Avg NA 20 Table 6.2. Strain range Girder D Bridge # S span C span N span Avg. ε a = P/(AE) eff 109 NA 180 NA ε x = M x y 3 /(EI x ) eff 109 NA 70 NA ε lt = M lt x 1 /E s I yt 109 NA 40 NA ε lb = M lb x 3 /E s I yb 109 NA 10 NA NA NA Table 6.3. Force Range Girder A Bridge # S span C span N span Average P = ε a (AE) eff 109 NA 666 NA M x = ε x (EI x ) eff /y NA 2580 NA M lt = ε lt E s I yt /x NA 64 NA NA M lb = ε lb E s I yb /x NA NA NA NA 209 NA 64 NA NA NA NA 52 51
86 64 Bridge # S span C span N span Average NA 39 Table 6.4. Force range Girder D Bridge # S span C span N span Average P = ε a (AE) eff 109 NA 666 NA M x = ε x (EI x ) eff /y NA 2580 NA M lt = ε lt E s I yt /x NA 42 NA M lb = ε lb E s I yb /x NA 12 NA NA NA Figure 6.19 through Figure 6.30 display the internal strains for the four curved and the one straight bridge that has electronic instrumentation mounted to their girder flanges. In the figures, north is to the right with respect to Bridge 309 and Bridge 209. North is to the left with respect to Bridge 2308 and Bridge All values are in microstrain. Figures 6.19 through 6.21 show the measured internal axial strains, ε a, for each of the five bridges. The results for each of the measured locations are roughly the same ( µε). The strain values are somewhat larger for semi-integral abutments and the center span strain is somewhat greater when between two fixed piers. Figure 6.22 through 6.24 show the measured internal strong axis bending strains, ε x, for each of the five bridges. The results for most measured locations all fall in the range of 60 to 90 microstrain. The measured results at the center span of the horizontally curved bridges are typically very close to the measured results at the center span of the straight bridge.
87 65 170:80 FP 160:150 FP 170:130 IAB: SIAB Avg 165: : : :190 Figure Axial strain range Bridge 309:2308 IAB: SIAB 120:150 EP 85:155 EP 70:150 IAB: SIAB Avg 103:169 80: : :180 IAB: SIAB 1 Figure Axial strain range Bridge 209:2208 EP 180 FP IAB IAB Avg Figure Axial strain range Bridge :100 FP 40:60 FP 50:60 IAB: SIAB 80:35 70:100 80:60 IAB: SIAB Avg 62:69 Figure Strong axis bending strain range Bridge 309:2308
88 66 100:80 EP 80:80 FP 110:80 IAB: SIAB 80:110 70:20 90:90 IAB: SIAB Avg 88:77 Figure Strong axis bending strain range Bridge 209:2208 EP 70 FP IAB IAB Avg Figure Strong axis bending strain range Bridge 109 Figure 6.25 through 6.27 show the measured internal top flange lateral bending strain, ε lt, for each of the five bridges. The results from the measured values are all roughly equivalent (20 30 µε), with some outliers. There are no notable differences with respect to bridge radius or skew, and the results from the straight bridge are only slightly higher than the results from the horizontally curved bridges. 20:60 FP 15:10 FP 15:40 IAB: SIAB 30:70 10:20 40:15 IAB: SIAB Avg 22:36 Figure Lateral bending strain top flange range Bridge 309:2308
89 67 NA:100 EP 40:25 FP 10:25 IAB: SIAB Avg 19:26 10:50 20:10 15:20 Figure Lateral bending strain top flange Bridge 209:2208 IAB: SIAB EP 60 FP IAB IAB Avg Figure Lateral bending strain top flange Bridge 109 Figure 6.28 through 6.30 show the measured internal bottom flange lateral bending strain, ε lb, for each of the five bridges. The results from the measured values are similar to the results of top flange lateral bending strain; typically around 20 to 30 µε. As with top flange lateral bending, there are no notable differences between the straight and curved bridges and no notable difference with respect to bridge radius or skew. NA:NA FP NA:10 FP 15:30 IAB: SIAB Avg 21:33 15:60 30:90 25:NA IAB: SIAB Figure Lateral bending strain bottom flange Bridge 309:2308
90 68 20:NA EP NA:20 FP 20:NA IAB: SIAB 15:30 NA:35 120:10 IAB: SIAB Avg 18:24 Figure Lateral bending strain bottom flange Bridge 209:2208 EP NA FP IAB IAB Avg Figure Lateral bending strain bottom flange Bridge 109 Figure 6.31 through 6.42 show the calculated internal forces for the four curved and the one straight bridge that had strain gauge instrumentation on their girders. As with the internal strain figures, north is to the right with respect to Bridge 309 and Bridge 209, and north is to the left with respect to Bridge 2308 and Bridge Figure 6.31 through 6.33 show the internal axial force, P, for each of the five bridges. The results for the inside girder of bridge 109, the straight bridge, is lower than Bridge 309, 209 and 2308; and is higher than the results for the inside girder of Bridge The outside girder for Bridge 109 is close to Bridge 209, 309, and 2308; and is higher than the outside girder of Bridge All values in the figures are in kip. 690:300 FP 670:600 FP 690:500 IAB: SIAB Avg 660: : : :700 IAB: SIAB Figure Axial force range Bridge 309:2308
91 69 490:610 EP 340:620 EP 70:150 IAB: SIAB Avg 410: : : :710 Figure Axial force range Bridge 209:2208 IAB: SIAB EP 670 FP IAB IAB Avg Figure Axial force range Bridge 109 Figure 6.34 through 6.36 show the internal strong axis bending moment, M x, for each of the five bridges. With the exception of one span, the values at the center span of Bridge 309 and Bridge 2308, between two fixed piers, are higher than the center span values of the other bridges. The inside girder results of Bridge 109 are lower than the inside girder results of Bridge 309 and Bridge 2308 and are similar to the results of the inside girder results of Bridge 209 and Bridge The outside girder results are lower than the outside girder results of Bridge 209 and Bridge 2208, and are similar to the outside girder results of Bridge 309 and Bridge All values in the figures are in kip-in. Figure 6.37 through 6.42 shows the results of internal lateral flange bending moment in the top and bottom flanges. Since a number of gauges malfunctioned and their data had to be ignored, the results of lateral flange bending in both the top and bottom flanges were incomplete for all the bridges, which makes it hard to draw any solid conclusion. However, typically the results were larger in the bottom flanges, and the lateral flange bending moment was smaller in Bridge 109, the straight bridge, than in any of the horizontally curved bridges. All values in the figures are in kip-in.
92 :5900 FP 3300:4400 FP 3100:35000 IAB: SIAB Avg 4100: : :6000 Figure Strong axis moment range Bridge 309: :3000 IAB: SIAB 5800:4600 EP 5900:5900 FP 6300:4600 IAB: SIAB 4300: : :4900 IAB: SIAB Avg 5300:4500 Figure Strong axis moment range Bridge 209:2208 EP 4000 FP IAB IAB Avg Figure Strong axis bending moment range Bridge :92 FP 28:13 FP 32:62 IAB: SIAB 13:21 Avg 37:49 46:87 62:19 IAB: SIAB Figure Lateral bending moment top flange range Bridge 309:2308
93 71 NA:260 EP 53:33 FP 26:65 IAB: SIAB 43:21 13:66 32:43 Avg 33:45 Figure Lateral bending moment top flange Bridge 209:2208 IAB: SIAB EP 63 FP IAB IAB Avg Figure Lateral bending moment top flange Bridge 109 NA:NA FP NA:24 FP 32:53 IAB: SIAB Avg 44:50 26:74 73:140 44:NA IAB: SIAB Figure Lateral bending strain bottom flange Bridge 309: :NA EP NA:64 FP 50:NA IAB: SIAB Avg 45:59 32:64 NA:85 260:21 IAB: SIAB Figure Lateral bending strain bottom flange Bridge 209:2208
94 72 EP NA FP IAB IAB Avg 12 Figure Lateral bending strain bottom flange Bridge Substructure Pile Resolved Strains There are six piles cast into each abutment pile cap of Bridge 309. At the north abutment, the west most pile, outside the curve, was labeled NAHP1, and the labeling continued east with the east most pile, inside the curve, labeled NAHP6. At the south abutment, the west most pile, outside the curve, was labeled SAHP1, and the labeling continued east with the east most pile, inside the curve, labeled SAHP6. At each abutment of Bridge 309 piles HP1, HP4, and HP6 were instrumented with strain-gauges, the results of which are discussed in this section. As discussed previously, the coordinate system for each set of piling was established so that the positive X-axis was in the direction of outward expansion and the positive Y-axis was 90 degrees counter-clockwise from the X-axis. In both the north and south abutment piles, positive minor axis bending caused tension in the outside flange. The positive direction of the other strains was different between each abutment and was controlled by the equations used to calculate the strains. Figure 6.43(a) shows the pile coordinate system and the resultant strains of the south abutment piles. Figure 6.43(b) shows the pile coordinate system and the resultant strains of the north abutment piles. Using the sign conventions shown in Figure 6.43, the total internal strain at all four gage locations were used to calculate the four resultant strains in the south abutment instrumented piles. Equations 6.20 through 6.23 are the necessary equations to determine the resultant strains. Equation was used to determine the weak axis bending strain in the south abutment piles while Equation was used to determine the weak axis bending strain in the north abutment piles. The rest of the equations are relevant for the piles at either abutment.
95 73 ε y Y X ε t 3 2 ε a ε x ε t 2 ε a ε x X Y (a) south abutment ε y (b) north abutment Figure Abutment pile internal forces Δε a = ¼(ε 1 +ε 2 +ε 3 +ε 4 ) (6.20) Δε x = ¼(-ε 1 +ε 2 +ε 3 -ε 4 ) (6.21) Δε y = ¼(ε 1 +ε 2 -ε 3 -ε 4 ) (6.22.1) Δε y = ¼(-ε 1 -ε 2 +ε 3 +ε 4 ) (6.22.2) Δε t = ¼(-ε 1 +ε 2 -ε 3 +ε 4 ) (6.23) where, ε a = internal axial strain, ε x = internal strong axis bending strain, ε y = internal weak axis bending strain, and ε t = internal torsional-warping strain. Figures 6.44 through 6.47 show the typical results of internal strains versus effective bridge temperature. These results are from HP1 of the north abutment. The gray, background data in the figures are the total data over the length of the monitoring period. Three separate days of data are also displayed in the figures, separate from the total data. January 28 th, 2011, a cold day, is represented by triangles; April 28 th, 2011, a moderate day, is represented by
96 Microstrain 74 circles; and July 19 th, 2011, a hot day, is represented by squares. Figure 6.44 shows the typical internal axial strain in the piles. A solid description of a relationship between axial strain and effective temperature is hard to produce. The range due to the annual effective temperature cycle is large compared to the strain range due to the daily effective temperature cycle. Internal axial strain is small compared to strong axis bending and weak axis bending strain but is large compared to torsional-warping strain /28/2011 4/28/2011 7/19/2011 T eff Figure Typical internal axial strain Figure 6.45 shows the typical internal strong axis bending strain in the piles. The results show a strong linear relationship with effective bridge temperature. The range due to the annual effective temperature cycle is larger compared to the strain range due to the daily effective temperature cycle. The resulting strong axis bending strain range is larger than the internal axial strain and torsional-warping strain range but is small compared to the minor axis bending strain.
97 Microstrain /28/2011 4/28/2011 7/19/2011 T eff Figure Typical internal major axis bending strain Figure 6.46 shows the typical internal weak axis bending strain in the piles. As expected, the weak axis bending strain range is much large than the range of any other measured internal strain. The results show a strong linear relationship with effective bridge temperature. The range due to the annual effective temperature cycle is large compared to the strain range due to the daily effective temperature cycle. Figure 6.47 shows the typical internal torsional-warping strain in the piles. Typically the data tends to hover around a value of zero microstrain. There is no solid relationship between the strain and the effective bridge temperature, and the ranges due to the annual effective temperature cycle and the daily effective temperature cycle are both minimal. As was done with the measured internal girder strain, the measured internal strain ranges at each instrumented pile location were found and tabulated for comparison. Table 6.5 shows the measured pile internal strain ranges.
98 Microstrain 76 Table 6.5. Measured pile internal strain ranges Pile/Strain NH1 NH4 NH6 SH1 SH4 SH6 ε a (µε) ε x (µε) ε y (µε) ε t (µε) NA NA 20 The internal weak axis bending strain showed larger ranges than the other three strains in all six monitored piles with an average of 751 microstrain. The internal strong axis bending strain showed the next largest strain ranges in all six monitored piles with an average of 198 microstrain. The average internal axial strain range of all six piles was 83 microstrain. The smallest of all four strains was the torsional-warping strain with an average of 39 microstrain for the four piles with available results /28/2011 4/28/2011 7/19/ T eff Figure Typical internal minor axis bending strain
99 Microstrain /28/2011 4/28/2011 7/19/ Figure Typical internal torsional-warping strain Using the cross-sectional properties of the HP 10x57 abutment piles and the measured pile internal strain range, the pile internal force ranges were calculated. Table 6.6 shows the calculated values. In the table axial load, P, strong axis bending, Mx, and weak axis bending, My, were calculated using familiar strength of materials equations. The lateral bending moment, Mf, is a lesser known quantity and was calculated using the following equation from Salmon, et al (2009): T eff (6.24) where, f bw = tension or compression stress due to warping of the cross-section E s = modulus elasticity of the steel M f = lateral bending moment acting on the flanges x = distance from center of flange to flange tip I f = moment of inertia of a flange about its smaller principal axis
100 78 Table 6.6. Calculated pile internal force ranges Pile/Force NH1 NH4 NH6 SH1 SH4 SH6 P(kips) M x (kip-in.) M y (kip-in.) M f (kip-in.) NA NA 5 As shown in Table 6.6, axial load in the South abutment is typically higher than axial load in the North abutment, although both abutments show similar values. Generally minor axis bending is larger than major axis bending in all instrumented piles in both the North and South abutments, and lateral flange bending, where data are available, is very small compared to all other measured forces. Abutment Backwall Pressure The soil pressure on the abutment backwalls of Bridge 309 increases as the bridge expands into the backfill soil. This condition is called passive soil pressure (Coduto 2001) and was measured by the pressure cells mounted to the abutment backwalls. If the soil conditions in the abutment backfill are known, the maximum passive soil pressures can be approximated using the following equations: (6.25) K p = tan 2 (45 +ϕ /2) (6.26) σ z = ɣ Z (6.27) where, Kp = the coefficient of passive lateral earth pressure (psi/psi), σ x = effective horizontal stress (psi), σ z = effective vertical stress (psi), ϕ = effective friction angle of the soil (degree)
101 79 ɣ = buoyant unit weight of soil (lb/in. 3 ), and Z = depth from top of soil to location of desired stress (in.) By making a few assumptions on the backfill soil properties the research team was able to approximate the range of passive soil stress on the north and south abutments of Bridge 309. The approximation was calculated at the depth of the pressure cells. According to the bridge plan set, the backfill soil consists of A-6 soil type, a clayey soil with >35% passing the 0.075mm sieve (ASTM D3283). Considering the soil classification, the following assumptions were made following recommendations by Coduto 2011: ϕ 30 40, and ɣ pcf By substituting the assumptions for ϕ and ɣ into Equation 6.25 through 6.27 the research team was able to calculate an approximate range between psi for passive stress on the abutment backwalls at the depth of the pressure cells for Bridge 309. Figures 6.48 through 6.51 show the external stress on the north and south abutment pressure cells attached to Bridge 309, respectively. As expected, the stresses increase as the temperature increases and drops to zero at lower temperatures. According to the figure, over the life of the monitoring period of the project the north abutment experience higher stresses. Also shown in the figure are the upper-bound and lower-bound approximations of passive pressure, denoted by dashed horizontal lines. Figure 6.48 shows the external stress on the north-west abutment pressure cell on Bridge 309 versus the effective temperature of the bridge. The north-west corner of the bridge is outside of the horizontal curve and is on the side of the bridge that is elongated due to skew. Figure 6.49 shows the external stress on the north-east abutment pressure cell on Bridge 309 versus the effective temperature of the bridge. The north-east corner of the bridge is on the inside of the horizontal curve and is on the side of the bridge that is shortened due to skew. The measured passive stress range was the greatest at this location, compared to the other three locations.
102 Stress (psi) Stress (psi) T eff ( F) Figure North-west abutment backwall pressure vs. effective temperature T eff ( F) Figure North-east abutment backwall pressure vs. effective temperature
103 Stress (psi) 81 Figure 6.50 shows the external stress on the south-west abutment pressure cell on Bridge 309 versus the effective temperature of the bridge. The south-west corner of the bridge is on the outside of the horizontal curve and is on the side of the bridge that is shortened due to the skew T eff ( F) Figure South-west abutment backwall pressure vs. effective temperature Figure 6.51 shows the external stress on the south-east abutment pressure cell on Bridge 309 versus the effective temperature of the bridge. The south-east corner of the bridge is on the inside of the horizontal curve and is on the side of the bridge that is elongated due to the skew. During the monitoring period of the project a critical hardware component had to be replaced. As a result, six months of data from the south end of Bridge 309 was considered untrustworthy and had to be disregarded. Losing this period of data could have influenced the stress ranges measured and could be a reason for higher stress ranges in the north abutment. From the pressure cell results, an estimation of the axial stresses in the girders due to soil pressure was calculated, with the purpose of checking the values obtained from the strain gauges. If the soil behind each abutment was assumed to be homogenous and the stress
104 Stress (psi) 82 distribution increases linearly from zero at the surface downward as shown in Figure Soil pressure ranges from the pressure cells, mounted 10 in. below the abutment corbel, were observed over a 100 F range. The measured pressure range for the soil pressure at the bottom of the pile cap was then found by Equation 6.28 (6.28) where, L max = the total height of each abutment, L gauge = the distance from the top of the abutment to the pressure cells, P gauge = the maximum stress measured at the location of pressure cells, and P max = the approximated maximum stress at the bottom of the abutment T eff ( F) Figure South-east abutment backwall pressure vs. effective temperature
105 83 L gauge p gauge L max p max Figure Assumed backfill passive stress distribution Since the measured values of p gauge were different for the east and west pressure cells of each abutment, the calculated values of p max were inconsistent. Therefore, for each abutment an average pressure, p avg, was calculated from the two corresponding values of p max and was assumed constant across the length of the abutment backwall. For each abutment a total passive force (kips) applied to the respective abutment backwall was calculated by P total = (1/2)L max p avg B abutment (6.29) where, P total = the total approximate force applied to each abutment, and B abutment = width of the abutment It was assumed the total force was distributed evenly among each of the four girders, from which a single girder force, P pergirder, could be calculated. Table 6.7 shows the results of the approximation.
106 84 Table 6.7. Approximation of girder axial force from abutment backwall pressure NAPRW (GA) NAPRE (GD) SAPRW (GA) SAPRE (GD) P approx. (kip) P measured (kip)* The discrepancy between the measured and calculated axial forces can be explained by other restraining forces, such as forces from the piers, piles, and pavement Superstructure Displacement 6.3 MEASURED DISPLACEMENTS Coordinate Systems and Coordinate Transformations The raw survey data for each bridge were initially transformed into global bridge coordinates X and Y, as described previously. To make the raw data useful, the research team transformed the data into local coordinate systems. Figure 6.53 shows both of the local coordinate systems and the global coordinate system. Each abutment and pier has two Cartesian coordinate systems that originate at their respective interior reflector. The first of the two local coordinate systems is aligned with the skew of the abutments and piers. The x- axis of the first system is related to the abutment/pier geometry. The y-axis is 90 degrees counter-clockwise to the x-axis. Displacements for these systems are labeled u, x-axis displacement, and v, y-axis displacement. The second of the two local coordinate systems is related to the bridge radius. The r-axis is aligned with the radial line passing through the same origin. The t-axis is the 90 degrees counter-clockwise of the r-axis and runs tangent to the bridge s horizontal curve. Displacements for the radial system are labeled u, r-axis displacement, and v, t-axis displacement.
107 y,v x,u r,u ' 85 x,u r,u ' x,u r,u ' r,u ' x,u P 0 6 y,v P 0 7 y,v P P 0 5 y,v t,v ' t,v ' P P 0 1 t,v ' t,v ' P P B M 1 Y,V B M 2 X,U B M 3 Figure Local abutment and pier coordinate systems Bridge 309 Benchmark Three Movements The surveying results rely upon the assumption that the benchmarks remain stationary throughout the length of the project and their location can be accurately measured with a total station. Figure 6.54 shows the average location of benchmark three for Bridge 309, as measured by the monthly surveys, for each month a survey was conducted. Each month is represented by a circle and is labeled accordingly. The figure shows that there are errors in either the assumption that the benchmark remains stationary or that its location can be accurately measured during each survey. In general, most of the months are within roughly 0.3in. of each other. Two outliers, August 2011 and November 2011, are roughly 0.6 in apart. Total Change in Length Throughout the project each bridge at the NEMM was surveyed each month. From these data the research team was able to track the length changes of each bridge. The total change in length for each bridge was calculated from the displacements in the t-axis direction, v, at both abutments. Figures 6.55 through 6.60 show the change in length of bridges 109, 209, 309, 2208, 2308, and 2408 versus effective bridge temperature. In each of the figures, each survey month is represented by a rectangle where the vertical sides of the rectangle represent the 95% confidence interval of the results and the horizontal sides of the rectangle represent the change in effective temperature during the time of the survey. The solid diagonal line
108 86 represents the change in length based on free expansion and contraction of the bridge, and the dashed diagonal line represents the best fit line from the survey results. The horizontal solid and dashed lines represent the range of the change in length of theoretical free expansion and measured expansion of the bridge, respectively. These ranges can also be considered the total change in length of the bridges during the project. Figure 6.55 shows the measured values of the change bridge length versus the effective temperature for Bridge 109, a straight integral abutment bridge with two fixed piers. The best fit line of the surveying results shows a linear relationship between the change in length and the effective temperature of the bridge that is similar to that of the theoretical free expansion line. Figure 6.56 shows the total change in length of Bridge 209, a semi-integral abutment bridge with a fixed and expansion pier, as calculated by the surveying as well as by expansion meters mounted on each abutment. The movements measured by the expansion meters record a plateauing at both ends of the temperature spectrum, something the research team was unable to explain. Figure 6.57 shows the total change in length measurements of Bridge 309 measured by the monthly survey as well as by long range distance meters mounted at each abutment and pier. Bridge 309 is an integral abutment bridge with two fixed piers. For the most part, the measured results from the survey data and from the long range distance meters correspond to one another and both show a linear relationship between the change in length of the bridge and the effective temperature of the bridge. Figure 6.58 shows the total change in length versus effective bridge temperature for Bridge 2208, an integral abutment bridge with a fixed and expansion pier. The best fit of the survey line and the theoretical free expansion line produce very close results, suggesting less expansion restraint at this bridge.
109 87 A u g -1 1 N o v -1 0 S e p t-1 1 D e c -1 0 F e b -1 1 O c t-1 1 J a n -1A1 u g -1 0 J u ly in. J u ly -1 0 A p r-1 1 a r-1 1 M a y -1 1 J u n e -1 1 N o v -1 1 Figure Bridge 309 Benchmark three movements
110 Change in Length (in.) Change in Length (in.) Lfree Linear ( Lmeasured) T eff ( F) Figure Total change in length Bridge Dmeasured Linear ( Dfree) T eff ( F) Figure Total change in length Bridge 209
111 Change in Length (in.) Change in Length (in.) Dfree Linear ( Dmeasured) T eff ( F) Figure Total change in length Bridge Dfree T eff ( F) Linear ( Dmeasured) Figure Total change in length Bridge 2208 Figure 6.59 displays the total change in length of Bridge 2308 by surveying and expansion meter measurements. As with bridge 209, the expansion meters plateau at high and low temperatures. Bridge 2308 is a semi-integral abutment bridge with two fixed piers.
112 Change in Length, (in.) Dfree Linear ( Dmeasured) T eff ( F) Figure Total change in length Bridge 2308 Figure 6.60 shows the total change in length of Bridge 2408 versus the effective bridge temperature. As with Bridge 109, Bridge 2408 is a straight bridge with integral abutments and two fixed piers. The results from each figure were tabulated for comparison. Table 6.8 shows the total free expansion change in length, L free, and the total measured change in length, L measured, for each bridge. An axial strain as a result of expansion resistance was calculated from the difference between these two lines by Equation 6.30: ε r = ( L free - L measured )/L (6.30) where, ε r = resistance axial strain, and L = length of bridge along curve.
113 Change in Length (in.) Dfree T eff ( F) Linear ( Dmeasured) Figure Total change in length Bridge 2408 Table 6.8. Total free expansion and measured change in length Bridge/Range L free L measured Table 6.9 shows the results from Equation 6.33 as well as the average axial strain in the respective bridge from the strain gauge data. Table 6.9. Calculated average axial strain vs. measured average axial strain Bridge/Strain ε r (με) ε a (με) NA The resistance axial strain, ε r, is similar to the strain-gauge measured axial strain, ε a, for Bridges 109, 309, and The resistance axial strain for Bridges 209 and 2208 are much lower than the strain-gauge measured axial strain, and no comparison can be made for Bridge 2408 as there is no strain-gauge data. Total Change in Span Length From the survey data, the change in span length was calculated from displacements along
114 92 the respective t-axis at the abutments and piers, v. Figures 6.61 through 6.66 show the change in span length for Girder A and Girder D of each span of Bridges 109, 209, 309, 2208, 2308, and 2408, respectively. Also shown in the figures are the average of Girder A and Girder D for each span and the total average of all spans. SIAB Avg: FP 0.76 EP Figure Change in length per span Bridge 209 SIAB IAB FP FP IAB Avg: 0.46 Figure Change in length per span Bridge EP 0.74 FP 0.51 IAB IAB Avg: 0.56 Figure Change in length per span Bridge 2208
115 93 SIAB Avg: FP 0.66 FP Figure Change in length per span Bridge 2308 SIAB IAB 0.39 FP 0.73 FP IAB Avg: 0.47 Figure Change in length per span Bridge 109 IAB 0.38 FP 0.74 FP IAB Avg: 0.48 Figure Change in length per span Bridge 2408 As shown in Figure 6.60 through 6.66 the change in length of the center span is, as one might expect, largest for all bridges. With regard to the curved-girder bridges, Figure 6.60 through 6.64, the bridges with one fix pier and one expansion, Bridge 209 and 2208, show higher values in the change in length of the center span compared to the two bridges with both piers fixed, Bridge 309 and With regard to the two straight bridges, Bridge 109 and 2408, the change in length of both end spans and the center span were similar between
116 94 the bridges. Bridge Movements Month to Month The monthly reflector coordinates calculated from the survey data were input into a commercial drafting program. This allowed the research team to produce graphical images summarizing the bridge movements with time. Because the movements were very small compared to the geometry of the bridges, the drawings had to be scaled. In the following the scale is shown in its respective figure. Figures 6.67 through 6.72 display the location of the bridge, at the reflectors, for three months during the monitoring portion of the project life. The three months include February 2011, a cold month; April 2011, the reference month; and July 2011; a hot month. In the figures, the respective bridge is shortest during the cold month, at its longest during the hot month, and in the middle during the reference month. Figures 6.73 through 6.96 track the monthly location of the abutments and piers reflectors on each bridge during the monitoring period. The west and east reflectors at each abutment and pier are positioned next to each other. Also, the figures are ordered starting with the north abutment and end with the south abutment, for each bridge respectively. In general the reflector movements documented by Figures 6.73 through 6.96 show much larger longitudinal movements of the bridge superstructure compared to radial or transverse movements. As one might expect, the movement ranges of the superstructures near fixed piers are generally smaller than the movement ranges displayed near an expansion pier. The range of superstructure movements documented near IAB s and SIAB s show little difference between the two abutment configurations. Also, generally there is little noticeable difference between the movements in both the longitudinal and transverse direction of the two straight bridges and the four horizontal bridges when considering similar pier and abutment fixities. Effective Thermal Length One way to calculate longitudinal forces on piers from thermal expansion of girders is to establish a design length. The design length is the length of a girder whose expansion contributes to the development of forces on the pier. From here on, this report refers to this as the effective thermal length.
117 95 Table of the Iowa Dot s LRFD Bridge Design Manual specifies an effective thermal length based on abutment and pier fixity configuration. The table covers two- to four-span integral abutment bridges with expansion and fixed piers, and is used with bridges that do not have large variations in pier stiffness (Offices 2011). In this report, the research team used the survey data and Equation 6.31 to calculate an effective thermal length. (6.31) where, Leff = effective thermal length, Δd = range on longitudinal movement of fixed pier or integral abutment, and ΔT is a temperature range of 100 F. Table 6.10 shows the effective thermal length calculated by the research team as well as the effective thermal length given by the Iowa DOT. The Iowa DOT s values are in parentheses. Table Effective Thermal Length Bridge/Location S. Abut (ft) S. Pier (ft) N. Pier (ft) N. Abut (ft) Bearing IAB-EP-FP- IAB (74.5) 65 (74.5) 116 IAB-FP-FP- IAB IAB-EP-FP- IAB SIAB-FP-EP- SIAB (71) 46 (71) SIAB-FP-FP- SIAB IAB-FP-EP- IAB As shown in Table 6.10, the effective thermal length approximation proposed by the Iowa DOT results in higher effective thermal lengths. As a result, there is a level of conservatism built into their design. Also, the results of the approach taken by the research team results in values for end spans that are larger than the actual length of the corresponding
118 96 span. Fixed Pier Displacement The fixed pier of Bridge 109, the north pier, was instrumented with an expansion meter to measure the relative displacement between the bottom flange of Girder B and the pier cap. Figure 6.97 shows the displacement results from the expansion meter vs. effective bridge temperature. Figure 6.97 shows that there is little measurable relative displacement between the pier cap of the fixed pier and the bottom flange of Girder B. As a result, this figure helps to confirm pier fixity assumptions. Along with the relative displacement between the pier cap and the bottom flange of Girder B, the absolute displacement of the bottom flange of Girder B perpendicular to the pier was calculated using the survey data. Figure 6.98 shows the results of the absolute movement of Girder B from the survey. Combining the results of Figure 6.97 and Figure 6.98 implies that, although there is no relative movement between the pier cap and the bottom flange of Girder B, there is movement at the pier location. Thus, there must be flexure in the pier due to thermal girder movement induced forces. Expansion Pier Displacement The expansion pier of Bridge 209 and Bridge 2208 was instrumented with an expansion meter. This meter measured the relative displacement between the bottom flange of Girder B and the pier cap. Figure 6.99 shows the results of typical relative displacement of the expansion pier measured by the expansion meter and by the surveying results. Similar to the displacements measured by the expansion meters mounted on the semi-integral abutments, the expansion meters mounted on the expansion piers start to plateau at the effective bridge approaches the hot and cold extremes.
119 97 N o rth A b u tm e n t (IA ) N o rth P ie r (F P ) 1" 1" S o u th P ie r (E P ) S o u th A b u tm e n t(ia ) Figure Deflected shape Bridge 109
120 98 N o rth A b u tm e n t (S I) N o rth P ie r (E P ) 1" 1" S o u th P ie r (F P ) S o u th A b u tm e n t (S I) Figure Deflected shape Bridge 209
121 99 Figure Deflected shape Bridge 309
122 100 Figure Deflected shape Bridge 2208
123 101 N o rth A b u tm e n t (F P ) N o rth P ie r (F P ) 1" 1" S o u th P ie r (F P ) S o u th A b u tm e n t (S I) Figure Deflected shape Bridge 2308
124 102 N o rth A b u tm e n t (IA ) N o rth P ie r (E P ) 1" 1" S o u th P ie r (F P ) S o u th A b u tm e n t (IA ) Figure Deflected shape Bridge 2408


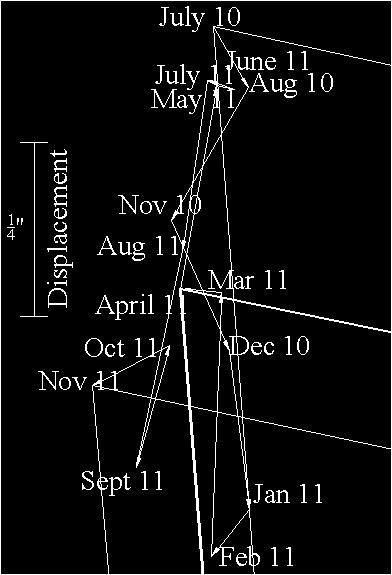
125 103 Figure Bridge 109 movements at north abutment west and east reflectors Figure Bridge 109 movement at north pier west and east reflectors


126 104 Figure Bridge 109 movement at south pier west and east reflectors Figure Bridge 109 Movement at south abutment west and east reflectors


127 105 Figure Bridge 209 movement at north abutment west and east reflectors Figure Bridge 209 movement at north pier west and east reflectors


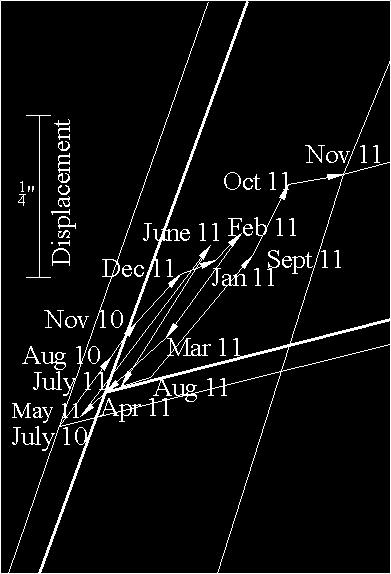

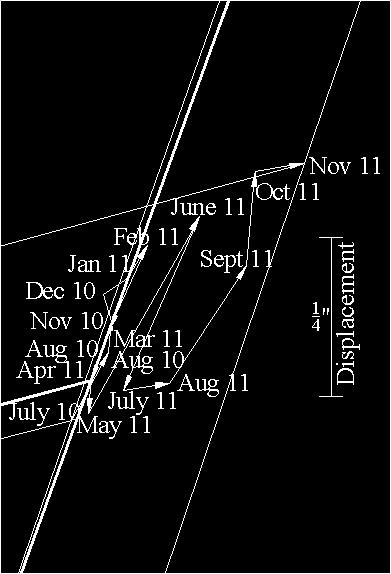
128 106 Figure Bridge 209 movement at south pier west and east reflectors Figure Bridge 209 movement at south abutment west and east reflectors


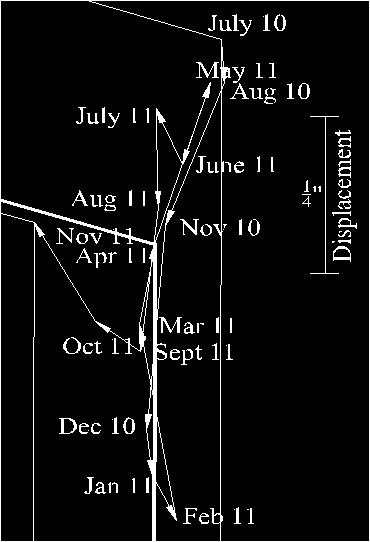
129 107 Figure Bridge 309 movement at north abutment west and east reflectors Figure Bridge 309 movement at north pier west and east reflectors


130 108 Figure Bridge 309 movement at south pier west and east reflectors Figure Bridge 309 movement at south abutment west and east reflectors


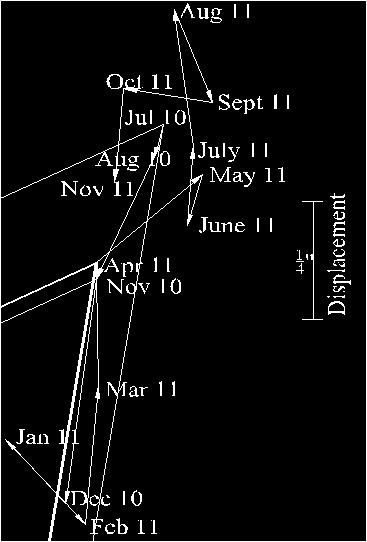
131 109 Figure Bridge 2208 movement at north abutment west and east reflectors Figure Bridge 2208 movement at north pier west and east reflectors


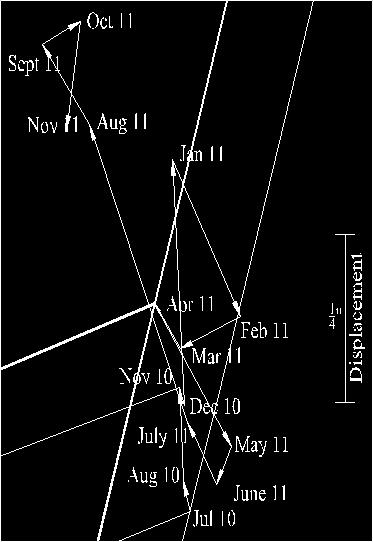
132 110 Figure Bridge 2208 movement at south pier west and east reflectors Figure Bridge 2208 movement at south abutment west and east reflectors


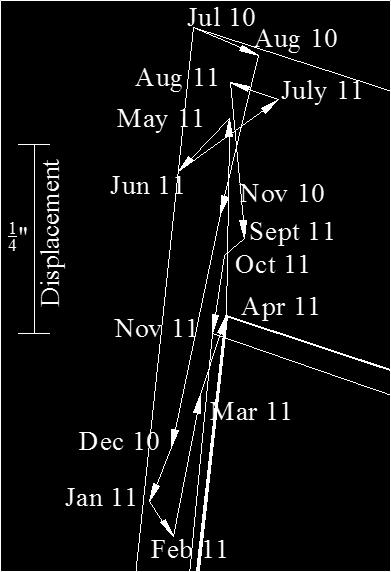
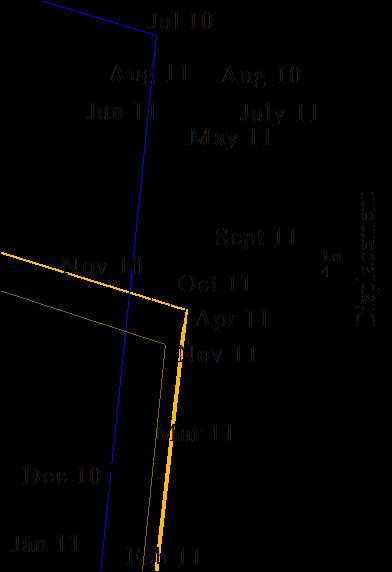
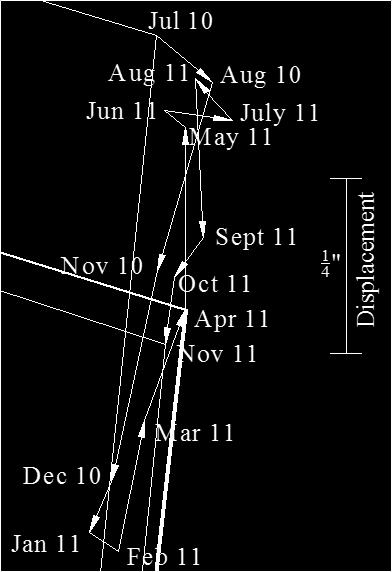
133 111 Figure Bridge 2308 movement at north abutment west and east reflectors Figure Bridge 2308 movement at north pier west and east reflectors


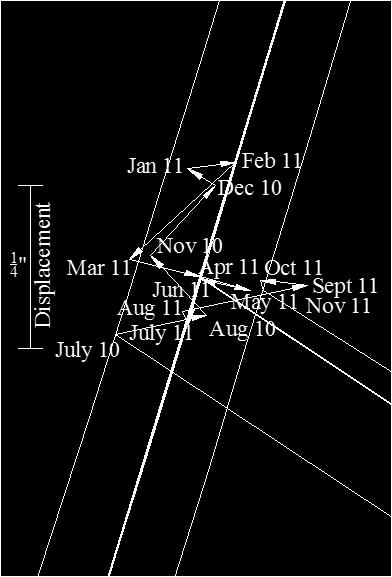
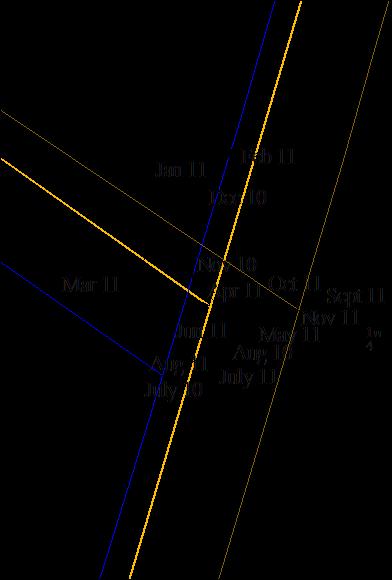
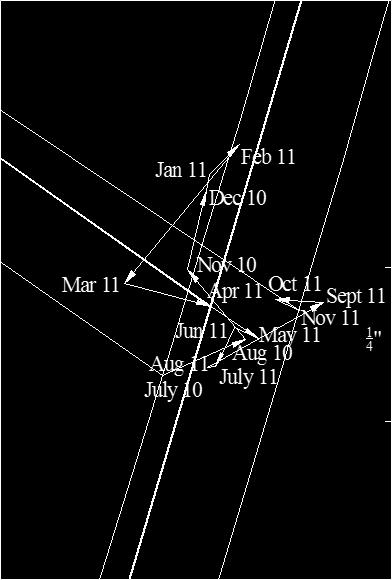
134 112 Figure Bridge 2308 movement at south pier west and east reflectors Figure Bridge 2308 movement at south abutment west and east reflectors


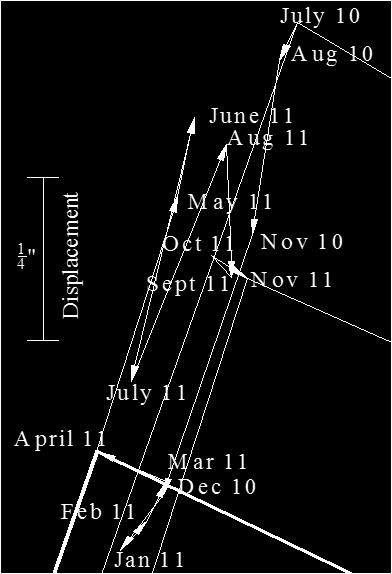
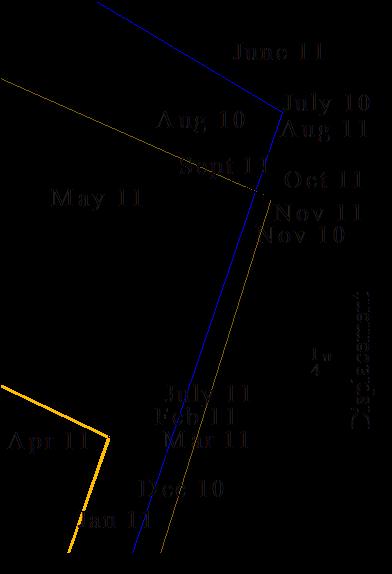
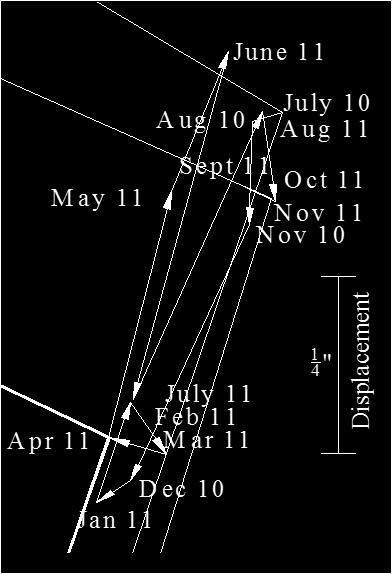
135 113 Figure Bridge 2408 movement at north abutment west and east reflectors Figure Bridge 2408 movement at north pier west and east reflectors


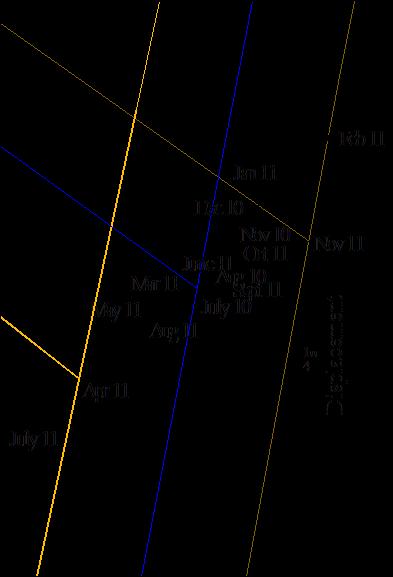
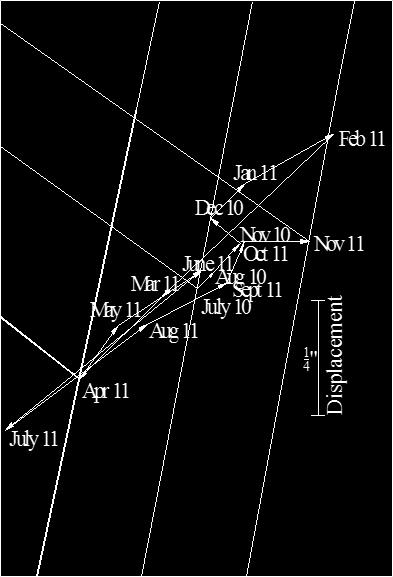
136 114 Figure Bridge 2408 movement at south pier west and east reflectors Figure Bridge 2408 movement at south abutment east and west reflectors
137 Displacement (in.) Displacement (in.) T eff Figure Bridge 109 relative displacement between fixed pier and Girder B T eff Figure Absolute movement of bottom flange of Girder B at north pier reflector
138 Displacmenet (in.) T eff ( F) Steel Pile Behavior Figure Expansion pier displacement Equivalent Cantilever Model The equivalent cantilever analytical model shown in Figure attempts to estimate the weak axis bending moment in an integral abutment steel pile (Abendroth 2005). In the model, the steel pile is idealized as an isolated column with an equivalent length, L, and rotationally fixed ends. Equation 6.32 describes the relationship between the applied displacement, Δ, and the resulting end moment, M. (6.32) Assuming a linear moment diagram for the pile because no intermediate forces exist, the end moment M can be calculated from Mg by Equation (6.33)
139 117 The relationship between weak axis bending moment at the location of the strain gauges, M g, and the weak axis bending strain at the location of the strain gauges, ε g, is given by Equation (6.34) By combining Equation 6.32 through 6.34, the weak axis bending strain at the location of the strain gauges can be expressed by Equation (6.35) M M M g L g L e M M g M Figure Equivalent cantilever pile model where, Δ = applied lateral end displacement, M = resulting end moment, M g = resulting moment at location of strain gauges L e = equivalent cantilever length, and Lg = distance between equivalent Mg moments
140 Microstrain 118 Pile Expansion Figures through show the weak axis bending strain versus displacement for the six instrumented piles of Bridge 309. The data in the figures come from the survey data and from the pile strain gauge data. Each rectangle in the figures represents a survey date. The horizontal sides of the rectangle represent the 95% confidence interval of pile displacement, at the top of the pile, for a given survey date. The vertical sides of the rectangle represent the change in the measured microstrain in the pile during the life of the respective survey, at the location of the strain gauge. The solid, diagonal lines represent the theoretical relationship between pile displacement and microstrain calculated using the analytical cantilever method. Based on the soil conditions shown in the bridge plan set and following the work of Abendroth and Greimannan equivalent cantilever length of 18 ft was calculated. From there, an approximate relationship between pile expansion and internal weak axis bending strain was plotted alongside the measured results. In each of the figures there are a couple survey months that show conflicting results with the rest of the data. One of the months has a very large confidence interval and two of the months show displacement without any resulting strain. These results have been unexplainable except for errors in the electronic and/or survey data Δx (in.) Figure Weak axis bending strain vs. displacement SAHP1
141 Microstrain Microstrain Δx (in.) Figure Weak axis bending strain vs. displacement SAHP Δx (in.) Figure Weak axis bending strain vs. displacement SAHP6
142 Microstrain Microstrain Δx (in.) Figure Weak axis bending strain vs. displacement NAHP Δx (in.) Figure Weak axis bending strain vs. displacement NAHP4
143 Microstrain Δx (in.) Figure Weak axis bending strain vs. displacement NAHP6 Based on the figures it appears that the analytical cantilever model was a better predictor of stress vs. displacement for the HP1 piles, the piles closest to the outside curve. The equivalent length was too large to accurately reflect the measured results of the HP4 and HP6 piles, at both abutments. The equivalent length is directly related to the pre-bored depth of each pile as well as the soil conditions surrounding the piles. As a result, there are a number of explanations as to why the equivalent length was artificially large, none of which the research team could definitely narrow down.
144 Microstrain 122 CHAPTER 7 DIFFERENTIAL ABUTMENT PILE AXIAL LOAD INVESTIGATION The purpose of this chapter is to investigate the behavior of an integral abutment under an internal temperature gradient and the resulting effects on the abutment pile axial loads. One abutment from the empirical study was modeled using the finite element software package ANSYS A temperature gradient was applied to the models abutment and the resulting pile axial loads were recorded and compared. Recommendations for future work follow. 7.1 BACKGROUND Data recorded during the monitoring period of this work has shown some inconsistencies in the internal axial strains in the piles. Figure 7.1 and 7.3 show the internal axial strains versus effective bridge temperature of the three instrumented piles at Bridge 309 s south abutment. In the figure the grey data is the strain-gauge data recorded during the project lifecycle, and the dashed, black line is the linear best-fit line for the data T eff ( F) Figure 7.1. SAHP1 axial strain vs. effective bridge temperature
145 Microstrain Teff ( F) Figure 7.2. SAHP4 axial strain vs. effective bridge temperature Microstrain Teff ( F) Figure 7.3. SAHP6 axial strain vs. effective bridge temperature As shown in Figure 7.1 through 7.3, the best fit lines that describe each data set have
146 Temperature ( F) 45 F 124 unique slopes. At higher effective bridge temperatures the interior pile, SAHP4, is showing higher (higher tension) axial strains than the exterior piles, SAHP1 and SAHP6. The opposite is true at lower bridge temperatures where the interior pile shows lower (higher compression) axial strains than the exterior piles. In order to estimate the temperature gradient in the abutment, the temperatures record by the embedded concrete deck temperature gauges and the abutment pile strain-gauges were plotted for a hot period and a cold period. The difference between the deck temperature data and the pile strain-gauge temperature was then used as an input in the ANSYS analysis. Figure 7.4 shows the temperature data from the previously mentioned gauges for the warm period. The temperature differential from the cold period was nearly equal to the warm period T_309WTemp T_309ETemp T_309SAHP1SW T_309SAHP6SE 50 6/6/2011 7/6/2011 Date 8/5/2011 9/4/2011 Figure 7.4. Temperature data As Figure 7.4 shows, during a hot period the temperature at the pile strain-gauges typically remains cooler compared to the embedded concrete deck gauges. Assuming the bottom of the abutment acts in a similar manner a temperature gradient through the abutment
147 125 would result. The largest difference between the two gauge locations as shown in the figure is approximately 45 F. 7.2 MODEL DEVELOPMENT Geometry The model design for the analysis has geometry similar to Bridge 309 s south abutment. The analytical model s abutment top and bottom elevations, the pile locations, and the pilecap and backwall thicknesses are the same as Bridge 309 s south abutment. Figure 7.5 through 7.7 depict the geometry of the analytical model. Figure 7.5. Analytical model elevation view
148 126 Figure 7.6. Analytical model plan view Figure 7.7. Analytical model end views As shown in Figure 7.5 through 7.7, in order to simplify the design, in the analytical model the wingwalls are extended the full height as the abutment backwall and the thickness of the abutment is a constant 36 in. (defined in shell element properties). Also, the portion of the wingwall that extends forward past the backwall, regarding Bridge 309 s abutment, was not included in the analytical model.
149 Elements SHELL57 SHELL57 is a 3-D thermal shell element having in-plane thermal conduction capability. The element was used to mesh the abutment during the thermal conduction portion of the analysis. In this analysis, the element geometry was defined by four nodes, a constant thickness, and the material properties. At each node there is a single degree of freedom; temperature. This element is applicable to a 3-D steady-state or transient thermal analysis. SHELL63 SHELL63 is a 3-D elastic shell element that has both bending and membrane capabilities. This element was used to mesh the abutment during the thermal stress portion of the analysis. In this analysis, the element geometry was defined by four nodes, a constant thickness, and the orthotropic material properties. There are six degrees of freedom at each node: translations in the nodal x, y, and z directions and rotations about the nodal x, y, and z axes. Both in-plane and normal loads are permitted. BEAM4 3-D BEAM4 is a uniaxial 3-D elastic beam element with tension, compression, torsion, and bending capabilities. This element was used to model the abutment piles and the composite girders during the thermal stress portion of the analysis. In this analysis, the element was defined by two nodes, the cross-sectional area, two area moments of inertia (IZZ and IYY), two thicknesses (TKY and TKZ), an angle of orientation (θ) about the elements x-axis, the torsional moment of inertia (IXX), and the material properties. At each node the element has six degrees of freedom: translations in the nodal x, y, and z directions and rotations about the nodal x, y, and z axes. COMBIN14 COMBIN14 is a spring-damper element that has longitudinal or torsional capability in 1- D, 2-D, or 3-D applications. This element was used to model the soil skin friction along the length of the piles during the thermal stress portion of the analysis. In this analysis, the element was defined by two nodes and a spring constant (k). The longitudinal spring-damper option is a uniaxial tension-compression element with up to three degrees of freedom at each node: translations in the nodal x, y, and z directions. No bending or torsion is considered. The
150 128 spring-damper element has no mass, and the spring or the damping capability may be removed from the element. Since only soil skin friction was considered, the element was restrained so that only one degree of freedom was free, parallel to the piles Material Properties Abutment In order to run the thermal conduction and thermal stress analyses certain assumptions had to be made about the thermal and structural properties of the concrete abutment. The modulus of elasticity of the concrete, E c, was estimated using the recommendations of ACI section The concrete s poisson ratio, ν c ; density, ρ c ; specific heat, C pc ; thermal conductivity, k c ; and coefficient of linear thermal expansion,α c ; were selected from appropriate charts (The Engineer ToolBox 2012). Table 7.1 shows the concrete thermal properties that were inputted into ANSYS Table 7.1. Abutment material properties ANSYS model E c (psi) ν c ρ c (lb/in. 3 ) C pc (Btu/lb m F) k c (BTU/(in.hr. F) α c (10-6 in./in. F) 3,372, The values shown in Table 7.1 were assumed values for the given material properties. These estimates should provide sufficient results for the scope of the analysis. Piles and Composite Girders Since the piles and composite girders are excluded from the thermal conductivity portion of the analysis, only structural properties of members are needed for the analysis. The material and cross-sectional properties of the composite girders discussed previously were used in the model. The modulus of elasticity, E s, and poisson ratio, ν s, for the steel piles were assumed equal to 29,000,000 psi and 0.3, respectively. Soil In order to model vertical soil springs it was necessary to make certain assumptions about the properties of the soil surrounding the piles. Using the boring log provided in Bridge 309 s plan set and Table 5.5 from Abendroth and Greimann (2005) the average soil blow count, N; undrained cohesion, C u ; average vertical-skin-frictional resistance, k v ; and bearing resistance,
151 129 k q, were calculated for two soil layers surrounding the piles. Table 7.2 shows the values for the soil properties of each layer used in the analytical model. Table 7.2. Soil properties ANSYS model Layer N C u (psi) k v (psi ) k q (pci) The values of k v and k q, shown in Table 7.2, were calculated using methods put forward by Abendroth and Greimann (2005). In their work k v and k q were then used in equations that describe the non-linear P-Δ properties of soil. However, in this work k v and k q are used in Equations 7.1 and 7.2 to calculate the stiffness for the vertical soil springs in the ANSYS model. K v =k v Lp (7.1) K q =k q A p (7.2) where, K v = skin-friction soil-spring resistance K q = end-bearing soil-spring resistance L p = tributary pile length for each soil-skin-friction soil-spring A p = cross-sectional area of the pile tips Boundary Conditions Two sets of boundary conditions were analyzed. The purpose for running the analysis with two sets of boundary conditions was to develop an envelope of the axial loads in the piles, and to study the restraining effect girders might have on the abutment. In first set of boundary conditions, only the soil springs support the structure in the vertical direction, and horizontal movements of the piles are restricted. The piles and the abutment are connected though sharing a common node at the pile/abutment interface. The
152 130 piles must be restricted from horizontal movements, because the soil springs have three degrees of freedom at each node, and the purpose of the soil springs is only for vertical restraint. Also, the soil spring node not attached to the pile is restricted from all movement (fixed support). In second set of boundary conditions the composite-girders are included in the model. They each share a single node at the girder/abutment interface at the location of their respective neutral axes. The composite-girders were modeled as full-length, straight girders. The lengths of each span corresponded to the actual span lengths, along the curve, of Bridge 309. Both pier locations were modeled as pinned supports with all displacement fixed and rotations about the transverse and vertical axis fixed. The abutment at the opposite end is assumed as a fixed support and, as such, all movements at that location are restricted. The boundary conditions for the piles and the spring elements are the same as those for the first set of boundary conditions. Figure 7.8 shows the boundary conditions applied to the soil springs, abutment piles, and composite girders Loading Conditions The first step in the analysis was to run a thermal conduction study. The abutment was modeled SHELL57 and the appropriate material thermal properties, both covered previously. A temperature of 26 F was applied across the top of the abutment and a temperature of -26 F was applied across the bottom of the abutment. The temperatures were chosen as a result of the measured abutment and pile temperature data described previously for Bridge 309. From these inputs, ANSYS generated a temperature gradient though the abutment and stored the information in a.rth file. The information from the.rth file was then used as temperature loading in a thermal stress analysis. Figure 7.10 displays the thermal gradient through the abutment as a result of the thermal conduction analysis. As one might expect from an analysis such as this, the temperature gradient though the abutment is nearly uniform. The slight variation from one vertical face to another is the result of the height variation from one wingwall to the other.


153 131 Figure Model boundary conditions Figure 7.9. Abutment temperature gradient

154 RESULTS Model without Girders The first analysis run was modeled with boundary conditions set one. Figure 7.11 shows the deformation that took place as a result of the thermal stress in the abutment without the composite girders. Figure Model deformation boundary set one As shown in Figure 7.11, the model takes on a convex shape as a result of the thermal stresses. The bending is not completely symmetric due to the slightly unsymmetrical geometry of the abutment. It should be noted that the deformation was exaggerated to produce more visible results. Along with the plotted deformation, the axial loads in the abutment piles were determined from the analysis; the results of which are shown in figure As expected, a temperature gradient in the abutment caused differential axial loading in the piles. The results are similar to those seen in the experimental data for Bridge 309 with interior piles 5 and 6 experiencing high tension loads, and the exterior piles experience either low tension or compressions loads. Note the majority of the load is carried by the skin-friction soil-springs as opposed to the end-bearing soil-springs. This is consistent with a friction pile system typical of clay soils without a rock foundation.
 133 Axial Load (lb) 10000 5000 0 0-5000 -10000-15000 -20000-100 -200 (-) = compression (+) = tension -300-400 -500-600 -700 pile1 pile2 pile3 pile4 pile5 pile6 pile7 pile8-800 Figure 7.11.")
155 Depth Along Girder (in.) 133 Axial Load (lb) (-) = compression (+) = tension pile1 pile2 pile3 pile4 pile5 pile6 pile7 pile8-800 Figure Axial load results boundary set one The second analysis run was modeled with boundary conditions set two. Figure 7.13 shows the deformation that took place as a result of the thermal stress in the abutment with the composite girders. Figure Model deformation boundary set two
Effect of Pile Orientation in Skewed Integral Abutment Bridges
 Effect of Pile Orientation in Skewed Integral Abutment Bridges RABIH NAJIB, Ph.D., PE, Alpha Corporation, Baltimore, Maryland and AMDE M. AMDE, Ph.D., PE, University of Maryland, College Park, Maryland
DATA GATHERING AND DESIGN DETAILS OF AN INTEGRAL ABUTMENT BRIDGE
 DATA GATHERING AND DESIGN DETAILS OF AN INTEGRAL ABUTMENT BRIDGE Abstract S. Hassiotis M. ASCE Stevens Institute of Technology, Hoboken, N.J. 07030 sophia.hassiotis@stevens.edu An integral-abutment bridge
STUDY OF THE REASONS THAT INDUCE CRACKS AT BRIDGE DECK END
 STUDY OF THE REASONS THAT INDUCE CRACKS AT BRIDGE DECK END by Zhengyu Liu Research Team: Zhengyu Liu, Graduate Research Student, Bridge Engineering Center, Iowa State University Brent M Phares, Director,
EXAMINATION OF THE RESPONSE OF SKEWED STEEL BRIDGE SUPERSTRUCTURE DURING DECK PLACEMENT
 Norton et al. Word Count: 8400 Tables: 5 Figures: 13 1 EXAMINATION OF THE RESPONSE OF SKEWED STEEL BRIDGE SUPERSTRUCTURE DURING DECK PLACEMENT Date submitted: 08/01/02 Date Revised and Resubmitted: 11/15/02
Update on Seismic Behavior and Design of
 Update on Seismic Behavior and Design of Steel Plate Girder Bid Bridges Ahmad M. Itani, Ph.D., P.E., S.E. Professor Department of Civil and Environmental Engineering University of Nevada, Reno Background
Integral Abutment Bridge Design with Soil Structure Interaction
 Integral Abutment Bridge Design with Soil Structure Interaction Thursday, May 11, 2017 3:00 PM 4:00 PM EST Speaker Engineer: Suthichai Saelim Project Location WESTBOROUGH Railroad HOPKINTON Project Location
Integral Abutment Bridges-Development of Soil Model for Soil Structure Interaction in Time History Analysis
 International Journal of Engineering Research and Development e-issn: 2278-067X, p-issn: 2278-800X, www.ijerd.com Volume 10, Issue 3 (March 2014), PP.31-40 Integral Abutment Bridges-Development of Soil
Low-Volume Road Abutment Design Standards
 Low-Volume Road Abutment Design Standards V.W. Robbins HNTB Corporation 7450 W. 130th St., Suite 400 Overland Park, KS 66213 vrobbins@hntb.com F. Wayne Klaiber Bridge Engineering Center 418 Town Engineering
CHAPTER 5 MODELING OF THE BRIDGE
 62 CHAPTER 5 MODELING OF THE BRIDGE 5.1 MODELING SAP2000, a nonlinear software package was used for modeling and analysing the study bridge. The following list provides details about the element type used
Evaluation of the Need for Longitudinal Median Joints in Bridge Decks on Dual Structures
 InTrans Project Reports Institute for Transportation 9-2015 Evaluation of the Need for Longitudinal Median Joints in Bridge Decks on Dual Structures Brent Phares Institute for Transportation, bphares@iastate.edu
research report Field Measurements on Skewed Semi-Integral Bridge With Elastic Inclusion: Instrumentation Report
 Final Report VTRC 06-R35 Virginia Transportation Research Council research report Field Measurements on Skewed Semi-Integral Bridge With Elastic Inclusion: Instrumentation Report http:/www.virginiadot.org/vtrc/main/online_reports/pdf/06-r35.pdf
Development of Preflex Composite Beam-Stub Abutment Integral Bridge System
 Steel Structures 6 (2006) 175-181 www.kssc.or.kr Development of Preflex Composite Beam-Stub Abutment Integral Bridge System Jae-Ho Jung 1, Won-Sup Jang 1, Sung-Kun You 2, Young-Ho Kim 2 and Soon-Jong Yoon
EFFECTS OF SKEWED ABUTMENTS ON CURVED BRIDGE CONSTRUCTION RESPONSE. Tyler Goodman. Spring 2013
 THE PENNSYLVANIA STATE UNIVERSITY SCHREYER HONORS COLLEGE DEPARTMENT OF CIVIL AND ENVIROMENTAL ENGINEERING EFFECTS OF SKEWED ABUTMENTS ON CURVED BRIDGE CONSTRUCTION RESPONSE Tyler Goodman Spring 2013 A
Rebuilding and widening the 54- year-old Jane Addams Memorial Tollway into a state-of-the-art corridor linking Rockford to Elgin (three lanes) and
 and") Overview Design criteria for I-90 over Kishwaukee Integral Abutment Bridges (IAB) Design Criteria Design analysis, details and construction Lessons Learned during construction Instrumentation by Illinois
Overview Design criteria for I-90 over Kishwaukee Integral Abutment Bridges (IAB) Design Criteria Design analysis, details and construction Lessons Learned during construction Instrumentation by Illinois
Design Considerations for Integral Abutment/ Jointless Bridges in the USA
 University of Wisconsin Milwaukee UWM Digital Commons Civil and Environmental Engineering Faculty Articles Civil and Environmental Engineering 3-2014 Design Considerations for Integral Abutment/ Jointless
Three Bridges at I-64/Mercury Boulevard Interchange in Hampton, VA
 Three Bridges at I-64/Mercury Boulevard Interchange in Hampton, VA IRFAN A. ALVI, P.E., Alvi Associates, Inc., Baltimore, MD IBC-02-25 KEYWORDS: box girder, counterweight abutment, curved girder, high-performance
The Pennsylvania State University. The Graduate School. Department of Civil and Environmental Engineering
 The Pennsylvania State University The Graduate School Department of Civil and Environmental Engineering LENGTH LIMITATIONS OF PRESTRESSED CONCRETE GIRDER INTEGRAL ABUTMENT BRIDGES A Thesis in Civil Engineering
Semi-Integral Abutment Bridges
 Ministry of Transportation Report BO-99-03 Bridge Office Leslie Street Over Hwy 407 Semi-Integral Abutment Bridges Ministry of Transportation Report BO-99-03 Bridge Office Semi-Integral Abutment Bridges
Long-Term Response Prediction of Skewed Integral Bridges under Creep Effects
 From the SelectedWorks of Innovative Research Publications IRP India Winter January 1, 215 Long-Term Response Prediction of Skewed Integral Bridges under Creep Effects Innovative Research Publications,
Thermal Response of Integral Abutment Bridges With Mechanically Stabilized Earth Walls
 Thermal Response of Integral Abutment Bridges With Mechanically Stabilized Earth Walls http://www.virginiadot.org/vtrc/main/online_reports/pdf/13-r7.pdf ALFREDO E. ARENAS, Ph.D. Graduate Research Assistant
Keywords: integral abutment bridge, pile head abutment connection, finite element method.
 Global Journal of Researches in Engineering: e Civil And Structural Engineering Volume 15 Issue 1 Version 1.0 Year 2015 Type: Double Blind Peer Reviewed International Research Journal Publisher: Global
EFFECTS OF SPATIAL VARIATION OF SEISMIC INPUTS ON BRIDGE LONGITUDINAL RESPONSE
 13 th World Conference on Earthquake Engineering Vancouver, B.C., Canada August 1-6, 24 Paper No. 64 EFFECTS OF SPATIAL VARIATION OF SEISMIC INPUTS ON BRIDGE LONGITUDINAL RESPONSE Jiachen WANG 1, Athol
An Integral Abutment Bridge with Precast Concrete Piles
 An Integral Abutment Bridge with Precast Concrete Piles Final Report May 2007 Sponsored by the Iowa Highway Research Board (IHRB Project TR-438) and the Iowa Department of Transportation (CTRE Project
Extending Integral Concepts to Curved Bridge Systems
 University of Nebraska - Lincoln DigitalCommons@University of Nebraska - Lincoln Civil Engineering Theses, Dissertations, and Student Research Civil Engineering 11-2011 Extending Integral Concepts to Curved
Figure 3: Analytic procedure
 International Journal of Scientific and Research ublications, Volume 7, Issue 5, May 2017 567 Investigation of Integral Bridge Effect under Dynamic Loading Haymanmyintmaung *,kyawlinnhtat ** * Department
Numerical analysis of the embedded abutments of integral bridges
 Numerical analysis of the embedded abutments of integral bridges Ming XU Researcher, Dept. of Civil & Env. Engrg., University of Southampton, UK Summary Alan G. BLOODWORTH Lecturer, Dept. of Civil & Env.
ILLINOIS INTEGRAL ABUTMENT BRIDGES: BEHAVIOR UNDER EXTREME THERMAL LOADING AND DESIGN RECOMMENDATIONS KURT PATRICK HOLLOWAY THESIS
 ILLINOIS INTEGRAL ABUTMENT BRIDGES: BEHAVIOR UNDER EXTREME THERMAL LOADING AND DESIGN RECOMMENDATIONS BY KURT PATRICK HOLLOWAY THESIS Submitted in partial fulfillment of the requirements for the degree
Integral bridges and environmental conditions
 Integral bridges and environmental conditions COMISU CLAUDIU-CRISTIAN, BOACĂ GHEORGHITĂ Department of Roads and Foundations Faculty of Civil Engineering and Building Services The "Gheorghe Asachi" Technical
THERMAL BEHAVIOR OF IDOT INTEGRAL ABUTMENT BRIDGES AND PROPOSED DESIGN MODIFICATIONS
 CIVIL ENGINEERING STUDIES Illinois Center for Transportation Series No. 12-022 UILU-ENG-2012-2025 ISSN: 0197-9191 THERMAL BEHAVIOR OF IDOT INTEGRAL ABUTMENT BRIDGES AND PROPOSED DESIGN MODIFICATIONS Prepared
Experimental and Analytical Investigation of UHPC Pile-to-Abutment Connections
 Experimental and Analytical Investigation of UHPC Pile-to-Abutment Connections Sriram Aaleti 1 and Sri Sritharan 2 1 Assistant Professor, Department of Civil, Construction and Environmental Engineering,
Design of Dingley Bypass Integral Bridges
 Design of Dingley Bypass Integral Bridges Dr. Kabir Patoary Principal Engineer Bridges GHD Elder St South Underpass Tekla Model Presentation Outline 1. Overview of Dingley Bypass 2. Design of Integral
BEHAVIOR AND ANALYSIS OF AN INTEGRAL ABUTMENT BRIDGE
 BEHAVIOR AND ANALYSIS OF AN INTEGRAL ABUTMENT BRIDGE Paul J. Barr Marv W. Halling Conner Huffaker Hugh Boyle Utah State University Department of Civil and Environmental Engineering Logan, Utah September
Comparative Study of Behaviour of Integral and Bearing Type Bridge under Temperature Loading
 IJSRD - International Journal for Scientific Research & Development Vol. 3, Issue 03, 2015 ISSN (online): 2321-0613 Comparative Study of Behaviour of Integral and Bearing Type Bridge under ing B. J. Shah
Experimental investigation of axial load on low cycle fatigue performance of steel H piles in integral bridges
 Experimental investigation of axial load on low cycle fatigue performance of steel H piles in integral bridges *Memduh Karalar 1) and Murat Dicleli 2) 1) Department of Civil Engineering, Bülent Ecevit
Prediction of Concrete Integral Abutment Bridge Unrecoverable Displacements
 SP-284 11 Prediction of Concrete Integral Abutment Bridge Unrecoverable Displacements WooSeok Kim, Jeffrey A. Laman, and Daniel G. Linzell Synopsis: Integral abutment bridges (IABs) have performed successfully
Bahavior and Analysis of an Integral Abutment Bridge
 Utah State University DigitalCommons@USU All Graduate Theses and Dissertations Graduate Studies 2013 Bahavior and Analysis of an Integral Abutment Bridge Conner D. Huffaker Follow this and additional works
Development of Abutment Design Standards for Local Bridge Designs Volume 1 of 3
 F. W. Klaiber, D. J. White, T. J. Wipf, B. M. Phares, V. W. Robbins Development of Abutment Design Standards for Local Bridge Designs Volume 1 of 3 Development of Design Methodology August 2004 Sponsored
Conditional assessment of Kiri Bridge in Shkoder, Albania
 Conditional assessment of Kiri Bridge in Shkoder, Albania Gentian Rexhaj 1, Enea Mustafaraj 2 1 2 Department of Civil Engineering, Epoka University, Albania 2 Department of Civil Engineering, Epoka University,
Field and Analytical Studies of the First Folded Plate Girder Bridge
 University of Massachusetts Amherst ScholarWorks@UMass Amherst Masters Theses Dissertations and Theses 2014 Field and Analytical Studies of the First Folded Plate Girder Bridge Man Hou Sit University of
Title: Seismic Design Recommendations for Steel Girder Bridges with Integral Abutments
 G. Pekcan, A. Itani & E. Monzon 0 0 0 Title: Seismic Design Recommendations for Steel Girder Bridges with Integral Abutments Authors: Gokhan Pekcan, Ph.D. (CORRESPONDING AUTHOR) Assistant Professor Department
MODIFICATION OF IDOT INTEGRAL ABUTMENT DESIGN LIMITATIONS
 CIVIL ENGINEERING STUDIES Illinois Center for Transportation Series No. 9-54 UILU-ENG-29-235 ISSN: 197-9191 MODIFICATION OF IDOT INTEGRAL ABUTMENT DESIGN LIMITATIONS AND DETAILS Prepared By Scott M. Olson
PENNDOT e-notification
 PENNDOT e-notification Bureau of Design Engineering Computing Management Division BRADD No. 027 August 30, 2010 Release of Version 3.1.5.0 PennDOT's Bridge Automated Design and Drafting Software (BRADD)
Thermal Response of a Highly Skewed Integral Bridge
 Thermal Response of a Highly Skewed Integral Bridge http://www.virginiadot.org/vtrc/main/online_reports/pdf/12-r10.pdf EDWARD J. HOPPE, Ph.D., P.E. Senior Research Scientist SETH L. EICHENTHAL Research
State-Aid Bridge News August 2, 2005
 State-Aid Bridge News August 2, 2005 Bridge Hydraulic Information The FHWA has been inquiring about our Scour Program. In particular, there are two areas of concern; 1. Are our Scour Action Plans current
INTEGRAL ABUTMENT BRIDGES UNDER THERMAL LOADING: NUMERICAL SIMULATIONS AND PARAMETRIC STUDY
 CIVIL ENGINEERING STUDIES Illinois Center for Transportation Series No. 16-015 UILU-ENG-2016-2015 ISSN: 0197-9191 INTEGRAL ABUTMENT BRIDGES UNDER THERMAL LOADING: NUMERICAL SIMULATIONS AND PARAMETRIC STUDY
Potential For Fracture To Occur In Iowa DOT Steel Girder Bridges Due to Triaxial Constraint
 Potential For Fracture To Occur In Iowa DOT Steel Girder Bridges Due to Triaxial Constraint Introduction The purpose of this white paper is to provide information regarding the potential for fractures
Integral Bridge Design - Derivation of the Spring Constant for Modelling the Soil-Structure Interaction
 Integral Bridge Design - Derivation of the Spring Constant for Modelling the Soil-Structure Interaction Sergei Terzaghi BE(Hons), MIPENZ Gillian Sisk BEng PhD MIEI CEng Synopsis Integral bridges present
Instrumentation and Monitoring of Precast Bridge Approach Tied to an Integral Abutment Bridge in Bremer County
 Instrumentation and Monitoring of Precast Bridge Approach Tied to an Integral Abutment Bridge in Bremer County Final Report April 2010 Sponsored by Federal Highway Administration Iowa Department of Transportation
Technology. Reinforced Earth Wall Typical Section. Traffic Barrier. Roadway. Select Granular Material. Facing Panel Random Backfill.
 Bridge Applications Technology The Reinforced Earth Company (RECo) offers a variety of bridge abutment and bridge crossing solutions, each are based on project specific requirements. Bridge abutments are
APPENDIX A INTEGRAL ABUTMENTS
 APPENDIX A INTEGRAL ABUTMENTS Appendix A Guidelines for Design of Integral Abutments Rev. 1 - September, 2007 These guidelines draw on the experiences and practices from Ontario, the FHWA, various DOT
THERMAL RESPO SE OF I TEGRAL ABUTME T BRIDGES WITH MSE WALLS: UMERICAL A ALYSES A D A PRACTICAL A ALYSIS TOOL
 THERMAL RESPO SE OF I TEGRAL ABUTME T BRIDGES WITH MSE WALLS: UMERICAL A ALYSES A D A PRACTICAL A ALYSIS TOOL Alfredo E. Arenas Dissertation submitted to the faculty of the Virginia Polytechnic Institute
Forces in Wingwalls from Thermal Expansion of Skewed Semi-Integral Bridges
 Forces in Wingwalls from Thermal Expansion of Skewed Semi-Integral Bridges Eric Steinberg, Ph.D., P.E. Shad Sargand, Ph.D. for the Ohio Department of Transportation Office of Research and Development and
Appendix C Guidelines for Design of Integral Abutments March 3, 2003
 These guidelines draw on the experiences and practices from Ontario, the FHWA, various DOT s and the UK Highways Agency. They provide guidance and outline the issues that need to be considered and should
Executive Summary RPT-GEN November 28. Bridge No Quartz Creek Bridge Inspection Report
 Executive Summary The No. 01607 carries the Trans-Canada Highway over Quartz Creek, approximately 45 km northwest of Golden, BC. As part of an Enhanced Bridge Inspection Program, the BC Ministry of Transportation
A Tale of Two Bridges: Comparison between the Seismic Performance of Flexible and Rigid Abutments
 A Tale of Two Bridges: Comparison between the Seismic Performance of Flexible and Rigid Abutments A.M. Morsy. Department of Civil, Architectural, and Environmental Engineering, The University of Texas
Numerical Modeling of the Performance of Highway Bridge Approach Slabs. Gregory S. Rajek
 Numerical Modeling of the Performance of Highway Bridge Approach Slabs by Gregory S. Rajek A thesis in partial fulfillment of the requirements for the degree of Master of Science (Civil Engineering) UNIVERSITY
Evaluation of the Foundation and Wingwalls of Skewed Semi-Integral Bridges with Wall. Abutments. A thesis presented to.
 Evaluation of the Foundation and Wingwalls of Skewed Semi-Integral Bridges with Wall Abutments A thesis presented to the faculty of the Russ College of Engineering and Technology of Ohio University In
Modified Sheet Pile Abutment for Low-Volume Road Bridge
 Modified Sheet Pile Abutment for Low-Volume Road Bridge Ryan R. Evans Department of Civil, Construction, and Environmental Engineering Iowa State University 176 Town Engineering Ames, IA 50011 ryevans@iastate.edu
Experimental Evaluation of Seismic Pounding at Seat- Type Abutments of Horizontally Curved Bridges
 Experimental Evaluation of Seismic Pounding at Seat- Type Abutments of Horizontally Curved Bridges J.D. Wieser, E. Maragakis & I.G. Buckle Center for Civil Engineering Earthquake Research, University of
AN EXPERIMENTAL INVESTIGATION ON BEHAVIOR OF RC PARAPET WALL OF ABUTMENT UNDER COLLISION
 International Journal of Civil Engineering and Technology (IJCIET) Volume 9, Issue 9, September 2018, pp. 1831 1838, Article ID: IJCIET_09_09_177 Available online at http://www.iaeme.com/ijciet/issues.asp?jtype=ijciet&vtype=9&itype=9
Shifting the Canning Bus Bridge Sideways
 Shifting the Canning Bus Bridge Sideways Ros MacKinlay Design Engineer, Wyche Consulting SYNOPSIS The Perth Mandurah railway proposed in 2002 required the replacement of an existing Kwinana Freeway bus
300 GEORGE ST REDEVELOPMENT IMPACT OF PROPOSED BASEMENT EXCAVATION ON THE ANN STREET ONRAMP STRUCTURES
 300 GEORGE ST REDEVELOPMENT IMPACT OF PROPOSED BASEMENT EXCAVATION ON THE ANN STREET ONRAMP STRUCTURES BONACCI GROUP DOCUMENT HISTORY ISSUE REVISION DATE AUTHOR REVIEWER Issued for DTMR Review A October
Integral Abutment Bridges Australian and US Practice
 Integral Abutment Bridges Australian and US Practice John Connal (M.Eng Sci., B.E. (civil) (Hons), Dip. C.E., F.I.E.Aust, M. ASCE, M. IABSE) Maunsell Australia Pty Ltd SYNOPSIS The structural system offered
SEISMIC PERFORMANCE OF SEAT- TYPE ABUTMENT HIGHWAY BRIDGES IN ILLINOIS
 CIVIL ENGINEERING STUDIES Illinois Center for Transportation Series No. 18-015 UILU-ENG-2018-2015 ISSN: 0197-9191 SEISMIC PERFORMANCE OF SEAT- TYPE ABUTMENT HIGHWAY BRIDGES IN ILLINOIS Prepared By James
Seismic Analysis of Bridge Abutment-Soil Systems
 ISSN: 2454-2377, Seismic Analysis of Bridge Abutment-Soil Systems M. G. Mahamuni 1* & Dr. S. K. Kulkarni 2 1 Post Graduate Student, Civil Engineering Department, Dr. D.Y. Patil School of Engg and Tech,
Earthquake Resistance of Bridges With Friction Slab Abutments
 Earthquake Resistance of s With Friction Slab Abutments J. H. Wood John Wood Consulting, Lower Hutt. ABSTRACT: 2010 NZSEE Conference Findings from experimental and numerical research on the force resistance
THE EFFECT OF EPS GEOFOAM BACKFILL ON THE SEISMIC PERFORMANCE OF INTEGRAL ABUTMENT BRIDGES MEGAN OOMS. A thesis submitted to the
 THE EFFECT OF EPS GEOFOAM BACKFILL ON THE SEISMIC PERFORMANCE OF INTEGRAL ABUTMENT BRIDGES By MEGAN OOMS A thesis submitted to the Graduate School-New Brunswick Rutgers, The State University of New Jersey
Overturning Forces at Bridge Abutments and the Interaction of Horizontal Forces from Adjacent Roadways
 Overturning Forces at Bridge Abutments and the Interaction of Horizontal Forces from Adjacent Roadways ANNUAL REPORT FOR FY 2011 ODOT SPR ITEM NUMBER 2228 Submitted to: John Bowman, P.E. Planning and Research
Permanent deformation of bridge abutment on liquefiable soils
 Permanent deformation of bridge abutment on liquefiable soils Akihiro TAKAHASHI 1, Hideki SUGITA 1 & Shunsuke TANIMOTO 1 ABSTRACT Seismic response of a bridge abutment located near a river dyke is the
Reducing Bridge Damage Caused by Pavement Forces Part 1: Some Examples
 Reducing Bridge Damage Caused by Pavement Forces Part 1: Some Examples BY MARTIN P. BURKE, JR. Innumerable bridges both in the U.S. and abroad have been, and continue to be, damaged by the restrained growth
Caleb Mitchell. B.S., Kansas State University, 2016 A THESIS. submitted in partial fulfillment of the requirements for the degree MASTER OF SCIENCE
 Finite Element Analyses and Proposed Strengthening of a Reinforced Concrete Box Girder Bridge Subjected to Differential Settlement by Caleb Mitchell B.S., Kansas State University, 2016 A THESIS submitted
University of Southampton Research Repository eprints Soton
 University of Southampton Research Repository eprints Soton Copyright and Moral Rights for this thesis are retained by the author and/or other copyright owners. A copy can be downloaded for personal non-commercial
Earthquake Design of Bridges With Integral Abutments
 6 th International Conference on Earthquake Geotechnical Engineering 1-4 November 2015 Christchurch, New Zealand Earthquake Design of Bridges With Integral Abutments J. H. Wood 1 ABSTRACT Because of the
Geosynthetic Reinforced Soil (GRS) Integrated Bridge Systems (IBS) John Bowders University of Missouri
 Integrated Bridge Systems (IBS) John Bowders University of Missouri") Geosynthetic Reinforced Soil (GRS) Integrated Bridge Systems (IBS) John Bowders University of Missouri Adams et al. (2012), FHWA Geosynthetic Reinforced Soil Integrated Bridge System Interim Implementation
Geosynthetic Reinforced Soil (GRS) Integrated Bridge Systems (IBS) John Bowders University of Missouri Adams et al. (2012), FHWA Geosynthetic Reinforced Soil Integrated Bridge System Interim Implementation
The Long Term Performance Of Skew Integral Bridges
 The Long Term Performance Of Skew Integral Bridges Popoola, Oladele.O. Civil Engineering Department Afe Babalola University Ado-Ekiti, Nigeria oladelepope@yahoo.com Wasiu, John Civil Engineering Department
Simplified Analytical Model of a Covered Queen-Post-Truss Timber Bridge
 Simplified Analytical Model of a Covered Queen-Post-Truss Timber Bridge Fouad Fanous, Douglas Rammer & Terry Wipf, Bridge Engineering Center Forest Product Laboratory Study Scope Objective Develop a simple
ABSTRACT INTRODUCTION
 ABSTRACT SMIP94 Seminar Proceedings Abutment stiffnesses are determined directly from the earthquake motions recorded at the US 1011 Painter Street Overpass using a simple equilibrium-based approach without
5 DAMAGE TO TRANSPORTATION FACILITIES
 5 DAMAGE TO TRANSPORTATION FACILITIES In the Kocaeli, Turkey earthquake of August 17, 1999, extensive damage of transportation facilities occurred in the Kocaeli and Sakarya region, Turkey as shown in
FHWA/IN/JTRP-2008/11. Final Report. Robert J. Frosch Michael E. Kreger Aaron M. Talbott
 FHWA/IN/JTRP-28/11 Final Report EARTHQUAKE RESISTANCE OF INTEGRAL ABUTMENT BRIDGES Robert J. Frosch Michael E. Kreger Aaron M. Talbott May 29 INDOT Research TECHNICAL Summary Technology Transfer and Project
APPENDIX A - THE BEHAVIOR OF INTEGRAL ABUTMENT BRIDGES
 APPENDIX A - THE BEHAVIOR OF INTEGRAL ABUTMENT BRIDGES Report submitted to VTRC in November, 1999 THE BEHAVIOR OF INTEGRAL ABUTMENT BRIDGES FINAL CONTRACT REPORT Sami Arsoy, Richard M. Barker, and J. Michael
Development of a Transducer for Measuring Tensile Strains in Concrete Bridge Girders
 Development of a Transducer for Measuring Tensile Strains in Concrete Bridge Girders By Dr. Jim Richardson, Dr. Michael Triche and Mr. Stephan Skelton Department of Civil and Environmental Engineering
SUMMARY OF NOVEMBER 2018 REVISIONS - VERSION
 SUMMARY OF NOVEMBER 2018 REVISIONS - VERSION 3.2.5.0 Since the release of BRADD Version 3.2.4.3, several operational issues have been addressed. This release of BRADD Version 3.2.5.0 contains the following
The Structure upon which the ends of a Bridge rests is referred to as an Abutment
 ABUTMENTS The Structure upon which the ends of a Bridge rests is referred to as an Abutment The most common type of Abutment Structure is a Retaining Wall, Although other types of Abutments are also possible
Monitoring of a bridge with integral abutments
 Monitoring of a bridge with integral abutments J. Erisen, M. Veljovic, & M. Nilsson Luleå University of Technology, Luleå, Sweden ABSTRACT: Preliminary results obtained from short term test-loading are
Webinar Q&A Documentation Slide In Bridge Construction (SIBC) Construction/Contractor Perspective March 6, 2014
 Construction/Contractor Perspective March 6, 2014") Updated: 5/15/14 1 What was driver for deciding to slide vs. roll? Overall weight? 2 1. Why the two different slide methods? 2. How much experience should your contractor have to perform the slide work?
Updated: 5/15/14 1 What was driver for deciding to slide vs. roll? Overall weight? 2 1. Why the two different slide methods? 2. How much experience should your contractor have to perform the slide work?
Questions and Answers on VDOT's Supplement to the AASHTO Manual for Bridge Element Inspection
 Questions and Answers on VDOT's Supplement to the AASHTO Manual for Bridge Element Inspection No. 1 2/26/2016 830 MSE Wall V 26 Is ADE 830 MSE Wall to be used in conjunction with NBE 218 Other Abutment
MSBRIDGE: OPENSEES PUSHOVER AND EARTHQUAKE ANALYSIS OF MULTI-SPAN BRIDGES - USER MANUAL
 STRUCTURAL SYSTEMS RESEARCH PROJECT Report No. SSRP 14/04 MSBRIDGE: OPENSEES PUSHOVER AND EARTHQUAKE ANALYSIS OF MULTI-SPAN BRIDGES - USER MANUAL by AHMED ELGAMAL JINCHI LU KEVIN MACKIE Final Report Submitted
SEPTEMBER, 2006 ROAD DESIGN MANUAL 7-0(1) CHAPTER 7 PAVEMENT DESIGN
 CHAPTER 7 PAVEMENT DESIGN") SEPTEMBER, 2006 ROAD DESIGN MANUAL 7-0(1) CHAPTER 7 PAVEMENT DESIGN 7-1.0 INTRODUCTION 7-2.0 RIGID PAVEMENT DESIGN 7-2.01 Cross Sections 7-2.02 Ramps and Loops with Storage Area 7-2.03 Major Forks, Branch
SEPTEMBER, 2006 ROAD DESIGN MANUAL 7-0(1) CHAPTER 7 PAVEMENT DESIGN 7-1.0 INTRODUCTION 7-2.0 RIGID PAVEMENT DESIGN 7-2.01 Cross Sections 7-2.02 Ramps and Loops with Storage Area 7-2.03 Major Forks, Branch
INTEGRAL ABUTMENT BRIDGE- A Review and Comparison of the Integral Bridge and Conventional Bridge
 INTEGRAL ABUTMENT BRIDGE- A Review and Comparison of the Integral Bridge and Conventional Bridge Amit Bamnali 1, P.J. Salunke 2 1Post graduate student in Civil Engineering, MGM College of Engineering and
Two-Dimensional Computer Modeling of Pomme de Terre River at Highways 12 and 22 in Minnesota
 Two-Dimensional Computer Modeling of Pomme de Terre River at Highways 12 and 22 in Minnesota Kamal Saffarinia 1, G. Kenneth Young 2, J. Sterling Jones 3, and Stuart Stein 4 This paper investigates two-dimensional
6. Gear Measurement And Testing
 6. Gear Measurement And Testing Introduction Gears are mainly used for transmission of power and motion. They are used in various automobiles, machines, equipments, electronic systems, etc. We already
ABC OF BRIDGE NO. 465 I-195 Ramp (Dr-2) Over Warren Avenue
 Over Warren Avenue") ABC OF BRIDGE NO. 465 I-195 Ramp (Dr-2) Over Warren Avenue FHWA Rhode Island Showcase October 30, 2014 Accent image here Primary Image here Presentation Outline Overview of the Project Scope ABC Project
ABC OF BRIDGE NO. 465 I-195 Ramp (Dr-2) Over Warren Avenue FHWA Rhode Island Showcase October 30, 2014 Accent image here Primary Image here Presentation Outline Overview of the Project Scope ABC Project
Program Crowned and Straight External Involute Gear Compressive Stress Introduction
 Program 60-5406 Crowned and Straight External Involute Gear Compressive Stress Introduction The ideal uniform load distribution along gear teeth is seldom obtained, because of many factors that include
SUMMARY OF NOVEMBER 2013 REVISIONS - VERSION
 SUMMARY OF NOVEMBER 2013 REVISIONS - VERSION 3.2.0.0 Since the release of BRADD Version 3.1.6.2, several major enhancements have been made to the software and many reported operational issues have been
Ashton Avenue Integral Bridge
 Ashton Avenue Integral Bridge Behzad Golfa, Senior Bridge Engineer, GHD Pty Ltd ABSTRACT The Ashton Avenue Bridge is a replacement of the original three-span timber bridge over Perth- Fremantle Rail line
DESIGN AND CONSTRUCTION OF BR1449 VICTORIA PARK DRIVE MODIFICATIONS, BURSWOOD, WA
 DESIGN AND CONSTRUCTION OF BR1449 VICTORIA PARK DRIVE MODIFICATIONS, BURSWOOD, WA Brian Lord, Arup Pty Ltd, Australia ABSTRACT Arup was lead designer for Lend Lease on the Victoria Park Drive Modifications
Precast Concrete Elements for Accelerated Bridge Construction
 Precast Concrete Elements for Accelerated Bridge Construction Volume 3. Laboratory Testing, Field Testing, and Evaluation of a Precast Concrete Bridge: Black Hawk County Final Report January 2009 Sponsored
Analyses of State Highway Bridges Damaged in the Darfield and Christchurch Earthquakes
 Analyses of State Highway Bridges Damaged in the Darfield and Christchurch Earthquakes J. H. Wood John Wood Consulting, Lower Hutt. ABSTRACT: 2012 NZSEE Conference Twelve State Highway (SH) bridges subjected
2011 BRIDGE INSPECTION REPORT
 2011 BRIDGE INSPECTION REPORT BYRD PARK PUMP STATION BRIDGE OVER KANAWHA CANAL April 2011 FINAL December 2011 Looking - from Abutment B to Abutment A Prepared by: WHITMAN, REQUARDT, & ASSOCIATES, LLP 9030
Standard Practice for Verification of Testing Frame and Specimen Alignment Under Tensile and Compressive Axial Force Application 1
 Designation: E1012 14 Standard Practice for Verification of Testing Frame and Specimen Alignment Under Tensile and Compressive Axial Force Application 1 This standard is issued under the fixed designation