Diabetes: Where You Live Matters! What You Need to Know About Diabetes in Toronto Neighbourhoods. Peter Gozdyra, Marisa Creatore, CRICH
|
|
|
- Jack Patterson
- 6 years ago
- Views:
Transcription


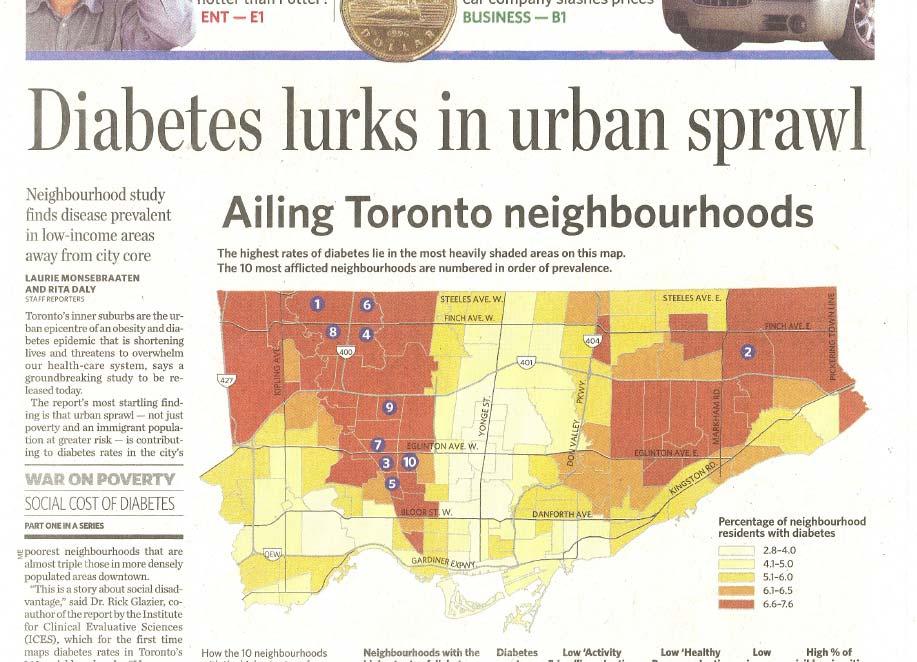
1 Diabetes: Where You Live Matters! What You Need to Know About Diabetes in Toronto Neighbourhoods Peter Gozdyra, Marisa Creatore, CRICH 1

2 Tonight s talk Provide highlights of a large body of work Stimulate discussion: Your neighbourhoods Implications for what you do 2
3 Why diabetes? Over 177 million people with diabetes worldwide (WHO, 2000) Over 2 million Canadians living with diabetes In Ontario the proportion of people with diabetes rose 69% (from 5.2% to 8.8%) between 1994 and 2005 Major cause of heart attack, kidney failure, blindness, amputation Huge impact on quality of life and health care costs 3
 Ethnicity/race (Aboriginal, Hispanic, South Asian, Asian, African)")
4 What puts you at risk? Age Family history (genes) Ethnicity/race (Aboriginal, Hispanic, South Asian, Asian, African) Income & Education Obesity* (*the most important risk factor for type 2) 4
5 5
6 Some Trends Diabetes higher in neighbourhoods with: Income Immigration levels 6

7 Defying the odds In Toronto, some low-income, high immigration neighbourhoods defy this trend e.g. Moss Park, South Parkdale, Regent Park, North St.Jamestown 7
8 Defying the Odds WHAT S GOING ON IN THESE NEIGHBOURHOODS? 8


9 21 st Century Trends Unhealthy diets Sedentary & inactive lifestylves 9
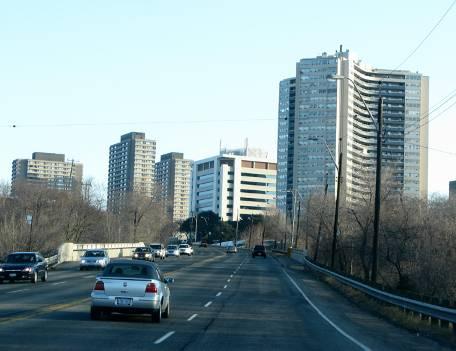
10 Taking a look at Toronto Neighbourhoods 10

11 Income by neighbourhood 30-50, , , , ,000 Data Source: 2001 Census 11 Neighbourhood Environments and Resources for Healthy Living: A Focus on Diabetes in Toronto

12 Visible minorities 7-15% 16-30% 31-45% 46-65% 66-90% Data Source: 2001 Census 12 Neighbourhood Environments and Resources for Healthy Living: A Focus on Diabetes in Toronto


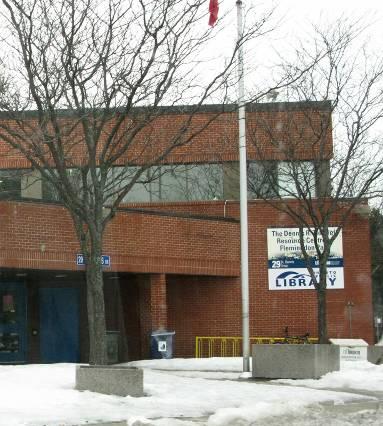
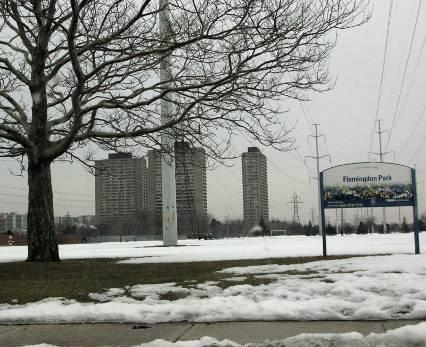
13 Flemingdon Park Immigration & Ethnic Origin Data Source: 2001 Census from Toronto Neighbourhood Profiles, 13
14 Neighbourhood Resources 14
")
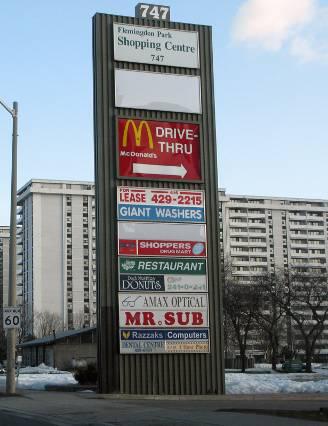
15 Grocery stores, fruit & vegetable stands # outlets per 10,000 population Data source: City of Toronto 2004 Employment Survey, Ontario Food Terminal data (Canadian Urban Institute) 15


16 Locations of fruit & vegetable stands in Flemingdon Park 16 Data source: City of Toronto 2004 Employment Survey, Ontario Food Terminal data (Canadian Urban Institute)

17 Modelled walking time to nearest grocery store or fruit and vegetable stand in minutes, in Toronto,
18 Neighbourhood Structure 18

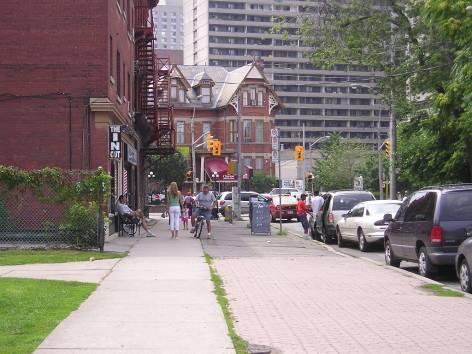
19 How do you define a healthy neighbourhood? 19

20 How old is your neighbourhood? 20
 21 Neighbourhood Environments and Resources for")
21 Average number of cars per household # per household Data Source: 2001 Transportation Tomorrow Survey (University of Toronto, 2001) 21 Neighbourhood Environments and Resources for Healthy Living: A Focus on Diabetes in Toronto


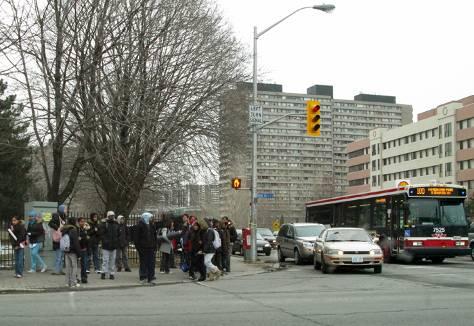
22 Average wait times for TTC vehicles 22
 23 Neighbourhood Environments and Resources for Healthy")
23 Daily transit (TTC) trips per person # trips / person Data Source: 2001 Transportation Tomorrow Survey (University of Toronto, 2001) 23 Neighbourhood Environments and Resources for Healthy Living: A Focus on Diabetes in Toronto

24 Bike routes and average number of biking trips per 1000 persons 24
25 Putting it all together Do more neighbourhood resources that encourage physical activity = more physical activity? Let s Find Out 25

26 How activity-friendly is your neighbourhood? Neighbourhood Features: more people more stores stores closer to your home fewer cars less crime 26
 5.")
27 Activity-Friendly Index Components of Healthy Resources Index: 1. Car ownership (reversed) 2. Population /km2 of residential area 3. Retail services per 10K population 4. Crime per 100K of MaxPop (reversed) 5. Ave distance from residential points to the nearest 5 services (reversed) 27
 28 Neighbourhood Environments and Resources for Healthy")
28 Daily walking/biking trips per person # trips / person Data Source: 2001 Transportation Tomorrow Survey (University of Toronto, 2001) 28 Neighbourhood Environments and Resources for Healthy Living: A Focus on Diabetes in Toronto
29 Putting it all together II Is Neighbourhood Activity Friendliness Related to Diabetes? 29

30 Spatial relationship: diabetes and AFI High DM rates High DM rates Low DM rates Low DM rates Lower AFI score Higher AFI score Higher AFI score Lower AFI score Neighbourhood Environments and Resources for Healthy Living: A Focus on Diabetes in Toronto 30

31 Diabetes rates 1 2, North St. Jamestown 2 Moss Park 3 Regent Park 4 South Parkdale % % % % % Data Source: Ontario Diabetes Database 31 Neighbourhood Environments and Resources for Healthy Living: A Focus on Diabetes in Toronto
32 Key Finding # 1 Diabetes rates are highest in areas that have: lower income levels a higher proportion of visible minorities high immigration rates 32
33 Key Finding # 2 High diabetes areas tend to be outside of downtown and have generally worse: access to resources activity friendliness 33
34 Key Finding # 3 Neighbourhoods are affected differently: Downtown high risk areas have lower diabetes rates than expected Wealthy areas have low diabetes rates, no matter their access to resources or activity friendliness 34
35 Implications Make communities more activity friendly Reduce our dependence on cars Promotion of healthy lifestyles must go hand-in-hand with neighbourhood resources and opportunities Improve public transit in under-served areas Prioritize high risk neighbourhoods 35
36 Team Rick Glazier and Gillian Booth, Editors Peter Gozdyra, Geographer Marisa Creatore, Epidemiologist Anne-Marie Tynan, Coordinator Students: Kelly Ross, Jonathan Weyman, Amanda Maze 36
37 Support St. Michael s Hospital BMO Financial Institute for Clinical Evaluative Sciences 37
38 Resources Neighbourhood Environments and Resources for Healthy Living: A Focus on Diabetes in Toronto Also available at: And 38
39 Key Findings: Neighbourhood Resources Many high diabetes areas have long walking times (> 20 mins each way) to: Stores that sell healthy foods Recreation spaces Parks & schoolyards Don t know what to do with this it was suggested that (current) slides 39 and 40 replace slides 32, 33, and 34 Areas of the city with the highest diabetes rates have lower access to family physicians and diabetes programs 39
40 Key Findings: Promoting healthy lifestyle Areas of the city with the highest diabetes rates have among the lowest rates of walking or biking and public Don t transit know use what to do with this it was suggested that (current) slides 39 and 40 replace slides 32, 33, and 34 Areas of the city with the highest diabetes rates have lower AFI scores (ie. less activity friendly: diabetes) 40

41 Socioeconomic status by neighbourhood Data Source: 2001 Census from Toronto Neighbourhood Profiles, 41

42 Modelled transit time to the nearest diabetes education program in minutes, in Toronto,

43 Percent of people physically inactive [ ] 43

44 Average walking time to the nearest TTC route 44

45 Average walking time to the nearest TTC route and average wait times for TTC vehicles 45
46 Key Finding: Multiple Risks Many neighbourhoods with high diabetes rates and low AFI also have high proportions of low income and visible minority populations 46

47 Association between walking/biking patterns and presence of high/low diabetes rates High DM Lower % walking High DM Higher % walking Low DM Lower % walking Low DM Higher % walking Neighbourhood Environments and Resources for Healthy Living: A Focus on Diabetes in Toronto 47
48 Key Finding # 3 Areas of the city with the highest diabetes rates have among the lowest rates of walking or biking and transit use They also score low on our measure of activity friendliness 48
Diabetes: Where You Live Matters! What You Need to Know About Diabetes in Toronto Neighbourhoods
 Diabetes: Where You Live Matters! What You Need to Know About Diabetes in Toronto Neighbourhoods 1 Tonight s Presenters Rick Glazier, MD Centre for Research on Inner City Health, St. Michael s Hospital
Public health approaches to measuring the urban built environment and its effects on health: A focus on diabetes.
 Public health approaches to measuring the urban built environment and its effects on health: A focus on diabetes. Gillian Booth Marisa Creatore Li Ka Shing Knowledge Institute, St. Michael s Hospital Institute
Burden of Illness. Chapter 3 -- Highlights Document ONTARIO WOMEN'S HEALTH EQUITY REPORT
 Burden of Illness Chapter 3 -- Highlights Document A primary objective of the POWER (Project for an Ontario Women's Health Report) Study is to develop a tool that can be used to improve the health and
The association of the built environment with how people travelled to work in Halton Region in 2006:
 The association of the built environment with how people travelled to work in Halton Region in 2006: a geographical area level analysis Halton Region Health Department September 25 2014 Author Fabio Cabarcas,
STAFF REPORT ACTION REQUIRED. Diabetes Prevention Strategy SUMMARY. Date: November 8, Board of Health. To: Medical Officer of Health.
 STAFF REPORT ACTION REQUIRED Diabetes Prevention Strategy Date: November 8, 2011 To: From: Wards: Board of Health Medical Officer of Health All Reference Number: SUMMARY Type 2 diabetes is a major public
FRUIT AND VEGETABLE CONSUMPTION LESS THAN FIVE TIMES PER DAY
 FRUIT AND VEGETABLE CONSUMPTION LESS THAN FIVE TIMES PER DAY KEY MESSAGES In 2011/2012, 60% of Peel residents reported eating fruits and vegetables less than five times per day. This is similar to Ontario
Lesson 1.1 PREVIEWING THE COURSE AND THE OVERALL SOCIETAL CONTEXT
 Lesson 1.1 PREVIEWING THE COURSE AND THE OVERALL SOCIETAL CONTEXT ~ ~ ~ TOPICS COVERED IN THIS LESSON (a) Is This the Right Course for You? (b) Inactivity & Obesity: Causes, Risks, and Costs 2015 Thompson
Burden of Illness Chapter 3
 Burden of Illness Chapter 3 Arlene S. Bierman, Farah Ahmad, Jan Angus, Richard H. Glazier, Mandana Vahabi, Cynthia Damba, Janice Dusek, Susan K. Shiller, Yingzi Li, Stephanie Ross, Gabriel Shapiro, Douglas
Wellness County Profile ROGERS
 Wellness County Profile 2018 ROGERS OKLAHOMA MAPS This image cannot currently be displayed. ROGERS Insurance Coverage Population 91,766 Unemployment Rate (2013-2015) High School Dropouts: Class
Wellness County Profile STEPHENS
 Wellness County Profile 2018 STEPHENS OKLAHOMA MAPS STEPHENS Insurance Coverage Population 44,090 Unemployment Rate (2013-2015) High School Dropouts: Class of 16 Uninsured Insured 15.9% Stephens
Wellness County Profile JOHNSTON
 Wellness County Profile 2018 JOHNSTON OKLAHOMA MAPS JOHNSTON Insurance Coverage Population 11,087 Unemployment Rate (2013-2015) High School Dropouts: Class of 16 Uninsured Insured 19.1% Johnston
Wellness County Profile CRAIG
 Wellness County Profile 2018 CRAIG OKLAHOMA MAPS CRAIG Insurance Coverage Population 14,625 Unemployment Rate (2013-2015) High School Dropouts: Class of 16 Uninsured Insured 18.1% Craig 5.6
CREATING HEALTHY INNER CITIES
 CREATING HEALTHY INNER CITIES For men, women and children living in inner cities, life can be isolating. As Toronto s Urban Angel, St. Michael s Hospital reaches out and helps those most in need. As the
Wellness County Profile GARFIELD
 Wellness County Profile 2018 GARFIELD OKLAHOMA MAPS GARFIELD Insurance Coverage Population 62,603 Unemployment Rate (2013-2015) High School Dropouts: Class of 16 Uninsured Insured 16.5% Garfield
Wellness County Profile GARVIN
 Wellness County Profile 2018 GARVIN OKLAHOMA MAPS GARVIN Insurance Coverage Population 27,838 Unemployment Rate (2013-2015) High School Dropouts: Class of 16 Uninsured Insured 16.7% Garvin
Wellness County Profile BECKHAM
 Wellness County Profile 2018 BECKHAM OKLAHOMA MAPS BECKHAM Insurance Coverage Population 22,519 Unemployment Rate (2013-2015) High School Dropouts: Class of 16 Uninsured Insured 15.2% Beckham
Wellness County Profile SEMINOLE
 Wellness County Profile 2018 SEMINOLE OKLAHOMA MAPS SEMINOLE Insurance Coverage Population 25,207 Unemployment Rate (2013-2015) High School Dropouts: Class of 16 Uninsured Insured 18.9% Seminole
Wellness County Profile SEQUOYAH
 Wellness County Profile 2018 SEQUOYAH OKLAHOMA MAPS SEQUOYAH Insurance Coverage Population 41,294 Unemployment Rate (2013-2015) High School Dropouts: Class of 16 Uninsured Insured 18.1% Sequoyah
Wellness County Profile PAYNE
 Wellness County Profile 2018 PAYNE OKLAHOMA MAPS PAYNE Insurance Coverage Population 81,131 Unemployment Rate (2013-2015) High School Dropouts: Class of 16 Uninsured Insured 15.6% Payne 3.9
Wellness County Profile MCCLAIN
 Wellness County Profile 2018 MCCLAIN OKLAHOMA MAPS McCLAIN Insurance Coverage Population 38,682 Unemployment Rate (2013-2015) High School Dropouts: Class of 16 Uninsured Insured 15.3% McClain
Seniors Health in York Region
 Seniors Health in York Region Seniors in York Region are generally healthy York Region is set to experience tremendous growth in its seniors population. A Profile of Baby Boomers and Seniors in York Region,
Data Sources & Issues for Health Inequalities Research. J. Dunn
 Data Sources & Issues for Health Inequalities Research J. Dunn Background & Introduction major challenge to find secondary data sources that are compatible with research questions in many instances, data
The following are recommendations to help public health better address seniors health.
 Public Health Mandate There is only one provincial requirement specifically targeted for seniors. It currently addresses falls in the elderly. Peel Public Health also addresses medication use through a
EXPOSURE TO SECOND-HAND SMOKE IN THE HOME KEY MESSAGES
 EXPOSURE TO SECOND-HAND SMOKE IN THE HOME KEY MESSAGES In Peel, 3% of residents are exposed to second-hand smoke in their home daily or almost daily. The proportion has declined significantly since 2003
Chapter 9. Key issues. and Opportunities. Richard H. Glazier. Gillian L. Booth
 Chapter 9 Key issues and Opportunities AUTHORS Richard H. Glazier Gillian L. Booth 224 Key Issues Context Peel region is the second fastest growing region in the Greater Toronto Area (GTA). Compared with
STAFF REPORT ACTION REQUIRED. Diabetes Prevention Strategy SUMMARY. Date: June 4, Board of Health. To: Medical Officer of Health.
 Diabetes Prevention Strategy Date: June 4, 2013 STAFF REPORT ACTION REQUIRED To: From: Wards: Board of Health Medical Officer of Health All Reference Number: SUMMARY Type 2 diabetes is a serious chronic
CHAPTER 2: Mental health and perception of diabetes
 CHAPTER 2: Mental health and perception of diabetes There is a strong link between diabetes and mental health challenges. Both the diagnosis of diabetes and the demands of diabetes management often lead
EVER HAD A FLU SHOT KEY MESSAGES
 EVER HAD A FLU SHOT KEY MESSAGES In Peel in 2011/2012, 58% of the population aged 12 years and older received a seasonal flu shot in the past year. This was significantly lower than Ontario (63%). There
Santa Clara County Highlights
 Santa Clara County Highlights Data and Partnerships: Pivotal Elements to Create Healthy Communities November 6th, 2009 David Hill, PhD, MPH Cities of Santa Clara County 2 The pivotal elements Data evidence-based
Durham Region. Neighbourbood Profile
 1 Description: The Region of Durham is situated in the highly developed and populated economic centre of s Golden Horseshoe which stretches from Oshawa to Niagara Falls. lies immediately to the east of
Health Risk Reduction. Printable Materials
 Health Risk Reduction Printable Materials Activity C: Activity Cards Activity Card #1 High Cholesterol About High Cholesterol High cholesterol is one of the major risk factors for heart disease. Decreasing
Type 2 Diabetes Prevention. By: Montano Labadia And Mary Rose Cairel
 Type 2 Diabetes Prevention By: Montano Labadia And Mary Rose Cairel Diabetes is the abnormally high occurrence of sugar in your blood, which is known as having a high blood glucose level The insulin in
CHAPTER 3: Modifiable risk factors and diabetes self-care
 CHAPTER 3: Modifiable risk factors and diabetes self-care Diabetes is caused by a number of genetic, environmental and biological factors, many of which are not within an individual s control, such as
Danielle M Nash, Dr. Jason A Gilliland, Dr. Susan E Evers, Dr. Piotr Wilk & Dr. M Karen Campbell. JNEB Journal Club November 3, 2014
 Danielle M Nash, Dr. Jason A Gilliland, Dr. Susan E Evers, Dr. Piotr Wilk & Dr. M Karen Campbell JNEB Journal Club November 3, 2014 Presentation Overview Background Objective/ Rationale Methods Prenatal
PINELLAS HIGHLIGHTS DIET & EXERCISE
 PINELLAS HIGHLIGHTS DIET & EXERCISE DIET & EXERCISE Diet is not simply a matter of discipline. Access and the ability to afford healthy food play a role in food selection. Without enough income or proper
Introduction to the HIA Process. What makes us healthy? What is HIA? How is HIA done?
 Introduction to the HIA Process What makes us healthy? What is HIA? How is HIA done? Source: Lots to Lose: How America s Health and Obesity Crisis Threatens our Economic Future (2012) $4,000 4 Years Social
NEAR-ROADWAY AIR POLLUTION AND CHILDHOOD ASTHMA Challenges for Policy Makers
 NEAR-ROADWAY AIR POLLUTION AND CHILDHOOD ASTHMA Challenges for Policy Makers Rob McConnell Director, Southern California Children s Environmental Health Center Children s Health Study Communities CHILDREN
Diabetes. What you need to know
 Diabetes What you need to know Please visit the UHN Patient Education website for more health information: www.uhnpatienteducation.ca 2016 University Health Network. All rights reserved. This information
Dietary Behaviors, Perceptions, and Barriers for Patients At-Risk for Type 2 Diabetes Mellitus at the Frank Bryant Health Center
 Dietary Behaviors, Perceptions, and Barriers for Patients At-Risk for Type 2 Diabetes Mellitus at the Frank Bryant Health Center Mary Hoang CommuniCare Health Centers San Antonio, TX Introduction 14% of
Equity, Opportunity and Good Health: How Transportation affects the Essential Qualities of Life in Metro Vancouver SFU City Program Public Lecture 30
 Equity, Opportunity and Good Health: How Transportation affects the Essential Qualities of Life in Metro Vancouver SFU City Program Public Lecture 30 th April 2015 Jat Sandhu MPH MSc PhD Principal Investigator,
Patient Reported Outcomes: Unpacking Quality Measures Andrew L Brickman, PhD Richard Taaffe, Discussant, CEO WHCHC June 23, 2018
 Patient Reported Outcomes: Unpacking Quality Measures Andrew L Brickman, PhD Richard Taaffe, Discussant, CEO WHCHC June 23, 2018 1 Are patient reported outcomes a new thing? Is this the next shiny object?
HEALTH SURVEILLANCE INDICATORS: LUNG CANCER. Public Health Relevance. Highlights.
 HEALTH SURVEILLANCE INDICATORS: LUNG CANCER Public Health Relevance Lung cancer is one of the top three most commonly diagnosed cancers among both males and females. Lung cancer has a very low survival
Who is TOD in Metro Denver? April Employee Survey Report. Appendix C: Responses to Survey Questions by Business Type
 Who is TOD in Metro Denver? April 2010 Benchmarking the Evolution of TOD in Metro Denver Employee Survey Report Appendix C: Responses to Survey Questions by Business Type DRCOG Who is TOD in Metro Denver?
In Health Matters, Place Matters - The Health Opportunity Index (HOI) Virginia Department of Health Office of Health Equity
 Virginia Department of Health Office of Health Equity") In Health Matters, Place Matters - The Health Opportunity Index (HOI) Virginia Department of Health Office of Health Equity 1 Identifying the Problem America s Health Rankings United Health Foundation
In Health Matters, Place Matters - The Health Opportunity Index (HOI) Virginia Department of Health Office of Health Equity 1 Identifying the Problem America s Health Rankings United Health Foundation
Cigarette smoking is the number one cause of preventable death and disease in Ontario. Smoking kills half of its long-term users.
 HEALTH SURVEILLANCE INDICATORS: SMOKING Public Health Relevance Cigarette smoking is the number one cause of preventable death and disease in Ontario. Smoking kills half of its long-term users. Smoking
learn live work Healthy Eating & Active Living Initiatives
 Healthy Eating & Active Living Initiatives live work learn & play Christina Goette, MPH Community Health Equity & Promotion Branch Population Health Division San Francisco Department of Public Health December
A Multilevel Analysis of Neighbourhood Built and Social Environments and Adult Self-Reported Physical Activity and Body Mass Index in Ottawa, Canada
 Int. J. Environ. Res. Public Health 2011, 8, 3953-3978; doi:10.3390/ijerph8103953 Article OPEN ACCESS International Journal of Environmental Research and Public Health ISSN 1660-4601 www.mdpi.com/journal/ijerph
Smoking Status and Body Mass Index in the United States:
 Smoking Status and Body Mass Index in the United States: 1996-2000 Jun Yang, MD, PhD and Gary Giovino, PhD Roswell Park Cancer Institute Elm and Carlton Streets Buffalo, NY 14263, USA Society for Research
Community Impact Through Data-Driven Action Teams
 Community Impact Through Data-Driven Action Teams Who is in the room? The Heart of New Ulm Project What if we could eliminate heart attacks in an entire community? New Ulm Primary Objective Improve the
Overweight and Obesity Factors Contributing to Obesity
 National Center for Chronic Disease Prevention and Health Promotion Home About Us Site Map Visitor Survey Contact Us Overweight and Obesity Factors Contributing to Obesity Biological, Behavioral, and Environmental
ParkScore. Youth Physical Activity. Outdoor Spaces & Buildings
 ParkScore Borrowed from the Trust for Public Land's framework, this index measures how well cities are meeting the community s park needs. Higher scores indicate better availability of and access to quality
1. Heavy drinking amongst adults in Toronto remained fairly stable from 2007 to 2014.
 HEALTH SURVEILLANCE INDICATORS: HEAVY DRINKING EPISODES Public Health Relevance 'Frequent heavy drinking episodes' is defined in this report as having five or more alcoholic drinks on one occasion once
SPARTANBURG COUNTY BODY MASS INDEX (BMI) REPORT
 REPORT") SPARTANBURG COUNTY BODY MASS INDEX (BMI) REPORT 1 st, 3 rd, and 5 th GRADE STUDENTS SCHOOL YEAR 2013-2014 2 CHILDHOOD OBESITY TASK FORCE ADVISORY COMMITTEE PARTNERS 3 4 TABLE OF CONTENTS Preface.. 4 Project
SPARTANBURG COUNTY BODY MASS INDEX (BMI) REPORT 1 st, 3 rd, and 5 th GRADE STUDENTS SCHOOL YEAR 2013-2014 2 CHILDHOOD OBESITY TASK FORCE ADVISORY COMMITTEE PARTNERS 3 4 TABLE OF CONTENTS Preface.. 4 Project
Improving Public Health with Healthy Food Environments
 www.ncceh.ca Improving Public Health with Healthy Food Environments Tina Chen, MPH, CPHI(C) Environmental Health and Knowledge Translation Scientist Project Collaborator: Ellen Gregg, Public Health Nutritionist,
BUILT ENVIRONMENT ACCESS TO HEALTHY FOODS
 Importance Definitions The environment in which we live often shapes the choices we make. If our built environment offers mainly fast food restaurants and liquor stores and we have limited transportation,
Data for Healthy Insights
 Data for Healthy Insights South Carolina Association for Community Economic Development (SCACED) and MITRE Partnership Funded by the Robert Wood Johnson Foundation 2016 The MITRE Corporation. ALL RIGHTS
Urban Development Neighbourhood Characteristics
 Urban Development Neighbourhood Characteristics Background The purpose of this health indicator report is to provide information on how adults aged 18 and over living in Halton Region rate their neighbourhood
The Influence of the Built Environment on Obesity in Oregon
 The Influence of the Built Environment on Obesity in Oregon Daniel Morris, MS, PhD OPHA 68 th Annual Meeting and Conference October 8, 2012 Obesity Diabetes Chauncy Morlan (1869-1906) modeledbehavior.com
601 TAMALPAIS DRIVE CORTE MADERA, CA
 6,477 SF Retail Available for Lease Conceptual Elevation Existing Stand-Alone Retail Opportunity John Cumbelich & Associates is pleased to present this rare, stand-alone retail opportunity in the heart
Food environments and obesity - neighbourhood or nation?
 Food environments and obesity - neighbourhood or nation? Dr Steven Cummins Department of Geography Queen Mary, University of London, UK Center for Social Epidemiology & Population Health, University of
Arizona health survey special Issue. Influence of Community, the Built Environment and Individual Behavior on Weight and Obesity among Arizona Adults
 Arizona health survey special Issue Prepared by Li Zhu,Ph.D., Arizona State U nive rsity Influence of Community, the Built Environment and Individual Behavior on Weight and Obesity among Arizona Adults
Healthy Montgomery Obesity Work Group Montgomery County Obesity Profile July 19, 2012
 Healthy Montgomery Obesity Work Group Montgomery County Obesity Profile July 19, 2012 Prepared by: Rachel Simpson, BS Colleen Ryan Smith, MPH Ruth Martin, MPH, MBA Hawa Barry, BS Executive Summary Over
Am I at Risk for Type 2 Diabetes?
 Am I at Risk for Type Diabetes? Taking Steps to Lower Your Risk of Getting Diabetes On this page: What is type diabetes? Can type diabetes be prevented? What are the signs and symptoms of type diabetes?
PROFILE OF CURRENT SMOKERS KEY MESSAGES
 PROFILE OF CURRENT SMOKERS KEY MESSAGES In Peel in 2011/2012, 14% of the population or 162,500 people were current smokers. In 2011/2012, the proportion of current smokers was significantly lower in Peel
HEALTH SURVEILLANCE INDICATORS: COLORECTAL CANCER. Public Health Relevance. Highlights
 HEALTH SURVEILLANCE INDICATORS: COLORECTAL CANCER Public Health Relevance Colorectal cancer is the third most diagnosed cancer in Ontario. It is the second leading cause of cancer mortality in Ontario
Submission to Standing Committee on Health. With no leadership, Canada s diabetes crisis will continue to get worse
 Submission to Standing Committee on Health With no leadership, Canada s diabetes crisis will continue to get worse Diabetes Canada May 23, 2018 Overview Diabetes Canada is very proud to represent the estimated
Center for Urban Initiatives and Research Wisconsin Public Health Survey December 2011 N=626. Frequency Tables (Weighted)
") Center for Urban Initiatives and Research Wisconsin Public Health Survey December 2011 N=626 Tables (Weighted) Section 1: Opinions about chronic disease, health care funding, and chronic disease-related
Center for Urban Initiatives and Research Wisconsin Public Health Survey December 2011 N=626 Tables (Weighted) Section 1: Opinions about chronic disease, health care funding, and chronic disease-related
Your Community in Profile: Halton-Peel
 Your Community in Profile: Halton-Peel Peel Halton Building healthy and vibrant communities The Ontario Trillium Foundation is an agency of the Government of Ontario. Table of Contents Introduction...4
Cost to Healthcare, Disease Prevention, Encouraging Lifestyle Modification
 Multicultural Marketing National Conference Cost to Healthcare, Disease Prevention, Encouraging Lifestyle Modification Felicia Wade, M.D. October 17, 2014 Product description The Pocket 5 A Guide to Healthy
Featured Topic: Alzheimer s (5 slides)
") Featured Topic: Alzheimer s (5 slides) The Rise of Alzheimer s Disease Mild memory problem: where did I put my car keys? Alzheimer s: what am I supposed to do with these keys? Scary Statistics: Between
Featured Topic: Alzheimer s (5 slides) The Rise of Alzheimer s Disease Mild memory problem: where did I put my car keys? Alzheimer s: what am I supposed to do with these keys? Scary Statistics: Between
Canada: Equitable Cancer Care Access and Outcomes? Historic Observational Evidence: Incidence Versus Survival, Canada Versus the United States
 Canada: Equitable Cancer Care Access and Outcomes? Historic Observational Evidence: Incidence Versus Survival, Canada Versus the United States This work is funded by the: Canadian Institutes of Health
Diabetes. What is it and how can we prevent it? - Brigette Pereira and Natalie Wowk- Slukynsky, First Nations and Inuit Health Branch
 Diabetes What is it and how can we prevent it? - Brigette Pereira and Natalie Wowk- Slukynsky, First Nations and Inuit Health Branch What is Diabetes? Diabetes is a disease where your body is not able
Population Characteristics
 The St. Vital Community Area (CA) is one of 12 community areas (CAs) in the Winnipeg Health Region (WHR). A population health profile has been generated for the St. Vital CA in order to identify its key
Diabetes is a condition with a huge health impact in Asia. More than half of all
 Interventions to Change Health Behaviors and Prevention Rob M. van Dam, PhD Diabetes is a condition with a huge health impact in Asia. More than half of all people with diabetes live today in Asian countries,
A Summary Report: 2003
 D iabetes in Idaho A Summary Report: 2003 Idaho Department of Health and Welfare Division of Health Bureau of Community and Environmental Health This publication was supported by Grant No. U32/CCU022691-02
Majority think marijuana dispensaries should be allowed in Toronto
 lbozinoff@ 4.. FOR IMMEDIATE RELEASE Majority think marijuana dispensaries should be allowed in Toronto March rd, 0 One tenth have dispensary in the neighbourhood HIGHLIGHTS: March rd - In a random sampling
County Health Rankings Baldwin County 2016 Graphics of County Health Rankings Include All Counties In the North Central Health District
 Health Rankings Baldwin 2016 Graphics of Health Rankings Include All Counties In the North Central Health District Public Health for Middle Georgia Serving Baldwin, Bibb, Crawford, Hancock, Houston, Jasper,
Some college. Native American/ Other. 4-year degree 13% Grad work
 Access to Affordable Health Care Access to affordable care improves quality of life and health outcomes. Without affordable access to a doctor, residents are more likely to end up in expensive emergency
To: Mayor and Council From: Christina Vugteveen, Business Analyst Subject: Healthy Abbotsford Partnership and Healthy Community Strategies
 ABBOTSFORD Report No. PRC 35-2011 September 9, 2011 File No: 8020-20 COUNCIL REPORT Executive Committee To: Mayor and Council From: Christina Vugteveen, Business Analyst Subject: Healthy Abbotsford Partnership
Healthy Eating, Active Living and Healthy Weights, 2012
 Healthy Eating, Active Living and Healthy Weights, 2012 Health Status Report Ottawa Public Health May 2012 ottawa.ca/health 613-580-6744 TTY: 613-580-9656 ACKNOWLEDGEMENTS ACKNOWLEDGEMENTS This report
Prediabetes 101. What is it and what can I do about it? Intermountainhealthcare.org/diabetes
 Prediabetes 101 What is it and what can I do about it? Patient Education Intermountainhealthcare.org/diabetes What do you already know about prediabetes? Fact or Fiction? There are often no symptoms of
Healthy People, Healthy Communities
 Healthy People, Healthy Communities Public Health Policy Statements on Public Health Issues The provincial government plays an important role in shaping policies that impact both individual and community
County Health Rankings Monroe County 2016
 Health Rankings Monroe 2016 Graphics of Health Rankings Include All Counties In the North Central Health District Public Health for Middle Georgia Serving Baldwin, Bibb, Crawford, Hancock, Houston, Jasper,
Leicester: A city that doesn t do things by halves
 Leicester: A city that doesn t do things by halves Cities Changing Diabetes The Cities Changing Diabetes is a programme initiated by Novo Nordisk in response to the fact that over 415 million people worldwide
Pediatric algorithm for children at risk for obesity
 Pediatric algorithm for children at risk for obesity NUTRITION, PHYSICAL ACTIVITY, AND SCREEN TIME Integrating nutrition, physical activity, and screen time messages into the clinic visit is important
Obesogenic retail food environments around more and less socioeconomically deprived schools in New Zealand: a national study
 Obesogenic retail food environments around more and less socioeconomically deprived schools in New Zealand: a national study Dr. Stefanie Vandevijvere WPHNA Conference, Capetown, 01/09/2016 POPULATIONS
Physical and Mental Health
 CHAPTER FIVE Physical and Mental Health This chapter provides gender-based analyses of Manitoba women s health status for physical and mental health indicators. The evidence demonstrates how women s living
The Battle against Non-communicable Diseases can be won IA.. Lidia Belkis Archbold Health Ministries - IAD
 The Battle against Non-communicable Diseases can be won IA.. Lidia Belkis Archbold Health Ministries - IAD Non-communicable diseases (NCDs), also known as chronic diseases are not transmitted from person
Diabetes in Manitoba: Trends among Adults
 Diabetes Among Adults in Manitoba (1989-2013) Diabetes in Manitoba: Trends among Adults 1989-2013 1989-2013 Epidemiology & Surveillance Active Living, Population and Public Health Branch Manitoba Health,
Active Lifestyle, Health, and Perceived Well-being
 Active Lifestyle, Health, and Perceived Well-being Prior studies have documented that physical activity leads to improved health and well-being through two main pathways: 1) improved cardiovascular function
Obesity in the Latino Community. Michael A. Rodriguez, MD, MPH UCLA Department of Family Medicine
 Obesity in the Latino Community Michael A. Rodriguez, MD, MPH UCLA Department of Family Medicine Obesity Trends* Among U.S. Adults BRFSS, 1985 (*BMI 30, or ~ 30 lbs overweight for 5 4 woman) No Data
Table of Contents. 2 P age. Susan G. Komen
 RHODE ISLAND Table of Contents Table of Contents... 2 Introduction... 3 About... 3 Susan G. Komen Affiliate Network... 3 Purpose of the State Community Profile Report... 4 Quantitative Data: Measuring
Making the Invisible Visible June 2016
 Making the Invisible Visible June 2016 TRUE OR FALSE? Heart disease is the single biggest killer of Australian women TRUE Three times as many women die of heart disease than they do of cancer EVERY DAY
Priority #1: Walkability and Bikeability Communities
 Priority #1: Walkability and Bikeability Communities Individual Interpersonal Organizational Community Public Policy Active Halton Fair Guide Active Minds Active Bodies Active and Safe Routes to Bike Helmet
Spring Seminar Series. February 5, 2013 Hunger and Obesity: A Continuing Conundrum
 Spring Seminar Series February 5, 2013 Hunger and Obesity: A Continuing Conundrum Amy Yaroch, PhD Executive Director, Gretchen Swanson Center for Nutrition About the Gretchen Swanson Center for Nutrition
Burden Of Obesity and Physical Inactivity A Report on Obesity and Related Morbidity and Mortality and Physical Inactivity in La Crosse County
 Burden Of Obesity and Physical Inactivity A Report on Obesity and Related Morbidity and Mortality and Physical Inactivity in La Crosse County 2009 Prepared for the Pioneering Healthy Communities Healthy
ACCESS & AFFORDABILITY IN PUBLIC HEALTH POLICY TO INCREASE ADHERENCE OF CANCER PREVENTION GUIDELINES
 ACCESS & AFFORDABILITY IN PUBLIC HEALTH POLICY TO INCREASE ADHERENCE OF CANCER PREVENTION GUIDELINES Jessica Jacobson ABSTRACT: Children residing in low income, food insecure neighborhoods are faced with
african caribbean your GuiDe to preventing type 2 Diabetes
 african caribbean your GuiDe to preventing type 2 Diabetes 1 2 Diabetes prevention starts with you. If you are at risk for developing type 2 diabetes, you should try to delay or prevent it. Type 2 diabetes
Income-related differences in mortality among people with diabetes mellitus
 CMAJ Research -related differences in mortality among people with diabetes mellitus Lorraine L. Lipscombe MD MSc, Peter C. Austin PhD, Douglas G. Manuel MD MSc, Baiju R. Shah MD PhD, Janet E. Hux MD MSc,
How Alcohol Outlets Affect Neighborhood Violence
 Translating Science into Practice How Alcohol Outlets Affect Neighborhood Violence Kathryn Stewart www.resources.prev.org Pacific Institute for Research and Evaluation is one of the nation's preeminent