Hemodynamic Monitoring in the CCU. Edward G. Hamaty Jr., D.O. FACCP, FACOI
|
|
|
- Gloria Greer
- 6 years ago
- Views:
Transcription
1 Hemodynamic Monitoring in the CCU Edward G. Hamaty Jr., D.O. FACCP, FACOI

2 Waveform Review
3 Left Ventricular Pressure Normal left ventricular pressures are: Systolic 100 to 140 mm of mercury End-diastolic 3 to 12 mm of mercury Left ventricular pressure cannot be measured directly using bedside monitoring techniques. Nevertheless, it is possible to accurately estimate the left ventricle or pressure in the following way: -the left ventricular systolic pressure equals the aortic systolic pressure in the absence of left ventricular outflow obstruction. -the left ventricular end diastolic pressure equals the mean wedge pressure in the absence of mitral valve disease.
4 Left Ventricular Pressure The end of left ventricular diastole coincides with the onset of the electrocardiographic QRS complex. Measurement of the left ventricular end diastolic pressure allows the clinician to use the Frank Starling principle to access and manipulate left ventricular performance. Myocardial or pericardial disease significantly alters the relation between left ventricular end diastolic pressure and volume.
5 Left Ventricular Pressure As a rule, cardiac disease causes a decrease in compliance; the result is a higher filling pressure to achieve the same degree of filling volume. At the same time, cardiac disease diminishes the response of left ventricular performance to an increase in the end diastolic pressure. The left ventricular end diastolic pressure for normal hearts is 3 to 12 mm of mercury. With left ventricular disease (acute myocardial infarction, cardiomyopathy), the optimal filling pressure increases to 20 to 25 mm of mercury. The need to maintain a higher left ventricular filling pressure comes with a price since an increase in the diastolic pressure eventually leads to pulmonary congestion.
6 Physiology

7 RA Waveform Review

8 RA Waveform Effect of Respiration

9 Pulmonary Artery/Wedge Waveform Review
10 PAOP Waveform Review The normal wedge pressure is 2-12 mm Hg and is twice the mean right atrial pressure. RA/Wedge = 0.5 The wedge pressure A wave follows the electrocardiographic P wave by 200 msec and represents atrial systole. The A wave magnitude is increased in such conditions as mitral stenosis and left ventricular noncompliance.
11 PAOP Waveform Review The C wave is caused by closure of the mitral valve and marks the onset of left ventricular systole. The C wave is visible in the right atrial pressure recording but is often not seen in the PAOP waveform because of damping.
12 PAOP Waveform Review The V wave represents venous filling of the left atrium when left ventricular systole has closed the mitral valve. In some normal patients, the V wave is the dominant positive wave in the PAOP waveform. Left atrial volume overload from mitral regurgitaion or a ventricular septal defect will magnify the V wave. The peak of the V wave occurs after the T wave of the ECG and is noticeably later than the pulmonary artery systolic wave. This difference in timing is important when interpreting hemodynamic data from patients with a giant V wave.
13 PAOP Waveform Review The X and Y descents follow the A and V waves respectively. The X descent represents left atrial relaxation combined with the sudden downward motion of the atrioventricular junction during early left ventricular systole. Mitral regurgitation can attenuate or obliterate the X descent.
14 PAOP Waveform Review The Y descent is caused by the rapid exit of blood from the left atrium into the left ventricle at the moment of mitral valve opening. The Y descent marks the onset of left ventricular diastole. The Y descent is blunted with mitral stenosis. Coincident with the X and Y descents there is a surge of pulmonary venous return to the left atrium.
15 Clinical Use of the R Atrial Pressure Measurement The mean Right Atrial pressure is used clinically in the following ways: To assess the adequacy of right ventricular filling volume To determine the hydrostatic pressure in the systemic veins The mean right atrial pressure is a reliable measure of the right ventricular end diastolic pressure if significant tricuspid stenosis or regurgitation is absent.
16 Clinical Use of the R Atrial Pressure Measurement In the normal heart measurement of the right atrial pressure can be used to predict the left atrial pressure. In the presence of cardiac disease the right atrial pressure is a poor predictor of the left atrial pressure. Significant cardiac disease mandates measurement of the wedge pressure to assess the left atrial pressure and the left ventricular filling pressure.
17 Clinical Use of the R Atrial Pressure Measurement The mean right atrial pressure provides a measurement of the hydrostatic pressure in the systemic veins. This is an important variable in the formation of peripheral edema. Elevation of the right atrial pressure causes visceral congestion. The right atrial pressure waveform itself produces valuable clinical information.
18 Clinical Use of the R Atrial Pressure Measurement Conditions such as pericardial tamponade, pericardial constriction, right ventricular infarction and tricuspid regurgitation can be suspected by careful analysis of the right atrial pressure waveform. The right atrial pressure waveform is equally valuable in the assessment of cardiac arrhythmias. Finally knowledge of the right atrial pressure relative to the wedge pressure is helpful. Elevations of the right atrial pressure out of proportion to the wedge pressure points to conditions such as pulmonary embolism and right ventricular infarction. (RAP/WP >0.5)
19 Pulmonary Artery Pressure Normal pulmonary artery pressures are: Systolic 15 to 30 mm of mercury Diastolic 4 to 12 mm of mercury Mean 9 to 18 mm of mercury The normal pulmonary artery pulse pressure is approximately 15 mm of mercury. The upstroke of the pulmonary artery pressure waveform reflects the onset of right ventricular ejection. The dicrotic notch is due to pulmonic valve closure and marks the end of right ventricular ejection.

20 Pulmonary Artery Pressure The peak of the pulmonary artery systolic pressure wave occurs within the electrocardiographic T-wave. Note that the peak pulmonary artery systolic pressure wave occurs earlier in time than the peak wedge pressure V wave.
21 Pulmonary Artery Pressure In patients with normal pulmonary artery vascular resistance and no mitral valve obstruction the pulmonary artery diastolic pressure is very close (2-4 mm Hg) to both the mean wedge pressure and to the left ventricular end diastolic pressure. When the pulmonary artery diastolic pressure exceeds the mean wedge pressure by 5 mm of mercury, conditions known to increase pulmonary vascular resistance (for example pulmonary embolism) should be considered.
22 Pulmonary Artery Pressure The pulmonary artery diastolic pressure does not correlate well with the mean wedge pressure in the following situations: Abnormal pulmonary vascular bed. The pulmonary artery diastolic pressure over estimates the mean wedge pressure. Mitral regurgitation with a large V wave. The pulmonary artery diastolic pressure under estimates the mean wedge pressure.
23 Pressure Waveform Analysis The following steps are recommended for proper pressure data and analysis: Check that the pressure transducer has been properly zeroed to the estimated level of the heart. Check the dynamic pressure response of the system using the fast flush test, alternatively a crisp dicrotic notch on the pulmonary artery tracing indicates a properly responsive system. Choose the pressure scale which best accommodates the intracardiac pressure being monitored.
24 Pressure Waveform Analysis Choose an electrocardiographic lead which best illustrates atrial activity. Record the single lead electrocardiogram together with the pressure waveform at a paper speed of 25 mm per second. Include two to four respiratory cycles and measure the intracardiac pressure at end expiration. Identify the A wave and the V wave in the right atrial and the wedge pressure waveforms by drawing a vertical line from the positive pressure waves to the electrocardiogram.
25 Pressure Waveform Analysis Identify the X descent and the Y descent. Assess the effect of spontaneous inspiration on the mean right atrial pressure. If indicated, perform the hepatojugular reflux test while recording the right atrial pressure. Identify the systolic pressure and the diastolic pressure in the pulmonary artery and the aortic pressure waveforms and measure the respective pulse pressures; identify the dicrotic notch on each arterial pressure waveform.
26 Pressure Waveform Analysis Measure the pressure gradient between the pulmonary artery diastolic pressure and the mean wedge pressure. This should be < 5 mm Hg. Measure the ratio of the mean right atrial pressure/mean wedge pressure. Normally this is approximately 0.5.
27 Arrhythmias The mechanical action of the heart is governed by the cardiac rhythm. An arrhythmia will therefore have an immediate impact on hemodynamic parameters. When analyzing this effect, it is important to consider the following: What is the arrhythmia rate? What is the effect of the arrhythmia on coordinated atrial ventricular contraction (A-V synchrony)? Has the arrhythmia compromised the efficiency of atrial or ventricular systole?


28 Sinus Tachycardia With an increase in the heart rate, diastole progressively shortens. As a consequence, the A wave initiating a cardiac cycle begins to encroach on the V wave of the preceding cycle.
29 Sinus Tachycardia Eventually the two waves summate to generate a single wave and the Y descent is obliterated. It is important to remember the influence of a heart rate on the Y descent because pericardial tamponade also causes disappearance of the Y descent. First-degree AV block can cause the A and V ways to summate in the same way as does sinus tachycardia. Therefore both the heart rate and the PR interval must be considered when evaluating the atrial pressure waveforms.
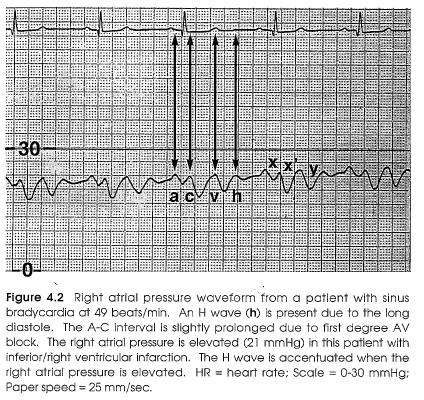
30 Sinus Bradycardia As diastole lengthens during sinus bradycardia, the time interval lengthens between the V wave of one cardiac cycle and the A wave of the next cycle. The Y descent is easily seen. Often an additional positive wave (the H wave) is present after the Y descent when the heart rate is less than 60 beats/min. This wave is most prominent in the right atrial pressure waveform especially when the right atrial pressure is elevated. The origin of the H wave is unclear and is not associated with any mechanical cardiac event.
31 Sinus Bradycardia
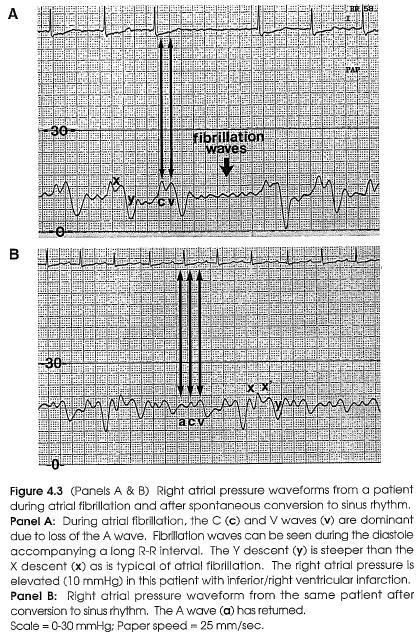
32 Atrial Fibrillation The hallmarks of atrial fibrillation are disappearance of the atrial systole and variation in the length of the diastole. The A wave disappears from the atrial pressure waveform and is sometimes replaced by atrial fibrillation waves. The fibrillation waves are most evident during a long R-R interval. These waves are sometimes visible in the jugular veins and can produce enough mechanical activity to move the mitral and tricuspid valves.
33 Atrial Fibrillation The fibrillation waves are associated with coarse atrial fibrillation on the electrocardiogram. The C and V waves are dominant features of the atrial pressure waveform. The C and V waves are separated by the X descent. The X descent is usually shallower the Y descent
34 Atrial Fibrillation
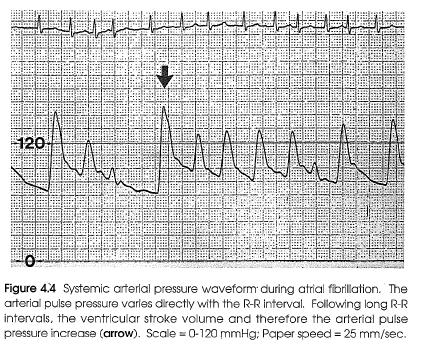
35 Atrial Fibrillation Many patients with atrial fibrillation have coexisting myocardial or pericardial disease and the atrial pressure waveform may also be influenced by these pathological conditions. During atrial fibrillation, the ventricular stroke volume varies directly with the electrocardiographic R-R interval. As a result, the pulse pressure in the aorta and the pulmonary artery will be greatest following a long R-R interval.
36 Atrial Fibrillation
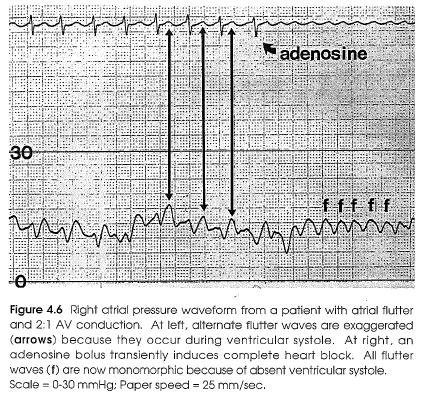
37 Atrial Flutter As with atrial fibrillation, the A wave of the atrial pressure waveform is absent. During atrial flutter, the atria continue to contract at a rate of approximately 300 beats per minute. This mechanical atrial activity generates flutter waves in the atrial pressure waveform. This regular mechanical activity may partly explain why the systemic embolization rate during atrial flutter is lower than during atrial fibrillation.
38 Atrial Flutter In the presence of 2:1 AV block, every other flutter wave often occurs coincident with ventricular systole. The flutter waves occurring during ventricular systole maybe slightly enhanced because the right atrium is contracting against a closed tricuspid valve.

39 Atrial Flutter
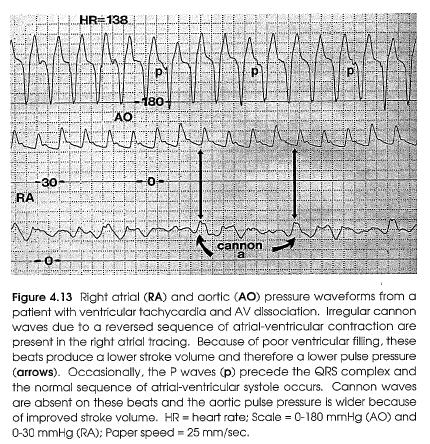
40 Premature Ventricular Contractions A premature ventricular contraction sets the stage for a mechanical cannon wave (Cannon A wave). Cannon waves are the result of an atrial systole occurring when ventricular systole has already closed the mitral and tricuspid valves. That is, atrial and ventricular systole are either simultaneous or reversed from their normal timing sequence.
41 Premature Ventricular Contractions The Cannon wave causes a transient reversal in the normal systemic and pulmonary venous return. The ventricles are not properly filled at the onset of systole. Isolated premature ventricular contractions rarely disturb overall cardiac function. A Cannon wave in the atrial pressure waveform is a helpful marker that the normal sequence of atrial and ventricular systole has been disturbed. Cannon waves can be seen with a variety of arrhythmias.

42 Premature Ventricular Contractions

43 AV Junctional (Nodal) Rhythm During a nodal rhythm, atrial systole can either precede or follow ventricular systole. AV dissociation may also occur. When the sequence of atrial and ventricular systole is reversed, Cannon waves will be present on the atrial pressure waveform.
44 AV Nodal Reentrant Tachycardia Reentry within the AV node is one of the most common causes of paroxysmal supraventricular tachycardia. Each time the electrical impulse travels the reentrant loop, there is retrograde activation of the atria and antegrade activation of the ventricles. In the majority of patients with this arrhythmia, the retrograde P wave occurs either within or after the QRS complex. When ventricular systole is coincident with atrial systole, the A and V waves fuse and Cannon waves occur. The Cannon waves are regular because there is 1:1 AV association.

45 AV Nodal Reentrant Tachycardia
46 AV Nodal Reentrant Tachycardia The Cannon waves also abruptly elevate the right atrial mean pressure. This abrupt increase in right atrial pressure can trigger the release of atrial natriuretic factor and may be responsible for polyuria in some of these patients. The forward stroke volume, aortic systolic blood pressure, and aortic pulse pressure are often reduced during this tachycardia because of the shortened diastole coupled with the loss of the normal atrial contribution to ventricular filling. In some patients, Cannon waves may trigger a vasodepressor reflex further aggravating the fall in blood pressure.
47 AV Nodal Reentrant Tachycardia
48 Automatic Atrial Tachycardia This arrhythmia is due to enhanced atrial automaticity. The atrial rate is usually less than 200 beats per minute and generates rapid regular A waves in the atrial pressure waveform. It is common to observe 2:1 nodal block. In this circumstance, the blocked P wave usually occurs within the QRS-T interval. The A wave of the blocked P wave sums with the V wave of the QRS complex creating a single larger wave. This summation wave does not have the appearance of a typical cannon wave perhaps because it occurs at the very end of ventricular systole near the time when tricuspid and mitral valves opening occur.

49 Automatic Atrial Tachycardia
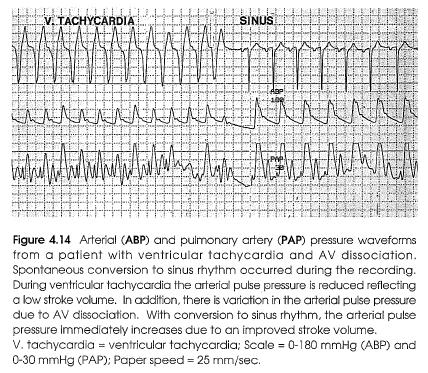
50 Ventricular Tachycardia Ventricular tachycardia arises within the ventricles. Atrial activation occurs either by coexisting sinus rhythm (AV dissociation) or by retrograde VA conduction to the atrial (VA association). The type of atrial electrical activation has an important influence on the hemodynamic consequences of ventricular tachycardia.
51 Ventricular Tachycardia With AV dissociation, the relation between atrial and ventricular systole is random. On some cycles, ventricular systole precedes atrial systole and Cannon waves occur in the atrial pressure waveform. The beats generate a reduced stroke volume and therefore a reduced aortic pulse pressure because of absent atrial filling of the ventricles.
52 Ventricular Tachycardia
53 Ventricular Tachycardia On other cycles, atrial systole precedes ventricular systole (mimicking normal physiology) and Cannon waves are absent on the atrial pressure waveform. These beats generate an improved stroke volume and therefore a higher aortic pulse pressure because each atrial systole augments ventricular filling. Physical examination of these patients reveals irregular cannon waves in the jugular venous pulse as well as a variable carotid artery pulse volume despite a regular cardiac rhythm.
54 Ventricular Tachycardia With 1:1 VA conduction during ventricular tachycardia, the normal sequence of atrial and ventricular contraction is reversed on every cycle. Regular Cannon waves appear in the atrial pressure waveform and the aortic pulse pressure remains constant from beat to beat. In these patients regular Cannon waves are present in the jugular venous pulse and the carotid artery pulse volume is constant.

55 Ventricular Tachycardia
56 Acute Mitral Regurgitation and the V Wave Acute mitral valve regurgitation is a catastrophic event occurring as a result of ruptured chordae tendinae, ruptured papillary muscle, or bacterial destruction of the mitral valve. The severity and time course of the valvular insufficiency both have a major impact on the hemodynamic consequences of acute mitral regurgitation. Chronic mitral regurgitation maybe severe with little or no change in the bedside hemodynamic measurements and will not be discussed.
57 Acute Mitral Regurgitation and the V Wave Wedge pressure and pulmonary artery pressure. With acute mitral valve regurgitation, the left ventricle ejects blood into the left atrium during systole. The left atrium is subjected to an acute volume overload because the high pressure regurgitant volume is added to the normal pulmonary venous return. When the left ventricle is ejecting blood into a normal sized and relatively unyielding left atrium, the wedge pressure (left atrial pressure) rises dramatically during ventricular systole.
58 Acute Mitral Regurgitation and the V Wave Wedge pressure and pulmonary artery pressure. Mitral regurgitation begins with the onset of ventricular systole (marked by the C wave in the PAOP waveform) and continues until the end of systole (marked by the peak of the V wave in the PAOP waveform). The hallmark of acute mitral regurgitation is a giant C-V wave in the wedge pressure tracing. The X descent which normally separates the C wave from the V wave disappears or is attenuated. This C-V wave is therefore commonly referred to as simply the V wave. The large V wave causes a striking increase in the mean wedge pressure. The mean wedge pressure frequently exceeds 25 to 30 mm of mercury resulting in acute pulmonary edema.
59 Acute Mitral Regurgitation and the V Wave
60 Acute Mitral Regurgitation and the V Wave The giant V wave of acute mitral regurgitation may be transmitted retrogradely into the pulmonary artery. This yields a biphasic pulmonary artery systolic waveform composed of the pulmonary artery systolic wave followed shortly by the V wave. As the catheter moves from the pulmonary artery position into the wedge position, the pulmonary artery systolic wave disappears and only the V wave remains.
61 Acute Mitral Regurgitation and the V Wave The wedge pressure V plays may be so striking as to resemble the pulmonary artery systolic pressure waveform and the operator may not realize that the catheter has moved from the pulmonary artery into the wedge position. This problem can be avoided by carefully examining the pulmonary artery pressure waveform and its relation to the electrocardiogram. The timing of the peak pulmonary artery systolic way and the peak V wave are significantly different. The pulmonary artery systolic wave occurs at the peak of the electrocardiographic T-wave; the V wave occurs after the T-wave. The transient reversal of pulmonary blood flow that accompanies the giant V wave can result in highly oxygenated blood entering the main pulmonary artery resulting in the mistaken diagnosis of a left to right shunt.
62 Acute Mitral Regurgitation and the V Wave
63 Acute Mitral Regurgitation and the V Wave Cardiac output and aortic pressure: The cardiac output is decreased and shock is frequently present. The left ventricular forward stroke volume is decreased. Sinus tachycardia compensates to some degree for the decreased forward stroke volume. The total left ventricular stroke volume may be normal. The aortic systolic pressure is usually low. The aortic pulse pressure is usually narrow reflecting a decreased left ventricular forward stroke volume.
64 Acute Mitral Regurgitation and the V Wave Cardiac output and aortic pressure: The thermodilution cardiac output method measures the pulmonary blood flow which is the same as the forward flow across the aortic valve. The thermodilution method therefore ignores the volume of blood ejected into the left atrium. This cannot be measured at the bedside with hemodynamic techniques.
65 General comments on the V wave The V wave is a normal finding on the wedge pressure tracing and is often higher than the A wave. Therefore the definition of a large V wave is subjective. Furthermore, a large V wave commonly occurs in conditions other than acute mitral regurgitation. They are often observed with left ventricular failure from any cause (i.e., dilated cardiomyopathy, ischemic cardiomyopathy). These prominent V waves may occur in the absence of significant mitral regurgitation and are usually a marker for a distended and noncompliant left atrium.

66 General comments on the V wave
67 General comments on the V wave An acute ventricular septal defect (complicating myocardial infarction) can cause a large V wave because of the increased pulmonary blood flow and increased pulmonary venous return to the left atrium. It should be apparent that a large V wave in the wedge pressure waveform must be interpreted carefully and in the context of the patient s clinical status. Mitral regurgitation is often a dynamic event and the magnitude of the V wave may therefore vary considerably over time. This is especially true during episodes of acute myocardial infarction.

68 General comments on the V wave The degree of mitral regurgitation is sensitive to left ventricular afterload. Afterload reduction with nitroglycerin or nitroprusside can significantly reduce the amount of mitral regurgitation and the size of the wedge pressure V wave.
69 General comments on the V wave A large V wave disrupts the normal close correlation between the pulmonary artery diastolic pressure and the mean wedge pressure. The pulmonary artery diastolic pressure is a measurement made in a single point in time (end diastole), while the wedge pressure is a mean pressure recorded over the entire cardiac cycle. The peaks and valleys of a normal wedge pressure waveform are minor, therefore the pulmonary artery diastolic pressure usually correlates closely with the mean wedge pressure.
70 General comments on the V wave A large V wave distorts the wedge pressure waveform so that the pulmonary artery diastolic pressure now overestimates the mean wedge pressure. Consequently, the pulmonary artery diastolic pressure cannot be used as an estimate of the mean wedge pressure in the presence of a large V wave. As a corollary to this, a large V leave causes the mean wedge pressure to overestimate the left ventricular end diastolic pressure. For the best estimate of the left ventricular end diastolic filling pressure in the presence of a large V wave, measure the wedge pressure at a single time point (end diastole).
71 General comments on the V wave The end of the wedge pressure A wave (post A wave pressure) coincides with the end of left ventricular diastole. In the presence of a large V wave, measurement of the post A wave wedge pressure allows a reliable estimate of the left ventricular filling pressure.
72 General comments on the V wave For clinical purposes, the mean wedge pressure reflects the hydrostatic force in the pulmonary capillary bed. A large V wave will raise the mean wedge pressure and promote pulmonary edema formation. If the patient s primary problem is respiratory failure due to pulmonary congestion, then the effort should be directed at lowering the mean wedge pressure. On the other hand, if the patient s primary problem is a low cardiac output, attention should be directed at maintaining an adequate left ventricular filling pressure (post A wave pressure in the wedge waveform).
73 Tricuspid Regurgitation Tricuspid regurgitation is a chronic condition caused by a right ventricular failure and dilatation. The right ventricular failure can often be traced to long-standing pulmonary artery hypertension. Tricuspid regurgitation changes the right atrial pressure waveform, raises the right atrial mean pressure, and may invalidate the thermodilution method of measuring cardiac output. Furthermore, advancing the balloon tipped catheter from the right atrium into the right ventricle is often challenging in these patients because of the regurgitant jet of blood.
74 Tricuspid Regurgitation R Atrial Pressure The classic pressure waveform of tricuspid regurgitation is a large broad C-V wave followed by a steep Y descent. The tricuspid valve begins to leak with the onset of right ventricular systole. The onset of right ventricular systole is marked by the C wave in the right atrial pressure waveform. As the tricuspid regurgitation progresses during ventricular systole the right atrial pressure progressively rises.

75 Tricuspid Regurgitation R Atrial Pressure The X descent is therefore attenuated or obliterated. The result is a fusion of the C and V ways into a single broad positive wave (the so called C- V wave).
76 Tricuspid Regurgitation R Atrial Pressure As the degree of tricuspid regurgitation increases, the right atrial C-V wave becomes more accentuated. The C-V wave of tricuspid regurgitation is never as striking as the C-V wave of acute mitral regurgitation because tricuspid regurgitation is a chronic condition that develops gradually. Furthermore, the left ventricle usually generates a much higher pressure than the right ventricle.
77 Tricuspid Regurgitation R Atrial Pressure The Y descent is the dominant feature of the right atrial pressure waveform with significant tricuspid regurgitation. The Y descent is exaggerated because the high pressure within the right atrium is suddenly relieved as the tricuspid valve opens and the right atrial blood volume is delivered to the right ventricle at the beginning of diastole. During inspiration the C-V wave is augmented and the Y descent becomes more pronounced. As a result, the mean right atrial pressure remains constant or may even rise (Kussmaul s sign).

78 Tricuspid Regurgitation R Atrial Pressure The right atrial pressure waveform of tricuspid regurgitation will be modified by the size and dispensability of the right atrium. When the right atrium is very dilated and compliant, the characteristic C-V wave and steep Y descent may be attenuated or even absent despite severe tricuspid regurgitation.
79 Tricuspid Regurgitation R Atrial Pressure In this setting, the characteristic thermodilution cardiac output curve may provide a helpful clue to the presence of significant tricuspid regurgitation. Doppler echocardiography is a particularly useful way to evaluate the severity of tricuspid regurgitation. With tricuspid regurgitation the mean right atrial pressure is elevated. In addition the ratio of right atrial/wedge pressure is increased. (RA/W > 0.5) The right atrial pressure may equal or exceed the wedge pressure, especially when the tricuspid regurgitation occurs in the absence of left heart disease. When the right atrial pressure exceeds the wedge pressure, right to left shunting or paradoxical embolization can occur through a patent foramen ovale.

80 Tricuspid Regurgitation Cardiac Output Significant tricuspid regurgitation invalidates the thermodilution method because a portion of the indicator (cold) warms during its prolonged stay within the right atrium and right ventricle. Significant tricuspid regurgitation produces an easily identifiable thermodilution curve characterized by very slow decay to baseline temperature. The computer will measure the area under this curve and generate a cardiac output number. This measurement is unreliable and should be discarded.
81 Tricuspid Regurgitation Pulmonary Artery Pressure Pulmonary artery hypertension is the rule and may be severe. An important exception to this rule can be observed with a right ventricular infarction where right ventricular dilatation is caused by ischemic injury and not pulmonary hypertension. When present, pulmonary hypertension may be caused by either left heart disease or primary pulmonary hypertension. The wedge pressure may be normal or elevated depending on whether left heart disease is present.
82 Acute Left Ventricular Infarction The hemodynamic consequences of an acute myocardial infarction encompass the entire spectrum. The size and location of the infarction, the mitral valve function, the heart rate and rhythm, and the pre-existing left ventricular function are all variables which influence the hemodynamic measurements. Right ventricular infarction complicating an inferior left ventricle or infarction is associated with unique hemodynamic findings. The hemodynamic abnormalities of acute Left ventricular infarction are confined largely to the wedge pressure, the cardiac index, and the arterial blood pressure.
83 Acute Left Ventricular Infarction The hallmark of acute infarction is a sudden loss of regional myocardial systolic and diastolic dysfunction. This regional contractile dysfunction is compensated by enhanced contraction of available normal myocardium. In the 1970s, investigators reported the relation between infarct size and parameters of left ventricular function.
84 Acute Left Ventricular Infarction Abnormal left ventricular compliance can be measured with an infarction involving only 8% of the left ventricle. When the infarction exceeds 10% of the left ventricle, the ejection fraction is reduced; With a 15% infarction, the left ventricular end diastolic pressure is increased. When the infarct exceeds 25% of the left ventricle, clinically evident congestive heart failure occurs. Cardiogenic shock, the most extreme form of heart failure, appears when acute infarction involves 40% or more of the left ventricle.
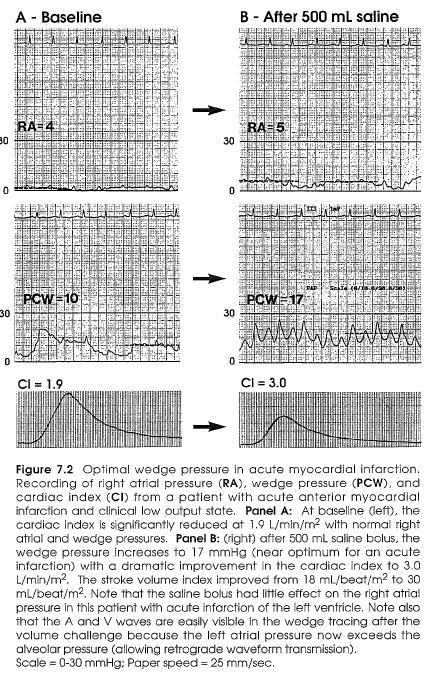
85 Acute Left Ventricular Infarction Hemodynamic consequences of an acute left ventricular infarction are confined mainly to a variable increase in the left ventricular end diastolic pressure and a variable decrease in the stroke volume. Acute infarction alters left ventricular compliance causing a shift in the Frank Starling relationship. Therefore patients with acute myocardial infarction will often require a higher than normal left ventricular end diastolic pressure to achieve optimal stroke volume and cardiac output. In patients with acute infarction, optimal left ventricular stroke volume occurs with a left ventricular and diastolic pressure of 20 to 25 mm Hg.
86 Acute Left Ventricular Infarction The normal close correlation between the mean wedge pressure and the left ventricular end diastolic pressure is disrupted by an acute myocardial infarction. In normal hearts, left atrial systole raises the left ventricular diastolic pressure by only 1 to 2 mm Hg. With acute infarction, left atrial contraction augments the left ventricular diastolic pressures by an average of 8 mm Hg. The several fold increase in the A wave is caused by reduced left ventricular compliance. The mean wedge pressure significantly underestimates the left ventricular end-diastolic pressure (on average by 8-10 mm Hg) because of the large A wave. This fact explains the important observation that the optimal mean wedge pressure for patients with an acute MI is mm Hg which corresponds to a LVEDP of mm Hg.

87 Acute Left Ventricular Infarction

88 Acute Left Ventricular Infarction In patients with a very noncompliant infarction (and a very large A wave), the optimal mean wedge pressure may be below 15 mm Hg. Thus the ideal mean wedge pressure during an acute MI varies with the individual. In critically ill patients, the effect of increasing or decreasing the mean wedge pressure should be carefully assessed by measuring the response of the cardiac output and SV. As a rule, there is little gain in increasing the wedge above mm Hg.

89 Acute Left Ventricular Infarction Forrester, Swan and colleagues described the correlation of hemodynamic measurements with hospital mortality in patients with acute MI. Patients can be triaged into one of four hemodynamic subsets based on measurements of the mean wedge pressure and the cardiac index.
90 Acute Left Ventricular Infarction A depressed CI confers a mortality increase of 5 to 15 fold depending on whether or not the wedge pressure is also increased. Likewise, an increased wedge pressure raises the mortality by 2 to 15 fold depending on whether or not the cardiac index is also decreased. It is important to note that these observations were made prior to the era of emergency reperfusion therapy for acute myocardial infarction.

91 Wedge Pressure and Pulmonary Congestion
92 Cardiac Index and Tissue Perfusion
93 Arterial Blood Pressure The arterial blood pressure is normal in the majority of patients with acute myocardial infarction. It is common to observe moderate hypertension greater than 160/90 mm Hg even in previously normotensive patients due to the sympathetic discharge accompanying myocardial infarction. Hypotension (< 90 mm Hg) does not always signify the presence of cardiogenic shock. Activation of the Bezold-Jarisch reflex may result in profound peripheral vasodilation and hypotension. Stimulation of this reflex is more common in patients with inferior infarction. The reflex can also be stimulated by administration of nitroglycerin. Patients with hypotension mediated by high vagal tone usually appear warm and well perfused. The vagus nerve action also promotes bradycardia in these patients.

94 Arterial Blood Pressure
95 Mechanical Complications of Acute MI Cardiogenic shock carries a mortality exceeding 70% and is the leading cause of hospital death in patients with acute MI. These patients have pathological evidence for infarction involving 40% or more of the LV myocardium. Clinical diagnosis defined by the triad: Hypotension: SBP < 90 mm Hg (prior to inotropic or IABP support) Poor tissue perfusion Pulmonary congestion Forrester Class IV.
96 Intracardiac Pressures in Cardiogenic Shock RA, PA, and PAOP pressures are all elevated. With shock, the ratio of the mean RA pressure to the mean WP is usually 0.5. This ratio will be closer to 1.0 when cardiogenic shock complicates RV infarction. The RA waveform may demonstrate summation of the A and V waves due to pronounced sinus tachycardia.

97 Intracardiac Pressures in Cardiogenic Shock
98 Intracardiac Pressures in Cardiogenic Shock Mean WP is usually elevated to a level that causes clinical pulmonary congestion or overt pulmonary edema. Diagnosis of shock requires that the patient has received adequate volume expansion (mean WP > 12 mm Hg). Remember that optimal cardiac performance occurs with mean WP of mm Hg. The A and V waves are usually of similar magnitude. A large V wave suggest the presence of acute mitral regurgitation.
99 Intracardiac Pressures in Cardiogenic Shock
100 Cardic Index in Cardiogenic Shock Clinical Cardiogenic Shock is associated with a CI < 1.8 liter/m/min. The CI is critically dependent on Heart Rate. It is crucial to examine the SV since a change in CI may be caused simply by a change in the heart rate and not the intrinsic cardiac performance.
101 Arterial Blood Pressure in Cardiogenic Shock The cuff blood pressure is notoriously inaccurate in patients with cardiogenic shock. Cuff pressures can underestimate the actual intraarterial pressure by as much as 160 mm Hg. Intraarterial pressure measurement is mandatory. Moderate to severe systolic hypotension < 90 mm Hg is the rule.
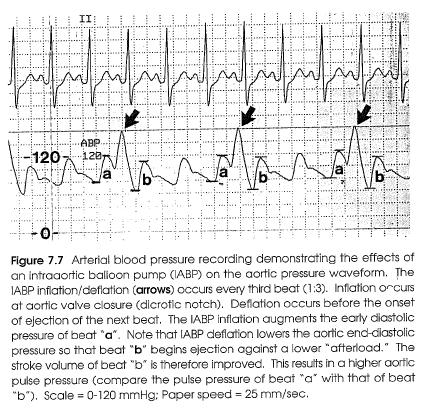
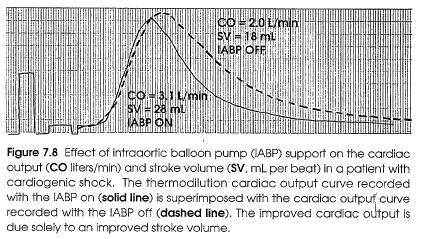
102 Intraaortic Balloon Pump in Cardiogenic Shock An intraaortic balloon pump is often used to support the circulation in patients with cardiogenic shock. The balloon pump inflation/deflation cycle occurs during diastole and produces a predictable effect on the arterial pressure, the mean wedge pressure, and the stroke volume. It is programmed to inflate at the moment of aortic valve closure (dicrotic notch) and to deflate prior to the onset of aortic ejection (aortic pressure upstroke).
103 IABP
104 IABP Balloon pump inflation causes a sudden augmentation of the early aortic diastolic BP. This promotes tissue perfusion and increases the diastolic coronary artery blood flow velocity. Balloon pump deflation lowers the aortic enddiastolic pressure and provides a mechanical advantage (decreased afterload) for the next LV ejection. As a result, the SV of the damaged LV rises and contributes to improved CO. This is especially true when significant mitral valve regurgitation is present.
105 IABP
106 Mitral Regugitation and Pericardial Tamponade These complications of an acute MI are uncommon especially since the advent of reperfusion therapy. Acute severe mitral regurgitation is the result of infarction of one of the papillary muscles and adjacent ventricular myocardium. Cardiac tamponade is the result of postinfarction pericarditis or sub-acute rupture of the left ventricular free wall.

107 Ventricular Septal Rupture Can occur as a consequence of either anterior or inferior MI. The result is a ventricular septal defect with a left to right shunt and a pulmonary to systemic blood flow ratio usually greater than 2:1. Can be confirmed by demonstrating a significant increase (10% or more) in the oxygen saturation between the right atrium and the pulmonary artery.
108 Ventricular Septal Rupture The RA SaO2 must be interpreted carefully; this chamber receives blood from the inferior vena cava, the superior vena cava, and the coronary sinus. The RA SaO2 can be artificially decreased if the proximal catheter lumen is adjacent to the coronary sinus (venous blood flow). The RA SaO2 can be artificially increased if significant TR further complicates the ventricular septal rupture. Oxygenated blood is shunted across the septal defect into the RV and then refluxes across the tricuspid valve in to the RA. This unusual scenario is most likely to occur when septal rupture complicates acute inferior MI with concomitant RV infarction and tricuspid papillary muscle dysfunction.
109 Ventricular Septal Rupture With acute VSD, the mean RA pressure, wedge, and pulmonary artery pressures are all significantly elevated. A large V wave is often present in the wedge pressure tracing. With acute septal rupture, the systemic blood flow averages only one-half to one-forth of the thermodilution determined cardiac output. Thus a normal thermodilution CO in a patient with acute septal rupture usually reflects a severe reduction in systemic blood flow.

110 Right Ventricular Infarction RV infarction is almost always complicated by inferior LV infarction since the right coronary artery usually also supplies the inferior (diaphragmatic) wall of the left ventricle. The hemodynamic findings of RV infarction are governed by the infarct size, the degree of RV dilatation, the function of the ventricular septum, the contractile state of the right atrium and the cardiac rhythm.
111 Right Ventricular Infarction The RV is a thin walled structure with a muscle mass of only 1/6 that of the LV. Consequently, RV infarction leads to acute RV dilatation. The degree of dilatation is limited by the unyielding nature of the normal pericardium resulting in a form of acute pericardial constriction. The RV shares the interventricular septum with the LV. With RV free wall infarction, the IVS can lend contractile support to the RV, thus limiting the hemodynamic consequences of the infarction. When the infarction also involves the IVS, the consequences are more serious. The right coronary provides blood supply to a variable portion of the IVS through the posterior descending coronary artery. Therefore occlusion can lead to coincident RV and IVS infarction.

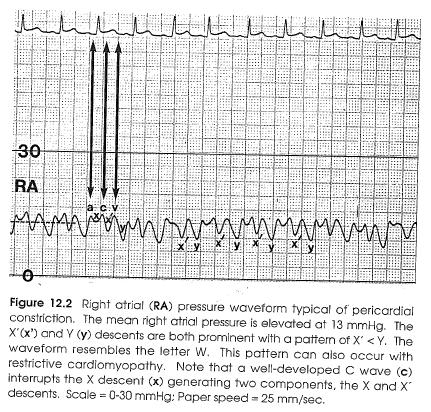
112 Right Ventricular Infarction RA pressure is elevated to 10 mm Hg or greater. The X and Y descents are prominent. This pattern is also seen with pericardial constriction and restrictive cardiomyopathy. The prominent X and Y descents cause the RA waveform to resemble the letter W or M. Either the X descent or the Y descent my be the dominant negative wave.

113 Right Ventricular Infarction RA systolic dysfunction may complicate RV infarction, especially when the coronary artery occlusion is proximal and compromises RA blood supply. Severe hemodynamic compromise can occur due to the decreased force of RA systole. The magnitude of the right atrial A wave (relative to the mean right atrial pressure) provides some information about the atrial contractile function. Patients with small amplitude A waves tend to fare worse than those with augmented A waves. (Implies decreased atrial filling)
114 Right Ventricular Infarction Heart block is yet another cause of hemodynamic deterioration during right ventricular infarction. The worsening in hemodynamic status is due primarily to the loss of AV synchrony (not bradycardia) further emphasizing the importance of effect right atrial systole. Tricuspid regurgitation can also occur with RV infarction and will alter the RA pressure waveform and further raise RA pressure.
 often exceeds 0.75 and may even exceed 1.")
115 Right Ventricular Infarction Wedge pressure is usually elevated because of concomitant inferior-septal left ventricular infarction. The increase in RA pressure is usually disproportionately greater than the increase in wedge pressure. The ratio of RA/wedge (normal < 0.5) often exceeds 0.75 and may even exceed 1.0 during RV infarction. The increase RA pressure relative to LA (wedge) can promote R to L shunting across a patent foramen ovale. Serious arterial desaturation can occur.

116 Right Ventricular Infarction Pulmonary Artery Pressure and Cardiac Output PA pressure is commonly elevated and parallels the increased wedge pressure. RV stroke volume is decreased causing a decrease in pulmonary artery pulse pressure. With severe RV infarction, the PA pulse pressure is so narrowed that it resembles a venous waveform.

117 Right Ventricular Infarction This can make bedside catheter placement difficult. Changing the pressure scale to expand the waveform is helpful.
118 Right Ventricular Infarction It is a widely held misconception that volume loading is always beneficial for patients with RV infarction and hemodynamic compromise. In fact, volume loading does not uniformly produce an increase in the cardiac output in these patients. While volume loading can certainly lead to an increase in both RA pressure and the wedge pressure, this may not translate into an improved SV. The increase in the wedge pressure is not associated with an increase in LV volume because of geometric changes in the LV. In fact, volume loading may be harmful if it results in severe peripheral or pulmonary edema. Therefore, it is important to quantitate the effect of volume loading on the SV and CO in these patients.
119 Acute Left Ventricular Ischemia Myocardial ischemia can complicate many serious illnesses since coronary artery disease is so common in the intensive care unit population. It can be difficult to recognize the presence of myocardial ischemia; it is often painless and shortlived. In the intensive care unit, intermittent left ventricular ischemia may manifest itself clinically as congestive failure. Recurrent painless ischemia is one of the causes of refractory respiratory failure. Myocardial ischemia is evanescent and continuous recording of hemodynamic parameters is necessary to detect its presence.
120 Acute Left Ventricular Ischemia Acute left ventricular ischemia causes immediate impairment of both systolic and diastolic myocardial function. The hemodynamic changes occur in both painful and painless ischemia. The diastolic dysfunction leads to an increase in the left ventricular end diastolic pressure. The increase in the left ventricular end diastolic pressure is transmitted to the left atrium causing an increase in the wedge pressure. Eventually the elevated left ventricular filling pressure leads to pulmonary congestion. When myocardial ischemia causes an elevation of the wedge pressure to > 25 mm Hg, overt pulmonary edema occurs.

121 Acute Left Ventricular Ischemia
122 Acute Left Ventricular Ischemia The rate the formation of interstitial and alveolar pulmonary edema may be very rapid during periods of elevated pulmonary capillary wedge pressure. In contrast, removal rate of the edema fluid is often relatively slow once the elevated wedge pressure has returned to normal. As a result, the clinical and radiographic effects of the pulmonary edema may linger long after hemodynamic measurements have returned to normal. The pulmonary artery pressure increases during acute ischemia because of the sudden increase in the left ventricular and diastolic pressure and the wedge pressure.
123 Acute Left Ventricular Ischemia
124 Acute Left Ventricular Ischemia Baseline measurements of the pulmonary artery pressure and the wedge pressure are deceiving and may be normal. During acute ischemia striking increases in the heart rate, pulmonary artery pressure and wedge pressure may occur.
125 Acute Left Ventricular Ischemia Continuous recording of the pulmonary artery pressure can be used to detect ischemic mediated increases in the left ventricular end diastolic pressure. At the same time, measurements of the pulmonary artery diastolic pressure provides an assessment of the physiologic consequences of such episodes with respect to pulmonary congestion. Transient pulmonary artery hypertension can occur with stresses other than ischemia. It is therefore necessary to continuously record the ST segment of the electrocardiogram to prove that myocardial ischemia is the cause of observed increases in the pulmonary artery pressure.

126 Acute Left Ventricular Ischemia
127 Acute Left Ventricular Ischemia Wedge pressure and pulmonary artery pressure During acute ischemia, both the A and V waves of the wedge pressure waveform are accentuated because the increased left atrial pressure distends the pulmonary venous channels allowing more effective transmission of all left atrial mechanical events. Even in the absence of significant mitral regurgitation, the V wave and the wedge pressure is often increased relative to the A wave because of ischemia mediated noncompliance of the left heart. The magnitude of the increase in the wedge pressure depends on the duration of the ischemia, the baseline left ventricular function, and the amount of myocardium involved.

128 Acute Left Ventricular Ischemia Wedge pressure and pulmonary artery pressure Capillary muscle ischemia can cause a profound increase in the mean wedge pressure because of transient or severe mitral regurgitation. In this setting, it is common to observe a mean wedge pressure exceeding 30 mm Hg together with a giant V wave.

129 Acute Left Ventricular Ischemia The increase in the wedge pressure is transmitted to the pulmonary circulation causing an increase in the pulmonary artery systolic and diastolic pressures. The pulmonary artery diastolic pressure may significantly under estimate the mean wedge pressure if a large V wave is present in the wedge waveform. In general, painful ischemia produces a greater hemodynamic derangement than does painless ischemia.
130 Chronic Congestive Heart Failure Congestive heart failure is the unfortunate final outcome for a number of heart diseases. In contrast to patients with acute heart failure, the physical examination and chest x- ray are of limited value in acutely predicting the hemodynamic status of patients with chronic congestive heart failure. In one study, physical examination evidence specific for pulmonary congestion was absent in 44% of patients with pulmonary capillary wedge pressures greater than or equal to 35 mm of mercury.
131 Chronic Congestive Heart Failure Similarly, chest x-ray evidence of an increased wedge pressure (interstitial or alveolar edema) may be masked by the increased lymphatic drainage which occurs in patients with chronic heart failure. Hemodynamic monitoring is often necessary to guide therapy in patients admitted to the hospital with refractory heart failure. The hemodynamic findings discussed pertain to patients with chronic congestive heart failure in the setting of a dilated heart with poor systolic function.
132 Chronic Congestive Heart Failure Right atrial pressure, wedge pressure and pulmonary artery pressure Typically, all intracardiac pressures are elevated to a varying degree. The RA pressure and the mean wedge pressure are subject to the influence of any coexisting tricuspid or mitral regurgitation respectively. Atrial and ventricular arrhythmias are common in these patients and will alter the right atrial and wedge pressure waveforms.
 The wedge pressure is 21 to 30 mm Hg ( range 8-44 mm Hg.) The mean pulmonary artery pressure is 33 mm of mercury.")
133 Chronic Congestive Heart Failure The mean right atrial pressure in patients hospitalized with severe heart failure is 9 to 12 mm of Hg. (range 2-38 mm Hg.) The wedge pressure is 21 to 30 mm Hg ( range 8-44 mm Hg.) The mean pulmonary artery pressure is 33 mm of mercury.
134 Chronic Congestive Heart Failure Patients with chronic heart failure generally have higher intracardiac pressures than do patients with acute heart failure. In one study mean wedge pressure was > 35 mm Hg in 36% of patients hospitalized with severe chronic congestive heart failure. In comparison, the mean wedge pressure of patients with acute myocardial infarction and cardiogenic shock is typically 8-28 mm Hg.
135 Chronic Congestive Heart Failure It is important to note the relation between the mean right atrial pressure and mean wedge pressure. In many patients with chronic heart failure, the usual ratio of RA/PAOP of < 0.5 is observed. However it is not uncommon for the ratio to exceed 0.5 because of RV dilatation and severe TR. In some patients, right heart failure may predominate resulting in a right atrial pressure greater than the wedge pressure. The right atrial pressure waveform will have the features typical of tricuspid regurgitation in this subset of patients. It is rare for the mean RA pressure to actually exceed the mean wedge pressure unless a complication such as a pulmonary embolism has occurred.

136 Chronic Congestive Heart Failure
137 Chronic Congestive Heart Failure The wedge pressure waveform is dominated by the V wave. The V wave is prominent because of noncompliance of the LV, although it is common to find some degree of MR in these patients. Moderate pulmonary hypertension is the rule. If the PA diastolic pressure exceeds the mean wedge pressure by > 5 mm Hg, the presence of a complication such as pulmonary embolism should be considered. The PA artery pulse pressure may be narrow in the presence of a low stroke volume.

138 Chronic Congestive Heart Failure Aortic pressure may be normal or even high. A decrease in the aortic pulse pressure correlates with a decrease in the cardiac index. Occasionally, pulsus alternans occurs in the final stages of CHF.

139 Chronic Congestive Heart Failure Cardiac Output/Index Are usually reduced with the average being 3.0 L/min and 1.6 L/min/m2 respectively. The low CO is due largely to a significant reduction in the SV. An occasional patient will have a marked reduction in the CI to levels as low as 1.0 to 1.5 L/min/m2.
140 Chronic Congestive Heart Failure Patients with chronic CHF adapt to a low CI primarily by increasing the tissue extraction of oxygen from hemoglobin, resulting in a decrease in the mixed venous (pulmonary artery) oxygen saturation. CO measurement is susceptible to error. The presence of TR renders the method inaccurate. Arrhythmias are another source of potential error. The thermodilution method samples blood flow during only a few heartbeats and extrapolates this measurement to a 1 min period. If a ventricular or atrial arrhythmia occurs during the injection and sampling period, the CO may not be representative. Atrial fibrillation is a major offender, especially when the R-R intervals vary widely.
141 Chronic Congestive Heart Failure Alternatively, continuous monitoring of the pulmonary artery (mixed venous) oxygen saturation is clinically useful in these patients. In patients with chronic CHF, changes in the pul O2 sat parallel changes in CO. Measurement of pulmonary artery oxygen saturations over time and can be used to gauge the effects of therapy on CO.
142 Chronic Congestive Heart Failure In some patients, aggressive medical management can worsen heart failure. This is especially true in patients with ischemic cardiomyopathy. Therapy with IV inotropic drugs or powerful vasodilator drugs can trigger episodes of myocardial ischemia thus worsening the heart failure.
143 Pericardial Tamponade Uncommon but life life-threatening condition. The astute clinician can establish the diagnosis of tamponade by a careful examination of a RA pressure waveform. Continuum with the degree of hemodynamic abnormality determined largely by the degree of fluid compression present. The rate of pericardial fluid accumulation, the volume of fluid, the tensile properties of the pericardium, and the volume status of the patient are all variables which will affect the hemodynamic parameters. The classic features of extreme tamponade include elevation and equalization of intracardiac pressures, pulsus paradoxus, and arterial hypotension.
144 Pericardial Tamponade-Physiology As fluid accumulates within the pericardial sac, the intrapericardial pressure rises. Initially, the intrapericardial pressure is less than either the right atrial pressure or the wedge pressure. At this stage, pulsus paradoxus is absent and the CO is unchanged. As more fluid accumulates, the intrapericardial pressure rises to equal the RA pressure, but is still less than the wedge pressure. Tamponade of the right heart now exists and the SV is compromised. Pulsus paradoxus may now appear.
145 Pericardial Tamponade-Physiology With a further increase in the pericardial pressure the intracardiac pressure rises to the level of the wedge pressure. Fluid compression of both the R and L heart now exists and the pericardial pressure, RA pressure, and wedge pressure are now equal. Pulsus paradoxus is magnified and SV is significantly decreased.

146 Pericardial Tamponade-RA, PAOP, PAP Mean RA pressure is elevated ~ mm Hg. The X descent is prominent while the Y descent is markedly attenuated and often absent.

147 Pericardial Tamponade-RA, PAOP, PAP

148 Pericardial Tamponade-Aortic Pressure Alfred Kussmaul is responsible for describing pulsus paradoxus in patients with pericardial tamponade. A widely accepted definition states that pulsus exits when a normal inspiration is accompanied by a drop in the systolic arterial pressure > 10 mm Hg.

149 Pericardial Constriction and Restrictive Cardiomyopathy
150 Pericardial Constriction Infection, inflammation, and neoplasm can each cause the pericardium to become thickened, scarred, and noncompliant. The diastolic volume of the heart is reduced and the ventricular and atrial filling pressures are elevated. Since the constricting process is usually uniform, all four cardiac chambers are involved equally (in contrast to restrictive cardiomyopathy). RV infarction mimics constriction because the sudden dilation of the RV overdistends an otherwise normal pericardium.

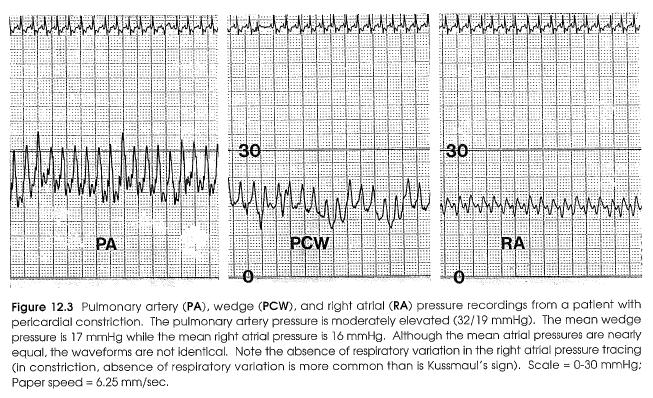
151 Pericardial Constriction-Intracardiac Pressures RA and Wedge pressures are elevated; the magnitude of the atrial pressure elevation is determined by the degree of constriction. With moderate constriction the RA pressures are between mm Hg. With severe constriction, the atrial pressures reach mmhg. In pure constriction, the RA and wedge pressures are nearly identical.
152 Pericardial Constriction-Intracardiac Pressures Rapid filling of the ventricles is limited to early diastole ( the ventricular size is smallest at the start of diastole, therefore the ventricular constriction is least at this time). The exaggerated early ventricular filling results in a steep Y descent in the atrial pressure waveform. Following atrial systole, the atrial volume is reduced (the atrial contents having been transported into the ventricles). At this time, constriction of the two atria transiently lessens resulting in a steep X descent. The combination of a steep X and steep Y descent causes the atrial pressure waveform to resemble the letter W (or M depending on your preference). This pattern can be observed in conditions other than pericardial constriction.
153 Pericardial Constriction-Intracardiac Pressures
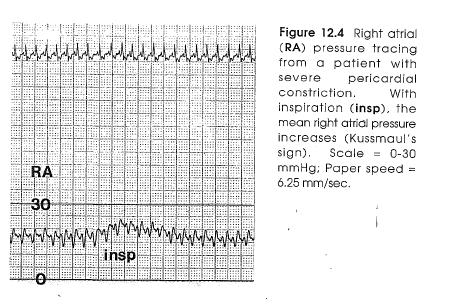
154 Pericardial Constriction-Intracardiac Pressures The presence of a noncompliant pericardium limits transmission of intrathoracic pressure to the heart. The normal inspiratory increase in superior and inferior vena cava flow is reduced or absent. Therefore the RA pressure often shows no respiratory change. With severe constriction, an inspiratory increase in the RA pressure (Kussmaul s sign) may be present, but this is the exception, not the rule.
155 Pericardial Constriction-Intracardiac Pressures
156 Pericardial Constriction-Intracardiac Pressures The PA pressures are modestly elevated. The pulmonary artery systolic pressure is typically mm Hg. Severe pulmonary hypertension suggests coexisting myocardial or valvular heart disease. The pulmonary artery diastolic pressure should equal both the RA pressure and PAOP. Aortic pressure is usually maintained. Pulsus paradoxus is observed in only about 1/3 of patients with pericardial constriction, whereas in pericardial tamponade pulsus paradoxus is nearly universal. The SV is reduced, but tachycardia can maintain CO in all but the most severe cases. With severe constriction the SVI may be as low as ml/m2.

157 Effusive-Constrictive Pericarditis In some patients, pericardial inflammation leads to the combination of a pericardial effusion and pericardial constriction. In effusive-constrictive pericarditis, there is constriction of the heart by the visceral pericardium and pericardial fluid accumulation between the visceral and parietal pericardium. TB, mediastinal radiation, uremia, and pericardial malignancy are conditions known to cause effusiveconstrictive pericarditis.
158 Restrictive Cardiomyopathy A myocardial disease. Myocardial relaxation is restricted resulting in a hemodynamic picture closely resembling pericardial constriction. Uncommon. Its causes include rather obscure diseases, such as hemochromatosis, endomyocardial fibrosis, amyloidosis and myocarditis.
159 Restrictive Cardiomyopathy-Hemodynamics The RA pressure and wedge pressures are significantly elevated to levels observed with pericardial constriction (15-25 mm Hg). As with constriction, the X and Y descents are prominent with a pattern of X = Y or Y > X. In contrast to constrictive pericarditis, the RA pressure and wedge pressure are usually not equal. The restrictive process involves both the L and R ventricle and causes a proportionate decrease in each chamber s distensibility. As a result the R and L ventricular pressures are elevated but not equal. The wedge pressure usually exceeds the RA pressure.
160 Restrictive Cardiomyopathy-Hemodynamics Pulmonary hypertension is often more severe in restrictive cardiomyopathy than in constrictive pericarditis. In restriction, the pulmonary artery systolic pressure typically exceeds 50 mm Hg; in constriction this level of pulmonary hypertension is unusual. The CI may be normal, but maintained by tachycardia.


161 Constriction/Restriction The hemodynamic findings of pericardial constriction, effusive constrictive pericarditis, pericardial tamponade, and restrictive cardiomyopathy are compared:
162 Dip and Plateau Pressure Equalization
163 Restriction Summary Table Constrictive Pericarditis Diastolic Equilibration YES Dip and Plateau Physiology YES Restrictive Cardiomyopathy NO YES Cardiac Tamponade YES NO
164 Constriction/Restriction
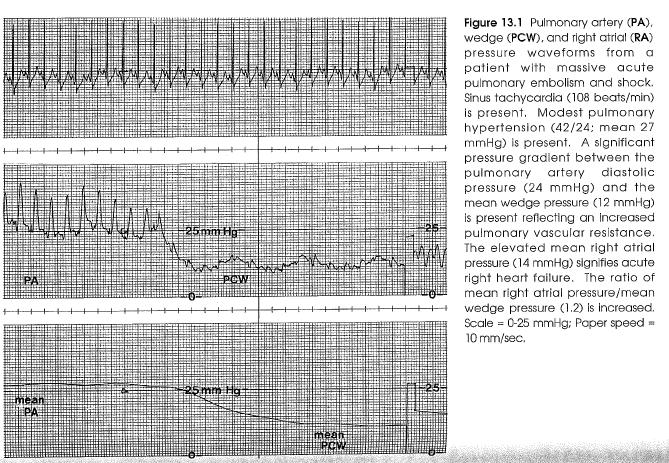
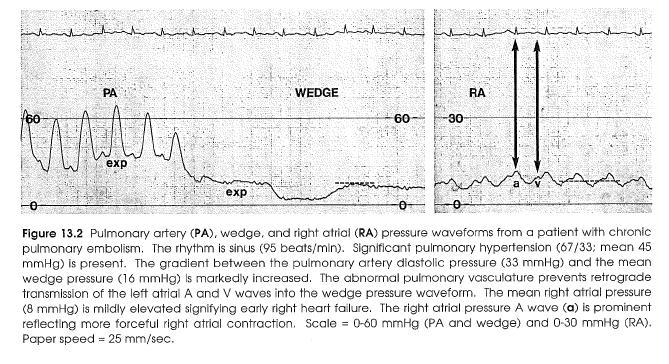
165 Pulmonary Embolism-Acute PA, Wedge, RAP and CO Sinus tachycardia is the rule. Pulmonary HTN is present in ~70% of patients. In patients without prior cardiopulmonary disease, the mean PAP is consistently increased when the obstruction of the pulmonary vasculature exceeds 25-30%. The mean PAP usually does not exceed 40 mm Hg because the normal right ventricle cannot generate a high pulmonary artery pressure acutely.
166 Pulmonary Embolism-Acute
167 Pulmonary Embolism-Acute Higher levels of PAP suggest a chronic component to the PE or preexisting heart disease. The mean PAP correlates well with the degree of angiographic obstruction. With massive PE, pulmonary artery pulsus alternans may appear. The PAOP is usually normal or low unless the patient has underlying heart disease. When there is an obstruction in the pulmonary vasculature, a gradient between the PAD and the mean wedge is generated and the left atrial A and V waves are not transmitted retrogradely into the wedge pressure waveform.
168 Pulmonary Embolism-Acute
10. Thick deposits of lipids on the walls of blood vessels, called, can lead to serious circulatory issues. A. aneurysm B. atherosclerosis C.
 Heart Student: 1. carry blood away from the heart. A. Arteries B. Veins C. Capillaries 2. What is the leading cause of heart attack and stroke in North America? A. alcohol B. smoking C. arteriosclerosis
Adult Echocardiography Examination Content Outline
 Adult Echocardiography Examination Content Outline (Outline Summary) # Domain Subdomain Percentage 1 2 3 4 5 Anatomy and Physiology Pathology Clinical Care and Safety Measurement Techniques, Maneuvers,
Echocardiography as a diagnostic and management tool in medical emergencies
 Echocardiography as a diagnostic and management tool in medical emergencies Frank van der Heusen MD Department of Anesthesia and perioperative Care UCSF Medical Center Objective of this presentation Indications
THE CARDIOVASCULAR SYSTEM. Heart 2
 THE CARDIOVASCULAR SYSTEM Heart 2 PROPERTIES OF CARDIAC MUSCLE Cardiac muscle Striated Short Wide Branched Interconnected Skeletal muscle Striated Long Narrow Cylindrical PROPERTIES OF CARDIAC MUSCLE Intercalated
Hemodynamic Monitoring
 Perform Procedure And Interpret Results Hemodynamic Monitoring Tracheal Tube Cuff Pressure Dean R. Hess PhD RRT FAARC Hemodynamic Monitoring Cardiac Rate and Rhythm Arterial Blood Pressure Central Venous
Cardiovascular Physiology. Heart Physiology. Introduction. The heart. Electrophysiology of the heart
 Cardiovascular Physiology Heart Physiology Introduction The cardiovascular system consists of the heart and two vascular systems, the systemic and pulmonary circulations. The heart pumps blood through
The Cardiovascular System
 The Cardiovascular System The Cardiovascular System A closed system of the heart and blood vessels The heart pumps blood Blood vessels allow blood to circulate to all parts of the body The function of
Adel Hasanin Ahmed 1
 Adel Hasanin Ahmed 1 PERICARDIAL DISEASE The pericardial effusion ends anteriorly to the descending aorta and is best visualised in the PLAX. PSAX is actually very useful sometimes for looking at posterior
Cardiovascular System Notes: Heart Disease & Disorders
 Cardiovascular System Notes: Heart Disease & Disorders Interesting Heart Facts The Electrocardiograph (ECG) was invented in 1902 by Willem Einthoven Dutch Physiologist. This test is still used to evaluate
Relax and Learn At the Farm 2012
 Relax and Learn At the Farm Session 9: Invasive Hemodynamic Assessment and What to Do with the Data Carol Jacobson RN, MN Cardiovascular Nursing Education Associates Function of CV system is to deliver
(D) (E) (F) 6. The extrasystolic beat would produce (A) increased pulse pressure because contractility. is increased. increased
 (E) (F) 6. The extrasystolic beat would produce (A) increased pulse pressure because contractility. is increased. increased") Review Test 1. A 53-year-old woman is found, by arteriography, to have 5% narrowing of her left renal artery. What is the expected change in blood flow through the stenotic artery? Decrease to 1 2 Decrease
Review Test 1. A 53-year-old woman is found, by arteriography, to have 5% narrowing of her left renal artery. What is the expected change in blood flow through the stenotic artery? Decrease to 1 2 Decrease
Cardiovascular Nursing Practice: A Comprehensive Resource Manual and Study Guide for Clinical Nurses 2 nd Edition
 Cardiovascular Nursing Practice: A Comprehensive Resource Manual and Study Guide for Clinical Nurses 2 nd Edition Table of Contents Volume 1 Chapter 1: Cardiovascular Anatomy and Physiology Basic Cardiac
4. The two inferior chambers of the heart are known as the atria. the superior and inferior vena cava, which empty into the left atrium.
 Answer each statement true or false. If the statement is false, change the underlined word to make it true. 1. The heart is located approximately between the second and fifth ribs and posterior to the
HISTORY. Question: How do you interpret the patient s history? CHIEF COMPLAINT: Dyspnea of two days duration. PRESENT ILLNESS: 45-year-old man.
 HISTORY 45-year-old man. CHIEF COMPLAINT: Dyspnea of two days duration. PRESENT ILLNESS: His dyspnea began suddenly and has been associated with orthopnea, but no chest pain. For two months he has felt
The Cardiac Cycle Clive M. Baumgarten, Ph.D.
 The Cardiac Cycle Clive M. Baumgarten, Ph.D. OBJECTIVES: 1. Describe periods comprising cardiac cycle and events within each period 2. Describe the temporal relationships between pressure, blood flow,
Skin supplied by T1-4 (medial upper arm and neck) T5-9- epigastrium Visceral afferents from skin and heart are the same dorsal root ganglio
 T5-9- epigastrium Visceral afferents from skin and heart are the same dorsal root ganglio") Cardio 2 ECG... 3 Cardiac Remodelling... 11 Valvular Diseases... 13 Hypertension... 18 Aortic Coarctation... 24 Erythropoiesis... 27 Haemostasis... 30 Anaemia... 36 Atherosclerosis... 44 Angina... 48 Myocardial
Cardio 2 ECG... 3 Cardiac Remodelling... 11 Valvular Diseases... 13 Hypertension... 18 Aortic Coarctation... 24 Erythropoiesis... 27 Haemostasis... 30 Anaemia... 36 Atherosclerosis... 44 Angina... 48 Myocardial
Index of subjects. effect on ventricular tachycardia 30 treatment with 101, 116 boosterpump 80 Brockenbrough phenomenon 55, 125
 145 Index of subjects A accessory pathways 3 amiodarone 4, 5, 6, 23, 30, 97, 102 angina pectoris 4, 24, 1l0, 137, 139, 140 angulation, of cavity 73, 74 aorta aortic flow velocity 2 aortic insufficiency
Cardiovascular System
 Cardiovascular System The Heart Cardiovascular System The Heart Overview What does the heart do? By timed muscular contractions creates pressure gradients blood moves then from high pressure to low pressure
The Cardiovascular System Part I: Heart Outline of class lecture After studying part I of this chapter you should be able to:
 The Cardiovascular System Part I: Heart Outline of class lecture After studying part I of this chapter you should be able to: 1. Describe the functions of the heart 2. Describe the location of the heart,
IB TOPIC 6.2 THE BLOOD SYSTEM
 IB TOPIC 6.2 THE BLOOD SYSTEM THE BLOOD SYSTEM TERMS TO KNOW circulation ventricle artery vein 6.2.U1 - Arteries convey blood at high pressure from the ventricles to the tissues of the body Circulation
The Heart. Happy Friday! #takeoutyournotes #testnotgradedyet
 The Heart Happy Friday! #takeoutyournotes #testnotgradedyet Introduction Cardiovascular system distributes blood Pump (heart) Distribution areas (capillaries) Heart has 4 compartments 2 receive blood (atria)
Cardiovascular system
 BIO 301 Human Physiology Cardiovascular system The Cardiovascular System: consists of the heart plus all the blood vessels transports blood to all parts of the body in two 'circulations': pulmonary (lungs)
Chapter 18 - Heart. I. Heart Anatomy: size of your fist; located in mediastinum (medial cavity)
") Chapter 18 - Heart I. Heart Anatomy: size of your fist; located in mediastinum (medial cavity) A. Coverings: heart enclosed in double walled sac called the pericardium 1. Fibrous pericardium: dense connective
Chapter 18 - Heart I. Heart Anatomy: size of your fist; located in mediastinum (medial cavity) A. Coverings: heart enclosed in double walled sac called the pericardium 1. Fibrous pericardium: dense connective
The Cardiovascular System. Chapter 15. Cardiovascular System FYI. Cardiology Closed systemof the heart & blood vessels. Functions
 Chapter 15 Cardiovascular System FYI The heart pumps 7,000 liters (4000 gallons) of blood through the body each day The heart contracts 2.5 billion times in an avg. lifetime The heart & all blood vessels
Index. Note: Page numbers of article titles are in boldface type.
 Index Note: Page numbers of article titles are in boldface type. A Acute coronary syndrome(s), anticoagulant therapy in, 706, 707 antiplatelet therapy in, 702 ß-blockers in, 703 cardiac biomarkers in,
EKG Competency for Agency
 EKG Competency for Agency Name: Date: Agency: 1. The upper chambers of the heart are known as the: a. Atria b. Ventricles c. Mitral Valve d. Aortic Valve 2. The lower chambers of the heart are known as
2. The heart sounds are produced by a summed series of mechanical events, as follows:
 Heart Sounds. Phonocardiography 1 Objectives 1. Phonocardiography - Definition 2. What produces the heart sounds 3. Where to listen for the heart sounds 4. How to record a phonocardiogram 5. Normal heart
CARDIAC CYCLE CONTENTS. Divisions of cardiac cycle 11/13/13. Definition. Badri Paudel GMC
 CARDIAC CYCLE Badri Paudel GMC CONTENTS Ø DEFINATION Ø DIVISION OF CARDIAC CYCLE Ø SUB DIVISION AND DURATION OF CARDIAC CYCLE Ø SYSTOLE Ø DIASTOLE Ø DESCRIPTION OF EVENTS OF CARDIAC CYCLE Ø SUMMARY Ø ELECTROCARDIOGRAPHY
Electrocardiography Abnormalities (Arrhythmias) 7. Faisal I. Mohammed, MD, PhD
 7. Faisal I. Mohammed, MD, PhD") Electrocardiography Abnormalities (Arrhythmias) 7 Faisal I. Mohammed, MD, PhD 1 Causes of Cardiac Arrythmias Abnormal rhythmicity of the pacemaker Shift of pacemaker from sinus node Blocks at different
Electrocardiography Abnormalities (Arrhythmias) 7 Faisal I. Mohammed, MD, PhD 1 Causes of Cardiac Arrythmias Abnormal rhythmicity of the pacemaker Shift of pacemaker from sinus node Blocks at different
EKG Abnormalities. Adapted from:
 EKG Abnormalities Adapted from: http://www.bem.fi/book/19/19.htm Some key terms: Arrhythmia-an abnormal rhythm or sequence of events in the EKG Flutter-rapid depolarizations (and therefore contractions)
Cardiac Cycle MCQ. Professor of Cardiovascular Physiology. Cairo University 2007
 Cardiac Cycle MCQ Abdel Moniem Ibrahim Ahmed, MD Professor of Cardiovascular Physiology Cairo University 2007 1- Regarding the length of systole and diastole: a- At heart rate 75 b/min, the duration of
11/10/2014. Muscular pump Two atria Two ventricles. In mediastinum of thoracic cavity 2/3 of heart's mass lies left of midline of sternum
 It beats over 100,000 times a day to pump over 1,800 gallons of blood per day through over 60,000 miles of blood vessels. During the average lifetime, the heart pumps nearly 3 billion times, delivering
BUSINESS. Articles? Grades Midterm Review session
 BUSINESS Articles? Grades Midterm Review session REVIEW Cardiac cells Myogenic cells Properties of contractile cells CONDUCTION SYSTEM OF THE HEART Conduction pathway SA node (pacemaker) atrial depolarization
Large Arteries of Heart
 Cardiovascular System (Part A-2) Module 5 -Chapter 8 Overview Arteries Capillaries Veins Heart Anatomy Conduction System Blood pressure Fetal circulation Susie Turner, M.D. 1/5/13 Large Arteries of Heart
Section 6 Intra Aortic Balloon Pump
 Section 6 Intra Aortic Balloon Pump The Intra Aortic Balloon Pump (IABP) The balloon is synthetic and is made for single use only. It is threaded into the aorta, usually via a femoral approach. The balloon
Hemodynamic Monitoring and Circulatory Assist Devices
 Hemodynamic Monitoring and Circulatory Assist Devices Speaker: Jana Ogden Learning Unit 2: Hemodynamic Monitoring and Circulatory Assist Devices Hemodynamic monitoring refers to the measurement of pressure,
UNDERSTANDING YOUR ECG: A REVIEW
 UNDERSTANDING YOUR ECG: A REVIEW Health professionals use the electrocardiograph (ECG) rhythm strip to systematically analyse the cardiac rhythm. Before the systematic process of ECG analysis is described
IB TOPIC 6.2 THE BLOOD SYSTEM
 IB TOPIC 6.2 THE BLOOD SYSTEM TERMS TO KNOW circulation ventricle artery vein THE BLOOD SYSTEM 6.2.U1 - Arteries convey blood at high pressure from the ventricles to the tissues of the body Circulation
Approximately the size of your fist Location. Pericardial physiology
 Heart Anatomy Approximately the size of your fist Location Superior surface of diaphragm Left of the midline Anterior to the vertebral column, posterior to the sternum Wednesday, March 28, 2012 Muscle
Cardiovascular Physiology
 Cardiovascular Physiology Introduction The cardiovascular system consists of the heart and two vascular systems, the systemic and pulmonary circulations. The heart pumps blood through two vascular systems
Common Codes for ICD-10
 Common Codes for ICD-10 Specialty: Cardiology *Always utilize more specific codes first. ABNORMALITIES OF HEART RHYTHM ICD-9-CM Codes: 427.81, 427.89, 785.0, 785.1, 785.3 R00.0 Tachycardia, unspecified
THE HEART. A. The Pericardium - a double sac of serous membrane surrounding the heart
 THE HEART I. Size and Location: A. Fist-size weighing less than a pound (250 to 350 grams). B. Located in the mediastinum between the 2 nd rib and the 5 th intercostal space. 1. Tipped to the left, resting
Ch 19: Cardiovascular System - The Heart -
 Ch 19: Cardiovascular System - The Heart - Give a detailed description of the superficial and internal anatomy of the heart, including the pericardium, the myocardium, and the cardiac muscle. Trace the
Hemodynamics: Cardiac and Vascular Jeff Davis, RRT, RCIS
 Hemodynamics: Cardiac and Vascular Jeff Davis, RRT, RCIS Program Director, Cardiovascular Technology Florida SouthWestern State College Fort Myers, FL Disclosures Speaker s Bureau: None Stockholder: None
HISTORY. Question: What category of heart disease is suggested by the fact that a murmur was heard at birth?
 HISTORY 23-year-old man. CHIEF COMPLAINT: Decreasing exercise tolerance of several years duration. PRESENT ILLNESS: The patient is the product of an uncomplicated term pregnancy. A heart murmur was discovered
37 1 The Circulatory System
 H T H E E A R T 37 1 The Circulatory System The circulatory system and respiratory system work together to supply cells with the nutrients and oxygen they need to stay alive. a) The respiratory system:
BME 5742 Bio-Systems Modeling and Control. Lecture 41 Heart & Blood Circulation Heart Function Basics
 BME 5742 Bio-Systems Modeling and Control Lecture 41 Heart & Blood Circulation Heart Function Basics Dr. Zvi Roth (FAU) 1 Pumps A pump is a device that accepts fluid at a low pressure P 1 and outputs the
AP2 Lab 3 Coronary Vessels, Valves, Sounds, and Dissection
 AP2 Lab 3 Coronary Vessels, Valves, Sounds, and Dissection Project 1 - BLOOD Supply to the Myocardium (Figs. 18.5 &18.10) The myocardium is not nourished by the blood while it is being pumped through the
CARDIOVASCULAR PHYSIOLOGY
 CARDIOVASCULAR PHYSIOLOGY LECTURE 4 Cardiac cycle Polygram - analysis of cardiac activity Ana-Maria Zagrean MD, PhD The Cardiac Cycle - definitions: the sequence of electrical and mechanical events that
CASE 10. What would the ST segment of this ECG look like? On which leads would you see this ST segment change? What does the T wave represent?
 CASE 10 A 57-year-old man presents to the emergency center with complaints of chest pain with radiation to the left arm and jaw. He reports feeling anxious, diaphoretic, and short of breath. His past history
Principles of Biomedical Systems & Devices. Lecture 8: Cardiovascular Dynamics Dr. Maria Tahamont
 Principles of Biomedical Systems & Devices Lecture 8: Cardiovascular Dynamics Dr. Maria Tahamont Review of Cardiac Anatomy Four chambers Two atria-receive blood from the vena cave and pulmonary veins Two
Cardiovascular System- Heart. Miss Wheeler Unit 8
 Cardiovascular System- Heart Miss Wheeler Unit 8 Overview CARDIOVASCULAR SYSTEM heart vessels Made up of heart, blood vessels, and blood Functions Heart- pump blood Vessels- (veins, arteries, capillaries)
ECG ABNORMALITIES D R. T AM A R A AL Q U D AH
 ECG ABNORMALITIES D R. T AM A R A AL Q U D AH When we interpret an ECG we compare it instantaneously with the normal ECG and normal variants stored in our memory; these memories are stored visually in
Cardiovascular System Notes: Physiology of the Heart
 Cardiovascular System Notes: Physiology of the Heart Interesting Heart Fact Capillaries are so small it takes ten of them to equal the thickness of a human hair. Review What are the 3 parts of the cardiovascular
IP: Regulation of Cardiac Output
 ANP 1105D Winter 2013 Assignment 9: The Heart, part 2: Chap... Assignment 9: The Heart, part 2: Chapter 18 Signed in as Alex Sokolowski Help Close Resources Due: 11:59pm on Monday, March 25, 2013 Note:
Cardiovascular System: The Heart
 Cardiovascular System: The Heart I. Anatomy of the Heart (See lab handout for terms list) A. Describe the size, shape and location of the heart B. Describe the structure and function of the pericardium
the Cardiovascular System I
 the Cardiovascular System I By: Dr. Nabil A Khouri MD, MsC, Ph.D MEDIASTINUM 1. Superior Mediastinum 2. inferior Mediastinum Anterior mediastinum. Middle mediastinum. Posterior mediastinum Anatomy of
Uncommon Doppler Echocardiographic Findings of Severe Pulmonic Insufficiency
 Uncommon Doppler Echocardiographic Findings of Severe Pulmonic Insufficiency Rahul R. Jhaveri, MD, Muhamed Saric, MD, PhD, FASE, and Itzhak Kronzon, MD, FASE, New York, New York Background: Two-dimensional
Left Ventricular End-Diastolic Pressure in Evaluating Left Ventricular Function
 Clin. Cardiol. 4,28-33 (1981) 0 G. Witzstrock Publishing House, nc. Practitioner s Corner Left Ventricular End-Diastolic Pressure in Evaluating Left Ventricular Function A. s. SKANDRAN, M.D., B. L. SEGAL,
INTRODUCTORY REMARKS:
 INTRODUCTORY REMARKS: The circulatory system provides a way for the blood to be transported throughout the body. This provides nutrients to the cells and allows wastes to be removed. Open vs. Closed Circulatory
Chapter 9. Learning Objectives. Learning Objectives 9/11/2012. Cardiac Arrhythmias. Define electrical therapy
 Chapter 9 Cardiac Arrhythmias Learning Objectives Define electrical therapy Explain why electrical therapy is preferred initial therapy over drug administration for cardiac arrest and some arrhythmias
The Doppler Examination. Katie Twomley, MD Wake Forest Baptist Health - Lexington
 The Doppler Examination Katie Twomley, MD Wake Forest Baptist Health - Lexington OUTLINE Principles/Physics Use in valvular assessment Aortic stenosis (continuity equation) Aortic regurgitation (pressure
PHYSIOLOGY MeQ'S (Morgan) All the following statements related to blood volume are correct except for: 5 A. Blood volume is about 5 litres. B.
 All the following statements related to blood volume are correct except for: 5 A. Blood volume is about 5 litres. B.") PHYSIOLOGY MeQ'S (Morgan) Chapter 5 All the following statements related to capillary Starling's forces are correct except for: 1 A. Hydrostatic pressure at arterial end is greater than at venous end.
PHYSIOLOGY MeQ'S (Morgan) Chapter 5 All the following statements related to capillary Starling's forces are correct except for: 1 A. Hydrostatic pressure at arterial end is greater than at venous end.
The Heart. Size, Form, and Location of the Heart. 1. Blunt, rounded point; most inferior part of the heart.
 12 The Heart FOCUS: The heart is composed of cardiac muscle cells, which are elongated, branching cells that appear striated. Cardiac muscle cells behave as a single electrical unit, and the highly coordinated
Cardiology. Objectives. Chapter
 1:44 M age 1121 Chapter Cardiology Objectives art 1: Cardiovascular natomy and hysiology, ECG Monitoring, and Dysrhythmia nalysis (begins on p. 1127) fter reading art 1 of this chapter, you should be able
The Mammalian Circulatory System
 The Mammalian Heart The Mammalian Circulatory System Recall: What are the 3 cycles of the mammalian circulatory system? What are their functions? What are the three main vessel types in the mammalian circulatory
Chapter 13 The Cardiovascular System: Cardiac Function
 Chapter 13 The Cardiovascular System: Cardiac Function Overview of the Cardiovascular System The Path of Blood Flow through the Heart and Vasculature Anatomy of the Heart Electrical Activity of the Heart
A DAYS CARDIOVASCULAR UNIT GUIDE DUE WEDNESDAY 4/12
 A DAYS CARDIOVASCULAR UNIT GUIDE DUE WEDNESDAY 4/12 MONDAY TUESDAY WEDNESDAY THURSDAY FRIDAY 3/20 - B 3/21 - A 3/22 - B 3/23 - A 3/24 - B 3/27 - A Dissection Ethics Debate 3/28 - B 3/29 - A Intro to Cardiovascular
Index. K Knobology, TTE artifact, image resolution, ultrasound, 14
 A Acute aortic regurgitation (AR), 124 128 Acute aortic syndrome (AAS) classic aortic dissection diagnosis, 251 263 evolutive patterns, 253 255 pathology, 250 251 classifications, 247 248 incomplete aortic
Basic Approach to the Echocardiographic Evaluation of Ventricular Diastolic Function
 Basic Approach to the Echocardiographic Evaluation of Ventricular Diastolic Function J A F E R A L I, M D U N I V E R S I T Y H O S P I T A L S C A S E M E D I C A L C E N T E R S T A F F C A R D I O T
Unit 1: Human Systems. The Circulatory System
 Unit 1: Human Systems The Circulatory System nourish all cells with oxygen, glucose, amino acids and other nutrients and carry away carbon dioxide, urea and other wastes Purposes Transport chemical messengers
CARDIAC EXAMINATION MINI-QUIZ
 CARDIAC EXAMINATION MINI-QUIZ 1. Sitting bolt upright, your dyspneic (short of breath) patient has visible jugular venous pulsations to the angle of his jaw, which is 12 cm above his sternal angle. What
Do Now. Get out work from last class to be checked
 Do Now Get out work from last class to be checked Heart Actions Cardiac Cycle: One complete heartbeat. The contraction of a heart chamber is called systole and the relaxation of a chamber is called diastole.
CATCH A WAVE.. INTRODUCTION NONINVASIVE HEMODYNAMIC MONITORING 4/12/2018
 WAVES CATCH A WAVE.. W I S C O N S I N P A R A M E D I C S E M I N A R A P R I L 2 0 1 8 K E R I W Y D N E R K R A U S E R N, C C R N, E M T - P Have you considered that if you don't make waves, nobody
Cath Lab Essentials: Basic Hemodynamics for the Cath Lab and ICU
 Cath Lab Essentials: Basic Hemodynamics for the Cath Lab and ICU Ailin Barseghian El-Farra, MD, FACC Assistant Professor, Interventional Cardiology University of California, Irvine Department of Cardiology
physiology 6 Mohammed Jaafer Turquoise team
 15 physiology 6 Mohammed Jaafer 22-3-2016 Turquoise team Cardiac Arrhythmias and Their Electrocardiographic Interpretation Today, we are going to talk about the abnormal excitation. As we said before,
PERMANENT PACEMAKERS AND IMPLANTABLE DEFIBRILLATORS Considerations for intensivists
 PERMANENT PACEMAKERS AND IMPLANTABLE DEFIBRILLATORS Considerations for intensivists Craig A. McPherson, MD, FACC Associate Professor of Medicine Constantine Manthous, MD, FACP, FCCP Associate Clinical
THE HEART Dr. Ali Ebneshahidi
 THE HEART Dr. Ali Ebneshahidi Functions is of the heart & blood vessels 1. The heart is an essential pumping organ in the cardiovascular system where the right heart pumps deoxygenated blood (returned
Major Function of the Cardiovascular System. Transportation. Structures of the Cardiovascular System. Heart - muscular pump
 Structures of the Cardiovascular System Heart - muscular pump Blood vessels - network of tubes Blood - liquid transport vehicle brachiocephalic trunk superior vena cava right pulmonary arteries right pulmonary
Chapter 20 (2) The Heart
 The Heart") Chapter 20 (2) The Heart ----------------------------------------------------------------------------------------------------------------------------------------- Describe the component and function of
Chapter 20 (2) The Heart ----------------------------------------------------------------------------------------------------------------------------------------- Describe the component and function of
Technique. Technique. Technique. Monitoring 1. Local anesthetic? Aseptic technique Hyper-extend (if radial)
") Critical Care Monitoring Hemodynamic Monitoring Arterial Blood Pressure Cannulate artery Uses 2 Technique Sites Locate artery, prep 3 1 Technique Local anesthetic? Aseptic technique Hyper-extend (if radial)
Critical Care Monitoring Hemodynamic Monitoring Arterial Blood Pressure Cannulate artery Uses 2 Technique Sites Locate artery, prep 3 1 Technique Local anesthetic? Aseptic technique Hyper-extend (if radial)
- what other structures, besides the heart, does the mediastinum contain?
 Basic A & P II Dr. L. Bacha Chapter Outline (Martini & Nath 2010) An Introduction to the Cardiovascular System - read the paragraphs under this heading on page 580 The Heart is a Four Chambered Organ describe
Lab #3: Electrocardiogram (ECG / EKG)
") Lab #3: Electrocardiogram (ECG / EKG) An introduction to the recording and analysis of cardiac activity Introduction The beating of the heart is triggered by an electrical signal from the pacemaker. The
Lab #3: Electrocardiogram (ECG / EKG) An introduction to the recording and analysis of cardiac activity Introduction The beating of the heart is triggered by an electrical signal from the pacemaker. The
Cardiac Output MCQ. Professor of Cardiovascular Physiology. Cairo University 2007
 Cardiac Output MCQ Abdel Moniem Ibrahim Ahmed, MD Professor of Cardiovascular Physiology Cairo University 2007 90- Guided by Ohm's law when : a- Cardiac output = 5.6 L/min. b- Systolic and diastolic BP
Complications of Acute Myocardial Infarction
 Acute Myocardial Infarction Complications of Acute Myocardial Infarction Diagnosis and Treatment JMAJ 45(4): 149 154, 2002 Hiroshi NONOGI Director, Division of Cardiology and Emergency Medicine, National
HISTORY. Question: What category of heart disease is suggested by this history? CHIEF COMPLAINT: Heart murmur present since early infancy.
 HISTORY 18-year-old man. CHIEF COMPLAINT: Heart murmur present since early infancy. PRESENT ILLNESS: Although normal at birth, a heart murmur was heard at the six week check-up and has persisted since
Collin County Community College
 Collin County Community College BIOL. 2402 Anatomy & Physiology WEEK 5 The Heart 1 The Heart Beat and the EKG 2 1 The Heart Beat and the EKG P-wave = Atrial depolarization QRS-wave = Ventricular depolarization
McHenry Western Lake County EMS System Paramedic, EMT-B and PHRN Optional Continuing Education 2018 #12 Understanding Preload and Afterload
 McHenry Western Lake County EMS System Paramedic, EMT-B and PHRN Optional Continuing Education 2018 #12 Understanding Preload and Afterload Cardiac output (CO) represents the volume of blood that is delivered
Step by step approach to EKG rhythm interpretation:
 Sinus Rhythms Normal sinus arrhythmia Small, slow variation of the R-R interval i.e. variation of the normal sinus heart rate with respiration, etc. Sinus Tachycardia Defined as sinus rhythm with a rate
Cardiovascular System
 Cardiovascular System Purpose Transport oxygen and nutrients Take waste products away from tissues & organs Things we learned Blood pressure: the force of blood pushing against the walls of blood vessels
Test Review Circulatory System Chapters
 Test Review Circulatory System Chapters 13-2010 1. The tissue that forms the tight fitting sac around the heart is the a. parietal pericardium c. myocardium b. visceral pericardium d. endocardium 2. Which
The Cardiovascular System
 The Cardiovascular System The Manila Times College of Subic Prepared by: Stevens B. Badar, RN, MANc THE HEART Anatomy of the Heart Location and Size approx. the size of a person s fist, hollow and cone-shaped,
BIOL 219 Spring Chapters 14&15 Cardiovascular System
 1 BIOL 219 Spring 2013 Chapters 14&15 Cardiovascular System Outline: Components of the CV system Heart anatomy Layers of the heart wall Pericardium Heart chambers, valves, blood vessels, septum Atrioventricular
10/23/2017. Muscular pump Two atria Two ventricles. In mediastinum of thoracic cavity 2/3 of heart's mass lies left of midline of sternum
 It beats over 100,000 times a day to pump over 1,800 gallons of blood per day through over 60,000 miles of blood vessels. During the average lifetime, the heart pumps nearly 3 billion times, delivering
SIKLUS JANTUNG. Rahmatina B. Herman
 SIKLUS JANTUNG Rahmatina B. Herman The Cardiac Cycle Definition: The cardiac events that occur from the beginning of one heartbeat to the beginning of the next The cardiac cycle consists of: - Diastole
Project 1: Circulation
 Project 1: Circulation This project refers to the matlab files located at: http://www.math.nyu.edu/faculty/peskin/modsimprograms/ch1/. Model of the systemic arteries. The first thing to do is adjust the
Outline. Electrical Activity of the Human Heart. What is the Heart? The Heart as a Pump. Anatomy of the Heart. The Hard Work
 Electrical Activity of the Human Heart Oguz Poroy, PhD Assistant Professor Department of Biomedical Engineering The University of Iowa Outline Basic Facts about the Heart Heart Chambers and Heart s The
Matters of the Heart: Comprehensive Cardiology SARAH BEANLANDS RN BSCN MSC
 Matters of the Heart: Comprehensive Cardiology SARAH BEANLANDS RN BSCN MSC Who am I? Class Outline Gross anatomy of the heart Trip around the heart Micro anatomy: cellular and tissue level Introduction
Normal Pericardial Physiology
 Normal Pericardial Physiology Normal pericardium contains 20-30 ml of lymphoid fluid lubricating function that facilitates normal myocardial rotation and translation during each cardiac cycle in that the