Left ventricular mass by 12-lead electrocardiogram in healthy subjects: comparison to cardiac magnetic resonance imaging.
|
|
|
- Beatrice Green
- 6 years ago
- Views:
Transcription

1 Left ventricular mass by 12-lead electrocardiogram in healthy subjects: comparison to cardiac magnetic resonance imaging. Carlsson, Minna B; Trägårdh, Elin; Engblom, Henrik; Hedström, Erik; Wagner, Galen; Pahlm, Olle; Arheden, Håkan Published in: Journal of Electrocardiology DOI: /j.jelectrocard Published: Link to publication Citation for published version (APA): Carlsson, M. B., Trägårdh, E., Engblom, H., Hedström, E., Wagner, G., Pahlm, O., & Arheden, H. (2006). Left ventricular mass by 12-lead electrocardiogram in healthy subjects: comparison to cardiac magnetic resonance imaging. Journal of Electrocardiology, 39(1), DOI: /j.jelectrocard General rights Copyright and moral rights for the publications made accessible in the public portal are retained by the authors and/or other copyright owners and it is a condition of accessing publications that users recognise and abide by the legal requirements associated with these rights. Users may download and print one copy of any publication from the public portal for the purpose of private study or research. You may not further distribute the material or use it for any profit-making activity or commercial gain You may freely distribute the URL identifying the publication in the public portal L UNDUNI VERS I TY PO Box L und
2 Take down policy If you believe that this document breaches copyright please contact us providing details, and we will remove access to the work immediately and investigate your claim. Download date: 13. Jun. 2018
3 This is an author produced version of a paper published in Journal of Electrocardiology. This paper has been peer-reviewed but does not include the final publisher proof-corrections or journal pagination. Citation for the published paper: Carlsson, Minna B and Tragardh, Elin and Engblom, Henrik and Hedstrom, Erik and Wagner, Galen and Pahlm, Olle and Arheden, Hakan. "Left ventricular mass by 12-lead electrocardiogram in healthy subjects: comparison to cardiac magnetic resonance imaging." Journal of Electrocardiology, 2006, Vol: 39, Issue: 1, pp Access to the published version may require journal subscription. Published with permission from: Elsevier
4 1 Left ventricular mass by 12-lead ECG in healthy subjects: Comparison to cardiac magnetic resonance imaging * Minna Carlsson, * Elin Trägårdh, MD, * Henrik Engblom, MD, Erik Hedström, Galen Wagner, MD, * Olle Pahlm, MD, PhD, * Håkan Arheden, MD, PhD * Department of Clinical Physiology, Lund University Hospital, Lund, Sweden, Duke University Medical Center, Durham, NC, USA Short title: LVM by ECG and CMR Financial support: The work was supported by the Swedish Research Council, the Swedish Heart-Lung Foundation, the Medical Faculty of Lund University and Region of Scania Address Correspondences to: Henrik Engblom, MD Lund University Hospital S Lund, Sweden Tel: Fax: henrik.engblom@med.lu.se
5 2 ABSTRACT The ability to estimate left ventricular mass (LVM) from the standard 12-lead electrocardiogram (ECG) has been shown to be limited, since there is a considerable variability of the normal 12-lead ECG due to demographic and anthropometric variables. We sought to study LVM, in healthy subjects, and its relationship with QRS duration and established electrocardiographic criteria for left ventricular hypertrophy (LVH). Cardiac magnetic resonance imaging (CMR) was used to measure LVM. Seventy-one healthy volunteers (36 males, age range years) were studied. All ECG criteria tested showed a statistically significant relationship with LVM. The highest R-value was found between LVM and QRS duration as well as the 12-lead voltage-duration product (R = 0.59, p < for both). The lowest R-value was found for the Sokolow-Lyon voltage criterion (R = 0.25, p = 0.033). LVM differed significantly between sexes, as did all ECG criteria except the Sokolow-Lyon criterion. Thus, in healthy subjects, QRS duration alone is equally or more strongly correlated to LVM than are established electrocardiographic LVH criteria. Keywords: left ventricular mass, magnetic resonance imaging, 12-lead ECG, healthy subjects, left ventricular hypertrophy
6 3 INTRODUCTION The ability to estimate left ventricular mass (LVM) from the standard 12-lead electrocardiogram (ECG) is limited. Demographic and anthropometric variables such as age, sex, height, weight and body fat all contribute to variability of the 12-lead ECG (1-12). Thus, heterogeneity with respect to these determinants may explain the limited accuracy of the 12- lead ECG in estimating LVM. Previous studies (13, 14) have shown that electrocardiographic criteria for left ventricular hypertrophy (LVH) which consider both QRS voltages and QRS duration are more strongly correlated to LVM than are QRS voltage criteria alone. In recent years, the clinical use of cardiac magnetic resonance (CMR) has increased substantially because of its high image quality in almost all patients and its great ability to depict soft tissue. These features permit CMR to measure cardiac structures and function with high accuracy and reproducibility, often superior to those achieved by other imaging modalities, such as echocardiography (15-17). Normal variability of QRS duration and voltages due to differences in LVM measured by CMR, in a population of healthy subjects over a wide age range, has not yet been explored. We therefore sought to investigate the relationship between LVM and QRS duration as well as various established electrocardiographic LVH criteria in healthy subjects, and to test the hypothesis that there is a strong relationship between LVM and QRS duration in comparison to the relationship between LVM and established electrocardiographic LVH criteria in this population. We also sought to explore the influence of demographic and anthropometric variables on the various ECG criteria.
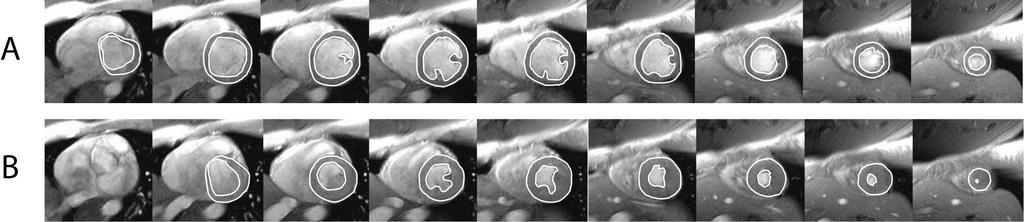
7 4 MATERIALS AND METHODS Study population and study design Seventy-one healthy volunteers (36 males, 35 females; age range, 21-82) were prospectively recruited from the local community in Lund, Sweden. Inclusion criteria were a) no history or clinical signs of cardiovascular disease, systemic or metabolic disease or treatment with medication b) normal 12-lead ECG (no signs of bundle branch block, fascicular block, preexcitation or ischemic heart disease) c) normal blood pressure (systolic 140 mmhg and diastolic 90 mmhg). No subject was excluded on the basis of global or local LV dysfunction or cardiac pathology on CMR. The study was approved by the local ethics committee at Lund University and all subjects gave their written, informed consent to participate in the study. Magnetic resonance imaging and analysis MR imaging was performed in supine position with head first on a commercially available 1.5T scanner (Vision, Siemens Medical Solutions, Erlangen, Germany) using a phased-array body coil. As previously described (18) a turbo fast low-angle shot scout imaging protocol permitted identification of the cardiac axis for performance of diagnostic short-axis imaging. Sequential gradient echo short-axis cine images (base to apex; slice thickness 10 mm, field of view 380 mm, matrix 126x256, repetition time 100 ms (echo-shared resulting in phases every 50 ms), time to echo 4.8 ms) covering the entire LV were acquired during breath hold after normal expiration. Three long-axis images (two-, three- and four-chamber views) were also acquired. The acquisition was triggered by ECG. The gradient echo short-axis images were used to measure LVM by planimetry of the manually defined endocardial and epicardial borders on each short-axis image covering the
8 5 entire LV (Fig 1). The measurement was performed in both end-diastole (Fig 1a) and endsystole (Fig 1b) to enable calculation of left ventricular ejection fraction. Papillary muscles were included in the LVM. To examine the interobserver variability a subset of 20 subjects was analyzed by 2 observers blinded to each other s results. Electrocardiographic recording and analysis The 12-lead ECGs were recorded on a MEGACART-R (Siemens-Elema AB, Solna, Sweden) with a sampling rate of 500 Hz and the frequency response set at the range of Hz. The ECG measurements were performed by computer. Before analysis, the ECGs were screened for abnormalities by an experienced ECG reader (GW). The following ECG criteria were examined: 12-lead sum of voltages (the sum of Q, R and S wave amplitudes in all 12 leads) (13), Sokolow-Lyon voltage (sum of S-wave amplitude in lead V1 and R-wave amplitude in lead V5 or V6) (19), Cornell voltage (sum of R-wave amplitude in lead avl and of S-wave amplitude in lead V3) (13), Gubner-Ungerleider voltage (sum of R-wave amplitude in lead I and S-wave amplitude in lead III) (20), RV5 voltage (Rwave amplitude in lead V5) and QRS duration. A voltage-duration product for each criterion was also calculated by multiplying the voltage criterion by QRS duration. Statistical analysis All measurements are expressed as mean ± SD. Continuous data were subjected to the Kolmogorov-Smirnov test to determine their distribution. A Gaussian distribution was found for all variables, except for the Gubner-Ungerleider product. However, since a large number of subjects was included in the study, parametric tests were performed throughout. Mean values for males and females were compared using independent Student s t-test. The Pearson correlation coefficient was used to assess the strength of the relationship between LVM and
9 6 various ECG criteria. Differences in correlation coefficients between QRS duration and the ECG voltage criteria as well as the difference for each of the corresponding voltages and voltage-duration products were compared by two-tailed tests after application of Fisher s Z transformation. Multiple regression analysis with forward selection was used to assess the influence of LVM, age, height, weight, and BSA on the various ECG criteria. The contributions of individual variables were reported as the partial R-value. Inter-observer variability was assessed by Pearson s correlation coefficient. P-value < 0.05 was considered to indicate statistical significance. SPSS for Windows, version 12.0 (SPSS Inc., Chicago, Il) was used for all statistical analyses.
10 7 RESULTS Study population characteristics The study population was well distributed into different age groups (Table 1). There was a good balance between sexes. The LVM ranged from 96g 223g. Relation between LVM and ECG criteria The correlations between LVM and the ECG criteria are shown in Table 2. The ECG criteria with the highest R-values were the QRS duration (Figure 2A) and 12-lead voltage-duration product (R = 0.59, p < for both). The Sokolow-Lyon voltage criterion (Figure 2B) showed the lowest R-value (R = 0.25, p = 0.033). QRS duration was more strongly correlated to LVM than were the Sokolow-Lyon voltage, Gubner-Ungerleider voltage and RV5 criteria (p = 0.005, p = and p = 0.030, respectively). However, the differences between QRS duration and Cornell voltage as well as 12-lead sum of voltages were not significant (p = 0.29 and p = 0.32). For all ECG criteria, the R-value increased when voltage-duration product was considered instead of the voltage criterion alone. This was most prominent for the Sokolow- Lyon criterion. Although the trend was clear, the increase in R-value was not statistically significant for any of the voltage-duration products. The variability of LVM measurement was 0.5 ± 4g between readers (R = 0.99). Influence of demographic and anthropometric variables The influence of demographic and anthropometric variables on the ECG criteria is shown in Table 3. LVM was the only independent predictor of the Cornell voltage and voltage-duration product criteria as well as the RV5 voltage-duration product criterion. In addition to LVM,
11 8 height remained significant for prediction of QRS duration. Of interest, LVM was not an independent predictor of the Sokolow-Lyon voltage criterion. Sex differences The sex differences in demographic and anthropometric variables as well as the various ECG criteria are shown in Table 4. LVM differed significantly between males and females (186g ± 21g vs. 138g ± 23g). A significant sex difference was also found for all other demographic and anthropometric variables except for age (p = 0.75). Furthermore, a significant difference was found between males and females for all ECG criteria, except for the Sokolow-Lyon voltage criterion (p = 0.13).
12 9 DISCUSSION The main result of this study was that in healthy subjects QRS duration alone is equally or more strongly correlated to LVM than are established electrocardiographic LVH criteria. Influence of demographic and anthropometric variables on the QRS complex The data show a clear trend towards increased correlation coefficients for LVM and established electrocardiographic LVH criteria when multiplying the voltage criterion with QRS duration (voltage-duration product). Sugita et al (10) have previously shown that the correlation between LVM assessed by echocardiography and RV5 is significantly better in adolescents within the low and middle body-fat range than adolescents in the high body-fat range. It may be that in the absence of conduction disturbances due to LVH, the amount of body fat affects QRS voltages more than QRS duration, thus explaining why R-values for voltage-duration products are equal or lower than that of QRS duration alone in subjects with no cardiac disease. Body fat was, however, not considered in the present study. All ECG criteria that depend on absolute voltages in single leads (all ECG criteria except QRS duration and the12-lead sum of voltages in the present study) are sensitive to the electrical axis in the frontal or horizontal plane. Hence, independence of electrical axis might explain why QRS duration and 12-lead voltage-duration product showed higher correlation coefficients than the other electrocardiographic LVH criteria. The finding that the correlation coefficients increased for all ECG criteria when the QRS voltage-duration product was considered instead of the simple voltage criteria is supported by the findings in a previous study by Okin et al (14) in which LVM was assessed by echocardiography. In that study, however, QRS duration alone was not as strongly correlated
13 10 to LVM as for instance the Sokolow-Lyon voltage criterion, which showed the weakest correlation to LVM in the present study. Left ventricular hypertrophy versus physiological differences in LVM Previous animal and human studies have shown that the pathologically changed myocardium found in LVH differs from the healthy myocardium at molecular, cellular and tissue level (21-27). Thus, LVH may lead to changes in the myocardial conduction properties and alter the ECG in different ways than a physiologically large heart. Changes in QRS-duration with increasing LVM within normal physiological limits may be attributed to a longer time required to activate the increased amount of myocardium itself. Sex differences There was a significant difference between males and females with regard to all variables examined except age and the Sokolow-Lyon voltage criterion. These findings are in accordance with previous reports on sex differences of LVM and ECG measures (1, 16, 28, 29). The lower voltages found in females might be explained by the lower LVM, height, weight and body surface area found in this group. It has previously been shown, however, that some sex differences in ECG measures persist after correcting for these anthropometric variables (5). Another variable potentially contributing to differences in voltages between males and females might be the increased distance between the precordial leads and the myocardium in females caused by increased amount of breast tissue in this group (30). In fact, increased QRS voltages have been found after mastectomy (31).
14 11 Limitations of the study In the present study a relatively small number of subjects was studied, compared to previous studies comparing LVM and ECG criteria (10, 14, 32). In these previous studies, however, LVM was assessed by echocardiography, which has considerably lower accuracy than CMR for quantitative measurements of LVM (17). Furthermore, the range of LVM was limited compared to these previous studies since only healthy subjects were studied. The ECG criteria tested were all developed to diagnose LVH. The aim of the present study was, however, to study how these ECG criteria vary with LVM in healthy subjects. Furthermore, the study population was well balanced regarding both sexes and age. The gradient-echo MR technique used in the present study has been shown to slightly overestimate LVM (33) compared to the more recent developed steady state free precession MR technique. It does, however, not affect the relationship between LVM and the ECG criteria examined in the present study, since this was a systematic difference. CONLUSION In healthy subjects QRS duration alone is equally or more strongly correlated to LVM than are established electrocardiographic LVH criteria.
15 12 REFERENCES 1. Macfarlane P. Normal limits. In: Macfarlane P, Lawrie T, editors. Comprehensive electrocardiology: Theory and practice in health and disease. 1st ed. New York: Pergamon press; p Wershing JM, Walker CH. Influence of Age, Sex, and Body Habitus on the Mean Qrs Electrical Axis in Childhood and Adolescence. Br Heart J 1963;25: Bachman S, Sparrow D, Smith LK. Effect of aging on the electrocardiogram. Am J Cardiol 1981;48(3): Green LS, Lux RL, Haws CW, et al. Effects of age, sex, and body habitus on QRS and ST-T potential maps of 1100 normal subjects. Circulation 1985;71(2): Okin PM, Roman MJ, Devereux RB, et al. Gender Differences and the Electrocardiogram in Left Ventricular Hypertrophy. Hypertension 1995;25(2): Norman JE, Jr., Levy D. Improved electrocardiographic detection of echocardiographic left ventricular hypertrophy: results of a correlated data base approach. J Am Coll Cardiol 1995;26(4): Norman JE, Jr., Levy D. Adjustment of ECG left ventricular hypertrophy criteria for body mass index and age improves classification accuracy. The effects of hypertension and obesity. J Electrocardiol 1996;29 Suppl: Okin PM, Roman MJ, Devereux RB, et al. ECG identification of left ventricular hypertrophy. Relationship of test performance to body habitus. J Electrocardiol 1996;29 Suppl:
16 13 9. Tochikubo O, Miyajima E, Shigemasa T, et al. Relation between body fat-corrected ECG voltage and ambulatory blood pressure in patients with essential hypertension. Hypertension 1999;33(5): Sugita S, Takada K, Takada H, et al. The relationship between R amplitude in lead V5 (RV5) and left ventricular mass in the groups of adolescent subjects classified by body composition. Jpn Circ J 1998;62(12): Sugita S, Takada K, Hayano J. Influence of body composition on electrocardiographic identification of left ventricular hypertrophy in adolescents. Cardiology 1999;91(2): Regecova V, Andrasyova D. [Relation between anthropometric indicators and electrocardiogram variability]. Vnitr Lek 2002;48 Suppl 1: Molloy TJ, Okin PM, Devereux RB, et al. Electrocardiographic detection of left ventricular hypertrophy by the simple QRS voltage-duration product. J Am Coll Cardiol 1992;20(5): Okin PM, Roman MJ, Devereux RB, et al. Electrocardiographic identification of increased left ventricular mass by simple voltage-duration products. J Am Coll Cardiol 1995;25(2): Semelka RC, Tomei E, Wagner S, et al. Interstudy reproducibility of dimensional and functional measurements between cine magnetic resonance studies in the morphologically abnormal left ventricle. Am Heart J 1990;119(6): Semelka RC, Tomei E, Wagner S, et al. Normal left ventricular dimensions and function: interstudy reproducibility of measurements with cine MR imaging. Radiology 1990;174(3 Pt 1):763-8.
17 Bellenger NG, Davies LC, Francis JM, et al. Reduction in sample size for studies of remodeling in heart failure by the use of cardiovascular magnetic resonance. J Cardiovasc Magn Reson 2000;2(4): Engblom H, Hedstrom E, Palmer J, et al. Determination of the left ventricular longaxis orientation from a single short-axis MR image: relation to BMI and age. Clin Physiol Funct Imaging 2004;24(5): Sokolow M, Lyon TP. Ventricular complex in left ventricular hypertrophy as obtained by unipolar precordial and limb lead. Am Heart J 1949;37: Gubner R, Ungerleider H. Electrocardiographic criteria of left ventricular hypertrophy. Arch Intern Med 1943;72: Toyoshima H, Park YD, Ishikawa Y, et al. Effect of ventricular hypertrophy on conduction velocity of activation front in the ventricular myocardium. Am J Cardiol 1982;49(8): Winterton SJ, Turner MA, O'Gorman DJ, et al. Hypertrophy causes delayed conduction in human and guinea pig myocardium: accentuation during ischaemic perfusion. Cardiovasc Res 1994;28(1): Cooklin M, Wallis WR, Sheridan DJ, et al. Changes in cell-to-cell electrical coupling associated with left ventricular hypertrophy. Circ Res 1997;80(6): McIntyre H, Fry CH. Abnormal action potential conduction in isolated human hypertrophied left ventricular myocardium. J Cardiovasc Electrophysiol 1997;8(8): Peters NS, Green CR, Poole-Wilson PA, et al. Reduced content of connexin43 gap junctions in ventricular myocardium from hypertrophied and ischemic human hearts. Circulation 1993;88(3):
18 Goldfine SM, Walcott B, Brink PR, et al. Myocardial connexin43 expression in left ventricular hypertrophy resulting from aortic regurgitation. Cardiovasc Pathol 1999;8(1): Yamamoto S, James TN, Sawada K, et al. Generation of new intercellular junctions between cardiocytes. A possible mechanism compensating for mechanical overload in the hypertrophied human adult myocardium. Circ Res 1996;78(3): Lorenz CH, Walker ES, Morgan VL, et al. Normal human right and left ventricular mass, systolic function, and gender differences by cine magnetic resonance imaging. J Cardiovasc Magn Reson 1999;1(1): Salton CJ, Chuang ML, O'Donnell CJ, et al. Gender differences and normal left ventricular anatomy in an adult population free of hypertension. A cardiovascular magnetic resonance study of the Framingham Heart Study Offspring cohort. J Am Coll Cardiol 2002;39(6): Hashida E, Nishi T. Constitutional and echocardiographic variability of the normal electrocardiogram in children. J Electrocardiol 1988;21(3): LaMonte CS, Freiman AH. The electrocardiogram after mastectomy. Circulation 1965;32(5): Crow RS, Prineas RJ, Rautaharju P, et al. Relation between electrocardiography and echocardiography for left ventricular mass in mild systemic hypertension (results from Treatment of Mild Hypertension Study). Am J Cardiol 1995;75(17): Francois CJ, Fieno DS, Shors SM, et al. Left ventricular mass: manual and automatic segmentation of true FISP and FLASH cine MR images in dogs and pigs. Radiology 2004;230(2):
19 16 FIGURE LEGENDS Figure 1 Delineation of endocardium and epicardium on cardiac magnetic resonance short-axis images. The left ventricular mass was delineated in both end-diastole (A) and end-systole (B) to enable determination of left ventricular ejection fraction. Figure 2 The relationship between LVM and (A) QRS duration and (B) the Sokolow-Lyon voltage criterion. QRS duration showed the highest R-value and Sokolow-Lyon voltage criterion the lowest of the ECG criteria examined.
20 Table 1. Study population characteristics mean ± SD Age (yrs) 47 ± n = n = n = n = n = 7 > 70 n = 9 Sex (males/females) 36/35 Weight (kg) 74 ± 13 Height (cm) 175 ± 9 Body surface area (m 2 ) 1.89 ± 0.19 Left ventricular mass (g) 162 ± 32 End-diastolic volume (ml) 140 ± 31 End-systolic volume (ml) 55 ± 18 Ejection fraction (%) 61 ± 8
21 Table 2. The univariate relationships between electrocardiographic criteria and left ventricular mass Voltage alone Voltage-duration product ECG criterion R (R 2 ) P value R (R 2 ) P value Sokolow-Lyon 0.25 (0.06) (0.18) <0.001 Gubner-Ungerleider 0.32 (0.10) (0.18) <0.001 RV (0.13) (0.22) <0.001 Cornell 0.49 (0.24) < (0.32) < lead sum 0.49 (0.24) < (0.35) <0.001 QRS duration 0.59 (0.35) <
22 Table 3. Stepwise multiple linear regression analysis of electrocardiographic criteria with demographic and anthropometric variables. ECG criteria β-coefficient Partial R Overall R P value Sokolow-Lyon voltage 0.53 <0.001 Age Height <0.001 Weight Sokolow-Lyon product 0.62 <0.001 LVM Age Height Weight <0.001 Gubner-Ungerleider voltage 0.45 <0.001 LVM Age Gubner-Ungerleider product 0.50 <0.001 LVM <0.001 Age RV5 voltage 0.51 <0.001 LVM Height Weight RV5 product 0.47 <0.001 LVM 0.47 <0.001 Cornell voltage 0.49 <0.001 LVM 0.49 <0.001 Cornell product 0.57 <0.001 LVM 0.57 < lead sum voltage 0.63 <0.001 LVM <0.001 Age Weight lead sum product 0.66 <0.001 LVM <0.001 Age Weight QRS duration 0.62 <0.001 LVM Height
23 Table 4. Sex differences (mean ± SD). Males Females P value Age (yrs) 46 ± ± Weight (kg) 81 ± 9 67 ± 13 < Height (cm) 181 ± ± 6 < BSA (m 2 ) 2.01 ± ± 0.17 < LVM (g) 186 ± ± 23 < QRS duration (ms) 96 ± 9 85 ± 6 < lead sum of voltages (mv) 16.8 ± ± lead sum product 1630 ± ± 257 < RV5 (mv) 1.8 ± ± RV5 product 127 ± ± 34 < Sokolow-Lyon voltage 2.7 ± ± Sokolow-Lyon product 258 ± ± Cornell voltage 1.5 ± ± 0.3 < Cornell product 144 ± ± 29 < Gubner-Ungerleider voltage 1.0 ± ± Gubner-Ungerleider product 95 ± ±
24
25
Access to the published version may require journal subscription. Published with permission from: Blackwell Synergy
 This is an author produced version of a paper published in Clinical Physiology and Functional Imaging. This paper has been peer-reviewed but does not include the final publisher proof-corrections or journal
Measurement of Ventricular Volumes and Function: A Comparison of Gated PET and Cardiovascular Magnetic Resonance
 BRIEF COMMUNICATION Measurement of Ventricular Volumes and Function: A Comparison of Gated PET and Cardiovascular Magnetic Resonance Kim Rajappan, MBBS 1,2 ; Lefteris Livieratos, MSc 2 ; Paolo G. Camici,
Impaired Regional Myocardial Function Detection Using the Standard Inter-Segmental Integration SINE Wave Curve On Magnetic Resonance Imaging
 Original Article Impaired Regional Myocardial Function Detection Using the Standard Inter-Segmental Integration Ngam-Maung B, RT email : chaothawee@yahoo.com Busakol Ngam-Maung, RT 1 Lertlak Chaothawee,
Left ventricular hypertrophy (LVH) carries a substantial
 carries a substantial") New Gender-Specific Partition Values for ECG Criteria of Left Ventricular Hypertrophy Recalibration Against Cardiac MRI Khaled Alfakih, Kevin Walters, Tim Jones, John Ridgway, Alistair S. Hall, Mohan Sivananthan
New Gender-Specific Partition Values for ECG Criteria of Left Ventricular Hypertrophy Recalibration Against Cardiac MRI Khaled Alfakih, Kevin Walters, Tim Jones, John Ridgway, Alistair S. Hall, Mohan Sivananthan
Impact of the ECG gating method on ventricular volumes and ejection fractions assessed by cardiovascular magnetic resonance imaging
 Journal of Cardiovascular Magnetic Resonance (2005) 7, 441 446 Copyright D 2005 Taylor & Francis Inc. ISSN: 1097-6647 print / 1532-429X online DOI: 10.1081/JCMR-200053515 VENTRICULAR FUNCTION Impact of
Electrocardiographic assessment of left ventricular hypertrophy with time voltage QRS and QRST-wave areas
 (2004) 18, 33 40 & 2004 Nature Publishing Group All rights reserved 0950-9240/04 $25.00 www.nature.com/jhh ORIGINAL ARTICLE Electrocardiographic assessment of left ventricular hypertrophy with time voltage
Regression of Electrocardiographic Left Ventricular Hypertrophy by Losartan Versus Atenolol
 Regression of Electrocardiographic Left Ventricular Hypertrophy by Losartan Versus Atenolol The Losartan Intervention For Endpoint reduction in hypertension (LIFE) Study Peter M. Okin, MD; Richard B. Devereux,
Velocity Vector Imaging as a new approach for cardiac magnetic resonance: Comparison with echocardiography
 Velocity Vector Imaging as a new approach for cardiac magnetic resonance: Comparison with echocardiography Toshinari Onishi 1, Samir K. Saha 2, Daniel Ludwig 1, Erik B. Schelbert 1, David Schwartzman 1,
ECGs of structural heart disease: Part I
 Electrocardiography Series Singapore Med J 2011; 52(12) 855 CME Article ECGs of structural heart disease: Part I Poh K K, Teo S G, Tay E L W, Yip J WL Cardiac Department, National University Heart Centre,
Ann Acad Med Singapore 2015;44: Key words: Cornell, Ethnicity, Sokolow-Lyon, Voltage
 Original Article 274 Electrocardiographic Criteria for Left Ventricular Hypertrophy in Asians Differs from Criteria Derived from Western Populations Community-based Data from an Asian Population Chang
Dr. Dermot Phelan MB BCh BAO PhD European Society of Cardiology 2012
 Relative Apical Sparing of Longitudinal Strain Using 2- Dimensional Speckle-Tracking Echocardiography is Both Sensitive and Specific for the Diagnosis of Cardiac Amyloidosis. Dr. Dermot Phelan MB BCh BAO
Global left ventricular circumferential strain is a marker for both systolic and diastolic myocardial function
 Global left ventricular circumferential strain is a marker for both systolic and diastolic myocardial function Toshinari Onishi 1, Samir K. Saha 2, Daniel Ludwig 1, Erik B. Schelbert 1, David Schwartzman
The value of the coefficient of variation in assessing repeat variation in ECG measurements
 European Heart Journal (1998) 19, 342 351 The value of the coefficient of variation in assessing repeat variation in ECG measurements S. C. McLaughlin*, T. C. Aitchison and P. W. Macfarlane* *Department
How much are atrial volumes and ejection fractions assessed by cardiac magnetic resonance imaging influenced by the ECG gating method?
 Journal of Cardiovascular Magnetic Resonance (2005) 7, 587 593 Copyright D 2005 Taylor & Francis Inc. ISSN: 1097-6647 print / 1532-429X online DOI: 10.1081/JCMR-200060635 VENTRICULAR FUNCTION How much
Gender-Adjustment and Cutoff Values of Cornell Product in Hypertensive Japanese Patients
 CLINICAL STUDY Gender-Adjustment and Cutoff Values of Cornell Product in Hypertensive Japanese Patients Joji Ishikawa, 1 MD, Yuko Yamanaka, 2 MD, Ayumi Toba, 1 MD, Shintaro Watanabe, 3 MD and Kazumasa
Assessment of Peguero Lo-Presti Criteria for Electrocardiographic. Diagnosis of LVH in Indian Subjects
 Research Article Assessment of Peguero Lo-Presti Criteria for Electrocardiographic Diagnosis of LVH in Indian Subjects Suresh V Patted, Sanjay C Porwal*, Sameer S Ambar, M R Prasad, Akshay S Chincholi,
Impact of Papillary Muscles in Ventricular Volume and Ejection Fraction Assessment by Cardiovascular Magnetic Resonance
 JOURNAL OF CARDIOVASCULAR MAGNETIC RESONANCE 1 Vol. 6, No. 1, pp. 9 16, 2004 VENTRICULAR FUNCTION Impact of Papillary Muscles in Ventricular Volume and Ejection Fraction Assessment by Cardiovascular Magnetic
UK Biobank. Imaging modality Cardiovascular Magnetic Resonance (CMR) Version th Oct 2015
 Version th Oct 2015") Imaging modality Cardiovascular Magnetic Resonance (CMR) Version 1.0 http://www.ukbiobank.ac.uk/ 30 th Oct 2015 This document details the procedure for the CMR scan performed at an Imaging assessment centre
Imaging modality Cardiovascular Magnetic Resonance (CMR) Version 1.0 http://www.ukbiobank.ac.uk/ 30 th Oct 2015 This document details the procedure for the CMR scan performed at an Imaging assessment centre
The Electrocardiogram part II. Dr. Adelina Vlad, MD PhD
 The Electrocardiogram part II Dr. Adelina Vlad, MD PhD Basic Interpretation of the ECG 1) Evaluate calibration 2) Calculate rate 3) Determine rhythm 4) Determine QRS axis 5) Measure intervals 6) Analyze
HIGH voltage of R waves in left precordial leads of the electrocardiogram
 R-WAVE VOLTAGE CHANGES IN RELATION TO ARTERIAL PRESSURE IN HYPERTENSIVE PATIENTS ATHAN J. GEORGOPOULOS, M.D.,* PHILIP A. VLASTARIS, M.D.,f and WILLIAM L. PROUDFIT, M.D. Department of Cardiovascular Disease
Automatic cardiac contour propagation in short axis cardiac MR images
 International Congress Series 1281 (2005) 351 356 www.ics-elsevier.com Automatic cardiac contour propagation in short axis cardiac MR images G.L.T.F. Hautvast a,b, T, M. Breeuwer a, S. Lobregt a, A. Vilanova
How NOT to miss Hypertrophic Cardiomyopathy? Adaya Weissler-Snir, MD University Health Network, University of Toronto
 How NOT to miss Hypertrophic Cardiomyopathy? Adaya Weissler-Snir, MD University Health Network, University of Toronto Introduction Hypertrophic cardiomyopathy is the most common genetic cardiomyopathy,
CME. Original Research
 CME JOURNAL OF MAGNETIC RESONANCE IMAGING 38:829 835 (2013) Original Research Interstudy Variability in Cardiac Magnetic Resonance Imaging Measurements of Ventricular Volume, Mass, and Ejection Fraction
Ten recommendations for Osteoarthritis and Cartilage (OAC) manuscript preparation, common for all types of studies.
 manuscript preparation, common for all types of studies.") Ten recommendations for Osteoarthritis and Cartilage (OAC) manuscript preparation, common for all types of studies. Ranstam, Jonas; Lohmander, L Stefan Published in: Osteoarthritis and Cartilage DOI: 10.1016/j.joca.2011.07.007
Ten recommendations for Osteoarthritis and Cartilage (OAC) manuscript preparation, common for all types of studies. Ranstam, Jonas; Lohmander, L Stefan Published in: Osteoarthritis and Cartilage DOI: 10.1016/j.joca.2011.07.007
Single and Biplane TrueFISP Cardiovascular Magnetic Resonance for Rapid Evaluation of Left Ventricular Volumes and Ejection Fraction
 JOURNAL OF CARDIOVASCULAR MAGNETIC RESONANCE 1 Vol. 6, No. 3, pp. 593 600, 2004 FUNCTION Single and Biplane TrueFISP Cardiovascular Magnetic Resonance for Rapid Evaluation of Left Ventricular Volumes and
It is occasionally problematic to differentiate ST-segment
 CLINICAL INVESTIGATION Differential Diagnosis of Acute Pericarditis From Normal Variant Early Repolarization and Left Ventricular Hypertrophy With Early Repolarization: An Electrocardiographic Study Ravindra
Impact of high-pass filtering on ECG quality and clinical interpretation: a comparison between 40 Hz and 150 Hz cutoff in an outpatient population
 Impact of high-pass filtering on ECG quality and clinical interpretation: a comparison between 40 Hz and 150 Hz cutoff in an outpatient population Danilo Ricciardi, MD Cardiovascular Sciences Department
CORNELL PRODUCT INDEX FOR LEFT VENTRICULAR HYPERTROPHY. DOES IT PERFORM BETTER?
 PAKISTAN HEART JOURNAL VOL. 42 NO. 1 2 JANUARY - JUNE 2009 CORNELL PRODUCT INDEX FOR LEFT VENTRICULAR HYPERTROPHY. DOES IT PERFORM BETTER? ABSTRACT HABIB-UR-RAHMAN QADRI 1, HAKIM ALI ABRO 2, SAEED AHMED
4/14/15. The Electrocardiogram. In jeopardy more than a century after its introduction by Willem Einthoven? Time for a revival. by Hein J.
 The Electrocardiogram. In jeopardy more than a century after its introduction by Willem Einthoven? Time for a revival. by Hein J. Wellens MD 1 Einthoven, 1905 The ECG! Everywhere available! Easy and rapid
LV function in ischemic heart failure - decreased correlation between Echo and CMR
 LV function in ischemic heart failure - decreased correlation between Echo and CMR Poster No.: C-0590 Congress: ECR 2011 Type: Scientific Exhibit Authors: K. Gruszczy#ska, L. Krzych, K. Golba, P. Ulbrych,
ST Segment Body Surface Isointegral Maps in Patients With Arterial Hypertension
 ST Segment Body Surface Isointegral Maps in Patients With Arterial Hypertension Katarína Kozlíková 1, Juraj Martinka 1, Jozef Bulas 2 1 Institute of Medical Physics and Biophysics, Comenius University
ECG INTERPRETATION MANUAL
 Lancashire & South Cumbria Cardiac Network ECG INTERPRETATION MANUAL THE NORMAL ECG Lancashire And South Cumbria Cardiac Physiologist Training Manual THE NORMAL ECG E.C.G CHECKLIST 1) Name, Paper Speed,
Nancy Goldman Cutler, MD Beaumont Children s Hospital Royal Oak, Mi
 Nancy Goldman Cutler, MD Beaumont Children s Hospital Royal Oak, Mi Identify increased LV wall thickness (WT) Understand increased WT in athletes Understand hypertrophic cardiomyopathy (HCM) Enhance understanding
INTRODUCTION TO ECG. Dr. Tamara Alqudah
 INTRODUCTION TO ECG Dr. Tamara Alqudah Excitatory & conductive system of the heart + - The ECG The electrocardiogram, or ECG, is a simple & noninvasive diagnostic test which records the electrical
ECG SIGNS OF HYPERTROPHY OF HEART ATRIUMS AND VENTRICLES
 Ministry of Health of Ukraine Kharkiv National Medical University ECG SIGNS OF HYPERTROPHY OF HEART ATRIUMS AND VENTRICLES Methodical instructions for students Рекомендовано Ученым советом ХНМУ Протокол
Right Ventricular Strain in Normal Healthy Adult Filipinos: A Retrospective, Cross- Sectional Pilot Study
 Right Ventricular Strain in Normal Healthy Adult Filipinos: A Retrospective, Cross- Sectional Pilot Study By Julius Caesar D. de Vera, MD Jonnah Fatima B. Pelat, MD Introduction Right ventricle contributes
Dr. A. Manjula, No. 7, Doctors Quarters, JLB Road, Next to Shree Guru Residency, Mysore, Karnataka, INDIA.
 Original Article In hypertensive patients measurement of left ventricular mass index by echocardiography and its correlation with current electrocardiographic criteria for the diagnosis of left ventricular
Conflict of interest: none declared
 The value of left ventricular global longitudinal strain assessed by three-dimensional strain imaging in the early detection of anthracycline-mediated cardiotoxicity C. Mornoş, A. Ionac, D. Cozma, S. Pescariu,
ELECTROCARDIOGRAPH. General. Heart Rate. Starship Children s Health Clinical Guideline
 General Heart Rate QRS Axis T Wave Axis PR Interval according to Heart Rate & Age P Wave Duration and Amplitude QRS Duration according to Age QT Interval R & S voltages according to Lead & Age R/S ratio
ELECTROCARDIOGRAPHY (ECG)
") ELECTROCARDIOGRAPHY (ECG) The heart is a muscular organ, which pumps blood through the blood vessels of the circulatory system. Blood provides the body with oxygen and nutrients, as well as assists in
ELECTROCARDIOGRAPHY (ECG) The heart is a muscular organ, which pumps blood through the blood vessels of the circulatory system. Blood provides the body with oxygen and nutrients, as well as assists in
Reproducibility and Accuracy of Echocardiographic Measurements of Left Ventricular Parameters Using Real-Time Three-Dimensional Echocardiography
 Journal of the American College of Cardiology Vol. 44, No. 4, 2004 2004 by the American College of Cardiology Foundation ISSN 0735-1097/04/$30.00 Published by Elsevier Inc. doi:10.1016/j.jacc.2004.05.050
Clinical material and methods. Departments of 1 Cardiology and 2 Anatomy, Gaziantep University, School of Medicine, Gaziantep, Turkey
 Interatrial Block and P-Terminal Force: A Reflection of Mitral Stenosis Severity on Electrocardiography Murat Yuce 1, Vedat Davutoglu 1, Cayan Akkoyun 1, Nese Kizilkan 2, Suleyman Ercan 1, Murat Akcay
Echocardiographic Assessment of the Left Ventricle
 Echocardiographic Assessment of the Left Ventricle Theodora Zaglavara, MD, PhD, BSCI/BSCCT Department of Cardiovascular Imaging INTERBALKAN EUROPEAN MEDICAL CENTER 2015 The quantification of cardiac chamber
Biventricular Enlargement/ Hypertrophy
 Biventricular Enlargement/ Hypertrophy Keywords congenital heart disease left ventricular hypertrophy right ventricular hypertrophy SR MITTAL Abstract Electrocardiographic diagnosis of early biventricular
FLT3 mutations in patients with childhood acute lymphoblastic leukemia (ALL)
") FLT3 mutations in patients with childhood acute lymphoblastic leukemia (ALL) Kabir, Nuzhat N.; Rönnstrand, Lars; Uddin, Kazi Published in: Medical Oncology DOI: 10.1007/s12032-013-0462-6 Published: 2013-01-01
FLT3 mutations in patients with childhood acute lymphoblastic leukemia (ALL) Kabir, Nuzhat N.; Rönnstrand, Lars; Uddin, Kazi Published in: Medical Oncology DOI: 10.1007/s12032-013-0462-6 Published: 2013-01-01
PRELIMINARY STUDIES OF LEFT VENTRICULAR WALL THICKNESS AND MASS OF NORMOTENSIVE AND HYPERTENSIVE SUBJECTS USING M-MODE ECHOCARDIOGRAPHY
 Malaysian Journal of Medical Sciences, Vol. 9, No. 1, January 22 (28-33) ORIGINAL ARTICLE PRELIMINARY STUDIES OF LEFT VENTRICULAR WALL THICKNESS AND MASS OF NORMOTENSIVE AND HYPERTENSIVE SUBJECTS USING
Impact of the Revision of Arrhythmogenic Right Ventricular Cardiomyopathy/Dysplasia Task Force Criteria on Its Prevalence by CMR Criteria
 JACC: CARDIOVASCULAR IMAGING VOL. 4, NO. 3, 2011 2011 BY THE AMERICAN COLLEGE OF CARDIOLOGY FOUNDATION ISSN 1936-878X/$36.00 PUBLISHED BY ELSEVIER INC. DOI:10.1016/j.jcmg.2011.01.005 Impact of the Revision
cardiac imaging planes planning basic cardiac & aortic views for MR
 cardiac imaging planes planning basic cardiac & aortic views for MR Dianna M. E. Bardo, M. D. Assistant Professor of Radiology & Cardiovascular Medicine Director of Cardiac Imaging cardiac imaging planes
5- The normal electrocardiogram (ECG)
") 5- The (ECG) Introduction Electrocardiography is a process of recording electrical activities of heart muscle at skin surface. The electrical current spreads into the tissues surrounding the heart, a small
5- The (ECG) Introduction Electrocardiography is a process of recording electrical activities of heart muscle at skin surface. The electrical current spreads into the tissues surrounding the heart, a small
General Cardiovascular Magnetic Resonance Imaging
 2 General Cardiovascular Magnetic Resonance Imaging 19 Peter G. Danias, Cardiovascular MRI: 150 Multiple-Choice Questions and Answers Humana Press 2008 20 Cardiovascular MRI: 150 Multiple-Choice Questions
Advanced Multi-Layer Speckle Strain Permits Transmural Myocardial Function Analysis in Health and Disease:
 Advanced Multi-Layer Speckle Strain Permits Transmural Myocardial Function Analysis in Health and Disease: Clinical Case Examples Jeffrey C. Hill, BS, RDCS Echocardiography Laboratory, University of Massachusetts
CARDIAC MRI. Cardiovascular Disease. Cardiovascular Disease. Cardiovascular Disease. Overview
 CARDIAC MRI Dr Yang Faridah A. Aziz Department of Biomedical Imaging University of Malaya Medical Centre Cardiovascular Disease Diseases of the circulatory system, also called cardiovascular disease (CVD),
ORIGINAL ARTICLE. Koichi Okuda, PhD 1) and Kenichi Nakajima, MD 2) Annals of Nuclear Cardiology Vol. 3 No
 and Kenichi Nakajima, MD 2) Annals of Nuclear Cardiology Vol. 3 No") Annals of Nuclear Cardiology Vol. 3 No. 1 29-33 ORIGINAL ARTICLE Normal Values and Gender Differences of Left Ventricular Functional Parameters with CardioREPO Software: Volume, Diastolic Function, and
Annals of Nuclear Cardiology Vol. 3 No. 1 29-33 ORIGINAL ARTICLE Normal Values and Gender Differences of Left Ventricular Functional Parameters with CardioREPO Software: Volume, Diastolic Function, and
Normal Human Left and Right Ventricular Dimensions for MRI as Assessed by Turbo Gradient Echo and Steady-State Free Precession Imaging Sequences
 JOURNAL OF MAGNETIC RESONANCE IMAGING 17:323 329 (2003) Original Research Normal Human Left and Right Ventricular Dimensions for MRI as Assessed by Turbo Gradient Echo and Steady-State Free Precession
Available online at Received 17 August 2007
 Available online at www.sciencedirect.com Journal of Electrocardiology 42 (2009) 139 144 www.jecgonline.com Comparison of the correlation of the Selvester QRS scoring system with cardiac contrast-enhanced
LV FUNCTION ASSESSMENT: WHAT IS BEYOND EJECTION FRACTION
 LV FUNCTION ASSESSMENT: WHAT IS BEYOND EJECTION FRACTION Jamilah S AlRahimi Assistant Professor, KSU-HS Consultant Noninvasive Cardiology KFCC, MNGHA-WR Introduction LV function assessment in Heart Failure:
Comment on "Clinical trials update from the European Society of Cardiology meeting 2005: CIBIS-III, by JGF Cleland and others".
 Comment on "Clinical trials update from the European Society of Cardiology meeting 2005: CIBIS-III, by JGF Cleland and others". Willenheimer, Ronnie; Krum, Henry; van Veldhuisen, Dirk J; Funck-Brentano,
New Cardiovascular Devices and Interventions: Non-Contrast MRI for TAVR Abhishek Chaturvedi Assistant Professor. Cardiothoracic Radiology
 New Cardiovascular Devices and Interventions: Non-Contrast MRI for TAVR Abhishek Chaturvedi Assistant Professor Cardiothoracic Radiology Disclosure I have no disclosure pertinent to this presentation.
ST Segment Body Surface Isointegral Maps in Patients With Arterial Hypertension
 Physiol. Res. 61: 35-42, 2012 ST Segment Body Surface Isointegral Maps in Patients With Arterial Hypertension K. KOZLÍKOVÁ 1, J. MARTINKA 1, J. BULAS 2 1 Institute of Medical Physics, Biophysics, Informatics
Preface: Wang s Viewpoints
 AHA/ACCF/HRS Recommendations for the Standardization and Interpretation of the Electrocardiogram: Part IV, Ischemia and Infarction Presented by: WANG, TZONG LUEN, MD, PhD, JM, FACC, FESC, FCAPSC Professor,
Significance of a notch in the otoacoustic emission stimulus spectrum.
 Significance of a notch in the otoacoustic emission stimulus spectrum. Grenner, Jan Published in: Journal of Laryngology and Otology DOI: 10.1017/S0022215112001533 Published: 2012-01-01 Link to publication
Relationship of Number of Phases per Cardiac Cycle and Accuracy of Measurement of Left Ventricular Volumes, Ejection Fraction, and Mass
 JOURNAL OF CARDIOVASCULAR MAGNETIC RESONANCE 1 Vol. 6, No. 4, pp. 837 844, 2004 VENTRICULAR FUNCTION Relationship of Number of Phases per Cardiac Cycle and Accuracy of Measurement of Left Ventricular Volumes,
Determining Axis and Axis Deviation on an ECG
 Marquette University e-publications@marquette Physician Assistant Studies Faculty Research and Publications Health Sciences, College of 7-15-2010 Determining Axis and Axis Deviation on an ECG Patrick Loftis
Full terms and conditions of use:
 This article was downloaded by:[uppsala Universitetsbibiotek] [Uppsala Universitetsbibiotek] On: 3 May 2007 Access Details: [subscription number 731962693] Publisher: Informa Healthcare Informa Ltd Registered
Short-axis epicardial volume change is a measure of cardiac left ventricular short-axis function, which is independent of myocardial wall thickness
 Am J Physiol Heart Circ Physiol 298: H530 H535, 2010. First published November 20, 2009; doi:10.1152/ajpheart.00153.2009. Short-axis epicardial volume change is a measure of cardiac left ventricular short-axis
Usefulness of Delayed Enhancement by Magnetic Resonance Imaging in Hypertrophic Cardiomyopathy as a Marker of Disease and Its Severity
 Usefulness of Delayed Enhancement by Magnetic Resonance Imaging in Hypertrophic Cardiomyopathy as a Marker of Disease and Its Severity G.D.Aquaro, MD Fondazione G.Monasterio Regione Toscana/CNR Pisa, Italy
CHAPTER. Quantification in cardiac MRI. This chapter was adapted from:
 CHAPTER Quantification in cardiac MRI This chapter was adapted from: Quantification in cardiac MRI Rob J. van der Geest, Johan H.C. Reiber Journal of Magnetic Resonance Imaging 1999, Volume 10, Pages 602-608.
Ref 1. Ref 2. Ref 3. Ref 4. See graph
 Ref 1 Ref 2 Ref 3 1. Ages 6-23 y/o 2. Significant LVM differences by gender 3. For males 95 th percentiles: a. LVM/BSA = 103 b. LVM/height = 100 4. For females 95 th percentiles: a. LVM/BSA = 84 b. LVM/height
Unusual Serial Electrocardiographic Changes which Progressed to Arrhythmogenic Right Ventricular Cardiomyopathy
 CASE REPORT Unusual Serial Electrocardiographic Changes which Progressed to Arrhythmogenic Right Ventricular Cardiomyopathy Shu Yoshihara 1,2, Masaki Matsunaga 2, Taku Yaegashi 3, Shioto Suzuki 4, Masaaki
Automated Volumetric Cardiac Ultrasound Analysis
 Whitepaper Automated Volumetric Cardiac Ultrasound Analysis ACUSON SC2000 Volume Imaging Ultrasound System Bogdan Georgescu, Ph.D. Siemens Corporate Research Princeton, New Jersey USA Answers for life.
Myocardial Strain Imaging in Cardiac Diseases and Cardiomyopathies.
 Myocardial Strain Imaging in Cardiac Diseases and Cardiomyopathies. Session: Cardiomyopathy Tarun Pandey MD, FRCR. Associate Professor University of Arkansas for Medical Sciences Disclosures No relevant
Contrast-enhanced echocardiography improves agreement on the assessment of ejection fraction and left ventricular function. A multicentre study
 Eur J Echocardiography 7 Suppl. 2 (2006) S16 S21 Contrast-enhanced echocardiography improves agreement on the assessment of ejection fraction and left ventricular function. A multicentre study Rainer Hoffmann*
Sheet 5 physiology Electrocardiography-
 *questions asked by some students Sheet 5 physiology Electrocardiography- -why the ventricles lacking parasympathetic supply? if you cut both sympathetic and parasympathetic supply of the heart the heart
Cardiac MRI in ACHD What We. ACHD Patients
 Cardiac MRI in ACHD What We Have Learned to Apply to ACHD Patients Faris Al Mousily, MBChB, FAAC, FACC Consultant, Pediatric Cardiology, KFSH&RC/Jeddah Adjunct Faculty, Division of Pediatric Cardiology
Cardiac MRI in Small Rodents
 Cardiac MRI in Small Rodents Andreas Pohlmann, PhD Berlin Ultrahigh Field Facility, Max Delbrück Center for Molecular Medicine (MDC), Berlin, Germany Introduction The art of producing animal models has
How to Learn MRI An Illustrated Workbook
 How to Learn MRI An Illustrated Workbook Exercise 8: Cine Imaging of the Heart Teaching Points: How to do cardiac gating? What is Steady State Free Precession (SSFP)? What are the basic cardiac views and
Lect.6 Electrical axis and cardiac vector Cardiac vector: net result Vector that occurs during depolarization of the ventricles Figure:
 Lect.6 Electrical axis and cardiac vector Objectives: 1. State the relationship between the direction of cardiac vector with the direction (-ve, +ve) and amplitude of an ECG waves. 2. Draw diagram indicting
Assessing the Impact on the Right Ventricle
 Advances in Tricuspid Regurgitation Congress of the European Society of Cardiology (ESC) Munich, August 25-29, 2012 Assessing the Impact on the Right Ventricle Stephan Rosenkranz, MD Clinic III for Internal
B-Mode measurements protocols:
 Application Note How to Perform the Most Commonly Used Measurements from the Cardiac Measurements Package associated with Calculations of Cardiac Function using the Vevo Lab Objective The Vevo LAB offline
Evaluation of Left Ventricular Function and Hypertrophy Gerard P. Aurigemma MD
 Evaluation of Left Ventricular Function and Hypertrophy Gerard P. Aurigemma MD Board Review Course 2017 43 year old health assistant Severe resistant HTN LT BSA 2 Height 64 1 Here is the M mode echocardiogram
Original Article. Keywords: Cornell criteria; echocardiography; electrocardiography (ECG); left ventricular hypertrophy (LVH); Sokolow-Lyon criteria
; left ventricular hypertrophy (LVH); Sokolow-Lyon criteria") Original Article A comparison of Cornell and Sokolow-Lyon electrocardiographic criteria for left ventricular hypertrophy in a military male population in Taiwan: the Cardiorespiratory fitness and HospItalization
Original Article A comparison of Cornell and Sokolow-Lyon electrocardiographic criteria for left ventricular hypertrophy in a military male population in Taiwan: the Cardiorespiratory fitness and HospItalization
Quantitation of right ventricular dimensions and function
 SCCS Basics of cardiac assessment Quantitation of right ventricular dimensions and function Tomasz Kukulski, MD PhD Dept of Cardiology, Congenital Heart Disease and Electrotherapy Silesian Medical University
2019 Qualified Clinical Data Registry (QCDR) Performance Measures
 Performance Measures") 2019 Qualified Clinical Data Registry (QCDR) Performance Measures Description: This document contains the 18 performance measures approved by CMS for inclusion in the 2019 Qualified Clinical Data Registry
2019 Qualified Clinical Data Registry (QCDR) Performance Measures Description: This document contains the 18 performance measures approved by CMS for inclusion in the 2019 Qualified Clinical Data Registry
I have no financial disclosures
 Manpreet Singh MD I have no financial disclosures Exercise Treadmill Bicycle Functional capacity assessment Well validated prognostic value Ischemic assessment ECG changes ST segments Arrhythmias Hemodynamic
Tissue Doppler Imaging in Congenital Heart Disease
 Tissue Doppler Imaging in Congenital Heart Disease L. Youngmin Eun, M.D. Department of Pediatrics, Division of Pediatric Cardiology, Kwandong University College of Medicine The potential advantage of ultrasound
The effect of reduced intercellular coupling on electrocardiographic signs of left ventricular hypertrophy
 Available online at www.sciencedirect.com Journal of Electrocardiology 44 (2011) 571 576 www.jecgonline.com The effect of reduced intercellular coupling on electrocardiographic signs of left ventricular
Xiaorong Chen 1,2, Hongjie Hu 2, Yue Qian 2, Jiner Shu 1. Introduction
 Original Article Relation of late gadolinium enhancement in cardiac magnetic resonance on the diastolic volume recovery of left ventricle with hypertrophic cardiomyopathy Xiaorong Chen 1,2, Hongjie Hu
Cardiac hypertrophy and how it may break an athlete s heart e the Cypriot case
 Eur J Echocardiography (2005) 6, 301e307 Cardiac hypertrophy and how it may break an athlete s heart e the Cypriot case C.E. Chee a,1, C.P. Anastassiades a,1, A.G. Antonopoulos b, A.A. Petsas b, L.C. Anastassiades
Usefulness of Electrocardiographic QT Interval to Predict Left Ventricular Diastolic Dysfunction
 Usefulness of Electrocardiographic QT Interval to Predict Left Ventricular Diastolic Dysfunction Abdulla Samman (1) MD, Mahmoud Malhis (2) MD,MRCP-UK 1 (Cardiology Department, Faculty of Medicine/Aleppo
Martin G. Keane, MD, FASE Temple University School of Medicine
 Martin G. Keane, MD, FASE Temple University School of Medicine Measurement of end-diastolic LV internal diameter (LVIDd) made by properly-oriented M-Mode techniques in the Parasternal Long Axis View (PLAX):
Objectives 8/17/2011. Challenges in Cardiac Imaging. Challenges in Cardiac Imaging. Basic Cardiac MRI Sequences
 8/17/2011 Traditional Protocol Model for Tomographic Imaging Cardiac MRI Sequences and Protocols Frandics Chan, M.D., Ph.D. Stanford University Medical Center Interpretation Lucile Packard Children s Hospital
Medicine. Dynamic Changes of QRS Morphology of Premature Ventricular Contractions During Ablation in the Right Ventricular Outflow Tract
 Medicine CLINICAL CASE REPORT Dynamic Changes of QRS Morphology of Premature Ventricular Contractions During Ablation in the Right Ventricular Outflow Tract A Case Report Li Yue-Chun, MD, Lin Jia-Feng,
HYPERTROPHY: Behind the curtain. V. Yotova St. Radboud Medical University Center, Nijmegen
 HYPERTROPHY: Behind the curtain V. Yotova St. Radboud Medical University Center, Nijmegen Disclosure of interest: none Relative wall thickness (cm) M 0.22 0.42 0.43 0.47 0.48 0.52 0.53 F 0.24 0.42 0.43
Investigation of the Golden Ratio in Human Heart Anatomically by Cardiac Magnetic Resonance Imaging Method
 International Journal of Research Studies in Medical and Health Sciences Volume 3, Issue 11, 2018, PP 10-14 ISSN : 2456-6373 Investigation of the Golden Ratio in Human Heart Anatomically by Cardiac Magnetic
Dr Navin Chandra Clinical Research Fellow in Cardiology St George s University of London
 Dr Navin Chandra Clinical Research Fellow in Cardiology St George s University of London Cardiac Adaptation in Athletes Athletic training for prolonged periods may result in physiological adaptations of
Left posterior hemiblock (LPH)/
/") ECG OF THE MONTH Left Postero-inferior Depolarization Delay Keywords Electrocardiography Intraventricular conduction delay, Inferoposterior hemiblock, Left posterior fascicular block, Left posterior hemiblock
ECG OF THE MONTH Left Postero-inferior Depolarization Delay Keywords Electrocardiography Intraventricular conduction delay, Inferoposterior hemiblock, Left posterior fascicular block, Left posterior hemiblock
Left ventricular mass in offspring of hypertensive parents: does it predict the future?
 ISPUB.COM The Internet Journal of Cardiovascular Research Volume 7 Number 1 Left ventricular mass in offspring of hypertensive parents: does it predict the future? P Jaiswal, S Mahajan, S Diwan, S Acharya,
STANDARD ELECTROCARDIOGRAPHIC CRITERIA FOR LEFT VENTRICULAR HYPERTROPHY
 STANDARD ELECTROCARDIOGRAPHIC CRITERIA FOR LEFT VENTRICULAR HYPERTROPHY IN NIGERIAN HYPERTENSIVES Objectives: Left ventricular hypertrophy (LVH) is a major risk factor for cardiovascular morbidity and
Age: 39. Reported Symptom Status: Snapshot (10 sec) 12-lead ECG
 12-lead ECG") Age: 39 Gender: Male Reported Symptom Status: Not stated A-ECG Report For: Chambers, MT (Date/Time of ECG): Type of Test: (11-25-14 13.12 PM) Snapshot (10 sec) 12-lead ECG Study / Physician: ECG Research
Age: 39 Gender: Male Reported Symptom Status: Not stated A-ECG Report For: Chambers, MT (Date/Time of ECG): Type of Test: (11-25-14 13.12 PM) Snapshot (10 sec) 12-lead ECG Study / Physician: ECG Research
Normal ECG And ECHO Findings in Athletes
 Normal ECG And ECHO Findings in Athletes Dr.Yahya Kiwan Consultant Interventional Cardiologist Head Of Departement Of Cardiology Canadian Specialist Hospital Sinus Bradycardia The normal heartbeat is initiated