MACOMB MONTESSORI ACADEMY School Annual Education Report (AER) Cover Letter - REVISED
|
|
|
- Noreen Boyd
- 5 years ago
- Views:
Transcription
1 MACOMB MONTESSORI ACADEMY School (AER) Cover Letter - REVISED February 22, 217 Dear Parents and Community Members: We are pleased to present you with the (AER) which provides key information on the educational progress for. The AER addresses the complex reporting information required by federal and state laws. The school s report contains information about student assessment, Adequate Yearly Progress (AYP) and teacher quality. If you have any questions about the AER, please contact Head of School, Ashley Ogonowski for assistance. The AER is available for you to review electronically by visiting the following web site or you may review a copy in our main office. For the year, no new Priority or Focus schools were named; some Priority or Focus schools did exit their status because they met the exit criteria. New Reward schools were identified using school rankings and Beating the Odds information. A Focus school is one that has a large achievement gap between the highest and lowest achieving 3% of schools. A Priority school is one whose achievement and growth is in the lowest 5% of all schools in the state. A Reward school is one that has achieved one or more of the following distinctions: top 5% of schools on the Top-to-Bottom School Rankings, top 5% of schools making the greatest gains in achievement (improvement metric), or Beating the Odds by outperforming the school s predicted ranking and/or similar schools. Some schools are not identified with any of these labels. In these cases no label is given. Our school has been labeled as a Priority School. At we continue to strive for academic excellence. As we begin a new school year, we will focus on reaching the goal of 1% achievement as stated in our SIP and maximum learning for all students. In order to assist in achieving these goals and closing the achievement gap implements additional instruction during the school day by a Title I specialist and will begin an after school tutoring program in January of 217. Normed test scores for the past three years for can be found below. State law requires that we also report additional information. 1. (MMA) is located in Warren, MI. MMA is a tuition-free Montessori school for students in grades K-8. Students may enroll at Macomb Montessori Academy using the enrollment process located on our school s website. All students who reside in Michigan are allowed to enroll in the academy in
2 accordance with limits established by the Board of Directors. Due to space being limited, each student must enroll each year. Preferences will be given to currently enrolled students and siblings of enrolled students. When maximum enrollment for each grade has been reached, applicants shall be placed on a waiting list and admitted on the basis of a lottery system. 2. is continuously striving for excellence and focuses on areas of improvement as outlined in our School Improvement Plan (SIP). The SIP was developed through the use of disaggregated data that focused on student achievement, facilities, and parent, staff and community concerns. The goal of the plan is for students to reach and exceed assessment sores on the M-STEP and national standardized assessments from the previous year. The School Improvement team continuously monitors progress to maintain alignment with academic goals. The SIP for academic year is on file in the school office and accessible for viewing. It is also located on the school website. 3. (MMA) offers grades kindergarten through sixth grade. 4. utilizes the North Montessori Center (NAMC) curriculum for kindergarten through sixth grade. The NAMC curriculum has been aligned to the Common Core State Standards. It provides teachers with a clearly written Montessori theory and philosophy, detailed step-by-step instructions, and full-color images to teach English language arts and math. The NAMC curriculum also includes science and social studies materials that our school aligns to the Next Gen standards. Teachers undergo rigorous training in Montessori methodology when they begin at our school. This training spans the teacher s entire first year and beyond in order to ensure a proper implementation of the methods and standards. This curriculum is available at each school in a binder format and is available to view upon request. 5. used NWEA to monitor student achievement and growth throughout the school year. After each testing session a report of individual student growth is sent home to each family. Reports containing school wide performance on NWEA can be obtained in the main office. 6. We hold Parent-Teacher Conferences two times per year and average of 16 or 73% of students represented by parents in attendance. The students and staff of worked diligently to increase student achievement, and we are committed to doing so throughout this school year and beyond. We appreciate the support of the community as we continue to refine our craft and prepare students to be productive members of society. Sincerely, Ashely Ogonowski Head of School

3 Scantron Performance Series Data

4 MEAP Data

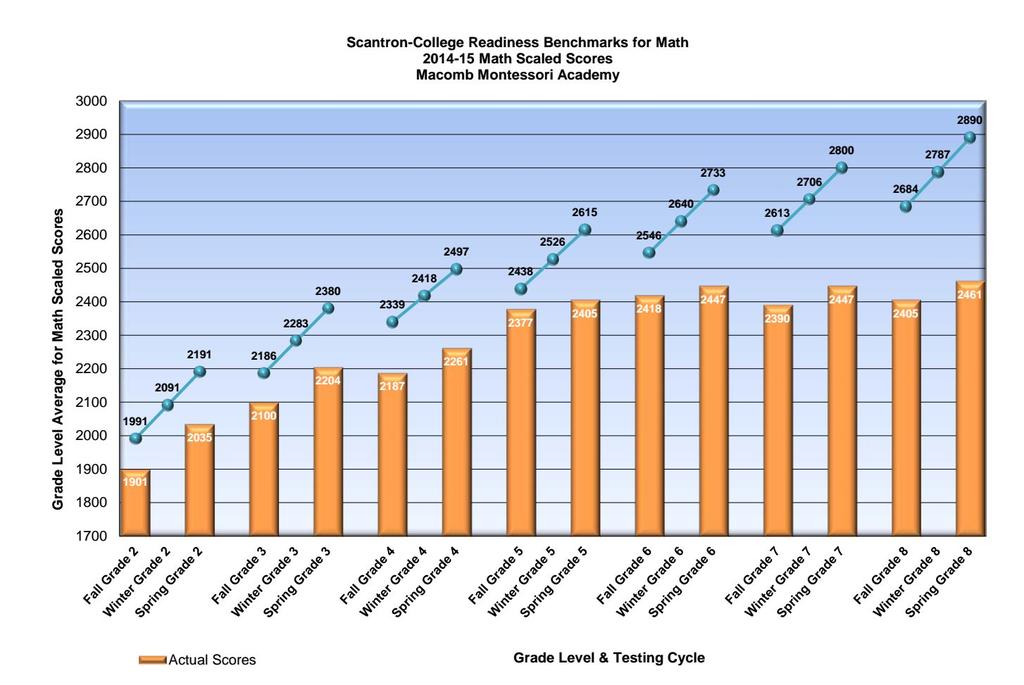
5 Scantron Performance Series Data

6 NWEA Data
7 M-STEP Grades 3-11 Subject Grade Testing Group School Year State Percent Students Proficient District Percent Students Proficient School Percent Students Proficient Percent Advanced Percent Proficient Percent Partially Proficient Percent Not Proficient All Students % 2.% 2.% 13.3% 6.7% 13.3% 66.7% All Students % 9.1% 9.1%.% 9.1% 9.1% 81.8% % <1 <1 <1 <1 <1 < % <1 <1 <1 <1 <1 <1 Hispanic of Any Race % <1 <1 <1 <1 <1 <1 White % <1 <1 <1 <1 <1 <1 White % <1 <1 <1 <1 <1 <1 Female % <1 <1 <1 <1 <1 <1 Female % <1 <1 <1 <1 <1 <1 Male % <1 <1 <1 <1 <1 <1 Male % <1 <1 <1 <1 <1 < % 2.% 2.% 13.3% 6.7% 13.3% 66.7% A service of the Center for Educational Performance and Information (CEPI) Page 1 of 37
8 M-STEP Grades % <1 <1 <1 <1 <1 < % <1 <1 <1 <1 <1 <1 All Students % 6.7% 6.7%.% 6.7% 4.% 53.3% All Students % 13.3% 13.3% 13.3%.%.% 86.7% % <1 <1 <1 <1 <1 < % <1 <1 <1 <1 <1 <1 Hispanic of Any Race % <1 <1 <1 <1 <1 <1 White % <1 <1 <1 <1 <1 <1 White % <1 <1 <1 <1 <1 <1 Female % <1 <1 <1 <1 <1 <1 Female % <1 <1 <1 <1 <1 <1 Male % 1.% 1.%.% 1.% 2.% 7.% Male % <1 <1 <1 <1 <1 < % 6.7% 6.7%.% 6.7% 4.% 53.3% A service of the Center for Educational Performance and Information (CEPI) Page 2 of 37
9 M-STEP Grades % <1 <1 <1 <1 <1 < % <1 <1 <1 <1 <1 < % <1 <1 <1 <1 <1 <1 All Students % <1 <1 <1 <1 <1 <1 All Students % 6.7% 6.7%.% 6.7% 26.7% 66.7% % <1 <1 <1 <1 <1 < %.%.%.%.% 4.% 6.% Hispanic of Any Race % <1 <1 <1 <1 <1 <1 Two or More Races % <1 <1 <1 <1 <1 <1 White % <1 <1 <1 <1 <1 <1 White % <1 <1 <1 <1 <1 <1 Female % <1 <1 <1 <1 <1 <1 Female % <1 <1 <1 <1 <1 <1 Male % <1 <1 <1 <1 <1 <1 A service of the Center for Educational Performance and Information (CEPI) Page 3 of 37
10 M-STEP Grades 3-11 Male % <1 <1 <1 <1 <1 < % <1 <1 <1 <1 <1 < % <1 <1 <1 <1 <1 < % <1 <1 <1 <1 <1 <1 All Students % 16.7% 16.7%.% 16.7% 33.3% 5.% All Students % 7.7% 7.7%.% 7.7% 46.2% 46.2% % <1 <1 <1 <1 <1 < % 8.3% 8.3%.% 8.3% 41.7% 5.% Hispanic of Any Race % <1 <1 <1 <1 <1 <1 White % <1 <1 <1 <1 <1 <1 White % <1 <1 <1 <1 <1 <1 Female % <1 <1 <1 <1 <1 <1 Female % <1 <1 <1 <1 <1 <1 Male % <1 <1 <1 <1 <1 <1 A service of the Center for Educational Performance and Information (CEPI) Page 4 of 37
11 M-STEP Grades 3-11 Male % <1 <1 <1 <1 <1 < % 16.7% 16.7%.% 16.7% 33.3% 5.% % <1 <1 <1 <1 <1 <1 All Students %.%.%.%.% 16.7% 83.3% All Students % <1 <1 <1 <1 <1 < % <1 <1 <1 <1 <1 < % <1 <1 <1 <1 <1 <1 White % <1 <1 <1 <1 <1 <1 White % <1 <1 <1 <1 <1 <1 Female % <1 <1 <1 <1 <1 <1 Female % <1 <1 <1 <1 <1 <1 Male %.%.%.%.% 2.% 8.% Male % <1 <1 <1 <1 <1 < %.%.%.%.% 16.7% 83.3% A service of the Center for Educational Performance and Information (CEPI) Page 5 of 37
12 M-STEP Grades % <1 <1 <1 <1 <1 < % <1 <1 <1 <1 <1 < % <1 <1 <1 <1 <1 <1 All Students % <1 <1 <1 <1 <1 <1 All Students % <1 <1 <1 <1 <1 < % <1 <1 <1 <1 <1 < % <1 <1 <1 <1 <1 <1 Hispanic of Any Race % <1 <1 <1 <1 <1 <1 Two or More Races % <1 <1 <1 <1 <1 <1 White % <1 <1 <1 <1 <1 <1 White % <1 <1 <1 <1 <1 <1 Female % <1 <1 <1 <1 <1 <1 Female % <1 <1 <1 <1 <1 <1 Male % <1 <1 <1 <1 <1 <1 A service of the Center for Educational Performance and Information (CEPI) Page 6 of 37
13 M-STEP Grades 3-11 Male % <1 <1 <1 <1 <1 < % <1 <1 <1 <1 <1 < % <1 <1 <1 <1 <1 < % <1 <1 <1 <1 <1 < % <1 <1 <1 <1 <1 <1 All Students %.%.%.%.% 26.7% 73.3% All Students %.%.%.%.%.% 1.% % <1 <1 <1 <1 <1 < % <1 <1 <1 <1 <1 <1 Hispanic of Any Race % <1 <1 <1 <1 <1 <1 White % <1 <1 <1 <1 <1 <1 White % <1 <1 <1 <1 <1 <1 Female % <1 <1 <1 <1 <1 <1 Female % <1 <1 <1 <1 <1 <1 A service of the Center for Educational Performance and Information (CEPI) Page 7 of 37
14 M-STEP Grades 3-11 Male % <1 <1 <1 <1 <1 <1 Male % <1 <1 <1 <1 <1 < %.%.%.%.% 26.7% 73.3% % <1 <1 <1 <1 <1 < % <1 <1 <1 <1 <1 <1 All Students %.%.%.%.% 33.3% 66.7% All Students %.%.%.%.% 2.% 8.% % <1 <1 <1 <1 <1 < % <1 <1 <1 <1 <1 <1 Hispanic of Any Race % <1 <1 <1 <1 <1 <1 White % <1 <1 <1 <1 <1 <1 White % <1 <1 <1 <1 <1 <1 Female % <1 <1 <1 <1 <1 <1 Female % <1 <1 <1 <1 <1 <1 A service of the Center for Educational Performance and Information (CEPI) Page 8 of 37
15 M-STEP Grades 3-11 Male %.%.%.%.% 3.% 7.% Male % <1 <1 <1 <1 <1 < %.%.%.%.% 33.3% 66.7% % <1 <1 <1 <1 <1 < % <1 <1 <1 <1 <1 < % <1 <1 <1 <1 <1 <1 All Students % <1 <1 <1 <1 <1 <1 All Students %.%.%.%.% 6.7% 93.3% % <1 <1 <1 <1 <1 < %.%.%.%.%.% 1.% Hispanic of Any Race % <1 <1 <1 <1 <1 <1 Two or More Races % <1 <1 <1 <1 <1 <1 White % <1 <1 <1 <1 <1 <1 White % <1 <1 <1 <1 <1 <1 A service of the Center for Educational Performance and Information (CEPI) Page 9 of 37
16 M-STEP Grades 3-11 Female % <1 <1 <1 <1 <1 <1 Female % <1 <1 <1 <1 <1 <1 Male % <1 <1 <1 <1 <1 <1 Male % <1 <1 <1 <1 <1 < % <1 <1 <1 <1 <1 < % <1 <1 <1 <1 <1 < % <1 <1 <1 <1 <1 <1 All Students %.%.%.%.% 16.7% 83.3% All Students %.%.%.%.%.% 1.% % <1 <1 <1 <1 <1 < %.%.%.%.%.% 1.% Hispanic of Any Race % <1 <1 <1 <1 <1 <1 White % <1 <1 <1 <1 <1 <1 White % <1 <1 <1 <1 <1 <1 A service of the Center for Educational Performance and Information (CEPI) Page 1 of 37
17 M-STEP Grades 3-11 Female % <1 <1 <1 <1 <1 <1 Female % <1 <1 <1 <1 <1 <1 Male % <1 <1 <1 <1 <1 <1 Male % <1 <1 <1 <1 <1 < %.%.%.%.% 16.7% 83.3% % <1 <1 <1 <1 <1 <1 All Students %.%.%.%.%.% 1.% All Students % <1 <1 <1 <1 <1 < % <1 <1 <1 <1 <1 < % <1 <1 <1 <1 <1 <1 White % <1 <1 <1 <1 <1 <1 White % <1 <1 <1 <1 <1 <1 Female % <1 <1 <1 <1 <1 <1 Female % <1 <1 <1 <1 <1 <1 A service of the Center for Educational Performance and Information (CEPI) Page 11 of 37
18 M-STEP Grades 3-11 Male %.%.%.%.%.% 1.% Male % <1 <1 <1 <1 <1 < %.%.%.%.%.% 1.% % <1 <1 <1 <1 <1 < % <1 <1 <1 <1 <1 < % <1 <1 <1 <1 <1 <1 All Students % <1 <1 <1 <1 <1 <1 All Students % <1 <1 <1 <1 <1 < % <1 <1 <1 <1 <1 < % <1 <1 <1 <1 <1 <1 Hispanic of Any Race % <1 <1 <1 <1 <1 <1 Two or More Races % <1 <1 <1 <1 <1 <1 White % <1 <1 <1 <1 <1 <1 White % <1 <1 <1 <1 <1 <1 A service of the Center for Educational Performance and Information (CEPI) Page 12 of 37
19 M-STEP Grades 3-11 Female % <1 <1 <1 <1 <1 <1 Female % <1 <1 <1 <1 <1 <1 Male % <1 <1 <1 <1 <1 <1 Male % <1 <1 <1 <1 <1 < % <1 <1 <1 <1 <1 < % <1 <1 <1 <1 <1 < % <1 <1 <1 <1 <1 < % <1 <1 <1 <1 <1 <1 All Students %.%.%.%.% 6.7% 93.3% All Students % 6.7% 6.7%.% 6.7% 13.3% 8.% % <1 <1 <1 <1 <1 < % <1 <1 <1 <1 <1 <1 Hispanic of Any Race % <1 <1 <1 <1 <1 <1 White % <1 <1 <1 <1 <1 <1 A service of the Center for Educational Performance and Information (CEPI) Page 13 of 37
20 M-STEP Grades 3-11 White % <1 <1 <1 <1 <1 <1 Female % <1 <1 <1 <1 <1 <1 Female % <1 <1 <1 <1 <1 <1 Male %.%.%.%.%.% 1.% Male % <1 <1 <1 <1 <1 < %.%.%.%.% 6.7% 93.3% % <1 <1 <1 <1 <1 < % <1 <1 <1 <1 <1 < % <1 <1 <1 <1 <1 <1 All Students %.%.%.%.%.% 1.% All Students % <1 <1 <1 <1 <1 < % <1 <1 <1 <1 <1 < % <1 <1 <1 <1 <1 <1 White % <1 <1 <1 <1 <1 <1 A service of the Center for Educational Performance and Information (CEPI) Page 14 of 37
21 M-STEP Grades 3-11 White % <1 <1 <1 <1 <1 <1 Female % <1 <1 <1 <1 <1 <1 Female % <1 <1 <1 <1 <1 <1 Male %.%.%.%.%.% 1.% Male % <1 <1 <1 <1 <1 < %.%.%.%.%.% 1.% % <1 <1 <1 <1 <1 < % <1 <1 <1 <1 <1 < % <1 <1 <1 <1 <1 <1 All Students % <1 <1 <1 <1 <1 <1 All Students %.%.%.%.% 46.7% 53.3% % <1 <1 <1 <1 <1 < %.%.%.%.% 6.% 4.% Hispanic of Any Race % <1 <1 <1 <1 <1 <1 A service of the Center for Educational Performance and Information (CEPI) Page 15 of 37
22 M-STEP Grades 3-11 Two or More Races % <1 <1 <1 <1 <1 <1 White % <1 <1 <1 <1 <1 <1 White % <1 <1 <1 <1 <1 <1 Female % <1 <1 <1 <1 <1 <1 Female % <1 <1 <1 <1 <1 <1 Male % <1 <1 <1 <1 <1 <1 Male % <1 <1 <1 <1 <1 < % <1 <1 <1 <1 <1 < % <1 <1 <1 <1 <1 < % <1 <1 <1 <1 <1 <1 All Students % <1 <1 <1 <1 <1 <1 All Students % <1 <1 <1 <1 <1 < % <1 <1 <1 <1 <1 < % <1 <1 <1 <1 <1 <1 A service of the Center for Educational Performance and Information (CEPI) Page 16 of 37
23 M-STEP Grades 3-11 Hispanic of Any Race % <1 <1 <1 <1 <1 <1 Two or More Races % <1 <1 <1 <1 <1 <1 White % <1 <1 <1 <1 <1 <1 White % <1 <1 <1 <1 <1 <1 Female % <1 <1 <1 <1 <1 <1 Female % <1 <1 <1 <1 <1 <1 Male % <1 <1 <1 <1 <1 <1 Male % <1 <1 <1 <1 <1 < % <1 <1 <1 <1 <1 < % <1 <1 <1 <1 <1 < % <1 <1 <1 <1 <1 < % <1 <1 <1 <1 <1 <1 A service of the Center for Educational Performance and Information (CEPI) Page 17 of 37
24 SAT Location Name School Year Subject Student Group Mean SAT Score Benchmark Met or Exceeded % Met or Exceeded Did Not Meet % Did Not Meet Number Assessed No Data to Display A service of the Center for Educational Performance and Information (CEPI) Page 18 of 37
25 MI-Access Functional Independence Subject Grade Testing Group School Year State Percent Students Proficient District Percent Students Proficient School Percent Students Proficient Percent Surpassed Percent Attained Percent Emerging All Students % <1 <1 <1 <1 <1 All Students % <1 <1 <1 <1 < % <1 <1 <1 <1 < % <1 <1 <1 <1 <1 Male % <1 <1 <1 <1 <1 Male % <1 <1 <1 <1 < % <1 <1 <1 <1 < % <1 <1 <1 <1 <1 All Students % <1 <1 <1 <1 <1 All Students % <1 <1 <1 <1 <1 All Students % <1 <1 <1 <1 < % <1 <1 <1 <1 < % <1 <1 <1 <1 <1 A service of the Center for Educational Performance and Information (CEPI) Page 19 of 37
26 MI-Access Functional Independence % <1 <1 <1 <1 <1 Male % <1 <1 <1 <1 <1 Male % <1 <1 <1 <1 <1 Male % <1 <1 <1 <1 < % <1 <1 <1 <1 < % <1 <1 <1 <1 < % <1 <1 <1 <1 <1 A service of the Center for Educational Performance and Information (CEPI) Page 2 of 37
27 MI-Access Supported Independence Subject Grade Testing Group School Year State Percent Students Proficient District Percent Students Proficient School Percent Students Proficient Percent Surpassed Percent Attained Percent Emerging No Data to Display A service of the Center for Educational Performance and Information (CEPI) Page 21 of 37
28 MI-Access Participation Subject Grade Testing Group School Year State Percent Students Proficient District Percent Students Proficient School Percent Students Proficient Percent Surpassed Percent Attained Percent Emerging No Data to Display A service of the Center for Educational Performance and Information (CEPI) Page 22 of 37
29 Accountability Details Subject Data Testing Group Subject State Tested Total State Percent Proficient District Tested Total District Percent Proficient* School Tested Total School Percent Proficient** All Students 98.7% 69.6% 1.% 24.6% 1.% 24.6% All Students 98.6% 62.1% 1.% 17.4% 1.% 17.4% All Students 98.1% 5.% <3 <3 <3 <3 All Students 98.1% 59.3% <3 <3 <3 <3 Bottom 3% N/A 25.1% N/A <3 N/A <3 Bottom 3% N/A 19.% N/A <3 N/A <3 Bottom 3% N/A 9.8% N/A <3 N/A <3 Bottom 3% N/A 13.3% N/A <3 N/A <3 Indian or Alaska Native Indian or Alaska Native Indian or Alaska Native Indian or Alaska Native 98.4% 63.4% N/A N/A N/A N/A 98.4% 55.9% N/A N/A N/A N/A 98.% 46.3% N/A N/A N/A N/A 97.3% 54.5% N/A N/A N/A N/A Asian 99.3% 84.3% N/A N/A N/A N/A Asian 99.4% 83.7% N/A N/A N/A N/A Asian 99.3% 65.5% N/A N/A N/A N/A Asian 99.3% 76.% N/A N/A N/A N/A Hispanic of Any Race Hispanic of Any Race Hispanic of Any Race 97.7% 46.9% 1.% 22.% 1.% 22.% 97.4% 37.3% 1.% 16.% 1.% 16.% 96.5% 23.9% <3 <3 <3 <3 96.6% 33.6% <3 <3 <3 <3 98.8% 6.8% <3 <3 <3 <3 98.8% 51.1% <3 <3 <3 <3 98.1% 36.7% <3 <3 <3 <3 A service of the Center for Educational Performance and Information (CEPI) Page 23 of 37
30 Accountability Details Subject Data Hispanic of Any Race Native Hawaiian or Other Pacific Islander Native Hawaiian or Other Pacific Islander Native Hawaiian or Other Pacific Islander Native Hawaiian or Other Pacific Islander Two or More Races Two or More Races Two or More Races Two or More Races 98.% 47.7% <3 <3 <3 <3 99.5% 72.4% N/A N/A N/A N/A 99.7% 65.9% N/A N/A N/A N/A 99.7% 59.6% N/A N/A N/A N/A 99.6% 65.7% N/A N/A N/A N/A 98.9% 67.8% <3 <3 <3 <3 98.7% 59.2% <3 <3 <3 <3 98.5% 45.2% N/A N/A N/A N/A 98.5% 57.3% <3 <3 <3 <3 White 99.% 75.6% <3 <3 <3 <3 White 98.9% 68.4% <3 <3 <3 <3 White 98.6% 57.1% <3 <3 <3 <3 White 98.5% 65.8% <3 <3 <3 <3 English Language Learners English Language Learners 98.3% 56.8% 1.% 18.4% 1.% 18.4% 98.2% 48.5% 1.% 13.2% 1.% 13.2% 97.5% 35.% <3 <3 <3 <3 97.5% 43.9% <3 <3 <3 <3 98.8% 49.5% N/A N/A N/A N/A 99.% 48.4% N/A N/A N/A N/A A service of the Center for Educational Performance and Information (CEPI) Page 24 of 37
31 Accountability Details Subject Data English Language Learners English Language Learners 98.5% 22.% N/A N/A N/A N/A 98.2% 3.9% N/A N/A N/A N/A 97.2% 4.1% <3 <3 <3 <3 97.1% 36.5% <3 <3 <3 <3 97.% 26.5% <3 <3 <3 <3 96.6% 3.8% <3 <3 <3 <3 A service of the Center for Educational Performance and Information (CEPI) Page 25 of 37
32 Accountability Details Graduation Data Student Group Statewide District School All Students 79.79% N/A N/A Indian or Alaska Native 7.88% N/A N/A Asian 9.77% N/A N/A 67.31% N/A N/A Hispanic of Any Race 72.7% N/A N/A Native Hawaiian or Other Pacific Islander 76.67% N/A N/A Two or More Races 74.74% N/A N/A White 83.48% N/A N/A Female 83.76% N/A N/A Male 76.% N/A N/A 67.48% N/A N/A English Language Learners 72.14% N/A N/A 57.12% N/A N/A Bottom 3% N/A N/A N/A * All data based on students enrolled for a full academic year. A service of the Center for Educational Performance and Information (CEPI) Page 26 of 37
33 Accountability Details Attendance Data Student Group Statewide District School All Students 94.32% 1.% 1.% * All data based on students enrolled for a full academic year. A service of the Center for Educational Performance and Information (CEPI) Page 27 of 37
34 Accountability Status District Data District Name Status Score Math Status Math Score Status Score Social Studies Status Social Studies Score Overall Status Overall Score No Data to Display A service of the Center for Educational Performance and Information (CEPI) Page 28 of 37
35 Accountability Status School Data School Name Status Score Math Status Math Score Status Score Social Studies Status Social Studies Score Overall Status Overall Score Macomb Montessori Academy Green 2 Green 2 Red Red Orange 14 A service of the Center for Educational Performance and Information (CEPI) Page 29 of 37
36 Teacher Quality - Qualification Other B.A. M.A. P.H.D. Professional Qualifications of All Public Elementary and Secondary School Teachers in the School 8 2 Professional Qualifications are defined by the State and may include information such as the degrees of public school teachers (e.g., percentage of teachers with Bachelors Degrees or Masters Degrees) or the percentage of fully certified teachers Teacher Quality - Class School Aggregate High-Poverty Schools Low-Poverty Schools Percentage of Core Academic Subject Elementary and Secondary School Classes not Taught by Highly Qualified Teachers.% N/A N/A Teacher Quality - Provisional Certification Percent Percentage of Public Elementary and Secondary School Teachers in the School with Emergency Certification.% A service of the Center for Educational Performance and Information (CEPI) Page 3 of 37
37 NAEP Grade 4 Math Percent of Students Percent below Basic Percent Basic Percent Proficient Percent Advanced All Students Male Female National Lunch Program Eligibility Eligible Not Eligible Info not available # Race/Ethnicity White Hispanic Asian Indian or Alaska Native Native Hawaiian or Other Pacific Islander Two or More Races # &# ‡ Student classified as having a disability SD Not SD Student is an English Language Learner ELL Not ELL Reporting Standards not met. Note: Observed differences are not necessarily statistically significant. Detail may not sum to total because of rounding. SOURCE: U.S. Department of Education. Institute for Education s. National Center for Education Statistics. National Assessment of Educational Progress (NAEP) 215 Achievement A service of the Center for Educational Performance and Information (CEPI) Page 31 of 37
38 NAEP Grade 8 Math Percent of Students Percent below Basic Percent Basic Percent Proficient Percent Advanced All Students Male Female National Lunch Program Eligibility Eligible Not Eligible Info not available # Race/Ethnicity White Hispanic Asian Indian or Alaska Native Native Hawaiian or Other Pacific Islander Two or More Races # # 4 32 Student classified as having a disability SD Not SD # 7 Student is an English Language Learner ELL Not ELL Reporting Standards not met. NOTE: Observed differences are not necessarily statistically significant. Detail may not sum to total because of rounding. SOURCE: U.S. Department of Education. Institute for Education s. National Center for Education Statistics. National Assessment of Educational Progress (NAEP) 215 Achievement A service of the Center for Educational Performance and Information (CEPI) Page 32 of 37
39 NAEP Grade 12 Math Percent of Students Percent below Basic Percent Basic Percent Proficient Percent Advanced All Students Male Female National Lunch Program Eligibility Eligible Not Eligible Info not available Race/Ethnicity White Hispanic Asian Indian or Alaska Native Native Hawaiian or Other Pacific Islander Two or More Races Student classified as having a disability SD Not SD Student is an English Language Learner ELL Not ELL Reporting Standards not met. NOTE: Observed differences are not necessarily statistically significant. Detail may not sum to total because of rounding. SOURCE: U.S. Department of Education. Institute for Education s. National Center for Education Statistics. National Assessment of Educational Progress (NAEP) 215 Achievement A service of the Center for Educational Performance and Information (CEPI) Page 33 of 37
40 NAEP Grade 4 Reading Percent of Students Percent below Basic Percent Basic Percent Proficient Percent Advanced All Students Male Female National Lunch Program Eligibility Eligible Not Eligible Info not available # Race/Ethnicity White Hispanic Asian Indian or Alaska Native Native Hawaiian or Other Pacific Islander Two or More Races # Student classified as having a disability SD Not SD # 6 Student is an English Language Learner ELL Not ELL # Rounds to zero Reporting Standards not met. NOTE: Observed differences are not necessarily statistically significant. Detail may not sum to total because of rounding. SOURCE: U.S. Department of Education, Institute of Education s, National Center for Education Statistics, National Assessment of Educational Progress (NAEP), 215 Reading Assessment A service of the Center for Educational Performance and Information (CEPI) Page 34 of 37
41 NAEP Grade 8 Reading Percent of Students Percent below Basic Percent Basic Percent Proficient Percent Advanced All Students Male Female National Lunch Program Eligibility Eligible Not Eligible Info not available # Race/Ethnicity White Afican Hispanic Asian/Native Hawaiian or Pacific Islander Indian or Alaska Native Two or More Races &# Student classified as having a disability SD Not SD # 3 Student is an English Language Learner ELL Not ELL # Rounds to zero Reporting Standards not met. NOTE: Observed differences are not necessarily statistically significant. Detail may not sum to total because of rounding. SOURCE: U.S. Department of Education, Institute of Education s, National Center for Education Statistics, National Assessment of Educational Progress (NAEP), 215 Reading Assessment # 3 A service of the Center for Educational Performance and Information (CEPI) Page 35 of 37
42 NAEP Grade 12 Reading Percent of Students Percent below Basic Percent Basic Percent Proficient Percent Advanced All Students Male Female National Lunch Program Eligibility Eligible Not Eligible Info not available Race/Ethnicity White Hispanic Asian Indian or Alaska Native Native Hawaiian or Other Pacific Islander Two or More Races Student classified as having a disability SD Not SD Student is an English Language Learner ELL Not ELL # Rounds to zero Reporting Standards not met. NOTE: Observed differences are not necessarily statistically significant. Detail may not sum to total because of rounding. SOURCE: U.S. Department of Education, Institute of Education s, National Center for Education Statistics, National Assessment of Educational Progress (NAEP), 215 Reading Assessment A service of the Center for Educational Performance and Information (CEPI) Page 36 of 37
43 NAEP Participation Data Grade Subject Participation Rate for Students with Standard Error Participation Rate Standard Error for Limited English Proficient Students 4 Math Reading Math Reading A service of the Center for Educational Performance and Information (CEPI) Page 37 of 37
Assistant Superintendent of Business &
 THE LAMPHERE SCHOOLS ADMINISTRATION CENTER 3121 Dorchester Madison Heights, Michigan 4871-199 Telephone: (248) 589-199 FAX: (248) 589-2618 DALE STEEN Superintendent Finance PATRICK DILLON Assistant Superintendent
22932 Woodward Ave., Ferndale, MI School Annual Education Report (AER) Cover Letter
 Cover Letter") 35 John R., Detroit, MI 4821 22932 Woodward Ave., Ferndale, MI 4822 313.831.351 School (AER) 248.582.81 Cover Letter School (AER) Cover Letter March 9, 217 Dear Parents and Community Members: We are pleased
35 John R., Detroit, MI 4821 22932 Woodward Ave., Ferndale, MI 4822 313.831.351 School (AER) 248.582.81 Cover Letter School (AER) Cover Letter March 9, 217 Dear Parents and Community Members: We are pleased
Providing Highly-Valued Service Through Leadership, Innovation, and Collaboration
 ~ivingston Providing Highly-Valued Service Through Leadership, Innovation, and Collaboration March 3, 27 Dear Parents and Community Members: We are pleased to present you with the Annual Education Report
May 15, Dear Parents and Community Members:
 May 15, 2018 Dear Parents and Community Members: We are pleased to present you with the (AER) which provides key information on the 2017-18 educational progress for the Zemmer Campus 8/9 Building. The
DISTRICT LETTERHEAD. REVISED TEMPLATE (Letter Sent on District s Letterhead) School Annual Education Report (AER) Cover Letter
 School Annual Education Report (AER) Cover Letter") DISTRICT LETTERHEAD REVISED 2017-18 TEMPLATE (Letter Sent on s Letterhead) School (AER) Cover Letter May 20, 2018 Dear Parents and Community Members: We are pleased to present you with the (AER) which
DISTRICT LETTERHEAD REVISED 2017-18 TEMPLATE (Letter Sent on s Letterhead) School (AER) Cover Letter May 20, 2018 Dear Parents and Community Members: We are pleased to present you with the (AER) which
School Annual Education Report (AER) Cover Letter
 Cover Letter") School (AER) Cover Letter May 11, 2018 Dear Parents and Community Members: We are pleased to present you with the (AER) which provides key information on the 2016-2017 educational progress for the Lynch
School (AER) Cover Letter May 11, 2018 Dear Parents and Community Members: We are pleased to present you with the (AER) which provides key information on the 2016-2017 educational progress for the Lynch
School Annual Education Report (AER) Cover Letter
 Cover Letter") Lincoln Elementary Sam Skeels, Principal 158 S. Scott St Adrian, MI 49221 Phone: 517-265-8544 School (AER) Cover Letter April 29, 2017 Dear Parents and Community Members: We are pleased to present you
Lincoln Elementary Sam Skeels, Principal 158 S. Scott St Adrian, MI 49221 Phone: 517-265-8544 School (AER) Cover Letter April 29, 2017 Dear Parents and Community Members: We are pleased to present you
School / District Annual Education Report (AER) Cover Letter
 Cover Letter") School / District Annual Education Report (AER) Cover Letter August 23, 2010 Dear Parents and Community Members: We are pleased to present you with the Annual Education Report (AER) which provides key
School / District Annual Education Report (AER) Cover Letter August 23, 2010 Dear Parents and Community Members: We are pleased to present you with the Annual Education Report (AER) which provides key
ANN ARBOR PUBLIC SCHOOLS 2555 S. State Street Ann Arbor, MI www. a2schools.org Pioneer High School Annual Education Report (AER)!
!") ANN ARBOR PUBLIC SCHOOLS 2555 S. State Street Ann Arbor, MI 48104 734-994-2200 www. a2schools.org Pioneer High School Annual Education Report (AER)!! Dear Pioneer Parents and Community Members: We are
ANN ARBOR PUBLIC SCHOOLS 2555 S. State Street Ann Arbor, MI 48104 734-994-2200 www. a2schools.org Pioneer High School Annual Education Report (AER)!! Dear Pioneer Parents and Community Members: We are
Providing Highly-Valued Service Through Leadership, Innovation, and Collaboration. July 30, Dear Parents and Community Members:
 Providing Highly-Valued Service Through Leadership, Innovation, and Collaboration July 30, 2011 Dear Parents and Community Members: We are pleased to present you with the Annual Education Report (AER)
August 10, School Name Reason(s) for not making AYP Key actions underway to address the issues McKinley Adult and Alternative Education Center
 for not making AYP Key actions underway to address the issues McKinley Adult and Alternative Education Center") McKinley Adult and Center August 10, 2012 Derrick Richards, Director 726 Elm Street Adrian, MI 49221 Dear Parents and Community Members: We are pleased to present you with the Annual Education Report (AER)
McKinley Adult and Center August 10, 2012 Derrick Richards, Director 726 Elm Street Adrian, MI 49221 Dear Parents and Community Members: We are pleased to present you with the Annual Education Report (AER)
Warren Consolidated Schools
 Creating Dynamic Futures through Student Achievement, High Expectations, and Strong Relationships 1.888.4WCS.KIDS www.wcskids.net Text WCSKIDS to 5778 ADMINISTRATION BUILDING 313 Anita, MI 4893 586.825.24
School Annual Education Report (AER) Cover Letter
 Cover Letter") Ron Jacobs, Principal 785 Riverside Ave Ste. 3 Adrian, MI 49221 Phone: 517-263-2181 (AER) Cover Letter May 31st, 2018 Dear Parents and Community Members: We are pleased to present you with the (AER) which
Ron Jacobs, Principal 785 Riverside Ave Ste. 3 Adrian, MI 49221 Phone: 517-263-2181 (AER) Cover Letter May 31st, 2018 Dear Parents and Community Members: We are pleased to present you with the (AER) which
adin Aadin Arts/Rg Disadvantaged ARn English Language 04 All Students % 67,7% 72.7% 0% 72.7% 18.2% Arts I Reading
 English Language 03 Male 2011-12
Jackson Public Schools
 Jackson Public Schools 2008-09 It is the policy of the Jackson Public Schools District that no discriminatory practices based on sex, race, color, national origin, religion, height, weight, marital status,
Annual Report on Curriculum, Instruction, and Student Achievement. Canby Public Schools, ISD 891. Systems Accountability. Approved October 14, 2014
 Annual Report on Curriculum, Instruction, and Student Achievement Canby Public Schools, ISD 891 Systems Accountability Approved October 14, 2014 2013-2014 An Overview of the Report on Curriculum, Instruction,
ESSA Accountability Alignment
 ESSA Accountability Alignment Three Domains: Combining to Calculate Overall Score Best of Achievement or Progress 70% 30% Student Achievement School Progress Closing The Gaps 22 A F Accountability: New
Hawaii Center for the Deaf & the Blind
 Elementary-Middle-High School Hawaii Center for the Deaf & the Blind School Status and Improvement Report Contents Focus On Standards Grades K-12 This School Status and Improvement Report has been prepared
the Deaf and the Blind
 Hawai i School Accountability System School Year 2001-02 Focus on Standards School Description Context: School Setting Student Profile Community Profile Process: Standards Implementation Design Process:
Introduction. Proficiency Student growth Growth gap reduction Graduation rates
 MMR Growth Description of the MinnesotaTestdata.com Interactive Graphical Tool Jim Angermeyr, Ph.D. May, 2014 Data on the web site have been amended to include the 2014 MMR scores and associated 2014 F/R
A Cross-validation of easycbm Mathematics Cut Scores in. Oregon: Technical Report # Daniel Anderson. Julie Alonzo.
 Technical Report # 1104 A Cross-validation of easycbm Mathematics Cut Scores in Oregon: 2009-2010 Daniel Anderson Julie Alonzo Gerald Tindal University of Oregon Published by Behavioral Research and Teaching
These materials are Copyright NCHAM (National Center for Hearing Assessment and Management). All rights reserved. They may be reproduced
. All rights reserved. They may be reproduced") These materials are Copyright 2015-2017 NCHAM (National Center for Hearing Assessment and Management). All rights reserved. They may be reproduced and distributed in print or electronic format at no cost
These materials are Copyright 2015-2017 NCHAM (National Center for Hearing Assessment and Management). All rights reserved. They may be reproduced and distributed in print or electronic format at no cost
Hawaii School for the Deaf & the Blind
 Code: 470 Hawaii for the Deaf & the Blind Status and Improvement Report Year -10 Contents Focus On Standards Grades K-12 This Status and Improvement Report has been prepared as part of the Department's
No Child Left Behind and the Testing of Deaf Students
 No Child Left Behind and the Testing of Deaf Students Michael A. Karchmer Gallaudet Research Institute and Department of Educational Foundations and Research First Wednesday Research Seminar Gallaudet
Commissioner s Update on A F Accountability Model OVERVIEW OF CURRENT WORK-IN-PROGRESS
 Commissioner s Update on A F Accountability Model OVERVIEW OF CURRENT WORK-IN-PROGRESS 1 A F Accountability: Legislative Context HB 2804 HB 22 House Bill 22, 85 th Texas Legislature The commissioner shall
School Consultation Project Application
 2018-2019 School Consultation Project Application The goal of the School Consultation Project is to help your school district increase its capacity to service students with autism spectrum disorders (ASD)
2016 Pharmacist Re-Licensure Survey Instrument
 1. Sex a. Male b. Female 2016 Pharmacist Re-Licensure Survey Instrument 2. Ethnicity: Are you Hispanic or Latino? a. Yes b. No 3. Race (Check all that apply.) a. American Indian or Alaska Native b. Black
Cancer Deaths California,
 Center for Health Statistics November 2005 DATA SUMMARY No. DS05-11000 This Data Summary is one of a series of leading cause of death reports. H i g h l i g h t s In 2003 cancer was the second leading
Exiting Data Formatting Information
 Exiting Data Formatting Information General Formatting Information for Export Files All data export files must be in standard ASCII comma-delimited format, either CSV or text format. Each line must be
Total Elementary School Middle School High School Confidence Level = 95% Total Column % Count Column % Count Column % Count Column %
 Language Survey Version Stakeholder Group Back to Table of Contents Sample Size 1,638 1,342 24 272 English 1,578 96% 1,289 96% 22 92% 267 98% Spanish 60 4% 53 4% 2 8% 5 2% Sample Size 1,638 1,342 24 272
H 7978 SUBSTITUTE A ======== LC005519/SUB A ======== S T A T E O F R H O D E I S L A N D
 01 -- H SUBSTITUTE A LC001/SUB A S T A T E O F R H O D E I S L A N D IN GENERAL ASSEMBLY JANUARY SESSION, A.D. 01 A N A C T RELATING TO EDUCATION - INSTRUCTION FOR DEAF OR HARD-OF-HEARING STUDENTS Introduced
2017 USRDS ANNUAL DATA REPORT KIDNEY DISEASE IN THE UNITED STATES S611
 Healthy People 2020 In this chapter, we examine data for 11 Healthy People 2020 (HP2020) objectives 10 for CKD and one for diabetes spanning 20 total indicators for which the USRDS serves as the official
Hawaii School for the Deaf & the Blind
 Code: 470 Hawaii for the Deaf & the Blind Status and Improvement Report Year -14 Focus On Standards Grades K-12 Focus on Standards Description Contents Setting Student Profile Community Profile Improvement
PROGRAMME SPECIFICATION UNDERGRADUATE PROGRAMMES
 PROGRAMME SPECIFICATION UNDERGRADUATE PROGRAMMES KEY FACTS Programme name Psychology Award BSc (Hons) School School of Arts and Social Sciences Department or equivalent Department of Psychology UCAS Code
Back to Table of Contents. Page 1 of 12 4/25/2017
 Language Sample Size 309 38 1 25 78 14 191 English 269 87% 9 24% 1 100% 22 88% 55 71% 14 100% 187 98% Spanish 40 13% 29 76% 0 0% 3 12% 23 29% 0 0% 4 2% Survey Version Sample Size 309 38 1 25 78 14 191
CANNABIS CONTROL COMMISSION Public Meeting. February 7, Health Policy Commission 50 Milk Street Boston, MA :30PM-3:00PM
 CANNABIS CONTROL COMMISSION Public Meeting February 7, 2019 Health Policy Commission 50 Milk Street Boston, MA 02109 1:30PM-3:00PM 1 Agenda 1) Call to Order 2) Chairman s Comments & Updates 3) Minutes
Arkansas Association of the Deaf High School Scholarship Program
 Arkansas Association of the Deaf High School Scholarship Program AN INTRODUCTION AAD historically has made funds available to the Arkansas School for the Deaf to add to a pool of funds that would be awarded
MDOT Environmental Justice Analysis
 MDOT Environmental Justice Analysis 2014 Michigan Transportation Planning Association Annual Conference August 6-8, 2014 Presented by: Ola Williams MDOT Statewide Planning Section Enabling Legislations
State Summary Table 1 Child Care Workers/ Educators. Teachers 3 Assistant Teachers 4 Directors FCCH Providers
 Appendix D: State Summary Table N Studies = a. Demographic Mean Age (Years) 11 (VI) 10, (VII) 1 42 (CA) 30 (WI) - 43.1 (MN) 31.3-42.4 (MN) 39.5-48.3 (MN) 37 (WI) - 45.7 (CA) Median Age (Years) 2 (VI) 2
Midwest University. Global Perspective Inventory New Student Report
 Global Perspective Inventory New Student Report March 9, 7 Introduction Thank you for participating in the Global Perspective Inventory (GPI). The Research Institute for Studies in Education (RISE) at
Survey of Dentists in Delaware
 Survey of Dentists in Delaware To determine the current capacity and needs of dentists in Delaware to address the oral health needs of Delawareans with Complete the questions on the pages that follow and
Texas A&M University Texarkana. Global Perspective Inventory General Form Report
 Global Perspective Inventory General Form Report April Introduction Thank you for participating in the Global Perspective Inventory (GPI). The Research Institute for Studies in Education (RISE) at Iowa
Hawaii Center for the Deaf & the Blind
 Code: 470 Hawaii Center for the Deaf & the Blind Status and Improvement Report Year 006-07 Focus On Standards Grades K-1 Focus on Standards Description Contents p. 1 p. 1 This Status and Improvement Report
Cross-validation of easycbm Reading Cut Scores in Washington:
 Technical Report # 1109 Cross-validation of easycbm Reading Cut Scores in Washington: 2009-2010 P. Shawn Irvin Bitnara Jasmine Park Daniel Anderson Julie Alonzo Gerald Tindal University of Oregon Published
Please remember these are minimum requirements and do not guarantee acceptance into the program.
 Dear Prospective Dental Hygiene Student: Thank you for your interest in the Dental Hygiene Program at Carbondale. The Dental Hygiene Program is nationally recognized for both quality of faculty and graduates.
Reviewing Trust, Leadership, and Threat-Rigidity within your school district
 Reviewing Trust, Leadership, and Threat-Rigidity within your school district Dean L. Ramirez, Ed.D. NYSCOSS Fall Leadership Conference September 29, 2015 dlr29@buffalo.edu 716-228-8768 Middle School Principal
ACTION PLAN: REGULAR PROGRAMS AND ADDITIONAL STRATEGIES
 ACTION PLAN: REGULAR PROGRAMS AND ADDITIONAL STRATEGIES Canada-Ontario Agreement on Minority Language Education and Second Official Language Instruction 2005-06 to 2008-09 Elementary / Secondary French
Dear Prospective Degree Completion Dental Hygiene Student:
 Dear Prospective Degree Completion Dental Hygiene Student: Thank you for your interest in the Dental Hygiene Program at Southern Illinois University Carbondale. SIUC s Dental Hygiene Program is nationally
Deaths in Hawaii Due to Major Cardiovascular Disease
 in Hawaii Due to Major Cardiovascular Disease Death Counts, Age-Adjusted Mortality Rates, and Years of Potential Life Lost for Coronary Heart Disease for the State of Hawaii (Residents Only), by State,
Mayo School of Health Sciences. Audiology Externship. Rochester, Minnesota.
 Mayo School of Health Sciences Audiology Externship Rochester, Minnesota www.mayo.edu Audiology Externship PROGRAM DESCRIPTION Mayo School of Health Sciences (MSHS) offers a one-year Audiology Externship
2016 Student Success Key Performance Indicators
 Cuyamaca College 2016 Student Success Key Performance Indicators 1 P age TABLE OF CONTENTS Introduction: 2016 Key Performance Indicators... 3 Student Success Scorecard... 3 Evaluation of Disproportionate
Measuring Student Progress in Reading and Mathematics K-8
 Measuring Student Progress in Reading and Mathematics K-8 Presentation to the Board of Education, September 2014 Todd Winch, Assistant Superintendent for Curriculum & Instruction Overview of Student Performance
Diabetes - Deaths African Americans and Latinos are more likely to die from diabetes than other Contra Costa residents.
 Diabetes - Deaths African Americans and Latinos are more likely to die from diabetes than other Contra Costa residents. Diabetes is the seventh leading cause of death In Contra Costa, diabetes accounts
Barbara Varnum, Director 1 (800) (V, TTY) (406) (local) (V, TTY
 (V, TTY) (406) (local) (V, TTY") http://dphhs.mt.gov/detd/mtap Barbara Varnum, Director bvarnum@mt.gov 1 (800) 833-8503 (V, TTY) (406) 444-1335 (local) (V, TTY -INSTRUCTIONS AND INFORMATION- To qualify and be eligible to receive equipment
http://dphhs.mt.gov/detd/mtap Barbara Varnum, Director bvarnum@mt.gov 1 (800) 833-8503 (V, TTY) (406) 444-1335 (local) (V, TTY -INSTRUCTIONS AND INFORMATION- To qualify and be eligible to receive equipment
2015 Pierce County Smile Survey. May An Oral Health Assessment of Children in Pierce County. Office of Assessment, Planning and Improvement
 2015 Pierce County Smile Survey An Oral Health Assessment of Children in Pierce County May 2017 Office of Assessment, Planning and Improvement Table of Contents Tables... iii Figures... iv Executive Summary...
Colorado Department of Education Exceptional Student Services Preliminary Data for Deaf and Hard of Hearing Students in Colorado s Public Schools
 Colorado Department of Education Exceptional Student Services Preliminary Data for Deaf and Hard of Hearing Students in Colorado s Public Schools Inspiring Change Part 1 February 12, 2013 Where are our
Grossmont College 2016 Student Success Key Performance Indicators
 Grossmont College 2016 Student Success Key Performance Indicators 1 P age TABLE OF CONTENTS Introduction: 2016 Key Performance Indicators... 3 Student Success Scorecard... 3 Evaluation of Disproportionate
Comparing the CR-3 Injury Severity Categories (KABCO) to Injury Severity Metrics
 to Injury Severity Metrics") Comparing the CR-3 Injury Severity Categories (KABCO) to Injury Severity Metrics Texas EMS & Trauma Registries Injury Epidemiology & Surveillance Branch Environmental & Injury Epidemiology & Toxicology
Comparing the CR-3 Injury Severity Categories (KABCO) to Injury Severity Metrics Texas EMS & Trauma Registries Injury Epidemiology & Surveillance Branch Environmental & Injury Epidemiology & Toxicology
Midwest University. Global Perspective Inventory Study Abroad Form Report
 Global Perspective Inventory Study Abroad Form Report March, 9 27 2 Introduction Thank you for participating in the Global Perspective Inventory (GPI). The Research Institute for Studies in Education (RISE)
WASHINGTON STATE COMPARISONS TO: KITSAP COUNTY CORE PUBLIC HEALTH INDICATORS May 2015
 WASHINGTON STATE COMPARISONS TO: KITSAP COUNTY CORE PUBLIC HEALTH INDICATORS This is a companion document to the Core Public Health Indicators that provides a comparison of to Washington State for the
DENTAL CLINICAL RESIDENCY PROGRAMME
 DENTAL CLINICAL RESIDENCY PROGRAMME PROGRAMME DETAILS & RESIDENT APPLICATION FORM FACULTY OF DENTISTRY UiTM Sg Buloh, Jalan Hspital, 47000 Sungai Buloh, Selangor Malaysia Programme Details & Resident Application
Evaluators Perspectives on Research on Evaluation
 Supplemental Information New Directions in Evaluation Appendix A Survey on Evaluators Perspectives on Research on Evaluation Evaluators Perspectives on Research on Evaluation Research on Evaluation (RoE)
NATIONAL CERTIFICATE IN TOBACCO TREATMENT PRACTICE (NCTTP) TEST EXEMPTION OFFER APPLICATION VALID: OCTOBER 15, APRIL 15, 2018
 TEST EXEMPTION OFFER APPLICATION VALID: OCTOBER 15, APRIL 15, 2018") NATIONAL CERTIFICATE IN TOBACCO TREATMENT PRACTICE (NCTTP) TEST EXEMPTION OFFER APPLICATION VALID: OCTOBER 15, 2017 - APRIL 15, 2018 I. Personal Information Name: Home Address: City: State/Province: Country:
NATIONAL CERTIFICATE IN TOBACCO TREATMENT PRACTICE (NCTTP) TEST EXEMPTION OFFER APPLICATION VALID: OCTOBER 15, 2017 - APRIL 15, 2018 I. Personal Information Name: Home Address: City: State/Province: Country:
Graduates of the Dental Hygiene program are eligible to write the National Board and take the Central Regional Dental Testing Service Inc. exam.
 Dear Prospective Dental Hygiene Student: Thank you for your interest in the Dental Hygiene program at Minnesota State Community and Technical College Moorhead Campus. Before applying to the Dental Hygiene
July 2019 Submission Formatting Information
 July 2019 Submission Formatting Information General Formatting Information for Data Files All data files must be in standard ASCII comma-delimited format, either CSV or text format. Each line must be terminated
Physical Fitness Test (PFT) Student Data File Layout Tab- Delimited Text
 Student Data File Layout Tab- Delimited Text") Physical Fitness Test (PFT) Student Data File Layout Tab- Delimited Text New or Changed for 2017 18 All fields, types, lengths, or acceptable values remain unchanged for 2017 18. New or Changed for 2016
Physical Fitness Test (PFT) Student Data File Layout Tab- Delimited Text New or Changed for 2017 18 All fields, types, lengths, or acceptable values remain unchanged for 2017 18. New or Changed for 2016
Objectives. Training Goals Content Objective. Language Objective
 Objectives AGENDA Networking Breakfast Welcome and Introductions Title III, PNP User Guide Training Title III, PNP Website and Resources Overview Title III, PNP Planning Tool Question and Answer/Closing
NATIONAL CERTIFICATE IN TOBACCO TREATMENT PRACTICE (NCTTP) APPLICATION
 APPLICATION") NATIONAL CERTIFICATE IN TOBACCO TREATMENT PRACTICE (NCTTP) APPLICATION I. Personal Information Name: Home Address: City: State/Province: _ Country: Zip Code: _ Work Address: City: State/Province: _ Country:
NATIONAL CERTIFICATE IN TOBACCO TREATMENT PRACTICE (NCTTP) APPLICATION I. Personal Information Name: Home Address: City: State/Province: _ Country: Zip Code: _ Work Address: City: State/Province: _ Country:
March 2007 SEC STATE PLANS. (b) ACADEMIC STANDARDS, ACADEMIC ASSESSMENTS, AND ACCOUNTABILITY. - (2) ACCOUNTABILITY. -
 ACADEMIC STANDARDS, ACADEMIC ASSESSMENTS, AND ACCOUNTABILITY. - (2) ACCOUNTABILITY. -") Proposed Legislative Language for the No Child Left Behind Reauthorization Submitted by the Conference of Educational Administrators of Schools and Programs for the Deaf (CEASD) March 2007 In order for
Proposed Legislative Language for the No Child Left Behind Reauthorization Submitted by the Conference of Educational Administrators of Schools and Programs for the Deaf (CEASD) March 2007 In order for
Wellness Coaching for People with Prediabetes
 Wellness Coaching for People with Prediabetes PUBLIC HEALTH RESEARCH, PRACTICE, AND POLICY Volume 12, E207 NOVEMBER 2015 ORIGINAL RESEARCH Wellness Coaching for People With Prediabetes: A Randomized Encouragement
CASE HISTORY (ADULT) Date form completed:
 Date form completed:") Mailing Address: TCU Box 297450 Fort Worth, TX 76129 MILLER SPEECH AND HEARING CLINIC TEXAS CHRISTIAN UNIVERSITY Street Address: 3305 W. Cantey Fort Worth, TX 76129 CASE HISTORY (ADULT) Date form completed:
Mailing Address: TCU Box 297450 Fort Worth, TX 76129 MILLER SPEECH AND HEARING CLINIC TEXAS CHRISTIAN UNIVERSITY Street Address: 3305 W. Cantey Fort Worth, TX 76129 CASE HISTORY (ADULT) Date form completed:
STATE SUMMARY Gallaudet Research Institute * 800 Florida Avenue, NE * Washington, DC * ext 5575 Page 1 of 12
 202-651-5575 * 1-800-451-8834 ext 5575 Page 1 of 12 AGE New Mexico West Nation Information NOT reported 4 1.9 212 2.3 819 2.2 Total known information 212 100.0 8963 100.0 37009 100.0 Under 3 years of age
July 2018 Submission Formatting Information
 July 2018 Submission Formatting Information General Formatting Information for Export Files All data export files must be in standard ASCII comma-delimited format, either CSV or text format. Each line
STATE SUMMARY Gallaudet Research Institute * 800 Florida Avenue, NE * Washington, DC * ext 5575 Page 1 of 12
 202-651-5575 * 1-800-451-8834 ext 5575 Page 1 of 12 AGE New Jersey Northeast Nation Information NOT reported 11 1.7 167 3.0 819 2.2 Total known information 650 100.0 5392 100.0 37009 100.0 Under 3 years
Palliative Medicine: Program Description
 Program Description: Palliative Medicine: Program Description Palliative Medicine was recently approved as a subspecialty by the Royal College of Physicians and Surgeons of Canada (RCPSC). The Subspecialty
THE HEALTH OF CHINESE AMERICANS: 1970 TO TODAY PRESENTED BY KATHY KO CHIN, PRESIDENT AND CEO ASIAN & PACIFIC ISLANDER AMERICAN HEALTH FORUM
 THE HEALTH OF CHINESE AMERICANS: 1970 TO TODAY PRESENTED BY KATHY KO CHIN, PRESIDENT AND CEO ASIAN & PACIFIC ISLANDER AMERICAN HEALTH FORUM OUR MISSION The Asian & Pacific Islander American Health Forum
STATE SUMMARY Gallaudet Research Institute * 800 Florida Avenue, NE * Washington, DC * ext 5575 Page 1 of 12
 202-651-5575 * 1-800-451-8834 ext 5575 Page 1 of 12 AGE Iowa Midwest Nation Information NOT reported 3 1.4 174 2.2 819 2.2 Total known information 218 100.0 7755 100.0 37009 100.0 Under 3 years of age
104 CMR: DEPARTMENT OF MENTAL HEALTH 104 CMR 33.00: DESIGNATION AND APPOINTMENT OF QUALIFIED MENTAL HEALTH PROFESSIONALS
 104 CMR 33.00: DESIGNATION AND APPOINTMENT OF QUALIFIED MENTAL HEALTH PROFESSIONALS Section 33.01: Legal Authority to Issue 33.02: Authorization to Apply for Hospitalization Pursuant to M.G.L. c. 123,
Certified Peer Specialist Training Application
 Please read the CPS Application Supplement before completing application. Go to http://www.viahope.org/resources/peer-specialist-training-application-supplement This training is intended for individuals
NYC AUTISM CHARTER SCHOOL School Year Application Instructions 1
 2016-2017 School Year Application Instructions 1 For the 2016-2017 school year, openings will be available for students whose birth date falls between January 1, 2011 and December 31, 2011. Preference
Geriatric Neurology Program Requirements
 Geriatric Neurology Program Requirements Approved November 8, 2013 Page 1 Table of Contents I. Introduction 3 II. Institutional Support 3 A. Sponsoring Institution 3 B. Primary Institution 4 C. Participating
ADEA Survey of Dental School Seniors, 2015 Graduating Class Tables Report
 ADEA Survey of Dental School Seniors, 2015 Graduating Class Tables Report Published March 2016 Suggested Citation American Dental Education Association. (March 2016). ADEA Survey of Dental School Seniors,
DENTAL HYGIENE. Program Information and Application. 271 Scott Swamp Road Farmington, CT Admissions Office
 DENTAL HYGIENE Program Information and Application 271 Scott Swamp Road Farmington, CT 06032 www.tunxis..edu Admissions Office 860-773-1490 Tunxis Community College does not discriminate on the basis of
December 1 Child Count Formatting Information
 December 1 Child Count Formatting Information General Formatting Information for Export Files All data export files must be in standard ASCII comma-delimited format, either CSV or text format. Each line
I. Introduction. II. Program Description
 Advanced Post-Graduate Athletic Training Program Division of Sports Medicine Department of Orthopaedic Surgery Department of Athletics, Physical Education and Recreation I. Introduction The Stanford University
Response to the Language Equality and Acquisition for Deaf Kids (LEAD-K) Task Force Report
 Task Force Report") Response to the Language Equality and Acquisition for Deaf Kids (LEAD-K) Task Force Report Louisiana Department of Health Office of Public Health March 21, 2019 Report Title Version Number Version Date
Response to the Language Equality and Acquisition for Deaf Kids (LEAD-K) Task Force Report Louisiana Department of Health Office of Public Health March 21, 2019 Report Title Version Number Version Date
Monitoring Weight Status among Women of Reproductive Age. Renato Littaua, DVM, MPVM Healthy Weight and Pregnancy Webinar January 31, 2012.
 1/31/12 Monitoring Weight Status among Women of Reproductive Age Renato Littaua, DVM, MPVM Healthy Weight and Pregnancy Webinar January 31, 12 Outline Methods Review overweight and obesity among non-pregnant
980 North Jefferson Street, Jacksonville, Florida T TDD Toll Free
 This document discusses the North Florida Transportation Planning Organization s approach to meeting the needs of persons with limited English Proficiency in executing the TPO s transportation planning
CANNABIS CONTROL COMMISSION Public Meeting. January10, 2019
 CANNABIS CONTROL COMMISSION Public Meeting January10, 2019 Department of Transportation Conference Room 10 Park Plaza Boston, MA 02116 12:00PM-3:00PM 1 Agenda 1) Call to Order 2) Chairman s Comments &
Mortality Slide Series. National Center for HIV/AIDS, Viral Hepatitis, STD, and TB Prevention Division of HIV/AIDS Prevention
 Mortality Slide Series National Center for HIV/AIDS, Viral Hepatitis, STD, and TB Prevention Division of HIV/AIDS Prevention HIV Mortality Slides An analysis of trends in rates and distributions of deaths
Students Who are Deaf or Hard-of- Hearing in Minnesota. June 2011
 This document is made available electronically by the Minnesota Legislative Reference Library as part of an ongoing digital archiving project. http://www.leg.state.mn.us/lrl/lrl.asp Students Who are Deaf
D296 To be eligible for admission to the curriculum for the degree of Master of Science in Implant Dentistry, a candidate shall:
 D.47/817 REGULATIONS FOR THE DEGREE OF MASTER OF SCIENCE IN IMPLANT DENTISTRY [MSc(ImplantDent)] These regulations apply to candidates admitted in 2017-2018 and thereafter. (See also General Regulations
Traumatic Brain Injury
 Traumatic Brain Injury I N T H E U N I T E D S T A T E S Emergency Department Visits, Hospitalizations and Deaths 2002 2006 U.S. Department of Health and Human Services Centers for Disease Control and
Pawnee Public Schools. Wellness Policy
 CHILD NUTRITION AND PHYSICAL FITNESS PROGRAM The Pawnee Board of Education recognizes that childhood obesity has reached epidemic levels throughout the country. Overweight children are at a higher risk
PHYSICAL THERAPIST ASSISTANT PROGRAM ADMISSION INFORMATION
 PHYSICAL THERAPIST ASSISTANT PROGRAM ADMISSION INFORMATION 2018 Cohort NOTES Updated November 2017 PTA Program Admission Information Booklet Page 2 TABLE OF CONTENTS Abbreviations... 3 Introduction...
WESTFIELD PUBLIC SCHOOLS 5320 IMMUNIZATION
 WESTFIELD PUBLIC SCHOOLS PUPILS WESTFIELD, NEW JERSEY 5320 Regulations follow Page 1 of 1 5320 IMMUNIZATION In order to safeguard the school community from the spread of certain communicable diseases and
M.Ed. in SPECIAL EDUCATION
 HUMAN DEVELOPMENT AND CHILD STUDIES SCHOOL OF EDUCATION AND HUMAN SERVICES M.Ed. in SPECIAL EDUCATION ASD Concentration (Endorsement) INFORMATION AND APPLICATION PACKET HUMAN DEVELOPMENT AND CHILD STUDIES
Job Description: Special Education Teacher of Deaf and Hard of Hearing
 **FOR SCHOOL YEAR 2015-16** Reports to: Headmaster / Special Education Job Description: Special Education Teacher of Deaf and Hard of Hearing The Boston Arts Academy is looking for a high Teacher of Deaf
HELP MAKE YOUR EVENTS MORE ACCESSIBLE TO PEOPLE WHO ARE HARD OF HEARING OR DEAF
 HELP MAKE YOUR EVENTS MORE ACCESSIBLE TO PEOPLE WHO ARE HARD OF HEARING OR DEAF TAP PLUS Theatre Development Fund s (TDF) TAP Plus program, in partnership with the New York State Council on the Arts (NYSCA)
Council on Education of the Deaf. Office of Program Accreditation. CED Program Review Evaluation Rubric
 Council on Education of the Deaf Office of Accreditation CED Review Evaluation Rubric Evaluation Rubric Cover Sheet Institution State Date submitted Name of Preparer Email Evaluation Review Team Member