Encompass. Eastern Kentucky University. Lee Doernte Eastern Kentucky University. January 2018
|
|
|
- Coral Francis
- 5 years ago
- Views:
Transcription

1 Eastern Kentucky University Encompass Online Theses and Dissertations Student Scholarship January 2018 Use Of Dual Energy X-Ray Absorptiometry Measurements To Evaluate Total Body Volume When Compared To Air Displacement Plethysmography For Evaluating Body Composition In A Four Compartment Model Lee Doernte Eastern Kentucky University Follow this and additional works at: Part of the Exercise Science Commons Recommended Citation Doernte, Lee, "Use Of Dual Energy X-Ray Absorptiometry Measurements To Evaluate Total Body Volume When Compared To Air Displacement Plethysmography For Evaluating Body Composition In A Four Compartment Model" (2018). Online Theses and Dissertations This Open Access Thesis is brought to you for free and open access by the Student Scholarship at Encompass. It has been accepted for inclusion in Online Theses and Dissertations by an authorized administrator of Encompass. For more information, please contact Linda.Sizemore@eku.edu.
2
3 STATEMENT OF PERMISSION TO USE In presenting this thesis in partial fulfillment of the requirements for a Master of Science degree at Eastern Kentucky University, I agree that the Library shall make it available to borrowers under rules of the Library. Brief quotations from these documents are allowable without special permission, provided that accurate acknowledgements of the source are made. Permission for extensive quotation from, or reproduction of this document, may be granted by my major professor. In his absence, by the Head of Interlibrary Services when, in the opinion of either, the proposed use of the material is for scholarly purposes. Any copying or use of the material in this document for financial gain shall not be allowed without my written permission. Lee A. Doernte Date: April 4, 2018
4 USE OF DUAL ENERGY X-RAY ABSORPTIOMETRY MEASUREMENTS TO EVALUATE TOTAL BODY VOLUME WHEN COMPARED TO AIR DISPLACEMENT PLETHYSMOGRAPHY FOR EVALUATING BODY COMPOSITION IN A FOUR COMPARTMENT MODEL BY LEE A. DOERNTE Submitted to the Faculty of the Graduate School of Eastern Kentucky University in partial fulfillment of the requirements for the degree of MASTER OF SCIENCE 2018
5 Copyright by LEE A. DOERNTE 2018 All Rights Reserved. ii
6 DEDICATION This thesis is dedicated to my wife Alessandra, who supported me throughout my career change and decision to further my education, and April, who s tireless hours and support made this research project possible. I couldn t have finished my thesis without the support of you both. iii
7 ACKNOWLEDGEMENTS I would like to acknowledge: Dr. Mike Lane, who gave me the guidance and education needed to conduct research, as well as the autonomy to control all aspects of a major research project. Dr. Aaron Sciascia, for teaching me more in a single semester about research statistics than I had learned in my previous classes combined. Dr. Jim Larkin, for the years of assistance and being a model for teaching methodology. Dr. Heather Adams-Blair, for guidance, assistance, and being personally relatable throughout graduate school Shane Harris, for unending assistance throughout the years iv
8 ABSTRACT Intro: Body composition is an important metric to evaluate overall health. Having reliable body composition testing methods are critical to ensure that an individual is receiving correct data in which to base health, nutrition, and lifestyle decisions. With technological improvements, there are more reliable, high-quality testing devices for body composition than in the past. However, there remains questions on the validity of the devices to properly measure body composition. There is a need for a more accurate, simplistic testing methodology. Purpose: The purpose of this paper was to examine the use of dual energy x-ray absorptiometry (DEXA) based formulas to evaluate body volume (BV). The second purpose was to examine the validity of using predicted body volume measurements in four-compartment body composition models. Methods: Subjects were tested on three devices designed for body composition metrics; DEXA for lean body mass, bone mineral content, and fat mass, BodPod for body volume, and a bioimpedance spectroscopy (BIS) device using dual electrode tabs (SFB7) for total body water. The measured metrics were used to compute two DEXA based predicted BV equations, Wilson, et al. (2012) and Smith-Ryan, et al. (2017). The results were then compared to measured BodPod BV. Second, this study calculated two different four-compartment model formulas, Withers, et al. (1998) and Wang, et al. (2005), using a DEXA calculated body volumes. These models were then compared to a four-compartment model using BodPod measured body volume. Results: 90 healthy adults (50 females and 40 males), aged 18 to 66 years (median 23 years), BMI 18 to 34 (median 25), weight 45 to 115 kg (mean ± SD kg), height 150 to 191 cm ( ± 9.98 cm), BodPod data was collected and used as a standard for comparison to the DEXA based body volume formulas; (Wilson et al. 2012) and (Smith-Ryan, et al., 2017). BodPod measured BV mean of ± SD L, Wilson, et al. (2012) ± L, and Smith-Ryan, et al. (2017) ± L. ANOVA yielded no statistical difference between the three groups (p=.915). Among the Withers, et al. (1998) formula, paired t-test of BodPod/Withers yielded a significant difference lower than Wilson/Withers (z = , p.001) and Smith-Ryan/Withers yielded a significant difference lower than BodPod/Withers (z = , p.001). Among Wang, et al. (2005) formula, Wilcoxon signed-rank test of BodPod/Wang yielded a significant difference lower than Wilson/Wang (z = , p.001) and Smith- Ryan/Wang a significant difference lower than BodPod/Wang (z = , p.001). These significant differences indicate the predicted BV equations are not equivalent to using measured BV and yielded inaccurate results Conclusion: The use of DEXA based BV formulas is a viable replacement for other BV testing methodologies for use in four-compartment testing models. However, both the Wilson, et al. (2012) and Smith-Ryan, et al. (2017) formulas failed to be a viable replacement for measured BodPod values. A new formula, A new formula resulted from this study. Further studies may be needed before a formula can be utilized in four-compartment models. v
9 Table of Contents Chapter Page I. INTRODUCTION... 1 Body Composition and Health... 1 Body Composition Testing... 2 Bioelectrical Impedance Spectroscopy... 5 Underwater Weighing... 5 Air Displacement Plethysmography... 6 Dual Energy X-Ray Absorptiometry... 7 Body Composition Compartment Models... 7 Gap in Literature... 8 Purpose... 9 Limitations Delimitations II. REVIEW OF LITERATURE Body Composition and Health Metabolic Syndrome Cardiovascular Disease Type 2 Diabetes Hypertension Body Composition Testing Bioelectrical Impedance Spectroscopy Underwater Weighing vi
10 Air Displacement Plethysmography Dual Energy X-Ray Absorptiometry Body Composition Compartment Models Methods for Evaluating Four Compartment Models III. METHODOLOGY Experimental Design Subjects Initial Assessment Body Composition Testing Bioelectrical Impedance Spectroscopy Air Displacement Plethysmography Dual Energy X-Ray Absorptiometry Data Collection Tester Reliability Data Analysis IV. RESULTS Normality Subject Data Body Volume Results Withers Percent Body Fat Formula Wang Fat Mass Formula V. DISCUSSION Body Volume Values vii
11 Hypothesis Hypothesis Body Composition Formulas Hypothesis Hypothesis Wilson, et al. (2012) Concerns Smith-Ryan, et al. (2012) Concerns Hypothesis Results Formula Changes Future Studies Conclusion REFERENCES APPENDICES APPENDIX A: DEXA Consent APPENDIX B: Informed Consent APPENDIX C: Subject History APPENDIX D: Data Collection APPENDIX E: Equipment viii
12 List of Tables Table Page Table 1 Normality Table 2 Subject Descriptive Data Table 3 Body Volume Descriptive Data Table 4 ANOVA: Body Volume Table 5 Volume t-test Paired Differences Table 6 % Body Fat Descriptive Statistics Table 7 %BF Friedman Test Table 8 %BF Wilcoxon Signed-Rank Test Table 9 Fat Mass (kg) Descriptive Statistics Table 10 FM (kg) Friedman Test Table 11 FM (kg) Wilcoxon Signed-Rank Test Table 12 Doernte Normality Table 13 Doernte Paired Sample Statistics Table 14 Doernte Correlation Table 15 BodPod - Doernte Paired Differences Table 16 Doernte Wilcoxon Signed-Rank Test Table 17 Doernte Formula Descriptive Statistics ix
13 ABBREVIATIONS 1. Air Displacement Plethysmography...BodPod 2. Bioelectrical Impedance Analysis... BIA 3. Bioelectrical Impedance Spectroscopy... BIS 4. Body Mass Index... BMI 5. Bone Mineral Content... BMC 6. Body Volume... BV 7. Dual Energy X-Ray Absorptiometry...DEXA 8. Fat-Free Mass... FFM 9. Fat Mass... FM 10. Lean Mass... LM 11. Percent Body Fat... %BF 12. Total Body Water... TBW x
14 CHAPTER I INTRODUCTION Body composition is an important metric to evaluate overall health. Having reliable body composition testing methods are critical to ensure that an individual is receiving correct data in which to base health, nutrition, and lifestyle decisions (Pescatello, 2014). With technological improvements, there are more reliable, high-quality testing devices for body composition than in the past. However, there remains questions on the validity of the devices to properly measure body composition. There is a need for a more accurate, simplistic testing methodology. Body composition testing commonly consists of multiple separate metrics, typically first assessing total body weight, lean body mass, and fat mass, to calculate body fat percentage. Each of these metrics are important for evaluating body composition. There are other metrics that are underutilized and could provide a more accurate, complete model of body composition testing, such as bone mineral content and body volume. Utilizing these additional metrics to create a complete model would lead to higher accuracy in testing of body composition. Body Composition and Health Understanding the relationship between body fat percentage and lean body mass can be used for guidance towards fitness training and nutrition for 1
15 overall wellness purposes. According to the Centers for Disease Control and Prevention (2017), in America, 38% of the population is obese and another 33% are overweight. Over the years, it has become well established that obesity can lead to serious health problems. The CDC (2017) has linked obesity to all causes of death (mortality), high blood pressure (hypertension), high LDL cholesterol, low HDL cholesterol, or high levels of triglycerides (dyslipidemia), type 2 diabetes, coronary heart disease, stroke, gallbladder disease, osteoarthritis (a breakdown of cartilage and bone within a joint), sleep apnea and breathing problems, some cancers (endometrial, breast, colon, kidney, gallbladder, and liver), low quality of life, mental illness such as clinical depression, anxiety, other mental disorders, body pain, and difficulty with physical functioning. These issues are largely preventable if healthy body composition is maintained. Body Composition Testing A common method many individuals have traditionally used to gauge their body composition is to weigh themselves on a common bathroom scale. There are many problems with this method. The scales are often uncalibrated, low quality, and provide unreliable results. Body weight alone does not provide enough data to make informed decisions regarding health and fitness. While there are weight charts to give general guidelines, they do not account for the composition differences in body fat mass and lean body mass. This method also does not account for height, so a person with a height of 5 0 that weighs 2
16 200 pounds would rate the same on the weight chart as someone who is 6 6 and weighs 200 pounds, even though body fat and lean body mass composition could be drastically different. Without the composition knowledge, misinformation could mislead people to believe they are healthy, when in fact their body fat could be too high, or that they are overweight, when in fact, their body composition is ideal. Another common method to address body composition is to use an individual s height, weight, and age to calculate body mass index (BMI). This method uses more data than weight alone. It has the additional benefit of using established standardized scales to provide knowledge on where an individual would fall within a spectrum (underweight to obese). BMI is calculated using a person s mass in kilograms divided by height in meters squared and reported as kg/m 2. Using this formula (BMI = kg/m 2 ), the most common categories are as follows: (1) underweight -- BMI 18.5 kg/m 2 or less, (2) normal weight -- BMI between 18.5 kg/m 2 and 24.9 kg/m 2, (3) overweight -- BMI between 25 kg/m 2 and 29.9 kg/m 2, and (4) obesity -- BMI 30 kg/m 2 or greater. This method is more effective than assessing body weight alone, but still has flaws. One major flaw is the numbers are not translatable into true body composition. The value from the equation helps to guide the general population to a recommended weight range for height, but it does not provide information on body composition. BMI only provides information regarding how far someone is from a range considered healthy by the BMI, but does not evaluate fat percentage, or how far they are from a desirable body fat percentage. Another 3
17 flaw is that BMI, not only fails to inform individuals of their body fat percentage but has no method to distinguish lean body mass from body fat mass. A person with a larger lean mass might be calculated to be overweight or obese using the BMI formula, even if their body composition is actually normal, or even lean. This method misinforms many athletes and muscular people into the belief they are overweight or obese, creating the illusion they are unhealthy (a false positive). Bioelectrical impedance analysis (BIA) devices are another common method used to test body composition and provide a technological edge in evaluation of body composition. These devices can be hand-held or stand-on varieties. BIA devices provide more information about body composition than BMI. BIA estimates body composition by measuring electrical resistance of the human body to transmission of 800 microamps at 50KHz (using an electrical impedance plethysmograph) into the deep tissues of the body (Lukaski, Johnson, Bolonchuk, & Lykken, 1985). This data is then calculated with a manufacturer s formula to statistically estimate body fat percentage and lean body mass, providing the beginnings of a body composition model. Some models additionally predict total body water but are considered unreliable with single frequency scanning (Rallison, Kushner, Penn, & Schoeller, 1993). While these devices are affordable and readily available, there is a concern about the accuracy and reliability. Many studies have examined BIA and found their reliability and accuracy to be questionable, and possibly unfit to be used as a 4
18 measure of body composition (Dehghan & Merchant, 2008; Peterson, Repovich, & Parascand, 2011). Bioelectrical Impedance Spectroscopy A more advanced model of BIA is the bioimpedance spectroscopy (BIS). BIS devices scan 256 frequencies between 4 khz and 1000 khz. The additional scanning provides a validated metric unavailable by single frequency BIA, the evaluation of total body water (Higgins, Reid, Going, & Howell, 2007). The addition of an accurate body water evaluation, through the evaluation of intracellular fluid and extracellular fluid, along with lean body mass and fat mass, allows for an additional metric to be calculated into a body composition model. The additional metric provides increased accuracy in estimating percent body fat. Underwater Weighing For many years the gold standard of analyzing percent body fat has been underwater weighing, also known as hydrostatic weighing or hydrodensitometry (McArdle, Katch, & Katch, 2011). Underwater weighing is done by first weighing a subject before entering a water tank. The subject is then placed on a scale, lowered into the water tank and asked to expel all air from the lungs. The difference in weight is then used to calculate percent body fat (Moon, et al., 2011). To get an accurate measurement, an average of 9 measurements is needed using underwater weighing (Zamora, Jakicic, 5
19 Hortobágyi, & O'brien, 1995). The displacement of the water can be used to calculate the volume of the subject. Using the formula density = mass x volume, density can also be calculated from underwater weighing, allowing more complete body composition measurements. Part of the challenge with this method is that it is very time consuming to do a valid percent body fat measurement using this method. Also, a large water tank and special scale are required, which can be very costly and space consuming. With the amount of time and space needed, underwater weighing is an inconvenient method compared to newer technologies. Air Displacement Plethysmography Air displacement plethysmography (BodPod) uses whole body densitometry to determine body composition in a method similar to underwater weighing. The BodPod measures body mass using a precise, calibrated scale. The subject then has their body volume measured by sitting in the BodPod as it adds small amounts of air and measures the difference in pressure (McArdle, Katch, & Katch, 2011). The resulting pressure difference is calculated to compute the body volume. The volume in the lungs can either be predicted or measured directly through breathing apparatus attached to the BodPod. The resulting volumes and mass measurements are then used to calculate density, which in turn is used to calculate lean mass and body fat. This method is easier, faster, and equally reliable to the traditional method of underwater weighing (Fields, Goran, & McCrory, 2002). 6
20 Dual Energy X-Ray Absorptiometry One of the newest technologies for measuring body composition is dual energy X-ray absorptiometry (DEXA). DEXA operates by passing X-ray energy through a body and detecting the energy not absorbed on the other side. The results are used to derive bone mineral content, fat mass, and lean mass. DEXA machine is a fast method (typically taking only 6-10 minutes) to measure body composition. Besides being fast, DEXA is also accurate, equal in validity to underwater weighing and proving to have even greater reliability (Morrison, et al., 1994). Body Composition Compartment Models Growing technology trends lead to newer, more valid and reliable methods for testing body composition. Technology has improved to include the use of x-ray technology, air displacement, and improvements to traditional bioimpedance methods. With the use of these new methods, body composition is becoming much more reliable, but there are still issues with a practical method of accurate testing. To compensate for this, multi-compartment models are used to increase the accuracy of body composition testing. Multi-compartment models use several factors to increase the accuracy of body composition testing, such as lean mass, fat mass, total body water, bone mineral content, and residual protein. Historically, most testing methods accounted for two of these (lean mass and fat mass), creating a two-compartment model. Few, such as the 7
21 DEXA can account for three (fat mass, lean mass, and bone mineral content) creating a three-compartment model. The use of a four-compartment model would increase the validity of body composition measurements and allow a more accurate percent body fat (%BF) evaluation. While many of these technologies are accurate, they are also very time consuming and impractical when dealing with a four-compartment model. The need to create a practical and valid way of establishing a multi-compartment model without the use of several testing modalities has not been established. The ability to remove multiple testing devices to create an accurate model would not only save time, but also cost, reducing the overall expense per test and the cost of needing several testing machines. It would also appeal to many universities as a way to save space, creating a more effective lab in a much smaller space. The need for the large space demands of underwater weighing chambers and BodPod could be freed up for other research applications. Gap in Literature A gap in the literature is created from the lack of research on an efficient way to create a four-compartment model without the need for many testing devices. While many four-compartment models exist (mostly using a BodPod for body volume, BIA or BIS for total body water, and a DEXA for bone mineral content, lean mass, and fat mass), few have explored the option of comprising a testing modality to using only DEXA and BIS only to create a fourcompartment model of testing body composition. Millard-Stafford, et al. (2001) 8
22 explored the possibility of using BodPod in place of DEXA or underwater weighing as a method to compute a four-compartment model, but this study found evidence that BodPod was not a valid method of estimating body density in place of underwater weighing, making it an unacceptable method of evaluating a four-compartment model. The next progression in research to reduce the quantity of required testing methods came when Wilson, et al. (2012) developed a method to use DEXA as a four-compartment model, through the calculation of body volume (BV), with only the use of one additional testing methodology, BIA, to evaluate total body water, but it was only in the theoretical stages. Smith-Ryan (2017) further explored methods and calculations of using DEXA to evaluate a four-compartment model by using lean mass, bone mineral content, and fat mass calculated from DEXA scans, a BIA for calculation of TBW, and expanded research in using body volume derived from calculations of the DEXA results. The results showed promise, but no validation of this method has been conducted. The need to explore a multimethodology four-compartment model compared to a DEXA predicted BV fourcompartment model still exists. Also, the validation of which formula, Wilson, et al. (2013) or Smith-Ryan, et al. (2017), for deriving body volume with a DEXA, needs to be explored and compared. Purpose The purpose of this research was to examine the use of dual energy x- ray absorptiometry (DEXA) based measurements to evaluate body volume. The 9
23 formulas established by Wilson et al. (2012) and Smith-Ryan et al. (2017) were both evaluated for validity in comparison with known measurements by air displacement plethysmography (BodPod), to establish the validity of using DEXA based measurements to establish body volume. Second, the validity of using predicted body volume measurements from DEXA in four-compartment body composition models by Withers, et al. (1998) and Wang, et al. (2005) was compared to a multi-system four-compartment body composition model for validity utilizing BIA, BodPod, and DEXA (Kuriyan, Thomas, Ashok, Jayakumar, & Kurpad, 2014). It was hypothesized that (1) the predicted body volume equations will be statistically equivalent to the measurements of BodPod; (2) the Ryan-Smith, et al. (2017) formula will have a smaller variation when compared to BodPod values then the Wilson et al. (2012) formula; (3) predicted body volume fourcompartment modes will be statistically equivalent to the multi-system model; and (4) there will be statistical difference between DEXA measured body fat compared to the Withers, et al. (1998) formula and the Wang, et al. (2005) formulas, using both predicted and measured body volumes. Results provided important information that will be useful to modify body composition testing for future subjects to ensure accurate data is presented to all subjects, allowing for more informed decision making regarding their body composition in a more time efficient manner. This information should make body composition testing faster and more economical when utilizing multicompartment body composition models. Further, this research will provide 10
24 evidence to a potential alternative to the replacement of body volume measurement devices in favor of DEXA based formulas. Limitations A limitation to this study was the subjects unable to pass the measured thoracic volume portion of the BodPod. Of the 90 subjects, 30 had to use the predicted volume setting of the BodPod due to inability to pass measured thoracic volume portion. Research cited has shown the predicted thoracic model is statistically equivalent to measured thoracic volumes, however exact measurements would be more precise (Wagner, 2015). A second limitation is that fasted states, workouts, and medical statuses were self-reported. Self-reporting in a study is a limitation because there is no proof of the action and no guarantee that the subject is being honest. If the subject did not report honestly, measurements could be misrepresented. While all attempts are taken to avoid subject misrepresentation, honest reporting can never be guaranteed. Unknown menstrual cycles of female subjects can be an additional limitation. Shifts in fluid retention have been linked to female hormonal changes. Research has shown that total body water and percent body fat increases during the mid and end of a menstrual cycle (Hicks, 2017). Changes in menstrual cycle during testing period will affect body composition testing. Due to subject availability, this study was also highly skewed toward collegeaged, European-American adults, providing little availability to explore age and 11
25 racial differences among populations at similar mass with regards to density. This population is also not representative of the national census, resulting in a formula skewed toward a single population, misrepresenting other volumes. The age was also heavily skewed left on the histogram, toward college aged adults. This was expected as a sample of convenience was utilized. The study was open and encouraged to all ages of over 18, with a need for at least 20 of the subjects needing to be from the over-40 age category. The desire was to get an equal distribution for age and gender, however there wasn t an opportunity among age. The study was conducted at a university and, consequently, the median age was only 23, with a mean age of ± years and a range of 18 to 66. This was due to the availability and willingness to participate of college age adults versus the over-40-aged adults. Attempts were made to normalize this through recruitment as much as possible. Delimitations Underwater weighing was not utilized in this study due to time constraints and difficulty of use compared to BodPod. BodPod is easier, faster, and equally reliable to the traditional method of underwater weighing (Fields, Goran, & McCrory, 2002). There was also limited use to an underwater chamber, while there was unlimited access to a BodPod. Selected exclusion criteria to this study included a BMI below 18 or above 35. BMI s outside this range report body volumes incorrectly. The BodPod under estimates people with BMI s lower than 18 up to 15% and BMI s higher 12
26 than 35 by 8.51% (Lowry & Tomiyama, 2015). The cut off for urine specific gravity was no greater than Normal kidney function is between to Values outside of this range can indicate health issues and irregular total body water (Sommerfield, et al., 2016). Subjects were also eliminated from participation due to metabolic disease, kidney disease, heart disease, tachycardia, or hypertension. Irregular health status can result in incorrect body composition measurements (Powers, Choi,, Bitting, Gupta, & Buchowski, 2009). 13
27 CHAPTER II REVIEW OF LITERATURE Body Composition and Health Body fat has long been associated with negative health effects. Chang, et al. (2012) conducted a systemic review of older adults and the association of body fat to morbidity and mortality. They found as individuals age, they lose key components such as bone mineral density and lean body mass, while their abdominal fat increases. This increase in abdominal fat is most commonly visceral fat, which is highly associated to adverse health effects (Chang, Beason, Hunleth, & Colditz, 2012). Many conditions such as metabolic syndrome, inflammation, dyslipidemia, insulin resistance, type-2 diabetes, cardiovascular diseases, and cancer are associated with high body fat (Cefalu, et al., 1995; Després & Lemieux, 2006; Steinberger & Daniels, 2003; Kuk, et al., 2006). Chang et al. (2012) first looked at common methods of analyzing body composition. The first common method was BMI. Chang et al, (2012) showed that BMI does not distinguish between lean mass and fat mass in weight, making it unreliable as a measure of proper body composition. Anthropometric measurements add more data and give a better calculation, but still have a high user error and provide unreliable data (Chang, Beason, Hunleth, & Colditz, 2012). 14
28 Metabolic Syndrome Visceral adipose fat places individuals at greater risk for metabolic syndrome. Metabolic syndrome is a condition postulated to be from underlying insulin resistance that leads to other conditions, such as polycystic ovary syndrome, fatty liver, gallstones, sleep disturbances, asthma and some forms of cancer (Grundy, Brewer, Cleeman, Smith, & Lenfant, 2004). The development of metabolic syndrome may further exacerbate the collection of visceral fat, increasing many risk factors associated with metabolic syndrome, including dyslipidemia and hypertension (Després & Lemieux, 2006; Chang, Beason, Hunleth, & Colditz, 2012). The development of metabolic syndrome becomes a primary risk factor for other diseases, such as cardiovascular disease and diabetes (Chang, Beason, Hunleth, & Colditz, 2012). Cardiovascular Disease The likelihood of developing cardiovascular disease from metabolic syndrome becomes a high probability and leads to severe health consequences. Isomaa et al. (2001) studied 4,483 subjects for cardiovascular risk associated with metabolic syndrome. The results after follow-up showed subjects with metabolic syndrome were three times more likely to develop cardiovascular disease then those without metabolic syndrome. This leads to a direct link that increased body fat leads to a marked increase in risk for cardiovascular disease. Malik et al. (2004) found similar results in a study connecting metabolic syndrome to mortality via coronary heart disease, 15
29 cardiovascular disease, and all causes in United States adults. The results from were consistent with previous studies, finding coronary heart disease, cardiovascular disease, and total mortality are significantly higher in US adults with metabolic syndrome than in those without metabolic syndrome. The research was further expanded by Veronica and Esther (2012) with research involving aging, cardiovascular disease, and metabolic syndrome. The findings were that metabolic syndrome not only lead to a higher prevalence of cardiovascular disease, but other pathological conditions such as increased peroxidation of nitric oxide, generation of free radicals, and increased lipoperoxidation, which are precursors to cancer. Type 2 Diabetes Increased body fat is also linked to insulin resistance and type 2 diabetes. Steinberger and Daniels (2003) conducted a study reviewed by the American Diabetes Association and containing recommendations from the American Diabetes Association s Clinical Practice Recommendations. Weight loss is associated with improved insulin sensitivity, while obesity is associated with significantly more insulin resistance. Luckily, the link between diabetes type 2 and obesity is one that is reversible. Steinberger and Daniels suggest that just a 10% to 15% decrease in weight can have massive benefits in the treatment of diabetes type 2. Type 2 diabetes is emerging as a major health emergency, making the need for accurate body composition testing and education paramount. 16
30 Hypertension Hypertension is also highly linked with body fat. Hayashi et al (2003) found in a study of 563 Japanese-Americans that intra-abdominal fat was associated with hypertension as a significant predictor of morbidity, even after adjustments for total subcutaneous fat area, abdominal subcutaneous fat area, body mass index, or waist circumference. Hypertension is a strong risk factor for stroke, coronary heart disease, congestive heart failure, and mortality. Currently hypertension affects 25% of all Americans, and as many as 90% at some point during their lifetime (Wang & Vasan, 2005). The use of proper body composition monitoring and treatment could help reduce the risk of this condition. Body Composition Testing Duren, et al. (2008) analyzed methodology and components of body composition in a study to address the growing epidemic of obesity and related diseases, such as type 2 diabetes. After analyzing multiple methods, Duren, et al. (2008) concluded the most important aspect for the benefit of health analysis is body fat. Increased body fat was cited as an important factor that leads to insulin resistance and has a dramatic impact on metabolism. Accurate assessment information is very important to assess body fat. The use of total body water and fat free mass is one way suggested to evaluate body composition. There is a need to find the optimal method of testing for body fat. 17
31 Bioelectrical Impedance Spectroscopy Bioelectrical impedance spectroscopy (BIS), also known as multifrequency bioelectrical impedance, is widely used as a measurement of body composition. BIS is similar to BIA in that it estimates body composition by measuring resistance of the human body to electrical transmission. However, while BIA only uses a single frequency, BIS uses multiple frequencies to provide a more accurate and reliable estimation of body fat, lean mass, and total body water. While many methods exist for calculating total body water. Traditionally, the gold standard is using underwater weighing, however studies have been conducted to create a more practical method of evaluating total body water using bioelectrical impedance. A study of 36 healthy males, with cross validation analysis on two random subsets, yielded evidence supporting total body water calculations by BIA as a valid method (Segal, et al., 1991). Goncalves, et al. (2015) conducted a similar study utilizing 32 athletes. Measurements included: total body water, extracellular fluid, and intracellular fluid using deuterium and bromide dilution techniques as criterion against BIA. When comparing the different methods, no significant difference was found between BIA and the criterion measures. These results lead to the conclusion that bioelectrical impedance is a valid non-biased assessment of TBW and may well be the new standard (Gonçalves, Matias, Santos, Sardinha, & Silva, 2015). 18
32 Underwater Weighing Underwater weighing, or hydrostatic weighing, has historically been the gold standard of body composition testing. Using the Archimedes principle, which states an object s loss of weight in water equals the weight of the volume of water it displaces, thus making the specific gravity the ratio of the weight of an object in air divided by its loss of weight in water. The loss of weight in water equals the weight in air minus the weight in water (McArdle, Katch, & Katch, 2011). This method is known to be reliable, but very time inefficient, causing time delays and reducing the number of subjects that can be tested for body composition at a given time. A study was conducted to determine the minimum number of trials necessary to establish true underwater weight during body density measurements on 86 college females. Nine to ten trials of underwater weight assessment were recorded for each subject. The group was used as a matter of convenience. The method used was to conduct underwater weighing on each subject 9-10 times per person. What they found was that as people became accustomed to the methods of expiration during the weighing that their weight continued to increase. This increased body density values by density units. These results were anticipated pre-investigation. In 42% of the assessments, the subject s highest underwater weights were observed during the first five trials. The magnitude of error associated with these trials was considerably higher than for the last several trials. This was due to an 85% reduction in within-individual variability (Katch, 2013). This study shows that, not 19
33 only is a single test time consuming, but to have reliability in the testing method, ten tests must be conducted, and the first five will have a high error level, making them unusable. With this delay in time, a new gold standard needs to be established. Air Displacement Plethysmography Other methods have been compared with underwater weighing to seek a new standard in body composition testing. One popular method is air displacement plethysmography (BodPod). Fields et al. (2012) conducted a systematic review of the validity of air displacement plethysmography, more commonly known as a BodPod. The BodPod was compared to DEXA and hydrostatic weighing. Results of percent body fat indicated the BodPod and hydrostatic weighing results are within 1% for adults and children, whereas the BodPod and DEXA results are within 1% for adults and 2% for children. This study was conducted because few studies have compared BodPod results with multicompartment models results. The studies that have done a comparison suggest an underestimation of 2 3 %BF by both the BodPod and hydrostatic weighing. Compared with four-compartment models, the BodPod underestimates percent body fat by 2 3 % in adults and children. The conclusion found BodPod is a reliable and valid technique that can quickly and safely evaluate body composition in a wide range of subject types but lacks the accuracy of a four-compartment model. 20
34 Another study conducted by Utter et al. (2003) compared hydrostatic weighing in a collegiate wrestling population in hydrated and acutely dehydrated states. The study methods were to examine body composition by BodPod, hydrostatic weighing, and three-site skinfolds. The subjects were 66 NCAA Division I collegiate wrestlers. The subjects were tested before and after acute dehydration (2.6% reduction in body mass). The results yielded no statistically significant differences between BodPod and hydrostatic weighing for body density, percent body fat, and fat-free mass in the hydrated or the dehydrated states. This study found body density, percent body fat, and fat-free mass from the BodPod are similar compared with hydrostatic weighing during hydrated and acutely dehydrated states. This study provided evidence that BodPod is a reliable replacement for hydrostatic weighing in various conditions. Another study examined the effect of covert subject actions on percent body fat measured by BodPod. The reason why they were examining this is the belief some athletes were using methods such as changing their breathing to manipulate the readings and to examine how these manipulations might be affecting other measurements. Subjects underwent body composition analysis by BodPod following the standard procedure using the manufacturer's guidelines. The subjects then underwent eight more measurements while performing the following intentional manipulations: 4 breathing patterns altering lung volume, foot movement to disrupt air, hand cupping to trap air, and heat and cold exposure before entering the chamber. The results demonstrated that subjects were able to covertly change their estimated BodPod body 21
35 composition value by altering breathing when compared with the standard condition (Tegenkamp, Clark, Schoeller, & Landry, 2011). To accurately establish body volume (BV), air displacement plethysmography (BodPod) provides a standard comparably equivalent to hydrostatic weighing (Lohman & Going, 1993). This allows for a much more practical and less time-consuming measurement of assessing BV. One question is the validity of a BV measurement when measured thoracic gas is not achievable, either by subject error or lack of equipment. McCrory et al. (1998) analyzed the validity of BodPod using measured thoracic gas volume against BodPod using predicted thoracic volume equations. Studying 50 subjects, no significant differences were found between measured and predicted groups (mean difference ± SE, 53.5 ± 63.3 ml). With these findings, it allows for the collection of many more subjects using predicted thoracic volume assessment (when measured thoracic volume could not be established). Other researchers found similar results showing no significant differences between using predicted and measured thoracic volumes with BodPod measurements. Wagner (2015) conducted a similar study on 33 collegiate athletes and found predicted thoracic gas volume was not significantly different (p = 0.343) from measured thoracic gas volume. These results show BV measurements with a BodPod using predicted thoracic measurements are statistically equivalent to measured thoracic volumes. 22
36 Dual Energy X-Ray Absorptiometry A newer trend that has been compared to underwater weighing is dual energy X-ray absorptiometry (DEXA). DEXA is quickly becoming the reference standard in body composition testing due to its ease of use, speed of testing, and high level of reliability and validity. Duren et al. (2008) stated the use of dual energy X-ray absorptiometry (DEXA) is the most popular method for calculating fat mass, lean mass, and bone tissue. One study was completed to compare estimates of body composition in two ethnic groups, 31 black and 38 white females, 10 through 16 years of age, to establish accurate and precise laboratory standards for field measures of body composition. The method used was to examine DEXA scan values against corresponding values of fat-free mass and percent body fat from underwater weighing. These were determined using the two-compartment model of Siri, and these were corrected using the model of Lohman for white girls only. The results were the two-compartment model overestimated fat-free mass compared to estimates from DEXA for black girls, as did the corrected Lohman model for white girls. The two-compartment model significantly overestimated percent body fat in both white and black girls compared to corresponding estimates from DEXA. Because of this fact, DEXA values of percent body fat are typically greater than those from underwater weighing for subjects under approximately 24% body fat, but the converse occurs above 25% body fat. The inability of underwater weighing, using the two-compartment model, to account for the body composition in these girls can be corrected in 23
37 part by measuring the variables for a multicompartment model or more easily by using DEXA estimates of body composition. The results of the inaccuracies of underwater weighing method provide evidence for the need to replace underwater weighing as the gold standard and give DEXA the recognition as the more valid method and the new gold standard for body composition testing (Morrison, et al., 1994). Glickman et al. (2004) conducted a study to examine the validity of DEXA for body composition. DEXA was originally only used as a method to measure bone density and total body composition. After improvements in software, DEXA can now determine abdominal fat mass. For this study, 65 adults aged participated with DEXA to have their abdominal fat measured. Results from DEXA were then compared to computed tomography for abdominal fat mass in the L1-L4 region. DEXA showed excellent reliability among three different operators to determine total, fat, and lean body mass in the L1-L4 region. The DEXA was found to be a reliable and accurate method to determine abdominal obesity. This study lends further credit to DEXA as the new gold standard of body composition testing. Body Composition Compartment Models Siervo and Jebb (2010) reviewed the importance of various aspects of body composition in relation to establishing accurate body fat percentage. A framework was established with various models of body composition, all with limitations on their own. However, the importance of collecting as much 24
38 accurate data as possible was established in order to derive the most accurate percent body fat. The use of a multi-compartment model was shown to be more accurate than any single testing method. In order to derive a multi-compartment model, various data must first be collected. This may include fat mass (FM), fatfree mass (FFM), total body water (TBW), extracellular water (ECW), intracellular water, bone mineral content, and residual protein mass. This data can then be utilized by various multi-compartment models to derive accurate percent body fat (Siervo & Jebb, 2010). Kopper et al. (1998) examined a three-compartment model against underwater weighing, deuterium oxide dilution, skinfold thickness measurements, bioelectrical impedance analysis, and a prediction equation based on the body mass index. Body fat was calculated using a threecompartment body composition model derived from body density and total body water percentage. The results showed correlation coefficients between the different methods were high and significant. This study shows that the single predictive methods have considerable mean and individual biases compared with the three-compartment model and all predictive methods underestimated body fat in the studied subjects. This information leads to the conclusion that a fully developed multi-compartment model would be the most accurate method of testing body composition as all single methods are far less valid. Future studies need to include the development of population-specific prediction formulas. 25
39 In a study that compared body fat percentage obtained from a fourcompartment model with percent body fat from hydrodensitometry (using - deuterium) in 291 subjects, results showed there are differences between percent body fat measured by the four-compartment and two-compartment models. When validated against the reference four-compartment model, twocompartment models were found to be unsuitable for accurate measurements of percent body fat. These further provides evidence that an accurate fourcompartment model is required to measure a valid and reliable percent body fat, and two-compartment models are too unreliable. (Deurenberg-Yap, Schmidt, Staveren, Hautvast, & Deurenberg, 2001) Withers et al. (1998) compared two, three, and four-compartment models for analyzing body composition. The two-compartment model study consisted of fat mass (FM) and fat free mass (FFM). The three-compartment model consisted of fat mass, total body water, and fat free dry mass. The fourcompartment model was comprised of fat mass, total body water (TBW), bone mineral content (BMC), and residual mass. These models were compared using equal groups of highly trained men (n=12), sedentary men (n=12), highly trained women (n=12), and sedentary women (n=12). For this study, all experiments were conducted when the subjects were fasting (twelve hours since last meal), normally hydrated, and had not exercised for 24 hours. To minimize fluid retention in women, they were not tested for seven days preceding menstruation or during menstruation. In order to minimize withinsubject biological variability, the bone density and total body water tests were 26
40 administered on the same morning. Most of the subjects (n=34) had the DEXA measurements conducted the same morning as the other two tests, however 13 were rescheduled the following morning. One woman was not tested until 13 days later. Hydrodensitometry was used to evaluate bone density percent body fat via underwater weighing at residual volume. Fat free mass was estimated using the formula percent body fat (%BF) = (497.1/Body Density) (Brozek, Grande, Anderson, & Keys, 1963). DEXA scans were additionally taken and compared to underwater weighting results. Correlation coefficients between DEXA and underwater weighing of 1.0 were found for bone mineral content, for fat, and 1.0 for lean tissue mass. Total body water was calculated with a deuterium dilution derived from a saliva sample collected from subjects. Their fat free mass was calculated using the assumption that 72% of the fat free mass is comprised of water in a normally hydrated person using the formula FFM (kg) = TBW (kg) / 72 * 100 (Withers, et al., 1998). The two-compartment model was evaluated using fat mass and fat free mass. The assumptions were made that fat mass has a density of g/cm 3 and fat free mass has a density of g/cm 3 at 36 C. Percent body fat was then calculated using the formula %BF = (497.1/Body Density) Three compartment models add density to the calculation with the addition of total body water, assumed to have a density of g/cm 3 and fat free mass becomes fat free dry mass, with density modified to g/cm 3 and percent body fat is calculated using the formula %BF = (211.5/Body Density) (TBW/body mass) , where body density is defined as body volume / 27
41 body mass. The four-compartment model incorporates the additional use of bone mineral content, assumed at a density of g/cm 3 and residual mass, assumed a density of g/cm 3. The formula for the four-compartment model of percent body fat became %BF = (251.3 / Body Density) * (TBW / body mass) * (BMC / body mass) (Withers, et al., 1998). The results for the comparison of the models revealed the overall mean of FFM to be g/cm 3, significantly greater (P<0.001) than the twocompartment density assumption of g/cm 3. Individual FFM densities ranged from g/cm 3 to g/cm 3. This resulted in overestimations of 0.9% and underestimations of 5.9% body fat. The results yielded evidence to support that two-compartment models compared to three-compartment models, for all groups, resulted in significantly greater means and variances (P<0.02) than those found between the three and four-compartment models (Withers, et al., 1998). No significant differences were found in the three-compartment versus the four-compartment models. Given these results, it is reasonable to infer the two-compartment model is significantly less accurate than a three or four compartment model, and thereby less useful for evaluating body fat percentage. The lack of significant differences between the three and four compartment models leads to the conclusion that the division of fat-free dry mass into residual mass and bone mineral content leads to little or no improvement in measurement of body fat percentage (Withers, et al., 1998). Wang, et al. (2005) advanced research in the body composition field methodology and created a new formula to evaluate body composition. Wang et 28
42 al. created the formula FM(kg) = 2.748(BV) 0.699(TBW) (Mo) 2.051(Body Mass) where Mo is equal to total body BMC x , a metric which is measured by DEXA. This method is able to utilize readily available metrics to create an accurate four-compartment model to evaluate fat mass in kilograms. This formula incorporates the same metrics used by Withers, et al. (1998) using body volume, total body water, bone mineral content, and body mass to derive a four-compartment model but removes body density in favor of only body volume, removing the redundancy of using body mass twice. The formula can easily be rewritten to FM (kg) = (BV) (TBW) (BMC*1.0436) (Body Mass) for use with DEXA derived data. This formula can also be used to calculate body fat percentage where %BF = (FM / Body Mass) X 100 (Wang, Shen, Withers, & Heymsfield, 2005). The Withers, et al. (1998) formula of %BF = (251.3 / Body Density) * (TBW / body mass) * (BMC / body mass) and the Wang, et al. (2005) formula of FM(kg) = 2.748(BV) 0.699(TBW) (Mo) 2.051(Body Mass) lend themselves to direct comparison. With body density equal to body volume / body mass and Mo equal to total body BMC x , both formulas incorporate the same metrics, BMC, body mass, BV, and TBW. A study to assess the agreement of body fat and fat-free mass measured by simpler methods against the four-compartment model used 60 obese schoolchildren (defined by body mass index 95th percentile) between the ages of 8y and 13y. Multicompartmental body composition was estimated using isotopic dilution, BodPod, DEXA, and anthropometric equations and compared 29
43 the results against a four-compartment model. The results showed isotopic dilution and anthropometric equations underestimated body fat in boys; while DEXA, BodPod, and anthropometric equations overestimated body fat in boys. All the equations underestimated body fat in girls. Isotopic dilution and DEXA two-compartment methods had the best agreement with the four-compartment model for both body fat and fat-free mass (Vergara, et al., 2014). This study lends further evidence that a four-compartment model is far more valid then the use of any single testing modality. Methods for Evaluating Four Compartment Models Wilson et al. (2012) expanded on the methodology of using a fourcompartment model. Their objective was to simplify the process of establishing the four-compartment model by eliminating the need for deuterium and underwater weighing by instead measuring body protein using DEXA and BIA. The protein estimate from direct calibration protein derived from BIA water, bone mass, and body volume was compared to the Lohman (1993) and Wang (2005) equations which derived protein content calculated from the data collected from the DEXA and BIA, and then was compared to the neutron activation analysis, which is considered the gold standard for measurement in vivo total body protein. The results of this study were that neutron activation analysis had the highest correlation, lowest root mean squared error, and fewest outliers with direct calibration protein, compared with the Lohman (1993) and Wang (2005) equations derived protein. This evidence shows there are 30
44 simpler, and equally efficient methods of calculating body fat by using a fourcompartment model without the complications and expense of underwater weighing and chemical compounds, such as deuterium. With this new data, Wilson et al. (2012) were able to calculate a new method to assess body volume using the DEXA as well. With the lean mass, fat mass, and bone mineral content derived from the DEXA, Wilson et al. was able to derive the equation of body volume (with a GE-DEXA) = Fat/0.87+ Lean/ BMC/ , which converts the GE DEXA mass in kilograms to volume in liters (Wilson, et al., 2012). The use of this equation to evaluate BV without a separate testing modality would eliminate the need for an underwater weighing chamber or BodPod when utilizing a four-compartment body composition model. Tinsley (2017) examined equations for estimation of body volume from DEXA scans to be used for body composition evaluation in modified fourcompartment models. The design of the study used 48 recreationally active males and females who completed two pairs of identical assessments, which included a DEXA scan and single-frequency bioelectrical impedance analysis. Body volume and four-compartment equations were applied to the results to establish body composition. The results showed both body volume equations demonstrated excellent reliability but there was a significant difference between equations when a four-compartment model equation was used. The difference was 4.3 kg for lean mass and fat mass and 6.9% for body fat percentage. These results showed promise in the use of DEXA to establish 31
45 a single testing unit that produces a four-compartment model. Future studies are needed and include the continued study of body volume measurements. Smith-Ryan et al. (2017) further developed a method for creating a fourcompartment body composition model using DEXA for percent body fat, fat mass, and lean mass. These researchers sought to derive a new method of estimating body volume (Smith-Ryan, et al., 2017). BodPod is an industry standard in establishing body volume and a valid alternative to underwater weighing for the use of establishing body volume, arguably becoming the new gold standard for volume measurements (Lohman & Going, 1993). The Smith- Ryan et al. (2017) study focused on the validity and reliability of using DEXA for calculating body volume in comparison to BodPod and improving the calculation formula for using DEXA. When analyzing the body volume results of the DEXA and comparing it to results from BodPod, no significant differences were found with the Wilson et al. (2012) equation. Using the data from sub samples, Smith- Ryan et al. (2017) used inverse density coefficients and derived the formula of DEXA BV (L) = Fat/0.84+ Lean/1.03 -BMC/ based on the formula of Wilson et al. (2012). With the additional research of validity and reliability of body volume calculated by DEXA being statistically equivalent to BodPod, there is opportunity to eliminate the need for underwater weighing and BodPod to calculate a four-compartment model using only DEXA and a total body water test. Using the DEXA to evaluate volume for a four-compartment model could potentially be the most accurate model, eliminating the need for any other tests 32
46 and saving hours of time per subject, as well as the expense of additional materials and equipment. Further research would be needed to validate the use of a DEXA predicted BV model against a traditional four-compartment model. Both the Wilson, at al. (2012) formula and the Smith-Ryan (2017) formula need to be examined against BodPod results for validity and for use in the Withers, et al. (1998) and the Wang, et al. (2005) four-compartment body composition models. 33
47 CHAPTER III METHODOLOGY Experimental Design Subjects were tested on three devices designed for obtaining body composition metrics: DEXA for lean body mass, bone mineral content, and fat mass; BodPod for body volume; and a bioimpedance spectroscopy (BIS) device using dual electrode tabs (SFB7) for total body water to examine the validity of two separate DEXA predicted body volume (BV) equations, Wilson, et al. (2012) and Smith-Ryan, et al. (2017), compared to measured BodPod BV. This study also compared two different formulas for establishing a four-compartment model, Withers, et al. (1998) and Wang, et al. (2005), using DEXA calculated body volumes. These models were compared to a four-compartment model using BodPod measured body volume. Subjects Subjects were informed, prior to arrival, to be fasted for at least: (1) 8 hours before testing, (2) 2 hours without water, (3) 24 hours without alcohol, (4) 24 hours without intensive exercise, and (5) be normally hydrated (calculated by urine specific gravity less than 1.030). At least 24 hours prior to any testing, subjects were given information and instruction about each of the different body composition methods they were to participate in. 34
48 Initial Assessment Subjects arrived at the lab and completed informed consent documents (see Appendix B) and health history questionnaires to ensure all subjects were healthy as defined by meeting all inclusion criteria (see Appendix C). Female subjects signed documentation denoting they were not currently pregnant and that there was no possibility they could be pregnant prior to their scan (see Appendix A). Subjects with elevated resting heart rates (over 100 beats per minute) or high blood pressure (greater than 140/90) were disqualified from participation in the study. Subjects who self-reported a history of metabolic diseases, previous kidney, heart, or hydration issues were also disqualified from participation in the study. Subjects were then questioned to confirm they did not (1) have a large meal within eight hours of their visit, (2) consume alcohol within 24 hours of their visit, (3) drink any fluids for two hours prior to testing, or (4) participate in any hard, physical activity for 24 hours before testing. Upon arriving to the lab, subjects self-obtained a urine sample in a standard medical-grade specimen cup for analysis by the research team. They were instructed to catch approximately half the cup mid-stream. The urine sample was tested for urine specific gravity and color to ensure normal hydration (defined as specific gravity less than 1.030). During the initial bathroom visit, the subjects were also asked to void their bowels (if possible) so that an accurate body mass could be measured. Subjects then had their height measured with a wall mounted measuring tape and speed square. Height data was recorded on data sheets with all measurements in centimeters (cm) (see 35
49 Appendix D). Subjects next had their weight measured via the BodPod calibrated scale and recorded on the data sheet in kilograms (kg). Body Composition Testing The body composition metrics of the subjects were measured utilizing a variety of different testing methods. Air displacement plethysmography (BodPod) was utilized to measure total body volume with both measured and predicted thoracic volumes. Dual energy x-ray absorptiometry (DEXA) was utilized to measure fat mass, lean mass, and bone mineral content. Finally, bioelectrical impedance spectroscopy (BIS) was utilized to measure total body water. Bioelectrical Impedance Spectroscopy Subjects were tested for body composition using bioelectrical impedance spectroscopy attached to silver chloride dual wet electrodes via SFB7 device (ImpediMed Limited, Queensland, Australia) (see Appendix E). Each contact point for wet electrode pads was: (1) shaved to be hair free, ensuring proper conduction, and (2) cleaned utilizing isopropyl alcohol. Subjects were positioned lying supine on a nonconductive athletic training table. Electrodes were placed on each limb, with the dual electrode placed at the styloid process and extended to the lunate on both hands and the distal tibia and talus of both feet allowing measurement of right whole-body water and left whole body water (see Appendix D). Measurements were immediately repeated. Dual-tabs were then 36
50 removed, and the site was cleaned with isopropyl alcohol. New dual-tabs were then applied, and measurements repeated twice more. Measurements were analyzed by Impedimed (see Appendix E) analytical software. Results were recorded (see Appendix D) and averaged to calculate TBW. Air Displacement Plethysmography Body composition assessment via air displacement plethysmography was measured using a Cosmed BodPod (COSMED USA, INC, Concord, CA) (see Appendix E). Subjects wore standardized, gender appropriate, compression garments and a swim cap (per manufacturer recommendations). Subjects were instructed to remove all metallic objects and jewelry for the remainder of the testing session. Subjects were then weighed on a calibrated BodPod scale and body mass was recorded. Subjects were then instructed to remain still and breathe normally while being tested. Additionally, lung volumes were measured during the BodPod test, utilizing the measured lung capacity scan settings. Subjects were instructed to remain still and breath according to the prompts on the computer guiding the lung measurement. Subjects that were unable to complete the measured thoracic body volume in five attempts had their predicted thoracic volume measurements recorded using BodPod Siri settings (as defined by manufacturer recommendations for subject population). Scans were repeated if body volume measurements differed by more than 25 ml. Total body mass, predicted thoracic volume or measured thoracic volume, first body volume, second body volume, and total body volume were recorded. 37
51 Dual Energy X-Ray Absorptiometry Dual energy X-ray absorptiometry (DEXA), measurements were conducted utilizing a GE Lunar Prodigy Advance Bone Densitometry scanner (General Electric Company, Cincinnati, OH) (see Appendix E). Subjects wore standardized clothing (medical scrubs). Subjects were again reminded to ensure all metal and jewelry had been removed. All scans were performed utilizing the total body scan. Subjects were placed upon the table symmetrically with feet and knees secured together with Velcro straps. Subjects were scanned using the total body option from the top of their head to the bottom of their feet. Data of total body mass, lean body mass, and bone mineral content were recorded (see Appendix D). Data Collection Data was collected following each individual test. Data was stored on each individual testing device for future recall, as well as collected on a data sheet, and stored in electronic data Microsoft Excel (Microsoft Corp. Seattle, WA, version 2016) (see Appendix E) sheets (see Appendix D). Data for the bioelectrical impedance spectroscopy (BIS) included left body water, repeated measurement, right body water, repeated measurement, reposition measurements, and reposition repeated measurements. Data for the BodPod included total body mass, predicted thoracic volume or measured thoracic volume, first body volume, second body volume, and total body volume. Data 38
52 for the DEXA scanner included total body mass, lean body mass, and bone mineral content. Tester Reliability Test/re-test reliability was conducted with each device. Reliability testing for DEXA was conducted on 16 subjects, tested on three occasions in a single week at the same time of day, Monday, Wednesday, and Friday for lean mass, fat mass, percent body fat, and bone mineral content. Intraclass correlation coefficients (ICC) were calculated using the two-way random effects model with absolute agreement for all four variables tested: LM, FM, %BF, and BMC [ICC (3,1)]. The ICC of r = 0.99 indicated excellent test/re-test reliability for all variables. SFB7 measurements were conducted then immediately repeated. Electrodes were removed and replaced, and measurements were again conducted then immediately repeated during the same session. All four values were recorded for analysis with an average being generated for each measurement. Intraclass correlation coefficients (ICC) were calculated using the two-way random effects model with absolute agreement [ICC (2,1)]. The ICC of r = 0.99 indicated excellent test/re-test reliability. Reliability testing for the BodPod was conducted on 16 subjects, tested on three occasions in a single week at the same time of day, Monday, Wednesday, and Friday. Intraclass correlation coefficients (ICC) were calculated using the two-way random effects model with absolute agreement [ICC (3,1)]. The ICC of r = 0.99 indicated excellent test/re-test reliability. 39
53 Data Analysis Data was extracted from each of the body composition testing devices for total body mass, lean body mass, body fat, and body fat percentage. For devices that did not include a body fat percentage result, the formula of body fat divided by total body mass was used to calculate body fat percentage. To test for continuity on the same device, the formula of 1 - (lean body mass divided by total body mass) to calculate percent body fat was utilized. All statistical tests were conducted using IBM SPSS Statistics software (Armonk, NY, version 23) and formatted using Microsoft Excel 2016 (Seattle, WA, version 2016) (see Appendix E). Variables was analyzed for normality using a Shapiro-Wilk normality test. Values found to be normally distributed were defined by normality test p >.05. Summary statistics for normally distributed demographic items were analyzed using descriptive data statistics and reported as means and standard deviations. These included height, weight, Wilson, et al. (2012) body volume formula, Smith-Ryan, et al. (2017) body volume formula, and BodPod measured body volume values. Data analysis for Wilson, et al. (2012) body volume formula, Smith-Ryan, et al. (2017) body volume formula, and BodPod measured body volume values was conducted using a single factor ANOVA for variance analysis and paired two sample t-test to identify paired differences. Values found to not be normally distributed were defined by normality test p.05. Summary statistics for not normally distributed demographic items were analyzed using descriptive data statistics and reported as medians and 40
54 range. These included age, BMI, total body water, Withers, et al. (1998) formula utilizing BodPod measured values, Withers, et al. (1998) formula utilizing Wilson, et al. (2012) predicted values, Withers, et al. (1998) formula utilizing Smith-Ryan, et al. (2017) predicted values, DEXA measured percent body fat, Wang, et al. (2005) formula utilizing BodPod measured values, Wang, et al. (2005) formula utilizing Wilson, et al. (2012) predicted values, Wang, et al. (2005) formula utilizing Smith-Ryan, et al. (2017) predicted values, and DEXA measured fat (kg). Data analysis for Withers, et al. (1998) formula utilizing BodPod measured values, Withers, et al. (1998) formula utilizing Wilson, et al. (2012) predicted values, Withers, et al. (1998) formula utilizing Smith-Ryan, et al. (2017) predicted values, DEXA measured percent body fat, Wang, et al. (2005) formula utilizing BodPod measured values, Wang, et al. (2005) formula utilizing Wilson, et al. (2012) predicted values, Wang, et al. (2005) formula utilizing Smith-Ryan, et al. (2017) predicted values, and DEXA measured fat (kg) was conducted using Friedman test for variance analysis and Wilcoxon signed-rank test to identify paired differences. 41
55 CHAPTER IV RESULTS Normality A normality test was conducted on all applicable variables and formula results pertaining to this study (Table 1). Results indicated that all variables and formulas were normal, as defined by a significance greater than.05, with the exception of age, BMI, total body water, %BF of Smith-Ryan/Withers, DEXA based %BF, and all FM (kg) measurements. Table 1 - Normality Kolmogorov- Tests of Normality Smirnov a Shapiro-Wilk Sig. Sig. Age BMI.200 *.047 Weight.200 *.258 Height Total Body Water DEXA BV (L) = (Wilson, et al. 2012).200 *.306 DEXA BV (L) = (Smith-Ryan, et al. 2017).200 *.318 BodPod Measured.200 *.224 %BF = (BodPod/Withers).200 *.188 %BF = (Wilson/Withers).200 *.079 %BF = (Smith-Ryan/Withers) Dexa %BF.200 *.031 FM(kg) = (BodPod/Wang) FM(kg) = (Wilson/Wang) FM(kg) = (Smith-Ryan/Wang) Dexa Fat (kg) *. This is a lower bound of the true significance. Shaded regions fail to show normaility 42
56 Subject Data Subject data included 90 healthy adults (Table 2), 50 females and 40 males, aged 18 to 66 years (median 23 years), BMI 18 to 34 (median 25), weight 45 to 115 kg (mean ± SD kg), height 150 to 191 cm ( ± 9.98 cm), total body water 25 L to 63 L (median L), who volunteered from a sample of convenience. Table 2 Subject Descriptive Data Total Subject Descriptive Data Age (yrs) BMI Weight (kg) Height (cm) Total Body Water Mean Median Standard Deviation Range Minimum Maximum Count Female Only Descriptive Data Age (yrs) BMI Weight (kg) Height (cm) Total Body Water Mean Median Standard Deviation Range Minimum Maximum Count Male Only Descriptive Data Age (yrs) BMI Weight (kg) Height (cm) Total Body Water Mean Median Standard Deviation Range Minimum Maximum Count
57 Body Volume Results All subjects were measured in the BodPod on measured thoracic settings. Of the 90 subjects, 60 completed measured thoracic volumes and 30 were unable to complete within five attempts. The 30 that were unable to successfully complete measured thoracic volume utilized the predicted Siri model (as defined by manufacturer recommendation for the population). BodPod data was collected and used as a standard for comparison to the DEXA based body volume formulas; DEXA BV (L) = Fat/ Lean/ BMC/ (Wilson et al. 2012) and DEXA BV (L) = Fat/ Lean/ BMC/ (Smith-Ryan, et al., 2017). BodPod measured body volume (Table 3) yielded a mean of ± L, Wilson, et al. (2012) yielded ± L, and Smith-Ryan, et al. (2017) yielded ± L. Table 3 Body Volume Descriptive Data Body Volume Descriptive Data BodPod Measured Wilson, et al Smith-Ryan, et al Mean Standard Deviation Count An ANOVA (Table 4) was conducted comparing the three body volume groups; BodPod measured, the results of the formula from Wilson, et al. (2012), and the results of the formula from Smith-Ryan, et al. (2017), Results of the ANOVA yielded a P-value of.915, indicating no significant variance among the three body volume groups. 44
58 Table 4 ANOVA: Body Volume Anova: Single Factor - Body Volume SUMMARY Groups Count Sum Average Variance BodPod Measured DEXA BV (L) (Wilson, et al. 2013) DEXA BV (L) (Smith-Ryan, et al. 2017) ANOVA Source of Variation SS df MS F P-value F crit Between Groups Within Groups Total A paired t-test (Table 5) was then conducted to compare both the Wilson, et al. (2012) and Smith-Ryan, et al. (2017) formulas to the measured BodPod values. The paired difference between BodPod measured and Wilson, et al. (2012) showed Wilson, et al. (2012) higher than BodPod by 0.53 ± 0.89 L. The paired difference between BodPod measured and the Smith-Ryan, et al. (2017) formula showed BodPod measured body volumes 0.34 ± 0.85 L higher than the Smith-Ryan, et al. (2017). The paired difference between Wilson, et al. (2012) and the Smith-Ryan, et al. (2017) formula showed Wilson, et al. (2012) body volumes 0.87 ± 0.71 L higher than the Smith-Ryan, et al. (2017). The significance levels between all pairs were approximately p 0.001, indicating there was a significant difference between each pairing. 45
59 Table 5 Volume t-test Paired Differences Paired Differences Std. Interval of the Sig. (2- Body Volume Paired Samples Test Mean Deviation Lower Upper tailed) BodPod Measured - (Wilson, et al. 2012) BodPod Measured - (Smith-Ryan, et al. 2017) (Wilson, et al. 2012) - (Smith-Ryan, et al. 2017) Withers Percent Body Fat Formula The Withers, et al. (1998) formula of %BF = (251.3 / BD) * (TBW / body mass) * (BMC / body mass) was used to evaluate percent body fat and compared to DEXA derived percent body fat for comparison standard. Body volume was utilized (as part of the body density) from the measured BodPod volumes, the Wilson, et al. (2012) formula, and Smith-Ryan, et al. (2017) formula. The resulting median (Table 6) of the DEXA derived percent fat was 26.37% with a range of 33.87%. The resulting median of the BodPod and Withers, et al. (1998) formula was 26.37% with a range of 35.87%. The Wilson, et al. (2012) formula and Withers, et al. (1998) formula median was 26.19% with a range of 39.79%. The Smith-Ryan, et al. (2017) formula and Withers, et al. (1998) formula median was 22.44% with a range of 41.02%. Table 6 Percent Body Fat Descriptive Statistics %BF Descriptive Data Dexa %BF %BF (BodPod/Withers) %BF (Wilson/Withers) %BF (Smith-Ryan/Withers) Median Range Minimum Maximum Count
60 A Friedman test (Table 7) was conducted to examine variance between the four groups; BodPod/Withers, et al. (1998), Wilson, et al. (2012)/Withers, et al. (1998), Smith-Ryan, et al. (2017) /Withers, et al. (1998) formulas and DEXA %BF. The results yielded an asymptotic significance of.001, indicating there was a significant variance among the four %BF values. Table 7 %BF Friedman Test Mean %BF Friedman Ranks Rank Test Statistics a Dexa %BF 3.08 N 90 %BF (BodPod/Withers) 2.14 Chi-Square %BF (Wilson/Withers) 3.22 df 3 %BF (Smith-Ryan/Withers) 1.56 Asymp. Sig..000 a. Friedman Test A Wilcoxon signed-rank test (Table 8) was then conducted to evaluate the BodPod/Withers, et al. (1998), Wilson, et al. (2012)/Withers, et al. (1998), Smith-Ryan, et al. (2017)/Withers, et al. (1998) and DEXA %BF in paired comparisons. The paired difference between DEXA %BF and BodPod/Withers was BodPod/Withers showed a significant difference lower than DEXA %BF (z = , p.001). The paired difference between DEXA %BF and Wilson/Withers showed no significant difference (z = , p = 0.280). When comparing the paired difference between DEXA %BF and Smith-Ryan/Withers, Smith-Ryan/Withers showed a significant difference lower than DEXA %BF (z = , p.001). 47
61 Among the formulas, the paired difference between Wilson/Withers and BodPod/Withers was calculated. BodPod/Withers showed a significant difference lower than Wilson/Withers (z = , p.001). The paired difference between BodPod/Withers and Smith-Ryan/Withers showed Smith- Ryan/Withers a significantly lower than BodPod/Withers (z = , p.001). The paired difference between Wilson/Withers and Smith-Ryan/Withers showed Smith-Ryan/Withers had a significantly lower than Wilson/Withers (z = , p.001). Table 8 Percent Body Fat Wilcoxon Signed-Rank Test Asymp. Sig. %BF Wilcoxon Signed-Rank Test Z (2-tailed) %BF (BodPod/Withers) - Dexa %BF b.000 %BF (Wilson/Withers) - Dexa %BF c.280 %BF (Smith-Ryan/Withers) - Dexa %BF b.000 %BF (Wilson/Withers) - %BF (BodPod/Withers) c.000 %BF (Smith-Ryan/Withers) - %BF (BodPod/Withers) b.000 %BF (Smith-Ryan/Withers) - %BF (Wilson/Withers) b.000 a. Wilcoxon Signed Ranks Test b. Based on positive ranks. c. Based on negative ranks. Wang Fat Mass Formula The Wang, et al. (2005) formula of FM (kg) = (BV) (TBW) (BMC) (Body Mass) was used to evaluate body fat and 48
62 compared to DEXA derived body fat for a comparison standard. Body volume was used from the measured BodPod volumes, the Wilson, et al. (2012) formula, and Smith-Ryan, et al. (2017) formula. The resulting median (Table 9) of the DEXA derived fat mass was kg with a range of kg. The resulting median of the BodPod and Wang, et al. (2005) formula was kg with a range of kg. The Wilson, et al. (2012) formula and Wang, et al. (2005) formula median was kg with a range of kg. The Smith-Ryan, et al. (2017) formula and Wang, et al. (2005) formula median was kg with a range of kg. Table 9 Fat Mass (kg) Descriptive Statistics FM (kg) Descriptive Data Dexa Fat (kg) FM(kg) (Bod Pod/Wang) FM(kg) (Wilson/Wang) FM(kg) (Smith-Ryan/Wang) Median Range Minimum Maximum Count A Friedman test (Table 10) was conducted to examine variance between the four groups; DEXA fat (kg), BodPod/Wang, et al. (2005), Wilson, et al. (2012)/Wang, et al. (2005), and Smith-Ryan, et al. (2017)/Wang, et al. (2005). The results yielded an asymptotic significance of p.001, indicating there was a significant variance among the four FM (kg) values. 49
63 Table 10 Fat Mass (kg) Friedman Test Mean FM (kg) Friedman Ranks Rank Test Statistics a Dexa Fat (kg) 3.43 N 90 FM(kg) (Bod Pod/Wang) 2.00 Chi-Square FM(kg) (Wilson/Wang) 3.09 df 3 FM(kg) (Smith-Ryan/Wang) 1.48 Asymp. Sig..000 a. Friedman Test A Wilcoxon signed-rank test (Table 11) was then conducted to analyze the BodPod/Wang, et al. (2005), Wilson, et al. (2012)/Wang, et al. (2005), Smith-Ryan, et al. (2017)/Wang, et al. (2005) and DEXA fat (kg) in paired comparisons. The paired difference between DEXA fat (kg) and BodPod/Wang was BodPod/Wang showed a significant difference lower than DEXA fat (kg) (z = , p.001). The paired difference between DEXA fat (kg) and Wilson/Wang showed Wilson/Wang a significantly lower than DEXA fat (kg) (z = , p =.018). The paired difference between DEXA fat (kg) and Smith- Ryan/Wang was Smith-Ryan/Wang showed a significant difference lower than DEXA fat (kg) (z = , p.001). Among the formulas, the paired difference between Wilson/Wang and BodPod/Wang was BodPod/Wang showed a significant difference lower than Wilson/Wang (z = , p.001). The paired difference between BodPod/Wang and Smith-Ryan/Wang showed Smith-Ryan/Wang a significantly lower than BodPod/Wang (z = , p.001). The paired difference between 50
64 Wilson/Wang and Smith-Ryan/Wang showed Smith-Ryan/Wang a significantly lower than Wilson/Wang (z = , p.001). Table 11 Fat Mass (kg) Wilcoxon Signed-Rank Test Z Asymp. Sig. (2- FM (kg) Wilcoxon Signed-Rank Test tailed) FM(kg) (Bod Pod/Wang) - Dexa Fat (kg) b.000 FM(kg) (Wilson/Wang) - Dexa Fat (kg) b.018 FM(kg) (Smith-Ryan/Wang) - Dexa Fat (kg) b.000 FM(kg) (Wilson/Wang) - FM(kg) (Bod Pod/Wang) c.000 FM(kg) (Smith-Ryan/Wang) - FM(kg) (Bod Pod/Wang) b.000 FM(kg) (Smith-Ryan/Wang) - FM(kg) (Wilson/Wang) b.000 a Wilcoxon Signed Ranks Test b Based on positive ranks. c Based on negative ranks. 51
65 CHAPTER V DISCUSSION Body Volume Values The first goal of this research was to evaluate the merits of using a DEXA machine to establish body volume. The formulas evaluated to establish BV using a DEXA were the Wilson, et al. (2012) and Smith-Ryan, et al. (2017) formulas. These formulas were then compared to the measured values from the BodPod for significant differences. If the DEXA-based formulas for measuring BV were found statistically equivalent to the measurements of the BodPod, then logically the DEXA becomes a viable method to replace other BV devices, such as BodPod and underwater weighing. Creating an alternative methodology of measuring BV with only a DEXA would allow the use of predicted BV values in a four-compartment model and save time by eliminating the need for a second device for the measure of BV. Hypothesis 1 The first hypothesis of this study was the predicted body volume equations would be statistically equivalent to the measurements of BodPod. Evidence was found to support this hypothesis. No significant differences were found between the three groups containing both predicted body volume equations and the BodPod measured volume. An ANOVA conducted between the three body volume groups indicating no statistical difference between the formulas and the 52
66 measured BodPod results (p = 0.915). This was consistent with the first hypothesis. These results were expected, as the formulas were well researched, accounted for predicted densities of each metric, and were derived from linear regression. The finding of no statistical difference granted merit to the possibility of replacing BodPod measured body volume with DEXA based formulas. Hypothesis 2 The second hypothesis was the Ryan-Smith, et al. (2017) formula results would have a smaller variation when compared to measured BodPod values then the Wilson et al. (2012) formula results. Evidence was found to support this hypothesis. Paired sample t-tests were conducted comparing the Wilson, et al. (2012) formula and the Smith-Ryan, et al. (2017) formula to the measured BodPod body volume. Wilson et al. (2012) formula body volume calculated 0.53 ± 0.89 L greater than the measured BodPod volume, while the Smith- Ryan, et al. (2017) formula calculated 0.34 ± 0.85 L less than measured BodPod values. As Smith-Ryan, et al. (2017) mean difference to the measured BodPod results were smaller compared to the Wilson et al. (2012) formulas results, the Smith-Ryan, et al. (2017) formula is a statistically better choice to replace measured BodPod values for use in four-compartment body composition models. These results are consistent with the second hypothesis. The findings of this hypothesis followed a logical progression as Smith- Ryan, et al. (2017) researched the Wilson, et al. (2012) formula and expanded 53
67 upon it. Smith-Ryan, et al. (2017) did have a smaller mean difference, and the standard deviation put it within the same range of BodPod, as did the Wilson, et al. (2012) formula, but there was still a difference. In this study, it was not found that these formulas were a perfect match to BodPod measured body volumes. The difference in body volumes could be a result of sample of the constant needing further evaluation. Statistically, it appeared that these formulas, particularly Smith-Ryan, et al. (2018), were viable replacements for BodPod measured body volume. It then became imperative to evaluate the use of these formulas in a practical setting. While no statistical variance was found, and the difference in measured and predicted body volumes was as low as 0.34 ± 0.85 L, there was still a difference. It remained to be seen if this small mean difference yields a clinical significance when utilized to evaluate body composition in a four-compartment body composition model. Body Composition Formulas The second goal of this research was to evaluate the predicted body volume values derived from the formulas and the measured BodPod values for use in two separate four-compartment body composition model formulas, Withers, et al. (1998) and Wang, et al. (2005). Validity of using predicted body volume measurements, to arrive at a statistically equivalent value compared to the multi testing modality that utilizes the BodPod, needed to be assessed. The results 54
68 from these formulas were compared to the body composition results given by the DEXA factory. Both four-compartment models utilize the same metrics to evaluate a fourcompartment model; bone mineral content, total body mass, body volume, and total body water. Utilizing similar formulas with the same metrics allowed each formula to be evaluated with only a BIS for TBW, DEXA for BMC, and a DEXA utilizing predicted BV formulas measured BodPod values. These results allowed evaluation of the statically equivalent predicted BV values for clinical significance and practical use. Hypothesis 3 The third hypothesis of the research was that predicted body volume fourcompartment models would be statistically equivalent to a multi-system fourcompartment model. Evidence was found to reject this hypothesis. Examining the difference between the pairing of the Smith-Ryan/Withers formula and the BodPod/Withers formula yielded a statistically significant difference of Smith- Ryan/Withers formula (median = 22.44, range = 41.02) lower than the BodPod/Withers formula (median = 25.09, range 35.87) (p <.001). This variation is a direct result of the 0.34 ± 0.85 L BV difference between the Smith- Ryan, et al. (2017) formula and the measured BodPod values. All other values were consistent in the Withers, et al. (1998) formula. The reason for this variation in the formula could be an intolerance to the variation of the body volume or the need of an updated four-compartment 55
69 model formula. Because the Withers, et al. (1998) formula is %BF = (251.3 / BD) * (TBW / body mass) * (BMC / body mass) 179.0, and BD is defined as body mass / BV, which can be redefined as (251.3 * BV) / body mass, as BV increases, the total value of (251.3 / BD) increases, which causes a greater difference in the resulting %BF. Because the Smith-Ryan, et al. (2017) mean is higher than the measured BodPod mean, results varied significantly. These results lead to the conclusion that Smith-Ryan, et al. (2017) is unsuitable for use in the Withers, et al. (1998) formula. These results illustrated the clinical significance of the predicted body volume difference compared to measured BodPod values. While there was no statistical variance in the body volume measurements, there was a statistically significant difference once the body volume values were placed into practical use as a metric for calculating %BF. When comparing the results from Smith- Ryan, et al. (2018) minimum values to those of the measured BodPod minimum values, the Smith-Ryan, et al. (2018) formula underestimated the %BF by 8% utilizing the Withers, et al. (1998) formula values, and 11% with the Wang, et al. (2005) formula values. At the minimum values, this could result in a healthy female of athletic or lean %BF being misdiagnosed and mistreated as dangerously underweight. Conversely, the same error in the upper %BF range could also result in a misdiagnosis of a slightly overweight individual, needing only mild nutritional and fitness changes, being diagnosed as morbidly obese and being prescribed unnecessary medications for weight loss. 56
70 Hypothesis 4 The fourth hypothesis stated there would be a statistical difference between DEXA measured body fat compared to the Withers, et al. (1998) formula and the Wang, et al. (2005) formula, using both predicted and measured body volumes. This hypothesis was based on the premise that if a four-compartment model was truly more accurate, then there would be a statistical difference compared to the DEXA. Further research revealed this assumption to be accurate. Research into the validity of DEXA based %BF versus a fourcompartment model found a significant difference in that DEXA consistently underestimated %BF by a mean of 1.7% compared to a four-compartment model (p <.001) (Ploeg, Withers, & Laforgia, 2003). Evidence was found to accept this hypothesis for Smith-Ryan, et al. (2017) and measured BodPod, but not Wilson, et al. (2012). Friedman Ranks test yielded a significant variance among the four groups (p.001) which was consistent with the fourth hypothesis. The pairings of BodPod/Withers and Smith-Ryan/Withers were both found to be statistically significant when compared to DEXA %BF (p <.001). Both pairings were found to be statistically lower than DEXA %BF, indicating Smith-Wilson, et al. (2017) may be an acceptable substitution in a four-compartment model for the use of BV. However, no statisticaly significant difference was found between the Wilson/Withers pairing and the DEXA %BF (p =.280), which was not consistent with the fourth hypothesis. This result was anticipated as a likely possibility due 57
71 to the Wilson, et al. (2012) BV formula not being thoroughly tested. This formula may not be ready for use in a four-compartment model to test percent body fat. Wilson, et al. (2012) Concerns The Wilson, et al. (2012) formula was derived principally on scientific theory, based on previous density studies of body composition metrics but, while very sound in theory, it had not been thoroughly tested. This formula was preliminary work of an idea not previously created. However, it remained virtually untested, as it was created using known densities of body metrics and a thorough understanding of DEXA based measurements, but no traditional testing. The conformational study after the creation of the theoretical formula by Wilson, et al. (2012) consisted of only 11 subjects and the only data analysis conducted was a simple correlation. This formula had great promise but needed thorough study to verify the constants had real-world applications and consistency to applicable samples. This study was a significant beginning but needed more data to analyze the formula (that likely contributed to the variance shown in this study) that resulted in a body volume of 0.53 ± 0.89 L higher than the measured BodPod values. Smith-Ryan, et al. (2012) Concerns The Smith-Ryan, et al. (2017) formula originally had 127 subjects used to create the formula, but only 27 to cross-validate and 40 to verify reliability. Also, the mean age: 35.8 ± 9.4 years, which was 7.2 ± 3.1 higher than this study. This 58
72 age variance could account for the difference in body volume. As younger adults traditionally have approximately 7.5% less body fat at 28 than at 35 (St- Onge & Gallagher, 2010), the body volume would be lower at the same weight, as the density of lean muscle is kg/m 3 and the density of the fat tissue is kg/m 3 (Martin, Daniel, Drinkwater, & Clays, 1994). Also, the number of males and females was not reported separately. As men have higher lean mass and lower percent body fat on average than females, the distribution could be skewed due to one gender. In addition, the BMI distribution of the Smith-Ryan (2017) study was 19.9 to 45.6, allowing for morbidly obese subjects. It has been documented that in obese subjects, the BodPod error underestimates by 8.51% (Lowry & Tomiyama, 2015). Using this data to create the body volume formula would create a formula that was approximately equal near the normal BMI measured values, but the obese measurements would place additional erroneous low values in the data set and create a formula that would measure BV too high, as was the case in this research. Hypothesis Results After analyses among the hypotheses of this study, the results found: 1. The predicted body volume equations will be statistically equivalent to the measurements of BodPod. Evidence was found to accept. 2. The Ryan-Smith, et al. (2017) formula will have a smaller variation when compared to BodPod values then the Wilson, et al. (2012) formula. Evidence was found to accept. 59
73 3. Predicted body volume four-compartment modes will be statistically equivalent to the multi-system model. Evidence was found to reject this hypothesis. 4. There would be a statistical difference between DEXA measured body fat compared to the Withers, et al. (1998) formula and the Wang, et al. (2005) formulas, using both predicted and measured body volumes. Evidence was found to accept for Smith-Ryan, et al. (2017) and BodPod, but not for Wilson, et al. (2012). Formula Changes The mean difference between predicted body volume equations and measured BodPod body volume resulted in the predicted BV equations being unsuitable for use in a four-compartment model, creating a need to re-evaluate the formulas. The Smith-Ryan, et al. (2017) formula was selected to be adjusted due to it being the most current research and based from the previous research of Wilson, et al. (2012). Paired analysis between each subject s measured BodPod values and Smith-Ryan, et al. (2017) values were conducted and averaged. Median, mean, and mode were all evaluated. The constant was then adjusted and analyzed, comparing BodPod measured values to new predicted values, as well as new pairings utilizing the Withers, et al. (1998) and Wang, et al. (2005) formulas. The formula was modified from DEXA BV (L) = Fat / Lean / 1.03 BMC / and changed to DEXA BV (L) = Fat / Lean / 1.03 BMC / Statistical procedures were then 60
74 replicated for the new formula. Normality was first conducted yielding similar results as the previous formulas (Table 12). Table 12 - Doernte Normality Tests of Normality Kolmogorov-Smirnov Shapiro-Wilk Sig. Sig. BodPod Measured.200*.224 Doernte BV.200*.318 %BF BodPod/Withers.200*.188 %BF Doernte/Withers FM(kg) Bod Pod/Wang FM(kg) Doernte/Wang *. This is a lower bound of the true significance. Shaded regions fail to show normaility Descriptive statistics (Table 13) comparing the new formula to measured BodPod values yielded BodPod with a mean of ± L and the new formula with a mean of ± L. Table 13 Doernte Paired Sample Statistics Paired Samples Statistics Mean Std. Deviation Std. Error Mean N BodPod Measured Doernte BV A correlation (Table 14) was then conducted between measured BodPod values and the new modified formula yielding a correlation of indicating a very high correlation. 61
75 Table 14 Doernte Correlation N Correlation Sig. BodPod Measured & Doernte BV Paired samples t-test (Table 15) conducted between measured BodPod values and modified predicted BV yielded a difference of ± L (p = 0.998). Table 15 BodPod - Doernte Paired Differences Paired Samples Test BodPod Measured - Doernte BV Paired Differences 95% Mean Std. Deviation Lower Upper Sig. (2-tailed) A Wilcoxon signed rank test (Table 16) was then conducted between both Withers, et al. (1998) and Wang, et al. (2005) formulas, utilizing BodPod measured BV and reformulated predicted BV. There were no statistical differences in any formula between BodPod groups or reformulated groups. Table 16 Doernte Wilcoxon Signed-Rank Test Wilcoxon Signed Ranks Test %BF Doernte/Withers - BodPod/Withers FM(kg) Doernte/Wang - Bod Pod/Wang Z b b Asymp. Sig. (2-tailed) b. Based on positive ranks. 62
76 Descriptive data (Table 17) of both four-compartment models, utilizing measured BodPod values and reformulated predicted BV, were conducted and listed below. Table 17 Doernte Formula Descriptive Statistics Percentiles Descriptive Statistics N Mean Std. Deviation Minimum Maximum 25th 50th (Median) 75th %BF BodPod/Withers %BF Doernte/Withers FM(kg) Bod Pod/Wang FM(kg) Doernte/Wang Statistical analysis of the reformulated predicted body volume formula revealed it may be a better fit for use in four-compartment body composition models than the Wilson, et al. (2013) and Smith-Ryan, et al. (2017) formulas. Further studies would need to be conducted with repeated samples to evaluate the reformulated equation. Future Studies This study consisted of 90 participants, but out of that 90, only 18 were over the age of 40. Future subject populations should have more age variance. Future studies should also explore the creation of different formulas for various age groups to account for the changing body composition trends as subjects age. This study also had a subject bias of ethnicity being highly skewed toward European Americans. This could affect results by skewing bone density. 63
77 Research has shown that race has an effect on bone mineral content (BMC) (Peacock, et al., 2009) (Vásquez, Shaw, Gensburg, Okorodudu, & Corsino, 2013) (Ettinger, et al., 1997). Multiple formulas may also need to be conducted for various BMI groups of smaller ranges, instead of one universal formula. Previously sited research has shown that as BMI moves to underweight, measurements can be misrepresented by as much as 15% too high, while measuring 8.51% too low for the obese category (Lowry & Tomiyama, 2015). Further research should be conducted to compare the viability of a uniform formula versus the need for multiple formulas. Future studies should also consider a much larger sample size. This study had a sample size of 90 and Smith-Ryan, et al. (2017) had a sample of 127 subjects. While this was a large enough sample size to be significant and create a formula statistically equivalent to measured BodPod values, it may not be large enough to be accurate enough as a metric for body composition models. A much greater sample size may be needed before a formula is refined enough to be utilized in a four-compartment model. Further research should also examine body volume testing utilizing deuterium oxide and hydrostatic weighing. While research has found the BodPod to be statistically equivalent to underwater weighing, and in some cases argued to be the new standard, other research has found there are variances (Gibby, et al., 2017). This study has shown evidence that statistically equivalent body volume can still cause formula failure when utilized as compartment model metrics. Future studies should be conducted utilizing 64
78 underwater weighing for body volume measurements and re-evaluated against formulated body volumes. Conclusion The use of DEXA based body volume formulas is a viable replacement for other BV testing methodologies for use in four-compartment testing models. However, both the Wilson, et al. (2012) and Smith-Ryan, et al. (2017) formulas failed to be a viable replacement for measured BodPod values. A new formula, or multiple formulas, need to be developed before the predicted values are suitable for use in body composition formulas. 65
79 REFERENCES Berger, A. (2002). Bone Mineral Density Scans. British Medical Journal, 484. Brozek, J., Grande, F., Anderson, J., & Keys, A. (1963, Sept 26). Densitometric Analysis of Body Composition: Revision Of Some Quantitative Assumptions. Annals of the New York Academy of Sciences, Cefalu, W. T., Wang, Z. Q., Werbel, S., Bell-Farrow, A. D., Crouse, J. R., Hinson, W. H.,... Anderson, R. (1995). Contribution of visceral fat mass to the insulin resistance of aging. Metabolism-clinical and Experimental, 44(7), Centers for Disease Control and Prevention. (2017, August 29). Adult Obesity Causes & Consequences. Retrieved from cdc.gov. Chang, S.-H., Beason, T. S., Hunleth, J., & Colditz, G. A. (2012). A systematic review of body fat distribution and mortality in older people. Maturitas, 72(3), Dehghan, M., & Merchant, A. T. (2008). Is bioelectrical impedance accurate for use in large epidemiological studies. Nutrition Journal, 7(1), Després, J.-P., & Lemieux, I. (2006). Abdominal obesity and metabolic syndrome. Nature, 444(7121), Deurenberg-Yap, M., Schmidt, G., Staveren, W. A., Hautvast, J. G., & Deurenberg, P. (2001). Body fat measurement among Singaporean Chinese, Malays and Indians : a comparative study using a fourcompartment model and different two-compartment models. British Journal of Nutrition, 85(4), Duren, D. L., Sherwood, R. J., Czerwinski, S. A., Lee, M., Choh, A. C., Siervogel, R. M., & Chumlea, W. C. (2008). Body Composition Methods: Comparisons and Interpretation. Journal of diabetes science and technology, 2(6), Ettinger, B., Sidney, S., Cummings, S. R., Libanati, C., Bikle, D. D., Tekawa, I. S.,... Steiger, P. (1997). Racial differences in bone density between young adult black and white subjects persist after adjustment for anthropometric, lifestyle, and biochemical differences. The Journal of Clinical Endocrinology and Metabolism, 82(2), Fields, D. A., Goran, M. I., & McCrory, M. A. (2002). Body-composition assessment via air-displacement plethysmography in adults and children: a review. The American Journal of Clinical Nutrition, 75(3),
80 Gibby, J. T., Njeru, D. K., Cvetko, S. T., Heiny, E. L., Creer, A. R., & Gibby, W. A. (2017). Whole-Body Computed Tomography-Based Body Mass and Body Fat Quantification: A Comparison to Hydrostatic Weighing and Air Displacement Plethysmography. Journal of Computer Assisted Tomography, 41(2), Glickman, S. G., Marn, C. S., Supiano, M. A., & Dengel, D. R. (2004). Validity and reliability of dual-energy X-ray absorptiometry for the assessment of abdominal adiposity. Journal of Applied Physiology, 97(2), Gonçalves, E. M., Matias, C. N., Santos, D., Sardinha, L. B., & Silva, A. M. (2015). Assessment of total body water and its compartments in elite judo athletes: comparison of bioelectrical impedance spectroscopy with dilution techniques. Journal of Sports Sciences, 33(6), Grundy, S. M., Brewer, H. B., Cleeman, J. I., Smith, S. C., & Lenfant, C. (2004). Definition of Metabolic Syndrome Report of the National Heart, Lung, and Blood Institute/American Heart Association Conference on Scientific Issues Related to Definition. Circulation, 109(3), Hayashi, T., Boyko, E. J., Leonetti, D. L., McNeely, M. J., Newell-Morris, L., Kahn, S. E., & Fujimoto, W. Y. (2003). Visceral Adiposity and the Prevalence of Hypertension in Japanese Americans. Circulation, 108(14), Hicks, C. M. (2017). A Comparison of Body Composition Across Two Phases of the Menstrual Cycle Utilizing Dual-Energy X-Ray Absorptiometry, Air Displacement Plethysmography, and Bioelectrical Impedance Analysis. Int J Exerc Sci., 10(8): Higgins, K. J., Reid, P. M., Going, S. B., & Howell, W. H. (2007). Validation of bioimpedance spectroscopy to assess acute changes in hydration status. Medicine and Science in Sports and Exercise, 39(6), Isomaa, B., Almgren, P., Tuomi, T., Forsén, B., Lahti, K., Nissén, M.,... Groop, L. (2001). Cardiovascular Morbidity and Mortality Associated With the Metabolic Syndrome. Diabetes Care, 24(4), Jacob, A. N., Salinas, K., Adams-Huet, B., & Raskin, P. (2007). Weight gain in type 2 diabetes mellitus. Diabetes, Obesity and Metabolism, 9(3), Katch, F. I. (2013). Apparent Body Density and Variability during Underwater Weighing. Research Quarterly. American Association for Health, Physical Education and Recreation, 39(4),
81 Kopper, J., Bartz, M., Schultink, J., Lukito, W., & Deurenberg, P. (1998). Measurements of body fat in Indonesian adults: comparison between a three-compartment model and widely used methods. Asia Pacific Journal of Clinical Nutrition, 7(1), Kuk, J. L., Katzmarzyk, P. T., Nichaman, M. Z., Church, T. S., Blair, S. N., & Ross, R. (2006). Visceral fat is an independent predictor of all-cause mortality in men. Obesity, 14(2), Kuriyan, R., Thomas, T., Ashok, S., Jayakumar, J., & Kurpad, A. (2014, May). A 4-compartment model based validation of air displacement plethysmography, dual energy X-ray absorptiometry, skinfold technique & bio-electrical impedance for measuring body fat in Indian adults. Indian Journal of Medical Research, 139, Lohman, T. G., & Going, S. B. (1993). Multicomponent Models in Body Composition Research: Opportunities and Pitfalls. Human Body Composition. Basic Life Sciences, 60, Lowry, D. W., & Tomiyama, A. J. (2015). Air displacement plethysmography versus dual-energy x-ray absorptiometry in underweight, normal-weight, and overweight/obese individuals. PLOS ONE, 10(1). Lukaski, H. C., Johnson, P. E., Bolonchuk, W. W., & Lykken, G. I. (1985). Assessment of fat-free mass using bioelectrical impedance measurements of the human body. The American Journal of Clinical Nutrition, 41(4), Malik, S., Wong, N. D., Franklin, S. S., Kamath, T. V., L'Italien, G. J., Pio, J. R., & Williams, G. R. (2004). Impact of the Metabolic Syndrome on Mortality From Coronary Heart Disease, Cardiovascular Disease, and All Causes in United States Adults. Circulation, 110(10), Martin, A., Daniel, M., Drinkwater, D., & Clays, J. (1994, Feb). Adipose tissue density, estimated adipose lipid fraction and whole body adiposity in male cadavers. Int J Obes Relat Metab Disord., 18(2): McArdle, W. D., Katch, F. I., & Katch, V. L. (2011). Essentials of Exercise Physiology. Baltimore, Md: Lippincott Williams & Wilkins. McCrory, M. A., Molé, P. A., Gomez, T. D., Dewey, K. G., & Bernauer, E. M. (1998). Body composition by air-displacement plethysmography by using predicted and measured thoracic gas volumes. Journal of Applied Physiology, 84(4),
82 Millard-Stafford, M. L., Collins, M. A., Evans, E. M., Snow, T. K., Cureton, K. J., & Rosskopf, L. B. (2001). Use of air displacement plethysmography for estimating body fat in a four-component model. Medicine and Science in Sports and Exercise, 33(8), Moon, J. R., Stout, J. R., Walter, A. A., Smith, A. E., Stock, M. S., Herda, T. J.,... Esposito, E. N. (2011). Mechanical scale and load cell underwater weighing: a comparison of simultaneous measurements and the reliability of methods. Journal of Strength and Conditioning Research, 25(3), Morrison, J. A., Khoury, P. R., Campaigne, B. N., Chumlea, W. C., Specker, B., Campaign, B. N., & Guo, S. S. (1994). Body composition measures from underwater weighing and dual energy X-ray absorptiometry in black and white girls: a comparative study. American Journal of Human Biology, 6(4), Peacock, M., Buckwalter, K. A., Persohn, S., Hangartner, T. N., Econs, M. J., & Hui, S. L. (2009). Race and sex differences in bone mineral density and geometry at the femur. Bone, 45(2), Pescatello, L. S. (2014). ACSM's guidelines for exercise testing and prescription (9th ed.). Philadelphia: Wolters Kluwer/Lippincott Williams & Wilkins Health. Peterson, J. T., Repovich, W. E., & Parascand, C. R. (2011). "Accuracy of Consumer Grade BIA Devices" by Janet T. Int J Exerc Sci, 4(3), Ploeg, G. E., Withers, R. T., & Laforgia, J. (2003). Percent body fat via DEXA: comparison with a four-compartment model. Journal of Applied Physiology, 94(2), Powers, J. S., Choi,, L., Bitting, R., Gupta, N., & Buchowski, M. (2009). Rapid Measurement of Total Body Water to Facilitate Clinical Decision Making in Hospitalized Elderly Patients. J Gerontol A Biol Sci Med Sci., un; 64A(6): Rallison, L., Kushner, R., Penn, D., & Schoeller, D. A. (1993). Errors in estimating peritoneal fluid by bioelectrical impedance analysis and total body electrical conductivity. Journal of The American College of Nutrition, 12(1), Segal, K., Burastero, S., Chun, A., Coronel, P., Pierson, R. N., & Wang, J. (1991). Estimation of extracellular and total body water by multiplefrequency bioelectrical-impedance measurement. The American Journal of Clinical Nutrition, 54(1),
83 Siervo, M., & Jebb, S. A. (2010). Body Composition Assessment: Theory into Practice: Introduction of Multicompartment Models. IEEE Engineering in Medicine and Biology Magazine, 29(1), Smith-Ryan, A. E., Mock, M. G., Ryan, E. D., Gerstner, G. R., Trexler, E. T., & Hirsch, K. R. (2017). Validity and reliability of a 4-compartment body composition model using dual energy x-ray absorptiometry-derived body volume. Clinical Nutrition, 36(3), Sommerfield, L. M., McAnulty, S. R., McBride, J. M., Zwetsloot, J. J., Austin, M. D., Mehlhorn, J. D., Utter, A. C. (2016). Validity of Urine Specific Gravity when Compared to Plasma Osmolality as a Measure of Hydration Status in Male and Female NCAA Collegiate Athletes. J Strength Cond Res., Aug; 30(8): Steinberger, J., & Daniels, S. R. (2003). Obesity, Insulin Resistance, Diabetes, and Cardiovascular Risk in Children An American Heart Association Scientific Statement From the Atherosclerosis, Hypertension, and Obesity in the Young Committee (Council on Cardiovascular Disease in the Young) and the Diabetes Committee (Council on Nutrition, Physical Activity, and Metabolism). American Heart Association, 107(10), St-Onge, M.-P., & Gallagher, D. (2010). Body composition changes with aging: The cause or the result of alterations in metabolic rate and macronutrient oxidation? Nutrition, 26(2), Tegenkamp, M. H., Clark, R. R., Schoeller, D. A., & Landry, G. L. (2011). Effects of Covert Subject Actions on Percent Body Fat by Air- Displacement Plethsymography. Journal of Strength and Conditioning Research, 25(7), Tinsley, G. M. (2017). Reliability and agreement between DXA-derived body volumes and their usage in 4-compartment body composition models produced from DXA and BIA values. Journal of Sports Sciences, 1-6. Utter, A. C., Goss, F. L., Swan, P. D., Harris, G. S., Robertson, R. J., & Trone, G. A. (2003). Evaluation of air displacement for assessing body composition of collegiate wrestlers. Medicine and Science in Sports and Exercise, 35(3), Vásquez, E., Shaw, B. A., Gensburg, L., Okorodudu, D., & Corsino, L. (2013). Racial and ethnic differences in physical activity and bone density: National Health and Nutrition Examination Survey, Preventing Chronic Disease,
84 Vergara, F. V., Bustos, E. D., Marqués, L. L., Flores, L. V., Gonzalez, A. A., & Argote, R. B. (2014). The four-compartment model of body composition in obese Chilean schoolchildren, by pubertal stage: Comparison with simpler models. Nutrition, 30(3), Veronica, G., & Esther, R.-R. M. (2012). Aging, metabolic syndrome and the heart. Aging and Disease, 3(3), Wagner, D. R. (2015). Predicted versus measured thoracic gas volumes of collegiate athletes made by the BOD POD air displacement plethysmography system. Applied Physiology, Nutrition, and Metabolism, 40(10), Wang, T. J., & Vasan, R. S. (2005). Epidemiology of Uncontrolled Hypertension in the United States. Circulation, 112(11), Wang, Z., Shen, W., Withers, R., & Heymsfield, S. (2005). Multicompartment molecular-level models of body composition analysis. Human Body Composition. Wattanapenpaiboon, N., Lukito, W., Strauss, B. J., Hsu-Hage, B.-H., Wahlqvist, M. L., & Stroud, D. B. (1998). Agreement of skinfold measurement and bioelectrical impedance analysis (BIA) methods with dual energy X-ray absorptiometry (DEXA) in estimating total body fat in Anglo-Celtic Australians. International Journal of Obesity, 22(9), Wilson, J. P., Strauss, B. J., Fan, B., Duewer, F. W., & Shepherd, J. A. (2013, January 30). Improved 4-compartment body-composition model for a clinically accessible measure of total body protein. The American Journal of Clinical Nutrition. Wilson, J., Mulligan, K., Fan, B., Sherman, J., Murphy, E., Tai, V. W.,... Shepherd, J. A. (2012). Dual-energy X-ray absorptiometry based body volume measurement for 4-compartment body composition. The American Journal of Clinical Nutrition, 95(1), Withers, R. T., LaForgia, J., Pillans, R. K., Shipp, N. J., Chatterton, B. E., Schultz, C. G., & Leaney, F. (1998). Comparisons of two-, three-, and four-compartment models of body composition analysis in men and women. Journal of Applied Physiology, 85(1), Zamora, B. S., Jakicic, J. M., Hortobágyi, T., & O'brien, K. F. (1995). Number of trials of underwater weighing necessary to estimate percent body fat. Sports Medicine, Training and Rehabilitation, 5(4),
85 APPENDICES 72
86 APPENDIX A: DEXA Consent 73
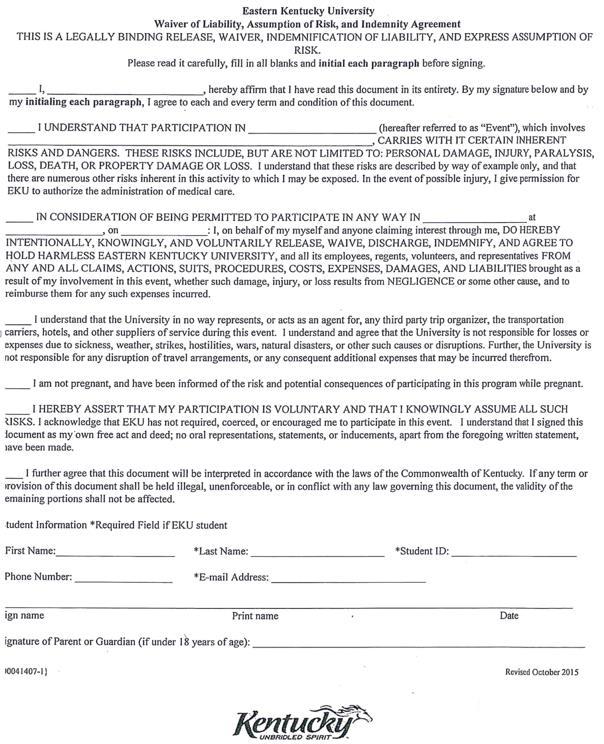
87 74
88 APPENDIX B: Informed Consent 75
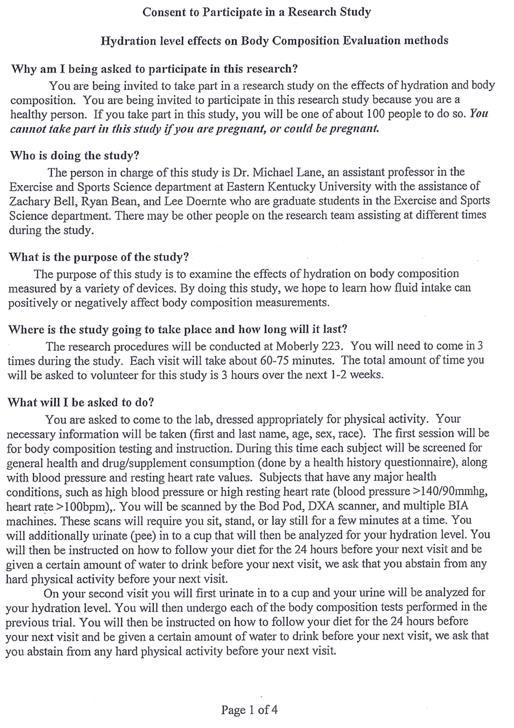
89 76
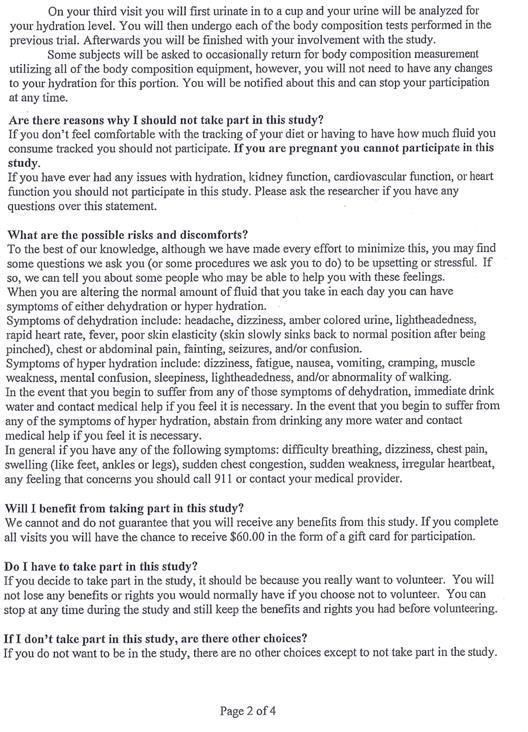
90 77

91 78
92 79
93 APPENDIX C: Subject History 80

94 81
95 82
96 83
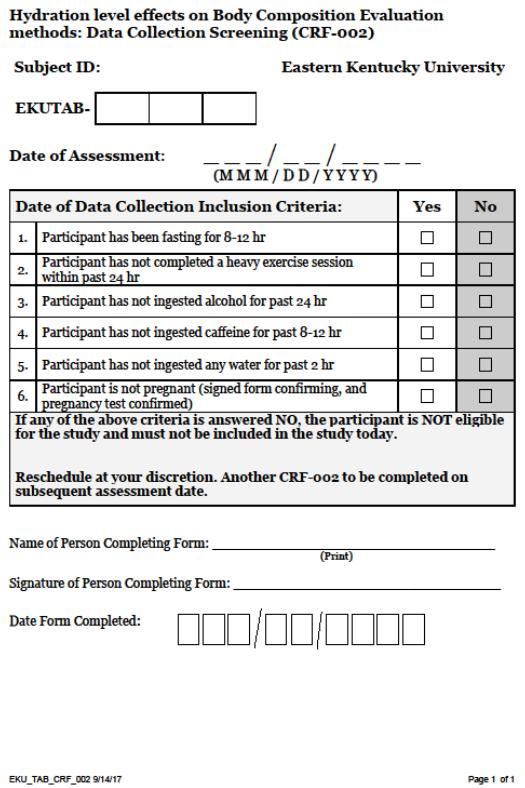
97 84
98 85
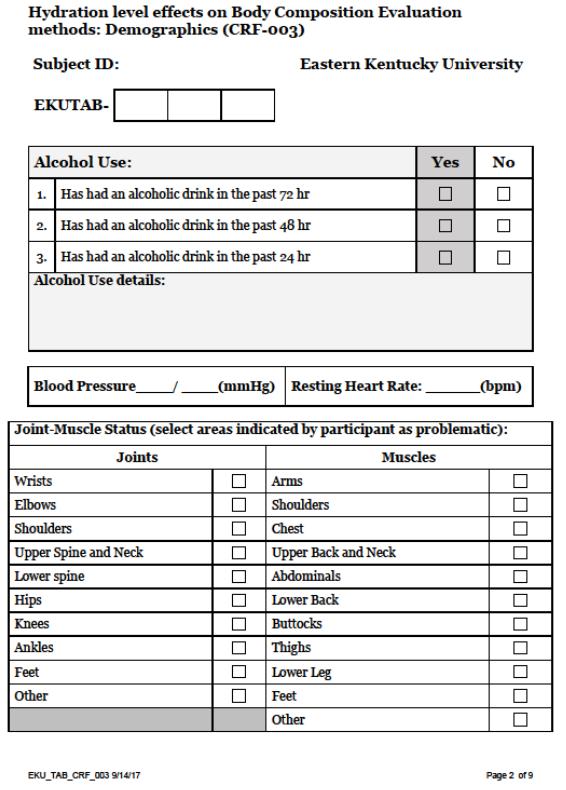
99 86
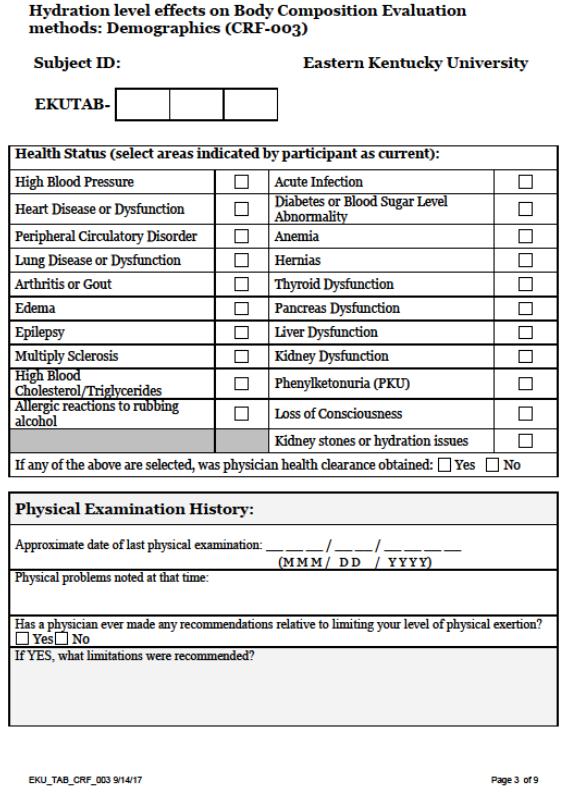
100 87
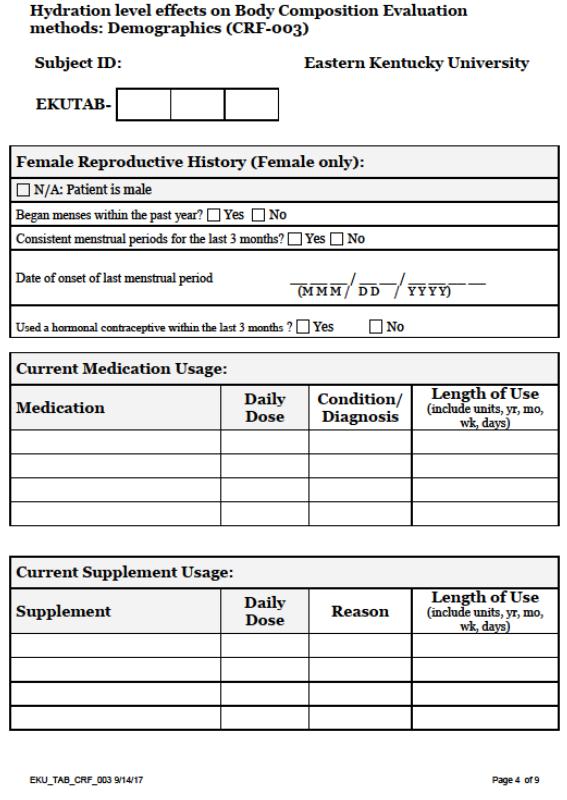
101 88
102 89
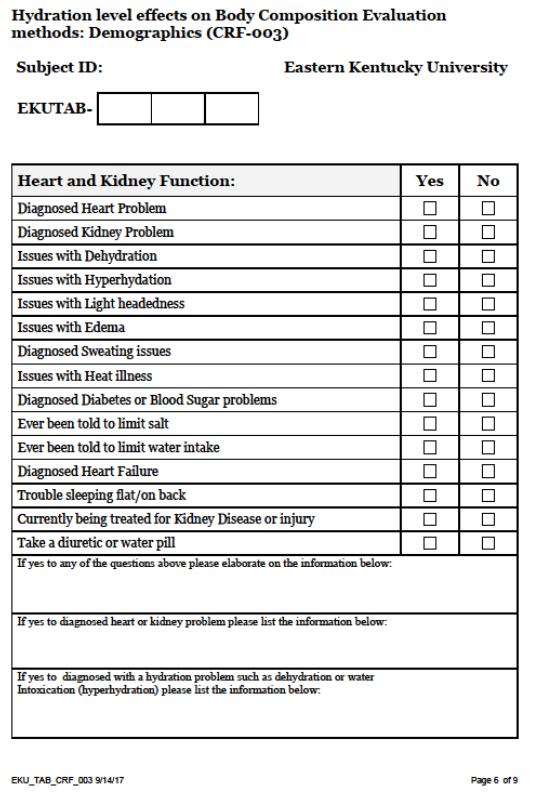
103 90
104 91
105 92
106 93
107 APPENDIX D: Data Collection 94
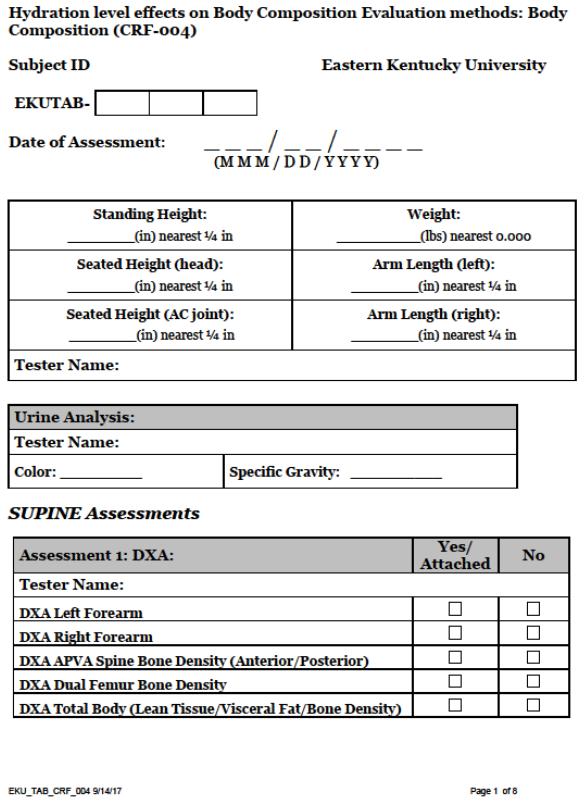
108 95
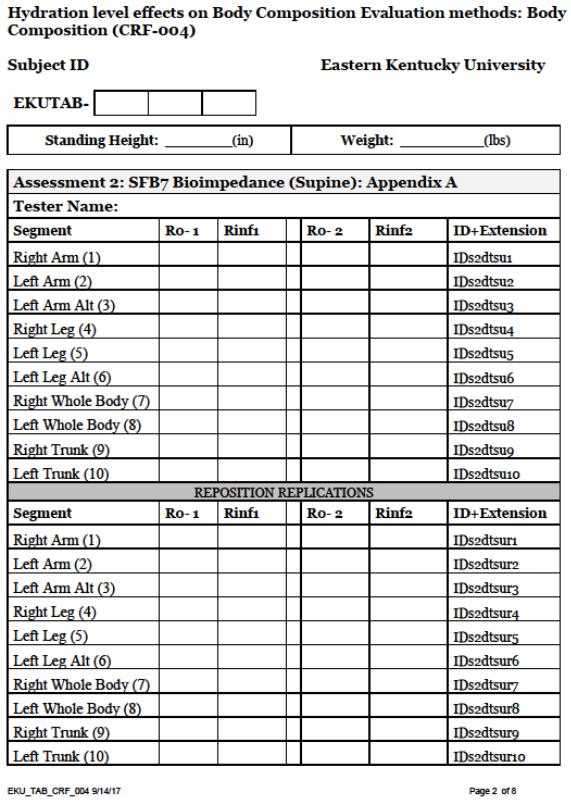
109 96
110 97
111 98
112 99
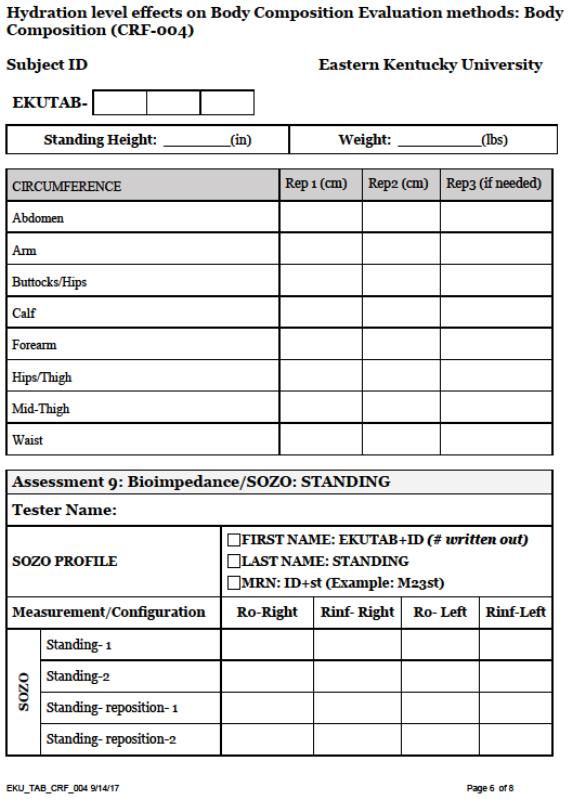
113 100
Adult BMI Calculator
 For more information go to Center for Disease Control http://search.cdc.gov/search?query=bmi+adult&utf8=%e2%9c%93&affiliate=cdc-main\ About BMI for Adults Adult BMI Calculator On this page: What is BMI?
Note that metric units are used in the calculation of BMI. The following imperial-metric conversions are required:
 Body Composition Body Composition: Assessment and Interpretation Body composition has great practical and functional significance for many of us: scientists, clinicians and the general population. It can
Chapter 17: Body Composition Status and Assessment
 Chapter 17: Body Composition Status and Assessment American College of Sports Medicine. (2010). ACSM's resource manual for guidelines for exercise testing and prescription (6th ed.). New York: Lippincott,
Understanding Body Composition
 Understanding Body Composition Chapter 7 Body Composition n Body composition is the ratio between fat and fat-free mass n Fat-free mass includes all tissues exclusive of fat (muscle, bone, organs, fluids)
Module 2: Metabolic Syndrome & Sarcopenia. Lori Kennedy Inc & Beyond
 Module 2: Metabolic Syndrome & Sarcopenia 1 What You Will Learn Sarcopenia Metabolic Syndrome 2 Sarcopenia Term utilized to define the loss of muscle mass and strength that occurs with aging Progressive
What Is Body Composition?
 Chapter Six What Is Body Composition? Body composition is the body s relative amounts of fat mass and fat-free mass Body fat includes two categories: Essential fat is crucial for normal body functioning
Overview of the FITNESSGRAM Body Composition Standards
 body composition Body composition refers to the division of total body weight (mass) into components, most commonly fat mass and fat-free mass. The proportion of total body weight that is fat (referred
FAT MASS ESTIMATION BY BIOELECTRICAL IMPEDANCE ANALYSIS
 FAT MASS ESTIMATION BY BIOELECTRICAL IMPEDANCE ANALYSIS FAT MASS ESTIMATION BY BIOELECTRICAL IMPEDANCE ANALYSIS Epidemiological studies have shown that relative risk of diabetes and cardiovascular diseases
Fitness Nutrition Coach. Part IV - Assessing Nutritional Needs
 Part IV - Assessing Nutritional Needs 62 For the FNC, a nutrition assessment provides information on your client s diet quality and awareness about nutrient information. Clients should be encouraged to
C H A P T E R 14 BODY WEIGHT, BODY COMPOSITION, AND SPORT
 C H A P T E R 14 BODY WEIGHT, BODY COMPOSITION, AND SPORT Learning Objectives Differentiate among body build, body size, and body composition. Find out what tissues of the body constitute fat-free mass.
Body Composition. Lecture Overview. Measuring of Body Composition. Powers & Howely pp Methods of measuring body composition
 Body Composition Powers & Howely pp 344-356 Lecture Overview Methods of measuring body composition Two-component system Body fatness for health & fitness Obesity and weight control Diet, exercise, and
There are 4 user settings that store the memory of personal parameters for ease of continued use.
 INTRODUCTION Thank you for choosing the Healthy Balance Electronic Body Fat Scale. For proper usage of this device please read the following instructions carefully. Using the latest BIA (Bioelectrical
BODY MASS INDEX AND BODY FAT CONTENT IN ELITE ATHLETES. Abstract. Introduction. Volume 3, No. 2, 2011, UDC :572.
 EXERCISE AND QUALITY OF LIFE Volume 3, No. 2, 2011, 43-48 UDC 796.034.6-051:572.087 Research article BODY MASS INDEX AND BODY FAT CONTENT IN ELITE ATHLETES Jelena Popadiã Gaãeša *, Otto Barak, Dea Karaba
Understanding Body Composition
 PowerPoint Lecture Outlines 7 Understanding Body Composition Objectives Define body composition. Explain why the assessment of body size, shape, and composition is useful. Explain how to perform assessments
The physical educator s role is evolving into that of a teacher who is well educated
 Assessment and Interpretation of Body Composition in Physical Education PAT VEHRS RON HAGER Should you use skinfolds, bio-electrical impedence, or BMI? The physical educator s role is evolving into that
Lecture 7 Body Composition Lecture 7 1. What is Body Composition? 2. Healthy Body Weight 3. Body Fat Distribution 4. What Affects Weight Gain?
 Lecture 7 Body Composition 1 Lecture 7 1. What is Body Composition? 2. Healthy Body Weight 3. Body Fat Distribution 4. What Affects Weight Gain? 2 1 Body Composition Relative amounts of fat and fat-free
ESPEN Congress The Hague 2017
 ESPEN Congress The Hague 2017 Paediatric specificities of nutritional assessment Body composition measurement in children N. Mehta (US) 39 th ESPEN Congress The Hague, Netherlands Body Composition Measurement
Body Mass Insanity. sources, obesity has been categorized as the epidemic Americans are facing at an accelerated
 Hildebrand 1 Marshane Hildebrand Professor Jeff Moulton Engl 2010-014 26 March 2013 Report Rough Draft Body Mass Insanity According to reports that have been circulated around the internet and other news
Duncan Macfarlane IHP, HKU Parts of this lecture were based on lecture notes provided by the Lindsay Carter Anthropometric Archive, AUT, NZ
 Body composition assessment issues in athletes 1 Duncan Macfarlane IHP, HKU Parts of this lecture were based on lecture notes provided by the Lindsay Carter Anthropometric Archive, AUT, NZ LEARNING OUTCOMES:
Table of Contents. Introduction. 1. Diverse Weighing scale models. 2. What to look for while buying a weighing scale. 3. Digital scale buying tips
 Table of Contents Introduction 1. Diverse Weighing scale models 2. What to look for while buying a weighing scale 3. Digital scale buying tips 4. Body fat scales 5. Is BMI the right way to monitor your
1. Frequently asked questions
 1. Frequently asked questions Q. How is BMR calculated by boditrax composition monitors? The electrical signals do not directly measure BMR. They measure electrical impedance, and from this, the weight
Lecture 7 Body Composition Lecture 7 1. What is Body Composition? 2. Healthy Body Weight 3. Body Fat Distribution 4. What Affects Weight Gain?
 Lecture 7 Body Composition 1 Lecture 7 1. What is Body Composition? 2. Healthy Body Weight 3. Body Fat Distribution 4. What Affects Weight Gain? 2 1 Body Composition Relative amounts of fat and fat-free
Activity Overview. Bottle Bodies: Measuring Body Fat Activity 3A. Corpulosity. Activity Objectives: Activity Description: Activity Background:
 Bottle Bodies: Measuring Body Fat Activity 3A Activity Objectives: Working with bottles, clay, and wax to represent human body composition, students will be able to: measure height, weight, circumference
Clinical Guidelines for the Hospitalized Adult Patient with Obesity
 Clinical Guidelines for the Hospitalized Adult Patient with Obesity 1 Definition of obesity: Obesity is characterized by an excess storage of adipose tissue that is related to an imbalance between energy
Sports Performance 15. Section 3.2: Body Composition
 Sports Performance 15 Section 3.2: Body Composition The relative percentage of muscle, fat, bone and other tissue in the body Our primary concern in this unit is body fatness and how it pertains to athletic
BMI. Summary: Chapter 7: Body Weight and Body Composition. Obesity Trends
 Chapter 7: Body Weight and Body Composition Obesity Trends What Is a Healthy Body Weight? There is no ideal body weight for each person, but there are ranges for a healthy body weight A healthy body weight
Fitness Concepts + Principles Packet. Name: Period:
 Fitness Concepts + Principles Packet Name: Period: Content Pages + Directions 5 Components of Fitness.................................................... Slides 3-12 FITT Principle.........................................................
Energy Balance and Weight Management: Finding Your Equilibrium
 Chapter 9 Energy Balance and Weight Management: Finding Your Equilibrium Key Terms 1. appetite: A psychological desire to eat that is related to the pleasant sensations often associated with food. 2. extreme
Premium solution for your health
 770 Premium solution for your health See What You re Made of Reveal the efficiency of your consultation throughout the InBody Test The InBody Test clearly visualize internal change of the body. Weight
Copyright is owned by the Author of the thesis. Permission is given for a copy to be downloaded by an individual for the purpose of research and
 Copyright is owned by the Author of the thesis. Permission is given for a copy to be downloaded by an individual for the purpose of research and private study only. The thesis may not be reproduced elsewhere
Manipulating Pretesting Conditions for Measuring Body Composition Using the BodPod and Bioelectrical Impedance AN HONORS THESIS (HONR 499)
") Manipulating Pretesting Conditions for Measuring Body Composition Using the BodPod and Bioelectrical Impedance AN HONORS THESIS (HONR 499) Jenna Elwert Thesis Advisor Paul Nagelkirk Signed Ball State University
Manipulating Pretesting Conditions for Measuring Body Composition Using the BodPod and Bioelectrical Impedance AN HONORS THESIS (HONR 499) Jenna Elwert Thesis Advisor Paul Nagelkirk Signed Ball State University
Body composition A tool for nutritional assessment
 Body composition A tool for nutritional assessment Ingvar Bosaeus Clinical Nutrition Unit Sahlgrenska University Hospital NSKE Oslo 2012-01-18 Outline What is body composition? What is nutritional assessment?
Body Weight and Body Composition
 Body Weight and Body Composition Chapter 7 Obesity Trends What Is a Healthy Body Weight? There is no ideal body weight for each person, but there are ranges for a healthy body weight A healthy body weight
COMPARISON OF BODY COMPOSITION ASSESSMENT IN WOMEN USING SKINFOLD THICKNESS EQUATIONS, BIOELECTRICAL IMPEDANCE ANALYSIS AND UNDERWATER WEIGHING
 STUDIES IN PHYSICAL CULTURE AND TOURISM Vol. 17, No. 3, 2010 EFTEKHAR MOHAMMADI, SAEID SHAKERIAN Faculty of Physical Education & Sports Science, Shahid Chamran University, Iran COMPARISON OF BODY COMPOSITION
Lecture 6 Fitness Fitness 1. What is Fitness? 2. Cardiorespiratory Fitness 3. Muscular Fitness 4. Flexibility 5. Body Composition
 Lecture 6 Fitness 1 Fitness 1. What is Fitness? 2. Cardiorespiratory Fitness 3. Muscular Fitness 4. Flexibility 5. Body Composition 2 1 Americans (on average) are not a healthy bunch 3 Sitting is the new
RESULTS SHEET BREAKDOWN
 SAMPLE RESULTS SHEET This is the body composition results sheet that the InBody 270 prints out. Understand each output secion in the following pages. 6 BODY COMPOSITION ANALYSIS Body Composition Analysis
Evaluation and Validation of BODPOD Body Scan Method as Compared to DEXA, Effect of Calcium and Caloric Intake in Female Collegiate Track Athletes
 Utah State University DigitalCommons@USU Undergraduate Honors Theses Honors Program 5-2010 Evaluation and Validation of BODPOD Body Scan Method as Compared to DEXA, Effect of Calcium and Caloric Intake
Whole Body Dual X-Ray Absorptiometry to Determine Body Composition
 Page: 1 of 6 Last Review Status/Date: March 2015 Determine Body Composition Description Using low dose x-rays of two different energy levels, whole body dual x-ray absorptiometry (DXA) measures lean tissue
Understanding & Interpreting Body Composition Measures
 BODY COMPOSITION Understanding & Interpreting Body Composition Measures Body composition = component of health-related fitness & = component of metabolic fitness Unlike other health-related fitness Not
PROFESSIONAL FITNESS & WELLBEING CATALOGUE
 PROFESSIONAL FITNESS & WELLBEING CATALOGUE CONTENTS BENEFITS OF BODY COMPOSITION GOOD, BETTER, BEST TANITA BIA TECHNOLOGY MULTI FREQUENCY BODY COMPOSITION ANALYSER BODY COMPOSITION ANALYSERS WEIGHING SCALES
PINELLAS HIGHLIGHTS DIET & EXERCISE
 PINELLAS HIGHLIGHTS DIET & EXERCISE DIET & EXERCISE Diet is not simply a matter of discipline. Access and the ability to afford healthy food play a role in food selection. Without enough income or proper
Segmental Body Composition Assessment for Obese Japanese Adults by Single-Frequency Bioelectrical Impedance Analysis with 8-point Contact Electrodes
 Segmental Body Composition Assessment for Obese Japanese Adults by Single-Frequency Bioelectrical Impedance Analysis with 8-point Contact Electrodes Susumu Sato 1), Shinichi Demura 2), Tamotsu Kitabayashi
BODY COMPOSITION COMPARISON: BIOELECTRIC IMPEDANCE ANALYSIS WITH DXA IN ADULT ATHLETES
 BODY COMPOSITION COMPARISON: BIOELECTRIC IMPEDANCE ANALYSIS WITH DXA IN ADULT ATHLETES A Thesis Presented to the Faculty of the Graduate School University of Missouri In Partial Fulfillment of the Requirements
CHAPTER 9. Anthropometry and Body Composition
 CHAPTER 9 Anthropometry and Body Composition 9.1 INTRODUCTION Ageing is characterized by reduction in fat free mass (FFM), primarily via loss of muscle mass, loss of bone mineral in women, redistribution
BODY COMPOSITION: AN ANALYSIS BETWEEN THE FOOTBALLER AND THANG-TA PRACTITIONER OF MANIPUR
 BODY COMPOSITION: AN ANALYSIS BETWEEN THE FOOTBALLER AND THANG-TA PRACTITIONER OF MANIPUR T. INAOBI SINGH 1, MAIBAM CHOURJIT SINGH 2, CHETAN MAIBAM 3 1 Department of Physical Education & Sports Science,
OBESITY: The Growing Epidemic and its Medical Impact
 OBESITY: The Growing Epidemic and its Medical Impact Ray Plodkowski, MD Co-Chief, Chief, of Division of Medical Nutrition, University of Nevada School of Medicine. Chief, Endocrinology & Metabolism, Sachiko
Comparison of Body Composition Assessment Techniques in Older Adults
 University of Tennessee, Knoxville Trace: Tennessee Research and Creative Exchange Masters Theses Graduate School 8-2005 Comparison of Body Composition Assessment Techniques in Older Adults Rebekah Ann
Measurement of total body water using 2 H dilution: impact of different calculations for determining body fat
 British Journal of Nutrition (2002), 88, 325 329 q The Authors 2002 DOI: 10.1079/BJN2002654 Measurement of total body water using 2 H dilution: impact of different calculations for determining body fat
Lean Body Mass and Muscle Mass What's the Difference?
 Lean Body Mass and Muscle Mass What's the Difference? PUBLISHED ON SEPTEMBER 24, 2015 BY RYAN WALTERS Consider the following three statements: I m not trying to get huge; I just want to put on five pounds
Know Your Numbers. The Life Saving Numbers You Need To Know
 Know Your Numbers The Life Saving Numbers You Need To Know Take Charge of Your! You may have heard that you need to Know Your Numbers, which refers to key markers of heart health like blood pressure, waist
Development of Bio-impedance Analyzer (BIA) for Body Fat Calculation
 for Body Fat Calculation") IOP Conference Series: Materials Science and Engineering PAPER OPEN ACCESS Development of Bio-impedance Analyzer (BIA) for Body Fat Calculation Recent citations - Munawar A Riyadi et al To cite this article:
IOP Conference Series: Materials Science and Engineering PAPER OPEN ACCESS Development of Bio-impedance Analyzer (BIA) for Body Fat Calculation Recent citations - Munawar A Riyadi et al To cite this article:
Competitor Series. Body Composition Analyzers
 Competitor Series Body Composition Analyzers Right Arm Bringing it All Together. Giving You the Advantage. Right Leg Trunk Left Arm Rice Lake s Competitor Series body composition analyzers (BCA) are designed
Body Composition. Sport Books Publisher 1
 Body Composition Sport Books Publisher 1 The body composition The body composition is affected by the proportions of the body component (bones, muscles, and other tissues) It can be seen that the major
Evaluation of body fat in fatter and leaner 10-y-old African American and white children: the Baton Rouge Children s Study 1 3
 Original Research Communications Evaluation of body fat in fatter and leaner 10-y-old African American and white children: the Baton Rouge Children s Study 1 3 George A Bray, James P DeLany, David W Harsha,
Sports Nutrition Care Manual Available Fall 2011
 Sports Nutrition Care Manual Available Fall 2011 View the SNCM demo site: http://sports.adancm.com/demo/sports.cfm Features: Research-based nutrition information written by authors who are Board Certified
THE NEW YOU: HOW TO DETERMINE YOUR PERCENT OF BODY FAT & IDEAL WEIGHT
 SESSION IV THE NEW YOU: HOW TO DETERMINE YOUR PERCENT OF BODY FAT & IDEAL WEIGHT OBJECTIVES BACKGROUND Compute your approximate percentage of body fat. Determine your goal weight. Calculate how long it
COMPARISON OF AIR DISPLACEMENT PLETHYSMOGRAPHY TO HYDROSTATIC WEIGHING FOR ESTIMATING TOTAL BODY DENSITY IN CHILDREN
 COMPARISON OF AIR DISPLACEMENT PLETHYSMOGRAPHY TO HYDROSTATIC WEIGHING FOR ESTIMATING TOTAL BODY DENSITY IN CHILDREN Geo Claros 1, Holly R Hull 1, and David A Fields 1,2 * 1 Department of Health and Exercise
This is a digitised version of a dissertation submitted to the University of Bedfordshire. It is available to view only.
 Title The Validity of Two Compartment Model Methods of Body Composition as Compared to Magnetic Resonance Imaging in Asian Indian Versus Caucasian Males Name Ben Davies This is a digitised version of a
Dangers of Being Overweight and Underweight
 Health Services: Unit 5 Chest and Abs 5.4 Body Composition and Diabetes Combination of percentage body fat and lean body tissue (muscle) Essential Fat Non- Essential Fat Dangers of Being Overweight and
Bioimpedance in medicine: Measuring hydration influence
 Journal of Physics: Conference Series Bioimpedance in medicine: Measuring hydration influence To cite this article: J Hlubik et al 0 J. Phys.: Conf. Ser. 0 View the article online for updates and enhancements.
Validation Study of Multi-Frequency Bioelectrical Impedance with Dual-Energy X-ray Absorptiometry Among Obese Patients
 OBES SURG (2014) 24:1476 1480 DOI 10.1007/s11695-014-1190-5 OTHER Validation Study of Multi-Frequency Bioelectrical Impedance with Dual-Energy X-ray Absorptiometry Among Obese Patients Silvia L. Faria
Obesity and Breast Cancer Risk
 Program on Breast Cancer Environmental Risk Factors Fact Sheet #56 August 2007 TOPICS Measurement of obesity BMI and breast cancer risk Weight gain and loss and breast cancer risk Body fat distribution
DEXA Bone Mineral Density Tests and Body Composition Analysis Information for Health Professionals
 DEXA Bone Mineral Density Tests and Body Composition Analysis Information for Health Professionals PERFORMANCE DEXA is an advanced technology originally used to, and still capable of assessing bone health
Validity of the Body Mass Index for Estimating Body Composition for Young Adults with. Intellectual Disabilities. Mary Ware
 Running Head: VALIDITY OF A NEW TEST ITEM 1 Validity of the Body Mass Index for Estimating Body Composition for Young Adults with Intellectual Disabilities Mary Ware Western Michigan University Mary Ware
IMPACT OF SELECTED MINOR GAMES ON PHYSIOLOGICAL FACTORS AND RELATIONSHIP BETWEEN OBESITY; AMONG SCHOOL STUDENTS
 184 IMPACT OF SELECTED MINOR GAMES ON PHYSIOLOGICAL FACTORS AND RELATIONSHIP BETWEEN OBESITY; AMONG SCHOOL STUDENTS INTRODUCTION PRADEEP.C.S*; AJEESH.P.T**; ARUN.C.NAIR*** *Lecturer in Physical Education,
Body Composition. Chapters 18 and 23
 Body Composition Chapters 18 and 23 Somatotype (Body Type) Soft roundness? endormorphy High muscle mass? mesomorphy Linearity and fragility? ectomorphy Body Composition Methods Height Weight Tables e.g.
EVALUATION OF BODY COMPOSITION IN OVERWEIGHT AND OBESE SUBJECTS: THREE-COMPARTMENT MODEL AND ULTRASOUND COMPARISONS. Sarah Nicole Fultz
 EVALUATION OF BODY COMPOSITION IN OVERWEIGHT AND OBESE SUBJECTS: THREE-COMPARTMENT MODEL AND ULTRASOUND COMPARISONS Sarah Nicole Fultz A thesis submitted to the faculty of the University of North Carolina
Professional Diploma. in Nutrition. Module 1. Lesson 1: Health is Your Wealth EQF Level 5. Professional Diploma
 Professional Diploma in Nutrition Module 1 Lesson 1: Health is Your Wealth EQF Level 5 Professional Diploma What is Anthropometry? External measurement of body composition Tells you how much of your weight
Effective Interventions in the Clinical Setting: Engaging and Empowering Patients. Michael J. Bloch, M.D. Doina Kulick, M.D.
 Effective Interventions in the Clinical Setting: Engaging and Empowering Patients Michael J. Bloch, M.D. Doina Kulick, M.D. UNIVERSITY OF NEVADA SCHOOL of MEDICINE Sept. 8, 2011 Reality check: What could
Pediatric obesity: the complexities of current definitions and measurement tools in children age 5 to 19 years
 Boston University OpenBU Theses & Dissertations http://open.bu.edu Boston University Theses & Dissertations 2014 Pediatric obesity: the complexities of current definitions and measurement tools in children
Broadening Course YPHY0001 Practical Session III (March 19, 2008) Assessment of Body Fat
 Assessment of Body Fat") Sheng HP - 1 Broadening Course YPHY0001 Practical Session III (March 19, 2008) Assessment of Body Fat REQUIRED FOR THIS PRACTICAL SESSION: 1. Please wear short-sleeve shirts / blouses. Shirts / blouses
Sheng HP - 1 Broadening Course YPHY0001 Practical Session III (March 19, 2008) Assessment of Body Fat REQUIRED FOR THIS PRACTICAL SESSION: 1. Please wear short-sleeve shirts / blouses. Shirts / blouses
9/26/2018. Andy Weiler, M.Ed. September 26 th, 2018
 Andy Weiler, M.Ed. September 26 th, 2018 1 2 Stay tuned for the answer to our riddle Riddle #2 3 Riddle #2 Riddle #2 4 Riddle #2 The answer: 50%/50% chance to be right Fluids: blood volume, body water,
Bioelectrical impedance analysis to assess body composition in obese adult women: The effect of ethnicity
 International Journal of Obesity (1998) 22, 243±249 ß 1998 Stockton Press All rights reserved 0307±0565/98 $12.00 Bioelectrical impedance analysis to assess body composition in obese adult women: The effect
 Page 7 of 18 with the reference population from which the standard table is derived. The percentage of fat equals the circumference of the right upper arm and abdomen minus the right forearm (in centimeters)
BODY SCAN REPORT YOUR RESULTS SAMPLE - BODY FAT - LEAN MUSCLE - TOTAL BODY WATER - EXTRA-CELLULAR WATER - INTRA-CELLULAR WATER - METABOLIC RATE
 BODY SCAN REPORT YOUR RESULTS SAMPLE - BODY FAT - LEAN MUSCLE - TOTAL BODY WATER - EXTRA-CELLULAR WATER - INTRA-CELLULAR WATER - METABOLIC RATE Your Results - Explained Thank you for choosing to have an
The Bone Wellness Centre - Specialists in DEXA Scanning 855 Broadview Avenue Suite # 305 Toronto, Ontario M4K 3Z1
 The Bone Wellness Centre - Specialists in DEXA Scanning 855 Broadview Avenue Suite # 305 Toronto, Ontario M4K 3Z1 Patient: Birth Date: 48.2 years Height / Weight: 150.0 cm 72.0 kg Sex / Ethnic: Female
The Bone Wellness Centre - Specialists in DEXA Scanning 855 Broadview Avenue Suite # 305 Toronto, Ontario M4K 3Z1
 The Bone Wellness Centre - Specialists in DEXA Scanning 855 Broadview Avenue Suite # 305 Toronto, Ontario M4K 3Z1 Patient: Birth Date: 43.4 years Height / Weight: 170.0 cm 66.0 kg Sex / Ethnic: Female
Broadening Course YPHY0001 Practical Session II (October 11, 2006) Assessment of Body Fat
 Assessment of Body Fat") Sheng HP - 1 Broadening Course YPHY0001 Practical Session II (October 11, 2006) Assessment of Body Fat REQUIRED FOR THIS PRACTICAL SESSION: 1. Please wear short-sleeve shirts / blouses for skin-fold measurements.
Sheng HP - 1 Broadening Course YPHY0001 Practical Session II (October 11, 2006) Assessment of Body Fat REQUIRED FOR THIS PRACTICAL SESSION: 1. Please wear short-sleeve shirts / blouses for skin-fold measurements.
The Bone Wellness Centre - Specialists in DEXA Scanning 855 Broadview Avenue Suite # 305 Toronto, Ontario M4K 3Z1
 Birth Date: 40.2 years Height / Weight: 158.0 cm 52.0 kg Sex / Ethnic: Female Patient ID: Total Body Tissue Quantitation Composition Reference: Total Tissue 50% 40% 30% 20% 20 30 40 50 60 70 80 90 100
The Ins and Outs of Body Composition Research
 The Ins and Outs of Body Composition Research Jordan R. Moon, PhD, CSCS*D, HFS NSCA State Director: Colorado Research Director: MusclePharm Sports Science Institute Faculty: United States Sports Academy
EXTRACELLULAR WATER REFERENCE VALUES. Extracellular Water: Reference values for Adults
 CHAPTER 5 Extracellular Water: Reference values for Adults Analiza M. Silva, Jack Wang, Richard N. Pierson Jr., ZiMian Wang, David B. Allison Steven B. Heymsfield, Luis B. Sardinha, Stanley Heshka ABSTRACT
DUAL ENERGY X-RAY ABSORPTIOMETRY (DXA) GOLD STANDARD FOR BONE HEALTH AND BODY COMPOSITION ASSESSMENT
 GOLD STANDARD FOR BONE HEALTH AND BODY COMPOSITION ASSESSMENT") DUAL ENERGY X-RAY ABSORPTIOMETRY (DXA) GOLD STANDARD FOR BONE HEALTH AND BODY COMPOSITION ASSESSMENT Prof d-r Slavica Šubeska Stratrova Clinic of Endocrinology, Skopje, Macedonia Definition and classification
DUAL ENERGY X-RAY ABSORPTIOMETRY (DXA) GOLD STANDARD FOR BONE HEALTH AND BODY COMPOSITION ASSESSMENT Prof d-r Slavica Šubeska Stratrova Clinic of Endocrinology, Skopje, Macedonia Definition and classification
The Bone Wellness Centre - Specialists in Dexa Scanning 855 Broadview Avenue Suite # 305 Toronto, Ontario M4K 3Z1
 Birth Date: 24.7 years Height / Weight: 8.0 cm 79.0 kg Sex / Ethnic: Male Patient ID: Total Body Tissue Quantitation Composition Reference: Total Tissue 40% 30% 20% 0% 20 30 40 50 60 70 80 90 00 Centile
Weight Management: Finding a Healthy Balance. discuss the differences between overweight and obese and their implications for health;
 CHAPTER 11 Weight Management: Finding a Healthy Balance After completing this chapter you should be able to: discuss the differences between overweight and obese and their implications for health; explain
Luís B Sardinha, Timothy G Lohman, Pedro J Teixeira, Dartagnan P Guedes, and Scott B Going
 Comparison of air displacement plethysmography with dual-energy X-ray absorptiometry and 3 field methods for estimating body composition in middle-aged men 1,2 Luís B Sardinha, Timothy G Lohman, Pedro
BODY COMPOSITION (Why your weight isn't a good indication of health.)
") BODY COMPOSITION (Why your weight isn't a good indication of health.) Body Composition is the technical term used to describe the different components that, when taken together, make up a person's body
BODY COMPOSITION (Why your weight isn't a good indication of health.) Body Composition is the technical term used to describe the different components that, when taken together, make up a person's body
Dual-energy X-ray absorptiometry (DXA), body composition assessment 62
, body composition assessment 62") Subject Index 3 -Adrenergic receptor, gene polymorphisms and obesity 10 Aging, body composition effects 64, 65 Air-displacement plethysmography, body composition assessment 62 Bioelectrical impedance analysis
Subject Index 3 -Adrenergic receptor, gene polymorphisms and obesity 10 Aging, body composition effects 64, 65 Air-displacement plethysmography, body composition assessment 62 Bioelectrical impedance analysis
ANALYSIS OF BODY FAT AMONG AMRAVATI CITY ADOLESCENT SCHOOL BOYS
 ANALYSIS OF BODY FAT AMONG AMRAVATI CITY ADOLESCENT SCHOOL BOYS Author : Dr. Shrikant S. Mahulkar, Late Dattatraya pusadkar Arts college, Nandgaon peth Dist. Amravati (Maharashtra) India. Email: shrikantmahulkar@rediffmail.com
Bioelectrical Impedance versus Body Mass Index for Predicting Body Composition Parameters in Sedentary Job Women
 ORIGINAL ARTICLE Bioelectrical Impedance versus Body Mass Index for Predicting Body Composition Parameters in Sedentary Job Women Mohammad Javad Shekari-Ardekani 1, Mohammad Afkhami-Ardekani 2*, Mehrshad
ARE YOU OBESE?! Aaser Abdelazim
 ARE YOU OBESE?! by Aaser Abdelazim Assistant professor of Medical Biochemistry Zagazig University, Egypt University of Bisha, KSA aaserabdelazim@yahoo.com MAN BODY SHAPES 1. Narrow hips and clavicles 2.
As of the wrestling season, the National
 Evaluation of Air Displacement for Assessing Body Composition of Collegiate Wrestlers ALAN C. UTTER 1, FREDRIC L. GOSS 2, PAMELA D. SWAN 3, GREGORY S. HARRIS 1, ROBERT J. ROBERTSON 2, and GREGORY A. TRONE
ASSESSING BODY COMPOSITION
 ALL ABOUT EXERCISE ASSESSING BODY COMPOSITION BODY MASS INDEX Body Mass Index (BMI) is a number calculated from a person s height and weight. BMI is an indicator of total body fat and is used to screen
Achieving a Healthy Body Weight
 1 Achieving a Healthy Body Weight by Dr Greg Wilson INTRODUCTION This is the second article in our Healthy, Fit and Happy lifestyle series. One of the primary goals of many people on their path to a healthy
Citation for published version (APA): Haverkort, E. B. (2014). The value of nutritional assessment in major abdominal surgery
: Haverkort, E. B. (2014). The value of nutritional assessment in major abdominal surgery") UvA-DARE (Digital Academic Repository) The value of nutritional assessment in major abdominal surgery Haverkort, E.B. Link to publication Citation for published version (APA): Haverkort, E. B. (2014).
UvA-DARE (Digital Academic Repository) The value of nutritional assessment in major abdominal surgery Haverkort, E.B. Link to publication Citation for published version (APA): Haverkort, E. B. (2014).
See Your Body BetterTM
 Product Brochure 2000 See Your Body BetterTM Products to Track Your Weight and Body Fat % Know Your Weight and Body Fat % Ordinary bathroom scales measure only one thing weight. They can t distinguish
Prediction of extracellular water and total body water by multifrequency bio-electrical impedance in a Southeast Asian population
 Asia Pacific J Clin Nutr (1999) 8(2): 155 159 155 Original Article OA 88 EN Prediction of extracellular water and total body water by multifrequency bio-electrical impedance in a Southeast Asian population
Body composition measurement in severe obesity Sai Krupa Das
 Body composition measurement in severe obesity Sai Krupa Das Purpose of review Severe obesity is accompanied by large increases in fat mass and alterations in the composition of fat free mass, in particular
Whole Body Dual X-Ray Absorptiometry (DXA) to Determine Body Composition
 to Determine Body Composition") Whole Body Dual X-Ray Absorptiometry (DXA) to Determine Body Composition Policy Number: 6.01.40 Last Review: 4/2018 Origination: 4/2005 Next Review: 4/2019 Policy Blue Cross and Blue Shield of Kansas City
Whole Body Dual X-Ray Absorptiometry (DXA) to Determine Body Composition Policy Number: 6.01.40 Last Review: 4/2018 Origination: 4/2005 Next Review: 4/2019 Policy Blue Cross and Blue Shield of Kansas City
mbca Medical Measuring Systems and Scales since 1840 Service United Kingdom Germany seca ltd. 40 Barn Street Birmingham B5 5QB ٠ England
 201551524013 Medical Measuring Systems and Scales since 1840 mbca United Kingdom seca ltd. 40 Barn Street Birmingham B5 5QB ٠ England phone 0121 643 9349 fax 0121 633 3403 info.uk@seca.com Germany seca
MD10826_Körperfettwaage_manual_UK.fm Seite 1 Mittwoch, 26. Juli :10 14
 MD10826_Körperfettwaage_manual_UK.fm Seite 1 Mittwoch, 26. Juli 2006 2:10 14 TABLE OF CONTENTS Safety instructions................................. 2 Overview of the appliance...........................