BONE DENSITY AS A SOURCE OF ERROR MEASURING. BODY COMPOSITION WITH THE BOD POD and idxa IN FEMALE RUNNERS THESIS. the Degree Master of Science in the
|
|
|
- Elizabeth Stephens
- 6 years ago
- Views:
Transcription
1 BONE DENSITY AS A SOURCE OF ERROR MEASURING BODY COMPOSITION WITH THE BOD POD and idxa IN FEMALE RUNNERS THESIS Presented in Partial Fulfillment of the Requirements for the Degree Master of Science in the Graduate School of The Ohio State University By Raymond M. Lombardi, DC, MS, RN Human Ecology Graduate Program The Ohio State University 2012 Master's Examination Committee: Jackie Buell, PhD, Advisor Joshua Bomser, PhD Diane Habash, PhD
2 Copyrighted by Raymond M. Lombardi, DC, MS, RN 2012
3 ABSTRACT Body composition estimates are used in clinical and research settings. Accurate estimates of percent body fat, lean mass and bone density are desirable to many clients and researchers in health-related fields. Two current methods considered accurate and reliable are the BOD POD and idxa. Studies comparing the accuracy of these two methods have shown that there is a statistically significant difference of 1-3% in the percent body fat in populations studied, and this difference can be easily attributed to either method. The purpose of this case-control study is to evaluate how bone density may influence the difference for body fat estimates between the BOD POD and the idxa machines when comparing bone adequate versus osteopenic female runners from a parent study which included 125 recreational female runners. Cases were invited to participate in this BOD POD study based on low bone mineral results (Z score < -1.0 for total body or lumbar spine). Bone adequate controls were at least average or better (Z score > 0). Cases and controls were matched on age (within + 3 years), body size using body height (within + three inches) and weight (within + ten pounds). After each case, an appropriate control (Z-score > 1.0 for total body or lumbar spine) was identified and invited to participate yielding a total of 15 pairs of subjects. Analysis of the percent body fat between the BOD POD and idxa for each subject was performed by evaluating the calculated difference between the measures, and the data compared between the Case- ii
4 Control groups. The group variances were determined similar using the Folded F statistic (p = ). Paired T-test analysis between groups demonstrated no significant difference (p = ) in the difference variable between the cases (mean ) and controls (mean ). Power analysis was performed using the mean and standard deviations of the actual sample (1) and indicated a low powered study (1-β = 0.24), and it would have required 77 subjects per group based on these findings to see a significant difference. Conclusion: Based on the findings of this small case-control study, no significant differences were found between the BOD POD and the idxa measures of percent body fat between the bone insufficient and bone sufficient groups. Further exploration of the data using linear modeling did demonstrate a potential role for bone density and a menstrual indicator when predicting the percent body in the BOD POD from the idxa estimates. These findings need further investigation using much larger sample. iii
5 DEDICATION Dedicated to the love of my life Traci and to my mother, Mary H. Lombardi Thank you for all your love and support iv
6 ACKNOWLEDGMENTS I would like to first thank my advisor, Dr. Jackie Buell, for all of her encouragement, enthusiasm, support, and patience throughout my master s program. Without your expertise and all of the time you gave, this thesis would not have been possible. Thank you for being such an inspiring mentor and more importantly a great friend. I wish to thank the members of my thesis panel, Dr. Joshua Bomser and Dr. Diane Habash for being part of my committee and providing invaluable advice during the research and in the writing of this thesis. I wish to thank Jonathon Scott, the students from the Human Nutrition Department and those at Labs In Life at COSI who provided support and help on this project. I also would like to thank Dr. Mark Failla for giving me the opportunity to come to The Ohio State University, perform research and utilize my knowledge in a completely new and fascinating way. Finally, I would like to give a very special thanks to my fiancée Traci, for being so supportive throughout my return to college and the changes that brought to our lives. We have gone through a number of amazing adventures, filled with ups and downs; yet in the end persevered through love, by being a team, and lots of hard work. v
7 VITA 1978.Coconino High School 1991.D.C. Doctor of Chiropractic, Palmer College West 2005 M.S. Human Nutrition, University of Bridgeport Graduate Research Associate Department Of Human Nutrition, The Ohio State University Graduate Teaching Associate Department of Human Nutrition, The Ohio State University PUBLICATIONS 1. Lombardi, R.M. Aspirin Alternatives: The Top Natural Pain-Relieving Analgesics. B.L. Publications, (1999). FIELDS OF STUDY Major Field: Human Ecology with a specialization in Human Nutrition. vi
8 TABLE OF CONTENTS Abstract.. Dedication.. Acknowledgments.. Vita. List of Tables.. List of Figures. Chapter 1. Introduction ii iv v vi ix x Page 1.1 Background Research Hypotheses... 2 Chapter 2. Review of Literature 2.1 Body Composition Uses and Principles Air Displacement Plethysmography - A Two Compartment Model Studies Investigating the Accuracy, Precision and Validity of the BOD POD Dual-Energy X-ray Absorptiometry - A Three Compartment Model.. 21 vii
9 Page Studies Investigating the Precision, Accuracy and Validity of the DXA Comparison of Techniques - BOD POD and DXA 51 Chapter 3. Methods Participant Selection and Matching Statistical Methods 62 Chapter 4. Results Comparison of Measurement Differences Between BOD POD and idxa 65 Chapter 5. Discussion 70 Limitations.. 77 Future Research.. 78 Conclusion.. 78 References.. 80 Appendix A Abbreviations Appendix B List of Definitions.. 93 Appendix C Samples of idxa Measurements.. 94 viii
10 List of Tables Page Table 2.1 Body Composition Models and Equations... 7 Table 2.2 Sampling of References for Population-Specific Body Composition Equations and Conversions Table 2.3 DXA Algorithm to Parse Three Tissue Types Table 2.4 Differences in Technology among DXA Manufacturers Compared to the GE Lunar idxa Table 2.5 Williams et al Results for Adults and Children Table 2.6 Santos et al Results Table 2.7 Deurenberg-Yap et al Results Table 2.8 Soriano et al BMD and %BF Results.. 46 Table 2.9 Hull et al DXA Body Composition Results Table 2.10 Hind et al Precision of Two idxa Total Body Composition Measures 50 Table 2.11 Pre-weight Loss Results of DXA and BOD POD Comparison Table 3.1 BOD POD Case-Control Procedure Summary.. 62 Table 4.1 Subject Characteristics and T-test Pairing.. 64 Table 4.2 Stepwise Linear Modeling to Predict % Body Fat from BOD POD.. 69 ix
11 List of Figures Page Figure 1. BOD POD at Labs in Life, Columbus Ohio. 12 Figure 2 BOD POD Component Diagram.. 13 Figure 3. Lunar idxa Whole Body Scanner at Labs in Life, Columbus Ohio Figure 4. GE Lunar idxa Calibration Block TM.. 33 Figure 5. Percent Fat for BOD POD versus idxa By Group. 66 x
12 CHAPTER 1 INTRODUCTION 1.1 Background Body composition is of interest in healthcare, athletics, and fitness as people the world over strive to enhance health and performance. In general, body composition measures divide the body into fat mass and fat-free mass compartments. Within these divisions, each compartment is made up of specific tissue types. The fat mass compartment includes all the extractable lipids found in adipose and other tissues of the body. The fat-free mass compartment includes muscle, bone, proteins, water, connective tissue and minerals. Estimation of these components is what determines body composition outcome measures. Body composition estimates are important tools in clinical and research studies in health, fitness and weight management settings, thus continued research to evaluate the accuracy of these methods is worthy of consideration. Two sophisticated technologies currently in use for these estimates are air displacement plethysmography (the BOD POD as distributed by Life Measurement Inc) and dual-energy x-ray absorptiometry (DEXA, DXA, or idxa as distributed by General Electric (2-6). Both technologies are widely used, have studies supporting their precision and reliability, and have become viable 1
13 alternatives to the older gold standard, hydrostatic or underwater weighing (UWW) (4, 5). Some authors even consider these methods to be the new gold standards for body composition measures (7, 8), while other researchers challenge the underlying assumptions that may lead to error when using either of these technologies (5). Bone mass is one component in body composition estimates that has been evaluated, especially in the three compartment methods like the idxa. This current study examines the underlying premise that bone density may be a significant contributor to the error between the BOD POD and idxa methods in a case-control design where cases are bone insufficient female runners. The underlying assumptions of the BOD POD would consider that lean mass density is similar between subjects, and the bone density is part of that lean mass. The idxa provides the opportunity to partially investigate this assumption as it delineates the lean and fat mass from the bone mass. 1.2 Research Hypotheses H 0 : There is no difference in BOD POD to idxa estimates of body fatness between bone sufficient and bone insufficient female runners. H 1 : There is a significant difference in BOD POD to idxa estimates of body fatness between bone sufficient and bone insufficient female runners. 2
14 CHAPTER 2 REVIEW OF LITERATURE The purpose of this research is to examine the underlying premise that bone density measurements may be the significant contributor to the differences between the two methods. The review of literature is composed of four primary sections: 1. Body Composition Uses and Principles 2. Air Displacement Plethysmography A Two Compartment Model 3. Dual Energy X-ray Absorptiometry A Three Compartment Model 4. Literature Comparison of Techniques BOD POD and idxa. Partitioning the literature into these areas will be helpful in evaluating the strengths and weaknesses of each method as potential sources of the error between estimates, especially as it relates to bone mass. 2.1 Body Composition Uses and Principles Body composition is an important tool that can be used in a wide variety of settings for assessment and screening for a specific population's health and fitness parameters (9, 10). The spectrum of individuals who benefit from body composition 3
15 measures includes athletes, individuals at risk or having established health disorders, and the general public for screening purposes. The primary use of body composition measures is to evaluate fat and lean mass and their distribution in the body (10). Health professionals can utilize specific compartment estimates of the fat and fat-free mass as markers to evaluate disease states including bone health (11), obesity (12, 13), cancer associated lean mass changes (9), and cardiovascular disease and diabetes (14). In the second edition of her book Applied Body Composition Assessment, Heyward highlighted these varied uses of body composition measures in studying the effects of various diseases on the human body (10). Athletes at all skill levels, coaches and trainers can utilize body composition measures to monitor fitness and health. According to some experts, the capability to evaluate the level and distribution of body fat, lean muscle mass and bone density before, during, and post season can significantly enhance performance objectives (10, 15, 16). Body composition estimates are the result of applying underlying principles, assumptions and equations to indirect measures of the body. Inherent in these various methods are the assumptions that the underlying principles for each technique are valid, and that the practitioners are trained to understand the differences between methods. Body composition can be measured directly through tissue samples as shown by Brozek et al in his 1953 study of human cadavers, but this approach is not feasible or realistic in live humans (17). This study focuses on two specific body composition estimation methods; the two compartment (2C) Air Displacement Plethysmography (ADP or BOD 4
16 POD) and three compartment (3C) Dual-Energy X-ray Absorptiometry (DEXA, DXA, and idxa) models. The principles of the 2C and 3C models are derived from considerations of how the human body can be measured and which components make up those measures. The human body is composed of fat, muscle, minerals (bone), protein and water based on chemical analysis of human cadavers from early researchers (18, 19). This early research provided the reference data used by a number of different researchers to divide the body into two, three or more compartments using either molecular or tissue levels for the purpose of body composition measures (17, 20-23). In theory, since the body is composed of more than just two components, the more components a particular technique can estimate, the more precise it may become (5). The two compartment model considers the whole body and divides it into two fundamental components, fat mass and fat-free mass. The fat compartment consists of all body fat while the fat-free compartment comprises muscle, protein, bone, water, etc. The 2C model developed by Behnke and updated by Brozek and Siri, utilizes the measurement of whole body density (Db) as the basis to estimate the %BF (17, 20, 21, 24). Once body density is estimated, there are many population-specific equations to translate the density to 2C body composition. The Brozek equation is a popular example to estimate %BF from total body Db: %BF = [(4.57 / Db) 4.142] x 100 5
17 The Brozek equation, as established from male cadaver studies, assumed that the Db is g/cc and that body fat was 15.3% (in his reference models)(17). Knowing this premise is important because the more variable a subject is from the premise, the more likelihood of error. The Brozek et al 2C model equation is still widely used as the basis for estimating %BF. Another researcher, William Siri, developed his own 2C model equation in 1956 (20). The Siri equation, while similar to the Brozek equation, assumed that variations in the %BF estimates were due to differences in the fat content being made up of triglycerides instead of adipose tissue thus slightly adjusted the constants in the equation: %BF = [(4.95 / Db) 4.50)] x 100 Although the Siri and Brozek constants are slightly different, the estimated %BF is very similar in most cases. Both the Siri and Brozek equations are pre-programmed into the BOD POD where the Siri is applied to the general population and the Brozek is applied to athletes. Table 2.1 provides equations for various 2C and 3C models. 6
18 3C Tissue Level DXA Model 3C Molecular Level 2C Molecular Level Table 2.1 Body Composition Models and Equations Model Equation Reference BW = fat + fat-free body %BF = [(4.57 / Db) 4.142] x 100 Brozek 1963 BW = fat + fat-free body %BF = [(4.95 / Db) 4.50] x 100 Siri 1956 BW = fat + water + (mineral and protein combined) %BF = [(2.118 / Db) 0.78W 1.354] x 100 Siri 1961 BW = fat + water + (mineral and protein combined) %BF = [(6.386 / Db) M 6.090] x 100 Lohman 1986 BW = bone + bone-free lean tissue + fat %BF = FM /BW x 100 Ellis 2000 KEY: BW = Body Weight %BF = relative body fat Db = total body density (g/cc) FM = fat mass (kg) BW = body weight (mass) TBW = total body water W = TBW (Kg) / BW (kg) TBM = total body mineral (osseous + cell mineral) M = TBM (Kg) / BW (Kg) Chart from Heyward, V.H. and Wagner, D.R. Applied Body Composition Assessment - Second Edition (10) 7
19 The Brozek and Siri 2C model equations, while providing adequate estimates of %BF, may not provide accurate estimates for specific populations with fat-free body (FFB) or reference body values that deviate from those used in formulating these equations. To adjust for this, population specific equations and/or conversion formulas have been developed using a multicomponent model (three, four or six components). The multicomponent approach may consider minerals, bone mineral, total body water, protein, carbohydrates, or a combination of these elements to compensate and attempt to control for error differences found in the traditional 2C equations when estimating %BF for specific groups. These population specific equations and/or conversions include broad categories such as age, gender, ethnicity, athletes, and clinical populations with specific diagnosed conditions. These equations are beyond the scope of this study, but are introduced because they are important when considering the underlying assumptions of the 2C Brozek and Siri equations. Table 2.2 provides a sampling of research studies for population-specific equations and conversions. 8
20 Athletes Ethnicity Age Table 2.2 Sampling of References for Population-Specific Body Composition Equations and Conversions. Population Gender Age Range Reference Children and Both Female 8-17 Lohman, Caballero et al, Adolescents And Male 2000 Tyrrell et al, 2001 Older Adults Both Female And Male Kwok et al, 2001 African Americans American Indians Asian Japanese, Chinese Caucasian Hispanic High School, College and Professional Both Female And Male Both Female And Male Both Female And Male Both Female And Male Both Female And Male Both Female And Male 9-80 Chumlea et al, 2001 & 2002 Morrison et al, Hicks et al, 2000 Lohman, Caballero et al, Kwok et al, 2000 Demura et al, Deurenberg et al, 2001 Sun et al, Deurenberg et al, Prior et al, 2001 Deurenberg et al,
21 The three compartment model is an extension of the 2C model in that it considers another component of the fat-free compartment in body composition estimates. In 1961, William Siri developed a 3C model equation by considering water as a separate component from fat and lean mass. Siri developed this equation to account for individual variation of hydration status and its effect on body composition estimates. This model divided the body into fat, water, and a third component, lean mass, which combines protein with mineral (solids) (21): %BF = [(2.118 / Db) 0.78W 1.354] x 100 Water is the most abundant substance in our bodies, making up over 60% according to Brozek et al (17) and potentially as much as 73% according to Wang et al (25). Hydration status can vary significantly based on age, gender, health (especially "ill health" found with many clinically diagnosed medical conditions), nutritional intake, fluid consumption, levels of physical fitness, and obesity. The Siri 3C equation can be used with hydrometry measures in conjunction with a 2C model to better estimate or verify %BF estimates in subset populations such as children or the obese (21). Lohman et al developed another 3C molecular equation in 1986 which partitions the mineral compartment separately. This 3C model divided the body into fat, mineral (M), and a third component which combines protein with water, often also just called lean mass (22): 10
22 %BF = [(6.386 / Db) M 6.090] x 100 Lohman et al's equation sought to evaluate the variability of the mineral content of the fat-free compartment of the human body. This equation can be used to estimate %BF on specific populations in which the mineral content may be different from the general population such as with children, the elderly and African-Americans (10). Methods that estimate body mineral, like the DXA, can apply the Lohman 3C equation. To evaluate 3C tissue level components, Ellis et al produced an equation comprised of three compartments; fat mass, lean mass (muscle) and bone (23). The difference in this equation versus the previous equations cited is that it focused on the "tissue" level and not the "molecular" level. This equation had direct applicability for use with a DXA and its capability of delineating between bone and the soft tissue structures of lean mass and fat: %BF = FM / BW x 100 (BW = bone + bone-free lean tissue + fat) Where BW = body weight The use of the DXA as a tool for body composition measures is increasing, but questions remain as to its ability to differentiate accurately between the fat and lean mass. Though estimation of body composition can be helpful in various situations, the actual accuracy of the estimates relies on the underlying assumptions of the technology. The selected equations and algorithms used in these estimates will determine the 11
 is a two-compartment whole-body densitometric technique that uses the primary principle of air")
23 magnitude of potential error. The application of these principles and models is discussed in the following sections for the BOD POD and idxa. 2.2 Air Displacement Plethysmography A Two Compartment Model Air Displacement Plethysmography (ADP) is a two-compartment whole-body densitometric technique that uses the primary principle of air displacement to estimate body volume (2). The BOD POD, a body composition device based on ADP technology, made its debut in 1995 and it has dramatically impacted how body composition measures are performed (2, 26). Fig. 1 BOD POD at Labs in Life, Columbus Ohio The BOD POD is manufactured by Life Measurement, Inc., in Concord California (27). The BOD POD is an egg-shaped device that contains two chambers with a dividing wall and pressure-sensing diaphragm separating the front from the back. The front chamber, with its large window, is where the subject is seated during measures. The rear 12
24 compartment holds the electronics that are connected to the weight scales and the computer system. The dividing wall between the chambers contains a pressure-sensing diaphragm that sits between the front and back chambers. During testing, it oscillates to produce small volume changes that allow the machine to sense the pressures in each compartment. Comparison of the pressure volume products with the machine empty, then with known volume, then with subject in anterior chamber allows the machine to estimate the volume of the subject. Since the air around the subject is more compressible due to body heat given off, the machine estimates the body surface area (BSA) and applies a correction factor to the volume to improve accuracy (2, 3). Fig. 2 BOD POD Component Diagram (28) 13
25 In scientific principles, the BOD POD algorithm relies on Boyle s Law as the primary premise where the pressure volume product between two chambers is equal in a closed and isothermal system: Boyle s Law: P₁/P₂ = (V₂/V₁) Since the introduction of a living object introduces heat into one side of the closed system, it is necessary to correct for differences in air compressibility. The BOD POD uses a variation of Boyle s law, Poisson s Law to correct for the adiabatic conditions (where air temperature does not remain constant): Poisson s Law: P₁/P₂ = (V₂/V₁) γ To apply these constants, the BOD POD estimates the subject's body surface artifact (BSA) by calculating height and weight measures. Knowing the subject's estimated BSA and multiplying that value by the constant k (-4.67 x 10 5 ), allows for an automatically computed correction for body surface artifacts (clothing, hair, etc) that may impact the isothermal conditions by creating a negative volume effect and altering %BF estimates (3). The "γ" aspect of Poisson's Law describes the ratio of specific heat of the gas at constant pressure to that at constant volume (2, 3, 9). Between the BSA and γ corrections to Boyles Law, the BOD POD estimation of body volume is then divided by body mass to yield body density. Body density is then translated to percent body fat using 14
26 an appropriate population-specific equation. While the BOD POD's physical system is unique as a body composition measuring tool utilizing air displacement, the measuring concepts used are similar to those used in hydrodensitometry (HD) or underwater weighing (UWW) (29). There are other factors which may influence volume estimates that the BOD POD is not able to correct. Included in this category are individuals who are particularly hirsute (hairy), facial hair (beards), movement, predicted versus measured lung volume, extremes of body temperature, and altered hydration status. The variability of these physical properties may affect the accuracy of a subject s measures in the BOD POD, especially with repeat measures administered differently for lung volumes, measures performed over extended time frames, when there have been changes to the physical status of the subject between tests, and if the subject has altered body temperature from one test to another due to activity (5, 30). These variables can unpredictably contribute to the machine error. To establish consistent results and improve accuracy, the BOD POD uses a stepby-step protocol for each measurement established by its developers. The subject is asked to void both bowel and bladder prior to testing and height is measured for entry into the demographic panel. Name and subject ID numbers, date of birth, and ethnicity are also entered in that same screen. The BOD POD then undergoes a two-step calibration process measuring the empty interior volume (pressure) followed by measuring a known volume utilizing a known volume calibration cylinder to determine the pressure given that known volume. The subject, wearing a swimsuit (or similar attire) and a hair (swim) cap, is 15
27 asked to step onto the calibrated scale attached to the BOD POD electronics and body mass is recorded. The subject is then seated in the front chamber, and instructed to sit comfortably, breath normally, and limit all movement during each measure. The front chamber door is closed and sealed for testing using the novel magnetic/steel plate locking mechanism to ensure the pod is not bringing in air from the outside. Two measures (approximately 40 seconds each) are taken to predict the volume of air displaced by comparison of the pressure changes which the machine compares to the known volume pressure changes. The two volume estimates must be within 150 ml of each other or a third measure is taken. If the operator chooses to measure lung volume, it is measured at this point in the protocol by a breathing tube with a huffing pattern by the subject. Testing ends with the subject exiting the BOD POD and the software s estimation of the subject s BV. Body volume and mass are used to estimate body density (Db) according to the desired equation, such as the Brozek or Siri equations. The body density is then converted to an estimate of body fatness (2, 3). The equation applied for this study s protocol was the Siri equation as the better equation to use for Caucasian athletes (20, 21, 26, 30, 31), and we chose to use estimated lung volumes Studies Investigating the Accuracy, Precision and Validity of the BOD POD There have been a number of researchers who have investigated the precision, accuracy and validity of the BOD POD as a measure of Db, body volume, and %BF. Dempster and Aitkens tested the BOD POD for volume reliability using an aluminum cylinder in their 1995 study. They performed 40 successive tests over the course of two 16
28 days on inanimate objects of known volumes and found volume errors of approximate 0.02% which they translated to a percent fat error of approximately 0.1% (3). Following the Dempster study, other researchers investigated the reliability and accuracy of the BOD POD on human subjects, focusing on estimated %BF or body volume measures in comparison to UWW (2, 26, 29, 30, 32-36). Collins et al investigated the precision and accuracy of the BOD POD in a 2003 study, evaluating both inanimate objects and adult men and women. Prior to measuring the adult subjects, Collins performed five repeated measures on plastic containers filled with degassed, distilled water with known volumes ranging from 10 to 150 L. Collins found a mean volume error measure of 0.1% with BOD POD testing of inanimate objects of a known volume and concurred with the Dempster study results that the BOD Pod produced highly accurate, precise, and reproducible findings (35). Collins then continued the study to evaluate the accuracy of the BOD POD using 45 male and 57 female test subjects. His findings, using group mean values, showed a %BF for repeated measures. In addition, Collins noted that the findings for "group" were better than those of "individuals" (35). This is not surprising since mean errors are not as extreme as the range used to find it. BOD POD testing using either predicted or measured lung volumes has been studied by a few researchers as a possible source of accuracy error for %BF estimates. McCrory et al in their 1998 study found no significant differences between measured (Vtgmeas) and predicted (Vtgpred) average lung volumes (Vtgmeas and Vtgpred; + SE, ml) and their impact on %BF ( %BF). For individuals, %BF measured by using Vtgmeas versus Vtgpred was + 2 %BF (37). These finding have been 17
29 corroborated in other studies including that of Demerath et al, Collins et al, and Anderson et al (35, 36, 38). The issue in each of these studies was the difference in the %BF when comparing a measured versus predicted lung volumes. If one agrees with the findings of these studies that lung volume was the only source of the 1-2 %BF error, measured lung volume should add accuracy to the study protocol. Our study used predicted lung values for all subjects. In a 2003 study, Collins et al specifically looked at the body surface artifact (BSA) estimates as a possible factor causing the deviation of %BF findings. However, they reported that the BSA formulas considered did not appear to be the cause of the different finding, but that it could play a role with subjects of increased leanness, those with greater obesity, and with children (35). There have been a number of validation studies comparing the accuracy of the BOD POD to other body composition methods. The majority of these studies compared the BOD POD to underwater weighing (UWW) and DXA. Fields et al in 2001 performed a study comparing the Db of the BOD POD and UWW, and then %BF by the BOD POD with a 4C model using 42 adult female subjects. The Db for UWW was estimated with measurement of residual lung volume producing a Db calculation in g/cm³. To determine Db for the BOD POD with lung volume measures, the following calculation was used: Db = M / (Vbraw Vtg - SAA) 18
30 For this equation, M = the subject s mass, Vbraw = the subject s uncorrected body volume, Vtg = thoracic gas volume, and SAA = the surface area artifact that is used to correct for isothermic conditions within the BOD POD chamber. Using paired t-test results, they reported no significant difference (p = 0.35) when comparing the Db BOD POD ( g/cm³) to the Db UWW ( g/cm³). The %BF for the BOD POD was performed using the estimated Db with the 1961 Siri equation and was estimated to be 28.8 %BF. The %BF calculation for the 4C model was obtained by using the Baumgartner et al equation: %B = 205(1.34 / Db 0.35 A M 1) For this equation, Db is from UWW and A and M was aqueous and mineral body mass fractions respectively (derived from assessment of total body water by isotope dilution - TBW). The %BF from the 4C model was 30.6%. Based on these results, the researchers found the %BF BOD POD to be significantly lower (p < 0.01) than the %BF from the 4C model, concluding that the BOD POD significantly underestimated %BF when compared to a 4C model (30). A small 1999 study of 10 adult males and 10 adult females by Levenhagen et al compared the BOD POD, UWW, Bioelectrical Impedance (BIA), and DXA. These researchers found the mean body fat for all study subjects with the BOD POD was 23.4% + 2.3% and UWW was 23.9% + 1.8% concluding that the BOD POD s average %BF findings were highly correlated to UWW %BF (r >.90, p <.0001) (39). Levenhagen 19
31 noted differences by gender in this small study, but these were not found to be duplicated by other researchers as found in the review of literature study by Fields et al in 2002 (26). Vescovi et al's 2001 study of 95 adult men and women found the mean Db (g/cm³) and %BF for all subjects for the BOD POD was g/cm 3 and 22.5%, UWW g/cm 3 and 22.0% respectively. This study did not find gender differences in average %BF for the BOD POD that was found by Levenhagen s 1999 study. Based on these results, the researchers found that the BOD POD was a highly reliable and valid method when compared to UWW (40, 41). A 2008 study by Bentzur et al of 30 female athletes compared the BOD POD to UWW, DXA and Skinfold (SF) techniques. The study found that the average Db (g/cm³) and %BF for the BOD POD was g/cm³, 19.3% and UWW g/cm³, 15.4% respectively. The researchers concluded that the BOD POD significantly over-estimated the %BF versus UWW, however stated that the overall correlation was good with r = 0.88 and SEE = The researchers also noted that BOD POD (19.3 %BF) significantly underestimated %BF compared to the DXA (23.0 %BF) and that the correlation between the %BF DXA and BOD POD was poor (r = 0.25, SEE = 5.73) (31). The BOD POD has many advantages as a tool to measure body composition including its relative comfort for subjects, ease of use, and fast estimate of Db and %BF for body composition measures. A BOD POD measure can be performed in approximately 10 minutes, much more rapidly than UWW (approximately 30 minutes) and closer to the DXA s 7-8 minute whole body scan (depending on body size). It can be utilized for a wide range of subject types including children, the elderly, those with 20
32 disabilities, and the extremely large or obese (up to 425 pounds according to manufacturer) (10, 15, 26, 38, 41, 42). The BOD POD has a large number of studies validating its accuracy and precision when compared with other body composition measuring devices. However, based on a review of the current literature, it's accuracy for children, the very lean, those with increased obesity has mixed results with increased margin of error %BF estimates. 2.3 Dual Energy X-ray Absorptiometry A Three Compartment Model Dual-Energy X-ray Absorptiometry (DEXA, DXA, or idxa) is a threecompartment method used to estimate body composition. It provides rapid scan speeds, a low radiation dose, excellent image quality and high precision for body composition estimates (6, 43). Historically, DXA was developed in the 1980 s, building on the technology of dual-photon absorptiometry (DPA), which was developed to estimate the bone mineral density (BMD) of the wrist, lumbar vertebrae, and parts of the femur, eventually being used to estimate whole-body composition (44). DXA utilizes a dualenergy filtered x-ray beam combined with proprietary computer software analysis algorithms to estimate fat, lean tissue and bone mineral content based on previously established constants for each tissue type (23, 45, 46). The DXA is capable of measuring the whole body or an anatomical regional area of interest as desired, providing an important capability in body composition measures (47). Though increasing in usage as a tool for body composition measures, this method is primarily found in clinical and research settings because of the high purchase and maintenance costs and the variable 21
33 need for state licensing required for machine operation (45, 48). These characteristics are given consideration when choosing body composition technology. DXA machines are produced by a number of different companies worldwide, with three companies considered the major suppliers: Lunar, Hologic and Norland. Each manufacturer generally uses similar features including an x-ray source (producing x-rays filtered for two specific energies in either a pencil-beam or fan-beam configuration), a scanning table, detector arm, and an integrated computer system (6). This current study utilized the GE Lunar Intelligent DXA (idxa) whole-body scanner (GE Medical Systems, Madison WI), using GE EnCore analytic software versions to (updated during study by GE Healthcare), and new overlapping narrow, fan-beam x-ray technology (49). 22

34 Fig. 3 GE Lunar idxa Whole-Body Scanner at Labs in Life COSI, Columbus Ohio DXA technology operates on the basic physics principles that bimodal x-ray energies will be weakened differentially by various tissues based on tissue density. The DXA software algorithm assumes attenuation coefficients for various tissues, using these to estimate the three compartments of body composition (lean, fat and bone) (50). The GE Lunar idxa uses a fixed 100 KV (kilovolt) power source to create the initial x-ray beam that is then filtered into bimodal beam energies by a K-edge Samarium filter (49). The two energy beams produced have energy peaks of ~40 KeV (kilo-electron volt) and ~70 to 80 KeV, which pass through the subject s tissues, registers on the scanner 23
35 detector, and then are quantified by the software algorithm based on research-developed tissue coefficients (Um) specific for each tissue type (46, 49). In addition to the Um, R- values (ratio values) have been derived from experimental data for a wide range of molecular level components for both the low and high x-ray energies produced in a DXA scan. The R-value is the quotient (or ratio) of the attenuation of the lower energy beam to the higher energy beam for each tissue type (46). These assumed values are used in a DXA scan to delineate bone from lean and fat tissue that exists as a heterogeneous mixture in human beings. The GE Lunar idxa uses a narrow 4.5 degree angled fan type beam kept parallel to the longitudinal axis of the subject which allows it to scan in a transverse pattern across the body of the each subject (49). This configuration is important in idxa scans because it allows the fan beams to overlap slightly with each pass. This facilitates the scan by ensuring that the area of interest is scanned completely. A problem that can occur with an overlapping scan is that you can produce multiple images and cause a magnification or distortion effect. The idxa (per the manufacturer) has solved this problem with the advent of TruView TM (multiple view image reconstruction) technology that reduces the magnification effect (49). This current generation of machine (idxa) has been refined to overcome errors induced with technology enhancement, so it may be important to consider which generation of machine and manufacturer is used in DXA studies. Inherent in the principles cited above is the ability of the analysis of the x-ray beam to be interpreted as it registers on the DXA detector. The GE Lunar idxa utilizes a 24
36 staggered array of 64 CZT-HD detectors made up of cadmium, zinc, and telluride (CZT) that are energy sensitive, allow for rapid photon counting and immediate conversion to digital images (49, 51). The idxa narrow angled fan beam configuration along with its upgraded detector provide for improved image resolution (1.05 mm longitudinally, 0.6 mm laterally) and image quality (49, 52, 53). The DXA x-ray s images are produced from the composition of many small picture elements called pixels that are reconstructed by software algorithms. Each two-dimensional pixel is uniform in area and represents a snapshot of the respective x-ray scan area. Individual pixels are used to determine the mass per unit area which in turn is calculated to determine whether the scanned tissue is fat, lean or bone based on their previous established Um and R-values (23, 46, 54). While the scanner is recording energy through lean and fat (no bone), it estimates both fairly well. When the machine passes over bone, it is estimating lean and bone simultaneously. The machine is forced to extrapolate the estimate of fat over bone from the measures it saw adjacent to the bone. Table 2.3 provides the rationale for how the idxa uses the attenuation of the x-ray energies. 25
37 Equations Parsing Lean and Fat Tissue Equations Parsing Soft Tissue and Bone Table 2.3 DXA Algorithm to Parse Three Tissue Types Soft Tissue: (μ B40 LR 70 μ B70 LR 40 ) / (μ B70 μ T40 μ T70 μ B40) Bone: (μ T40 LR 70 μ T70 LR 40 ) / (μ T70 μ B40 μ B70 μ T40 ) Lean Tissue: (μ F40 LR 70 μ F70 LR 40 ) / (μ F70 μ L40 μ L70 μ F40) Fat Tissue: (μ L40 LR 70 μ L70 LR 40 ) / (μ L70 μ F40 μ F70 μ L40 ) KEY: B = Bone, T = soft tissue, L = lean tissue, F = fat tissue, and LR = log ratios. μ B40 and μ T40 = the mass attenuation coefficients for soft tissue and bone at 40 KeV. μ B70 and μ T70 = the mass attenuation coefficients of soft tissue and bone at 70 KeV. μ F40 and μ L40 = the mass attenuation coefficients for fat and lean tissue at 40 KeV. μ F70 and μ L70 = the mass attenuation coefficients for fat and lean tissue at 70 KeV. Table created from data derived from research by J.F. Sutcliff, 1996 and K.J. Ellis 2000 (23, 55). 26
38 Some authors prefer to look at this as two, 2C estimates that then are integrated to create a 3C whole body composition estimate (6, 23, 50, 56). The Ellis 3C molecular equation for DXA is formulated as: %BF = FM / BW x 100 (BW = bone + bone-free lean tissue + fat) The Ellis equation is the compilation of two sets of 2C model equations outlined by Sutcliff in his 1996 review study of methods used to determine human body composition. The ability of the DXA machine to analyze and estimate three components makes it a valuable tool in body composition measures. Beyond these assumed principles, there are a number of factors that may influence DXA body composition estimates. Differences in machines, brands and software algorithms are a source variance. These differences, combined with a lack of common industry standards for bone density and body composition measures, makes it difficult to directly compare estimates between devices (47, 57-59). According to a 2010 report from the International Atomic Energy Agency on the DXA, the differences in accuracy of bone mineral estimates between manufacturers can be significant. This report cited differences of 8% for areal BMD and 20% for BMC for measures performed by GE Lunar machines compared with those from Hologic (59). These same differences trickle down to the specific regions of interest (ROIs) as well as the different scans of interest such as the femoral neck and forearm (59). The lack of agreement for specific ROIs makes direct comparison of body composition estimates between different machines 27
39 uncertain at best. In addition to the above cited hardware differences, are the assumed variations in the analytic software employed by the various manufactures of whole-body densitometry scanning technology; especially among the major manufacturers (GE Healthcare, Norland, and Hologic). The proprietary analytic software for body composition measures is based on mathematical algorithm constructs specific to a particular manufacture. Even within the same manufacturer, this software capability may vary depending on the machine and hardware configuration used. The competitive marketplace drives these differences as manufacturers strive to provide the most appealing technology (47, 57-59). Table 2.4 summarizes some of the general differences among manufacturers as compared to the GE Lunar idxa. 28
40 Table 2.4 Differences in Technology among DXA Manufacturers Compared to the GE Lunar idxa. Category General For Various Manufacturers (Hologic and Norland) GE Lunar Intelligent DXA (idxa) Power Input Direct or Alternating Current (i.e. voltage switching) Direct Current 100 KV X-ray Beam Technology May be Pencil Beam or Dual Energy Fan Beam (2 x-ray beams) Dual Energy Narrow Angled Fan-Beams (2 x-ray beams) X-ray Beam Angle Perpendicular to Subject (For Pencil Beam) or From 4 to 14 degrees (+) depending on manufacturer 4.5 degrees Scanning Capability Single Pass Overlapping X-ray Filter Cerium or Samarium Samarium K-Edged Filter X-ray Detector Single Array Direct-Digital CZT-HD Staggered Array Configuration (using Cadmium, Zinc & Telluride Components) Subject Weight Limit 250 to 450 pounds 450 pounds Analytic Software Varies QDR for Hologic EnCore Proprietary Software 29
41 Other factors that may influence DXA body composition estimates are a direct result of the limitations and/or problems related to the technology currently available. As previously discussed, DXA can only solve for two compartments at a time (i.e. for only two tissue types at a time). While DXA is outstanding for estimating bone mass, it must parse out the other tissues, such as estimating soft tissue where no bone is located (23, 47, 58, 59). The problem with this model is that accurate estimates are assumed to be true based on calculations made by the manufacturer s analytical software and its ability to parse the different tissue types from each other. This can be particularly difficult when differentiating soft tissue from bone due to varying thickness of each tissue in different areas of the body and with obese subjects (23, 47, 58, 59). There are several researchers who believe that this issue is an important problem with DXA technology and can lead to significant differences in body composition estimates (60-64). DXA fan beam x-ray magnification errors may be a source of error as previously outlined. The issue of fan beam x-ray magnification errors is an inherent problem related to the physics of fan beam technology. As the distance from the x-ray source decreases from the scanned structures, the greater the magnification error will become with inherent increases in bone width estimates (65-69). This effect is especially pronounced in children, obese and elderly subjects whose body size and tissue thickness is not within the expected range of a typical adult. Magnification can significantly alter BMC, bone area (area), and bone geometry estimates, which in turn impacts body composition estimates in whole body DXA scanning (65-69). GE Healthcare Prodigy and more recent Lunar idxa scanning technology (used in this study), has developed an algorithm 30
42 (TruView TM ) that corrects for this magnification error (49). Other researchers have noted this finding in DXA comparison studies (66-69). The magnification error associated with fan beam DXA technology must be taken into consideration when using older machines or when comparing results with machines that do not have the upgraded technology. Hydration status is another area of potential error with DXA body composition estimates. The hydration status of the human body can fluctuate based on fluid intake, perspiration, metabolic activity, urinary output, and disease processes to name a few causes. In disease states, changes to hydration and fluid status can be mild to extreme depending on the condition and the health status of the person. For example, an uncompensated congestive heart patient in acute exacerbation can gain 5 to 10 pounds or more of fluid. This same person, after several days of medically-induced diuresing, can eliminate most of this gained fluid (70). This extreme, hypothetical fluid status shift does not normally occur in healthy individuals. However, healthy individuals do have smaller, non-clinical fluid shifts between lean tissue (LT), extra-cellular tissue (ECT) and intracellular tissue (ICT) occurring each day for a variety of reasons (lack of fluid intake, extreme metabolic activity with exercise, drinking caffeinated liquids which increase urinary elimination, drinking excessive amounts of water, etc). Several studies have addressed this issue with mixed results. In a 1996 review of DXA physical concepts, Pietrobelli et al noted that theoretical increases or decreases of extra cellular fluid (ECF) or intra-cellular fluid (ICF) has the potential to change the R value for FFM tissue (46). Pietrobelli expanded on this concept in his 1998 study on the effect hydration status has on DXA body composition estimates of fat. Based on modeling from this and his earlier 31
43 study using an assumed constant of hydration of fat free tissue, he noted that severe overhydration (found clinically in fluid overload) could increase the estimate of %BF in DXA body composition estimates (46, 71). St. Onge et al, in a 2004 study of the hydration status of LT and DXA estimates, did not find a significant R value difference between LT (R = 1.382), extra cellular water (ECW, R = 1.377), and intra-cellular water (ICW, R = 1.382). Of interest is these researchers noted that if the accumulating fluid has the same R-value as LT, no fat estimation error will occur regardless of how much extra fluid is added (72). Lohman and Chen, in the text Human Body Composition Second Edition, reviewed hydration status as a confounder of DXA body composition estimates. They stated that hydration levels may affect DXA estimates of %BF by 1% to 2.5%, but is not a major source of variation in DXA body composition estimates in a healthy population (73). Overall, the studies reviewed indicated a general agreement that hydration status, while having the potential to impact DXA body composition estimates of FFM and FM, has not been proven to significantly bias DXA estimates. Further studies on hydration are needed, especially with DXA machines using upgraded technology, to verify whether hydration status impacts body composition estimates. In conclusion, most researchers agree that the degree of hydration and changes in this hydration status are only meaningful when the hydration limits are extreme (70). Similar to the BOD POD, the GE Lunar idxa uses a step-by-step protocol specified by the manufacturer for each measurement to establish consistent results, improve precision and accuracy, including a daily quality assurance and calibration procedures. The automated idxa 6 Point calibration uses the manufacturer-provided 32

44 calibration block and software algorithms to calibrate the machine at normal, preosteoporosis, and osteoporotic BMD values, as well as lean, normal and obese values (6 points of calibration) (49). Fig. 4 GE Lunar idxa Calibration Block TM According to GE Lunar Healthcare, the idxa calibration system has been designed to improve precision and accuracy in the assessment of BMD as well as the Body Composition measurement over the full physiological range and is more robust due to the six point calibration (49). After the quality control tests are completed, the idxa is ready to scan a subject. While each manufacturer has specific protocols for their scanning procedures, a general example of the process as used in our study is described as follows: The procedure begins with the subject s arrival and signing an informed consent or clinical sheet about the DXA scan. The subject is requested to void and pregnancy status is verified with female subjects (usually with clinical or research grade urine pregnancy strips). The subject removes all jewelry and metallic objects, changing their clothes if 33
45 necessary. Body weight and height are measured using standardized stadiometer techniques, and the subject s measures and demographic data are entered into the accompanying computer software. Once the set-up is complete, the specific regions of interest are scanned, usually with a one person operating the DXA densitometer. For each scan, the subject is positioned (and repositioned if required) per the manufacturer s protocol for the specific region of interest. The total scan time varies from manufacture to manufacture and region of interest with a total body scan performed by most fan beam DXA densitometers taking approximately 5-8 minutes. After the scan is completed, the data are analyzed (per the manufacture s analytic software algorithms), and the results shared with subject (46, 69) Studies Investigating the Precision, Accuracy and Validity of the DXA There have been a number of researchers who have investigated the precision, accuracy and validity of the DXA s ability to measure body composition. Many of these studies compared the DXA pencil and fan beam technologies against a four compartment (4C) model, considered the gold standard for validation studies by a number of researchers (23, 74-79). This comparison is considered to have the greatest possible value for validation and precision studies because the 4C model integrates estimates of bone mineral, fat, protein and water using assumed constant densities for each component and several body composition methods collectively (74, 75). The 4C model measures body weight (BW) by combining estimates of %BF from Db using one of the 2C models (BOD POD or UWW), bone mineral mass from DXA, and total body water (TBW) by isotope 34
46 dilution (75). Reconfiguration of the 4C model equation can provide estimates of specific components such as %BF as shown in the Heymsfield 1996 equation: %BF = [(2.513 / Db) 0.739W B 1.790] x 100 In this equation, W = TBW (Kg) / BW (Kg), TBW = total body water and BW = body weight; and B = TBBM (Kg) / BW (Kg), where TBBM = total body bone mineral (osseous mineral only) (10, 74). While no model is without assumptions and errors, the 4C is considered to have greater accuracy in determining %BF than the 2C or 3C models individually (23, 69, 74-79). The studies on DXA precision, accuracy and validity encompass two decades and include older DXA technology. Within these parameters, a number of researchers have found that DXA measures of %BF were typically within 1-3 %BF of other multicomponent systems (6, 50, 76, 80). Our study was conducted using the GE Lunar idxa, a narrow angled fan beam densitometer with the most recent upgraded technology. To be current in the comparison of technologies, this section reviewed only DXA studies from the past ten years with a preference for fan beam technology to examine machine precision, validity and related issues. Several studies have reported the DXA overestimates %BF and fat mass when compared to a 4C reference model (69, 78, 79). The Williams et al study assessed the body composition of 211 subjects using the GE Lunar Prodigy (narrow fan beam) in comparison with a 4C reference model (78). The subjects measured included adults (n = 35
47 84), children (n = 127), healthy versus non-healthy, male and female participants. The healthy subjects included 122 non-obese individuals. The non-healthy group included 55 obese subjects (BMI > 30), 26 subjects with cystic fibrosis (CF, all children), and 12 children with glycogen storage disease (GSD). The 4C model utilized the BOD POD to measure body volume and weight, DXA for BMC, and deuterium dilution to measure TBW. The Fuller equation was used to determine FM from the 4C model (73): FM = x BV x TBW x TBBA 2.05 x BM Where TBBA = total body bone ash (kg). Williams stated that the deuterium dilution space was assumed to overestimate TBW by a factor of based on the findings of a prior study. To compensate for this assumption, Williams used a correction factor for fluid intake during the equilibrium period to derive the estimate of TBW (78). Estimations of hydration status for all subjects are provided in the study, but the methodology is not disclosed beyond the TBW analysis. The %BF results for the Lunar Prodigy compared to the 4C model are reported in Table
48 Children Adults Table 2.5 Williams et al Results for Adults and Children Sample Healthy, Non-Obese Males (n = 26) Healthy, Non- Obese Females (n = 44) Obese Females (n = 14) Prodigy % BF 4C %BF Error % Difference (p-value) (0.001) (0.001) (0.05) Healthy, Non- Obese Boys (n = 30) Group All Non- Healthy, Non- Obese Girls (n = 22) Obese Children 21.5 Group All Non- Obese Children (0.001) Obese Boys (n = 11) Obese Girls (n = 17) Group All Obese children 42.6 Group All Obese children (0.01) Cystic Fibrosis Boys (n = 12) Group All Cystic Fibrosis Girls (n = 14) CF children 20.3 Group All CF children (NS) Glycogen Storage Disease Boys & Girls (n = 12) (NS) Results reproduced from Williams et al (78). 37
49 For all adult groups, the DXA significantly overestimated the mean %BF while in children, the researchers found that the DXA significantly overestimated the mean %BF for all obese children while underestimating the mean %BF in the non-obese boys (p < 0.05). It is important to note that the researcher s findings for the non-obese boys were not separated from those of the non-obese girls making it impossible to verify the statement of findings for non-obese boys. They found no significant differences in mean %BF for non-obese girls (see comment above), children with CF and GSD (78). Williams concluded and emphasized that, while precision was good, the inaccuracy, lack of validity and reliability of the DXA in body composition measures was a potential problem when comparing healthy (controls) with non-healthy subjects (especially children) and in those experiencing changes in body composition due to a disease states (78). Santos et al reported similar overestimation findings in testing the accuracy of DXA technology using the Hologic QDR 4500A fan beam DXA as compared with a 4C reference model during body composition measures of 27 male elite athletes (Judo) preparing for competition (79). Body composition measures were taken twice during this study, once prior to the opening of the season (weight stability period) and the second just prior to competition (after weight instability related to training). The DXA scanning was performed per the Hologic manufacturer s protocol to estimate %BF, FM, and FFM. The 4C model used in this study utilized a protocol similar to Williams et al, utilizing the BOD POD to measure body volume and weight, DXA for BMC, and deuterium dilution 38
50 to measure TBW. However, this study utilized the Wang et al equation to determine FM for the 4C model (73): FM = x BV x TBW x Mo x BM Where Mo = bone mineral (Kg). As a potential limitation, the Santos study determined a neutral hydration state during body composition measures using a visual urine scale. On this scale, a pale yellow color was desirable (indicating it was a dilute sample) and verification that the subject s post-void, first morning body weights for 3 days prior to the visit had not changed more than 1%. Unlike similar studies, the researchers did not perform any more robust measures of hydration status in this study (79). The body composition results for the Hologic QDR 4500A compared to the 4C model are reported in Table
51 Table 2.6 Santos et al Results n = 27 Pre-Season (A) - Mean Pre-Competition (B) - Mean Mean Difference A and B (p value) % Fat DXA 12.1% 11.7% -0.41(< 0.05) 4C 9.2% 8.0% -1.22(< 0.05) Fat Mass (kg) Difference p r SEE 2.9%* < * %* < DXA (< 0.05) 4C (< 0.05) Lean Mass (kg) Difference p r SEE 2.0 kg* < kg* < DXA (< 0.05) 4C (< 0.05) Difference p r SEE Kg =kilograms *Denotes p < kg* < kg* < Results reproduced from Santos et al (79). 40
52 A comparison of the pre-season to pre-competition values demonstrated small amounts of weight and fat loss in all subjects. The researchers concluded that the DXA overestimated the group mean %BF and FM while underestimating FFM, all by a significant difference (p < 0.05) when compared to the 4C model in cross sectional analysis. Based on these results, the authors concluded that the DXA was not as accurate as expected (79). Other studies have found the DXA to underestimate %BF and fat mass when compared to a 4C reference model (69, 77, 81-83). Deurenberg-Yap et al in a 2001 study of 291 ethnically diverse male and female subjects (108 Chinese, 76 Malays, and 107 Indians), compared the body composition estimates from a Hologic QDR-4500 fan beam DXA with a 4C reference model. The DXA scanning was performed per the Hologic manufacturer s protocol to estimate %BF, FM, and FFM. The 4C model used in this study employed a similar protocol as that found in the previous described studies utilizing the BOD POD to measure Db, DXA for BMC, and TBW was determined using a 2 H 2 O (i.e. Deuterium) dilution technique. This study (different from the prior two), used the Baumgartner et al equation (1991) to determine %BF from the 4C reference model (84): BF% = 205 x (1.34 / Db 0.35A M -1) In this equation, A = water fraction of body weight and M = mineral fraction of body weight (82, 84). 41
53 Males Females Deurenberg-Yap formally measured hydration status to determine the body water fraction as an indicator of hydration of the FFM. The water fraction of the FFM (f water ) was calculated as TBW / FFM, using an assumed constant (0.735). The equation to derive FFM from TBW and the constant was calculated as FFM = TBW / The results of this study are reported in Table 2.7. Table 2.7 Deurenberg-Yap et al Results Model Chinese Malays Indians DXA %BF 33.2% a 35.3% b 35.9% b 4C %BF 35.3% a 37.8% b 38.2% b Mean Difference p 2.1%* < %* < %* < 0.05 r 0.62 Value for combined females groups DXA %BF 20.2% a 22.1% 24.9% b 4C %BF 24.4% a 26.0% 28.1% b Mean Difference p 4.2%* < %* < %* < 0.05 r 0.56 Value for combined male groups KEY Mean values within rows with different superscripts were significantly different (p < 0.05) Results reproduced from Deurenberg-Yap et al (82). 42
54 The results showed that mean differences in %BF by group were found between the DXA and the 4C model. The difference between the 4C model and the DXA for %BF was significantly correlated using Pearson s partial correlation coefficients (r 0.62, p < 0.05). The difference in %BF between the 4C model and DXA for FFM was also significantly correlated for males (r -0.38, p < 0.05) and females (r -0.47, p < 0.05). Based on these results, the researchers determined that the DXA significantly underestimated all group subjects for %BF and had accuracy limitations (82). It may be important to remember that their data used a constant to adapt a Prodigy based equation (Baumgartner) to a Hologic machine and that may account for all of the underestimated values. The three reviewed studies carry a common thread in their comments on being able to accurately measure body water as a potential bias to the DXA accuracy. For example, Deurenberg-Yap et al noted that the difference between the 4C model and the DXA for %BF was significantly correlated for the water body fraction (f water ) for males and females (males r 0.51, females r 0.57, p < 0.05) using Pearson s partial correlation coefficients (82). With these findings, Deurenberg-Yap acknowledged that hydration status may have been a bias for the DXA results pertaining to %BF and FM, but stated that this was a possible limitation of the DXA and not a hydration status problem. Comparison of machine brands is important to the literature review. According to a 1994 comparison study by Tothill et al, Hologic DXA machines generally resulted in lower BMC results than those manufactured by Lunar (now GE Lunar Healthcare) (85, 86). The Deurenberg-Yap study noted this phenomenon and used a correction factor of 43
55 1.167 for BMC data to accommodate the use of the Baumgartner et al 4C model equation which had used a GE Lunar DXA in the development of the equation. The researchers, after stating the need and reason for the correction factor in their methods, did not elaborate further in the discussion section on whether this change may have altered their study findings. It is clear in the literature that results from different manufacturers should not be compared (47, 57-59, 87). When fan beam studies are evaluated, the literature demonstrates both overestimation and underestimation of %BF by different DXA fan beam machines. Each study used a 4C reference model for comparison with the DXA. The differences in these studies, those from supporting studies, and review studies evaluated during this paper s development indicate that DXA fan beam technology has good precision, but must be used with caution when considering accuracy in body composition measures (6, 50, 51, 69, 78, 79, 81, 82, 88, 89). Further studies are needed to evaluate DXA accuracy relative to fan beam technology, including those with human cadavers (if allowed by an IRB). This becomes crucial with the increasing use of DXA for body composition measures and as new, upgraded technology changes are made to the current generation of DXA fan beam and narrow fan beam densitometers and software. To demonstrate these machine differences, Soriano et al in 2004 compared BMD and %BF in four DXA machines from two manufacturers. They compared body composition results from different DXA technologies to examine pencil versus fan beam machines (GE Lunar DPX and DPX-L pencil beam scanners; GE Lunar Prodigy fan beam scanners). They also compared body composition results from different 44
56 manufacturers (GE Lunar Prodigy and Hologic Delphi A; both fan beam scanners). The study included 78 adult subjects, males (n = 39), and females (n = 39), ranging in age from 19 to 81 years (means: male = 43 years, female = 50 years) with a BMI range from 17 to 45. Each subject completed four scans (total body, PA spine L1-L4, femur and forearm) on each of the four DXA densitometers over a period of one week. The results of the mean %BF (from total body) and BMD (g/cm 2 ) on all four scanners for male and female groups are reported in Table 2.8. The researchers found significant differences between scanners from the same manufacturer (GE Lunar) and between different manufacturers (GE Lunar and Hologic) (90). Depending on the institution, some IRBs might challenge the unnecessary radiation of such a study. However, this is useful data to demonstrate how different the beams and machine versions might be. 45
57 Females Males Table 2.8 Soriano et al BMD and %Fat Results Site Prodigy NFB DPX PB DPX-L PB Delphi A FB BMD %Fat BMD %Fat BMD %Fat BMD %Fat TB b 22.8 a a 22.5 a,c b 21.1 b c 22.0 c LS a a a b FM FA TB a 34.0 b a 33.2 a b 31.9 d c 33.2 c LS a a a b FM FA KEY NFB = Narrow fan beam; FB = Fan beam; & PB = Pencil beam BMD = Bone mineral density; % Fat = Percent body fat TB = Total body; LS = Lumbar spine (L1-4); FM = Femur; & FA = Forearm Values with different superscript letters for each site measurement are significantly different (p < 0.05) for DXA scanner and gender Results reproduced from Soriano et al (90). Based on the results provided in Table 2.8, the researchers found significant differences between scanners from the same manufacturer (GE Lunar) and between different manufacturers (GE Lunar and Hologic). They found that the GE Lunar DXA machines estimated higher mean %BF than the Hologic Delphi-A (fan beam) and the GE Lunar DPX-L (pencil beam) for both genders (p < 0.05). They also found that all four DXA machines were sex-dependent, each showing a consistent difference between machine and sex (p < 0.05). Regression analysis was performed using the Prodigy as the 46
58 dependent variable. The results found that the GE Lunar machines had higher %BF results (DPX r , SEE 1.31; DPX-L r , SEE 1.48) compared to the Hologic Delphi-A (r , SEE 1.80). The BMD results for TB, LS and the femur were higher for all GE Lunar machines (ranging from r to 0.98, SEE to for DPX; r to 0.98, SEE to for the DPX-L) compared to the Hologic machine (r to 0.97, SEE to 0.035) with only the forearm being higher with the Delphi-A. Overall, the researchers indicated caution when translating results from different DXA machines of different technology and between manufacturers (90). One of the more recent fan-beamed DXA machines on the market is the GE Lunar idxa, the densitometer used in our study. The dual energy, narrow fan-beam idxa was introduced in 2006 with upgraded hardware and software technology as previously discussed. Research to assess its accuracy and precision are ongoing, including studies that compare the idxa with other DXA machines. To investigate differences in body composition measures by the idxa and other DXA machines produced by manufacturer GE Lunar Healthcare, Hull et al in 2009 did a cross calibration study comparing the idxa with the pencil beam DPX-L and the narrow fan beam Prodigy. A total of 99 subjects (47 males and 52 females), ranging in age from 18 to 81 years (mean: male = 43.4 years, female = 48.9 years) with a BMI range from 18 to 46 participated in the study. Due to the upper weight restrictions of the DPX-L and Prodigy machines, subjects with a weight greater than 300 pounds were not included in the study. Body composition measures (total body fat and lean mass, BMC) were performed on all three DXA machines operating in total body scan mode. This was 47
59 Total Body followed by scans of the arms, legs and trunk to acquire regional fat and lean mass values. All scans were completed in a single lab visit. DXA analysis was performed using the software package associated with each specific machine (DPX-L 4.7e, Prodigy 8.80, and idxa 10.40). The reported results of the mean total body BMD (g/cm 2 ), lean mass (kg) and fat mass (kg) for male and female groups are found in Table The subject s mean %BF was not reported in this study. The researchers found significant differences between the three DXA scanners from GE Lunar Healthcare (51). The idxa seemed to underestimate bone and overestimate body fat compared with the other machines, while consistency of lean mass measures depended on gender. Table 2.9 Hull et al DXA Body Composition Results Group Scanner BMD (g/cm 2 ) Lean Mass (kg) Fat Mass (kg) Females idxa b b b DPX-L a a c Prodigy a c a idxa b b a Males DPX-L a a b Prodigy a a b KEY Values with different superscript letters for each scanner are significantly different (p < 0.05) for BMD, Lean Mass, Fat Mass and gender Results reproduced from Hull et al (51). Each DXA in this study had differences in technology and software. To account for this and achieve a direct comparison of the body composition estimates between the 48
60 idxa and other DXA models, the researchers developed translation equations to predict the idxa values from those of the DPX-L and Prodigy (51). This led the researchers to conclude that the accuracy of body composition estimates, when comparing different machines are not meaningful without correct translational equations between machines (51). To investigate the precision and reliability of body composition measures by the GE Lunar idxa, Hind et al in 2011 measured an ethnically diverse group of 52 subjects (18 males and 34 females), ranging in age from 20.1 to 50.5 years (mean for all subjects = years) with varying body sizes, BMI, and activity levels. Each subject completed two consecutive total body scans (with repositioning between scans). Body composition measures included BMC, %Fat, FFM (kg), total body fat (TBF, kg), total body lipids (TBL, kg), percent android (%AF) and gynoid fat (%GF); with results analyzed using EnCore software version Based on the results reported in Table 2.10, the researchers found a precision error of < 1% for all measures except %AF. The precision error found by Hind could have been a result of subject positioning (or repositioning). 49
61 Table 2.10 Hind et al Precision of Two idxa Total Body Composition Measures Measure 1 Measure 2 RMS (SD) CV (%) BMC (kg) (0.54) (0.54) (< 1%) %Fat (9.35) (9.35) (< 1%) Fat (kg) (10.50) (11.00) (< 1%) Lean (kg) (10.56) (10.57) (< 1%) %AF (13.45) (13.37) (> 2%)* %GF (9.62) (9.69) (< 1%) KEY TBBMC = Total body bone mineral content; FFM = Fat free mass TBF = Total body fat; TBL = Total body lipids %AF = Percent android fat; %GF = Percent gynoid fat RMS = Root mean squares CV% = (Standard deviation / mean) x 100 = Precision Error Percent Results reproduced from Hinds et al (91). In this study, Hinds et al reported excellent precision of the GE Lunar idxa for a variety of body types and fat mass levels (91). They found that all body composition measures for the two consecutive total body scans were highly correlated (R 2 = 0.99). The researchers found comparable CV% precision results with the idxa measures found in the study by Rezzi et al 2009 (BMC 0.60%, TBF 0.60%, %TBF 0.60%) (92). The researchers concluded that the idxa precision was improved compared to that of the GE Lunar Prodigy based on a review of results found in the Lee et al 2008 study (91, 93). These comparative conclusions by Hind et al conflict with the Hull study where it was demonstrated that inaccuracies and imprecision of DXA measures can exist even between machines by the same manufacture when compared in the same study (51). 50
62 In summary, the GE Lunar idxa provides one of the most technologically advanced hardware and software packages available today for body composition measures. It combines fast scan times (total body in 7 minutes), low radiation exposure and the ability to delineate three compartment measures (BMD, fat and lean mass). The idxa can be used on a wide variety of subject types from children to the elderly. With its higher end weight limit (450 pounds), and advanced analytic software, it can scan very large, obese patients. While there are multiple studies confirming the accuracy of older DXA machines, only a limited number of studies have been performed on the idxa to date. Based on a review of the current literature, idxa accuracy for BMD and BMC is excellent. The idxa needs further investigations to establish its capability, reliability, and accuracy as a stand-along densitometer and against others within the industry. It also needs studies in children and those with diagnosed conditions, and more studies with obese subjects. 2.4 Comparison of Techniques BOD POD and DXA Other studies have compared the principles and operations of the BOD POD and DXA machines investigating application, accuracy, precision, and areas of controversy with body composition measures. In several of the studies, the DXA is used as the comparison reference model. The research presented has all been performed within the last ten years, used the BOD POD from Life Measurement, Inc., and whole body, fanbeamed densitometers (from Hologic and GE Lunar Healthcare) similar to the GE Lunar idxa used in this study. 51
63 To investigate the validity of the BOD POD and DXA (Hologic QDR Elite 4500A) when measuring %BF, Maddalozzo et al in 2002 measured 43 white college females, ranging in age from 18.5 to 20.7 years (mean = 19.4 years) with an average BMI of 23.4 kg/m 2 (8). The subjects consisted of members from a university volleyball team (n = 10), gymnastics team (n = 14), and a group of active (non-athlete) freshman (n = 19). All testing was done within the same day and the BOD POD measures were performed within 10 minutes of the whole body DXA scan. The BOD POD used predicted lung volume measures based on gender, age and height. The results from the study showed that mean %BF for all groups for the BOD POD was 24.3% (SE = 1.1) and DXA 23.8% (SE = 0.8). Bivariate correlation analysis for the two techniques was r = 0.89, p <.01 while the mean intra-class correlation coefficient was r = 0.92, p <.01. In a direct comparison of the two techniques, the researchers noted that 36 of the 43 DXA participants were within two standard deviations of the mean, while only 32 of the 43 were within this range for the BOD POD. The results led the researchers to conclude that the results for the DXA were slightly more accurate than the BOD POD, but both technique results showed concurrent validity in %BF measures for the female subjects of this study (8). A 2004 study by Ballard et al found similar results investigating the validity of body composition measures (%BF, FFM) of the BOD POD compared to those of a Hologic DXA machine (Hologic QDR 4500 A). They measured 47 white (Euro- American) female college athletes and 24 female non-athletes (control), ranging in age from 18.0 to 21.0 years (mean = 20.0 years) with an average BMI of 22.8 kg/m 2. The 52
64 athlete subjects comprised members of a single university s sports teams (basketball, soccer, volleyball, swimming, fast pitch softball, and track). All testing was done on the same day beginning with a whole body DXA scan followed by the BOD POD measures. With the BOD POD, predicted lung volume measures were utilized (3). The results from this study showed no difference in the mean %BF and FFM for all groups when comparing the BOD POD with the DXA. In the athlete group, %BF and FFM BOD POD was 22.5%, 15.1 kg; DXA 22.0% and 15.1 kg. In the control group, %BF and FFM BOD POD was 28.5%, 45.9 kg; DXA 28.2% and 44.9 kg. Ballard suggests that the BOD POD is a valid measure of %BF and FFM when compared to the DXA (reference model). The researchers found no significant differences between the two methods and that both are accurate (15). The Maddalozzo and Ballard studies found relatively minimal differences in body composition measures between the BOD POD and DXA. In both of these studies, the subjects were all young women (age < 21 years) with only a small subset that were overweight or obese. A study by Frisard et al in 2005 expanded upon these prior studies by comparing body composition measures of overweight individuals during weight loss with the BOD POD, DXA (Hologic 2000), Bioelectrical Impedance Analysis (BIA) and Total Body Water (TBW, estimated using equations from Kushner were not provided in study). They measured 56 subjects, 34 females and 22 males (mean age = 52.0 years), ranging in age from 18.0 to 65.0 years, with a BMI range of 27.0 to 40.0 kg/m 2. All testing was done on the same day with subjects in a fasted state. In this study, BOD POD testing included measurement of the subject s lung volume using the BOD POD s 53
65 breathing circuit apparatus. Repeated breathing measures were performed until a consistent measure of lung volume was achieved (94). BOD POD estimates of %BF were calculated using both the Siri and the Brozek equations to determine which would provide more accurate results in this cohort. The Hologic 2000, a whole body fan-beamed DXA machine, used enhanced manufacturer software (Hologic version 6.8) to analyze the subject s scans and was designated the reference model to be tested against by the other methods. Frisard indicated that the DXA was used to calculate all subject s hydration status using their FFM values, but no further explanation was provided in the study. The results from this study showed significant differences in all body composition measures for all methods before and after weight loss. To focus on the comparison of the BOD POD and DXA, BIA results except for TBW are not reported. The pre-weight loss results for idxa and the two BOD POD equation estimates are detailed in Table The results after weight loss confirmed the weight loss and found similar results between the methods. Table 2.11 Pre-Weight Loss Results of DXA and BOD POD Comparison Method %BF FFM (kg) FM (kg) DXA Pre-Wt Loss 46.1% Post-Wt Loss BP-Siri Pre-Wt Loss 51.7% Post-Wt Loss BP-Brozek Pre-Wt Loss 48.5% Post-Wt Loss Results reproduced from Frisard et al (94). 54
66 Frisard found that at both study points, the two BOD POD equations significantly (p < 0.000) overestimated %BF and FM, while underestimating FFM when compared to the DXA. The researchers also noted the impact of hydration status on the body composition measures in this study and concluded over-hydration may have contributed to overestimation of FFM by the DXA during all phases of the study (94). In this study, the BOD POD overestimated %BF and FM in overweight individuals while underestimating FFM. Frisard suggested that the Brozek values for the BOD POD were better compared with Siri estimates. Frisard suggests that the BOD POD is a valid measure of %BF and FFM when compared to DXA as the reference model, but that BOD POD is less reliable with increasing body fatness (94). The first 3 studies comparing the BOD POD to the DXA used Hologic densitometers for DXA measures. A study by Oates et al in 2006 utilized the GE Lunar Prodigy DXA (a narrow angled, fan-beamed whole body scanner) as the gold standard for comparing %BF and regional %Fat with the BOD POD, BIA, and skinfold technique (SF). They measured 254 subjects, 155 females and 99 males (mean age = 40.2 years), ranging in age from 18.1 to 79.9 years, with a BMI (mean 24.8) ranging from 16.9 to 35.3 kg/m 2. The researchers did not report information regarding testing procedures (testing length, order of tests) and subject status prior to and at testing (status of fasting, hydration or voids). They also did not report testing parameters for lung volume assessment or the equations used for calculating Db and %BF measures in the BOD POD. 55
67 The results from this study showed significant differences for the %BF measures for all methods. To focus on the comparison of the DXA and BOD POD, BIA and SF results are not reported. The results provided are for the total number of subjects reported (n = 254) to have completed testing with both DXA and BOD POD. The mean female %BF for the DXA was 31.6%, for the males 18.0%. The mean female %BF for the BOD POD was 28.6%, for the males 16.6%. Regression analysis of body composition measures for paired combinations was performed using the Lorentzian error distribution method. Results were reported by %BF comparison regression between the DXA and BOD POD, with reporting based on intercept, slope and fat between the DXA (designated as the x-intercept) and BOD POD (designated as the y-intercept). The fat percent indicates the n = number of females and males in each group where %BF is equal between the two methods. Results for the female group found an intercept of 1.570, slope of (p = 0.05), and fat = 11.3%. For males, intercept was , slope and fat = 1.0%. From these results, Oates found that the Prodigy had higher estimates of %BF than the BOD POD. Descriptive statistics were then reported for %BF regression residuals for DXA (x-intercept) and BOD POD (y-intercept) as follows: Females DXA r = 0.87, SEE 4.7; males DXA r = 0.86, SEE 4.3. Based on these results, Oates found good correlation between the DXA and BOD POD methods. Further regression analysis of the residuals was performed using the Prodigy as the independent variable for age, height, weight and lean tissue mass. The results reported that the BOD POD residual dependencies for males was significant (p = 0.05) for age (slope , range = 4.9) and lean tissue mass (slope = , range -5.7). Range was defined by Oates as the 56
68 systematic %BF variation over the range of the regression. No significant difference was found for the female group (13). Oates found that the Prodigy DXA overestimated %BF compared to the BOD POD, with a larger difference noted in females than the males and that it was inappropriate to compare %BF across methods (13). There are a limited number of studies that compare fan-beamed DXA machines and the BOD POD. This paper reported on several which had hardware technology similar to that of the GE Lunar idxa, noting that the software differences were likely substantial between machines. Studies specifically comparing the idxa and BOD POD were not found for inclusion in this paper. As reported, the DXA and BOD POD use distinctly different approaches to body composition measures, with each having a significant volume of research supporting their use. As shown in the literature review, both methods provide accurate body composition measures and are precise with repeated measures using a specific machine. However, both methods rely on calculations and approaches that have been assumed to be correct but may be false or inaccurate to some degree. These assumptions and the differences in their technologies make them difficult to compare adequately. Based on the studies cited herein, the BOD POD underestimates very lean individuals while overestimating %BF in obese individuals. The DXA also tends to overestimate individuals %BF and FM in obese individuals. In addition, DXA body composition results may be different depending on the manufacture, the hardware technology (pencil versus fan-beamed) and the manufacturer s software package. All of these issues make comparisons between the two methods problematical. In the Comparison of Technique section, two of the studies cited found minimal to no 57
69 differences when measuring young, adult women. In both those studies, there were limited numbers of either overweight or obese individuals. Another study used both female and male subjects during a period of weight loss with some that were obese. That study found that the BOD POD overestimates %BF and FM in overweight individuals while underestimating FFM in comparison to DXA. The last study showed that the DXA overestimated %BF compared to the BOD POD. Taken together, these studies highlight the difficulties in comparing body composition measures across different technologies. 58
70 CHAPTER 3 METHODS The experimental design was a case/control (matched) study of qualified female runners from a parent study examining the Female Athlete Triad (Approved IRB Protocol 2009H0177). The parent study measured 125 adult women (> 18 years old) who ran a minimum of 15 miles per week for the most recent 6 weeks. Subjects reported no known thyroid or adrenal issues, and were not on medications known to affect bone metabolism. Subjects were asked to complete a three day food and activity record, an on-line questionnaire prior to the lab visit, and their intent to consent at the lab visit. The on-line questionnaire included demographic, menstrual history, and multiple measures of body image, depression and calcium intake. After signing informed consent, subjects were asked to provide a urine sample to test hydration status and screen for pregnancy. This was followed by a change of clothing as necessary to be free from metal in clothing and removal of all jewelry. Subjects whose urine sample was positive for pregnancy would have been excluded from the idxa study and none were identified. Body weight and height were measured to the nearest tenth of a pound and tenth of a centimeter using standardized stadiometer techniques on a 59
71 Healthometer digital scale. These measures were entered into the EnCore software demographic panel (idxa), along with the subject s study ID, date of birth, and selfidentified ethnicity. In addition to the above pre-scan protocol, a blood sample was drawn from each hydrated subject as part of the Parent Study 2009H0177 protocol, and dehydrated subjects were drawn at a later time. Blood analyses included osmometry, hematocrit, hemoglobin, prealbumin, cortisol, thyroid stimulating hormone (TSH), free thyroxine (T4), and vitamin D. The idxa scans were performed in a four scan sequence with one person operating the idxa densitometer for all subjects and scan analyses. The total body scan was performed followed by the non-dominant hip, lumbar spine (L1-4), and nondominant forearm. For each scan, the subject was positioned per manufacturer protocol for the specific areas of interest and repositioned as needed (49). The total scan time for all four scans was approximately 15 minutes. After the scans were completed, the data was analyzed per protocol and the results shared with subjects. If the subject met the criteria for the BOD POD study protocol (IRB approved protocol 2009H0261), the intent and procedures of the study were provided to the subject and they were invited to participate. If they agreed to participate, informed consent for the additional measure was obtained and the BOD POD study procedures were initiated as previously outlined in Section 2.2 Air Displacement Plethysmography (correct clothing and measurement in the BOD POD). 60
72 3.1 Participant Selection and Matching Subjects from the parent study with a bone mineral density less than 1 standard deviation below age-matched norms (< -1.0 Z-score) for total body or lumbar spine were invited as cases to the BOD POD study. Controls were matched and invited based on the following criteria: 1. Normal bone mass (higher than Z-score of 1.0 for total body and higher than average 0.0 for lumbar spine). 2. Body size similar to case: within + ten pounds of weight and within + three inches of height. 3. Age similar to case: within + three years. 4. Menopausal status similar to case if possible. The planned protocol allowed for 60 participants (30 cases, 30 controls) per the power calculation. The actual protocol identified 22 cases, but two of the subjects were unable to be matched due to extreme thinness. Identified cases included four women 40 years old and older who were initially matched with younger subjects in an attempt to maximize subject numbers. Analysis of the data set demonstrated a significant difference between groups with the age bias so all mismatched age pairs were dropped along with one outlier (> 3 standard deviations) to yield a better matched sample of 30 women (15 per group). Usual BOD POD measures were taken on the same day as the idxa visit, but in some cases a control match subject was identified after they had visited, and were measured on a different day. To visualize the steps taken for each study, the protocols are provided in the Table
73 Table 3.1 BOD POD Case-Control Procedure Summary Parent study protocol (2009H0177) BOD POD study protocol (2009H0261) Informed consent and idxa information sheet Informed consent Change clothing if necessary to be non-metal Change to appropriate clothing and void Urine sample BOD POD measures according to machine protocol USG for hydration and negative pregnancy Blood sample idxa measures according to machine protocol Results reviewed Results reviewed 3.2 Statistical methods Data for the parent study were entered and checked into Excel (MS Office 2010). Each machine was capable of exporting data in a digital format. Data from the machines were matched and merged according to subject number to the standard excel spreadsheet. The combined data was uploaded into SAS version 9.2 (SAS Institute Inc, Cary, NC) for statistical analysis. Group similarities and differences to confirm matching followed T-test procedures by groups (case/control). The primary analysis of interest to compare the BOD POD to idxa percent body fat differences relied on a newly created variable 62
74 where idxa minus BOD POD values were calculated, and this variable was named pdif. A standard T-test procedure was used to determine if there was a significant difference between the control and case groups for matching variables as well as the pdif variable. As part of the T-tests, the equality of the variances was checked using the Folded F method where the p-value was desired to be greater than 0.20 for variances to be assumed equal. Unequal variances used the Satterwaite probability while equal variances relied on pooled method for T-test values. Further analysis to identify potential influencing factors followed a general linear modeling procedure (Proc GLM). The initial analysis examined pdif as the dependent variable exploring variables for age, height, weight, fat mass, total body and lumbar bone mass, cortisol, thyroid hormones, osmometry, caloric balance, and body image variables. Regression models were also examined using the BOD POD percentage body fat (pfatbp) as the dependent variable and the percentage body fat per the idxa (pfatidxa) and other potential predictors (as cited above) to explore the possible predictors (independent variables). Model fitness and assumption of centrality were checked by examining the distribution of the model residuals where the probability of the distribution higher than 0.20 was desirable. Statistical significance for all tests, models and factors was apriori set for p <
75 CHAPTER 4 RESULTS The results are reported for the final 30 subjects (15 pairs). Demographic information is reported in Table 4.1 alongside the T-test analysis to confirm sample matching. There were no differences between the case and control groups for age, height, or weight. The data did confirm that the case and control groups had significant differences in the bone mass variables (total body and lumbar spine) as designed. Table 4.1 Subject Characteristics and T-test Pairing Sample n = 30 All subjects Mean (SD) Cases Average (SD) Range Controls Average (SD) Range Age (years) 35.5 (9.79) Height (inches) 64.3 (2.37) Weight (pounds) (12.10) TB Z 1.09 (0.99) L-spine Z (1.31) 34.9 (10.50) 19.8 to (2.62) 61.0 to (12.04) 97.8 to (0.55) to (0.61) -2.5 to (9.36) 20.7 to (2.19) 59.3 to (12.29) to (0.68) 1.00 to (0.65) 0.10 to
76 4.1 Comparison of Measurement Differences between BOD POD and idxa The primary aim of the study was to compare the differences in percent body fat from the BOD POD and idxa measures between the groups. The T-test procedure on the pdif variable (percent difference between idxa and BOD POD) demonstrated equal variances (p = ). For the control group pdif was while pdif for the cases was The T-test (Satterwaite) comparison of the means yielded p = to conclude there was no significant difference between the groups. Though open to supposition, it is important to remember that testing included 15 subjects in each group (low power) and the probability of may be considered by some as a trend. The percentages body fat from the BOD POD and idxa machines were highly correlated (r = , p < ). The correlation procedure was also evaluated by the class variable case/control to demonstrate small differences in this relationship between groups. The correlations are strong but not perfect. Figure 5 demonstrates these relationships. 65
77 Fig. 5 Percent Fat for BOD POD Versus idxa By Group Linear modeling allowed for exploration of potential contributors to the differences between the BOD POD and idxa body fat estimates. When pdif was modeled as the dependent variable with the case control class variable modeled with the other variables of interest as independent variables, it was noted that total body bone mineral density (TBBMD), free T4 (free thyroid hormone T4), osmometry and menopausal status were included in respective bivariate models. The details of these 66
78 models are included in Table 4.2. With TBBMD being the strongest bivariate predictor, trivariate models to include case-control and TBBMD were formed with osmometry, free T4 and menopausal status. Similarly, these were strong candidates for model inclusion. It is noteworthy that the menopausal status indicator included 4 subjects who were unsure of menopausal status (likely peri-menopausal), and two of those subjects were in the control and two in the case groups. Because the case control variable was created using bone mass status, further modeling excluded the class variable and looked for the strength of these same relationships to the pdif variable. Model results were similar without the case-control variable and the strong predictor candidates were TBBMD, lumbar spine BMD, menopausal status and free T4. The hydration variable was not as strong of a predictor with the case-control variable removed. Instead of only relying on the evaluation of the pdif variable in this modeling, the analysis allowed for modeling percent body fat of the BOD POD as the dependent variable with percent body fat from the idxa (pfatidxa) as the primary independent variable. Modeling pfatidxa to predict the percent fat BOD POD (pfatbp) found a model R 2 of (p < ). Adding other variables of interest to evaluate each bivariate model led to similar results where TBBMD, menopausal status, osmometry and free T4; all were significant in bivariate models. Stepping to a trivariate model where idxa percent fat and TBBMD were modeled with osmometry, free T4 and menopausal status only yielded one model where all predictors were significant: Percent body fat BOD POD = Percent body fat idxa (+) TBBMD (+) menopausal status 67
79 Details to follow this model development in terms of R 2, beta estimates and significance are included in Table 4.2. This final model was examined for goodness of fit and the assumption of normal distribution by exporting the model residuals, and evaluating the Shapiro-Wilk test statistic (p = ), thus the residuals were determined to be normally distributed. Controlling for TBBMD as well as menopausal status improved the prediction of BOD POD % body fat from the idxa percent body fat. 68
80 Trivariate Bivariate Univariate Table 4.2 Stepwise Linear Modeling to Predict % Body Fat from BOD POD Linear Model Var 1 Var 2 Var 3 Model P Model Estimate P-Value R 2 idxa% < idxa% < idxa% TBBMD < idxa% < TBBMD Menop < idxa% < Menop Free T4 < idxa% < Free T Osmo < idxa% < Osmo idxa% TBBMD Menop < idxa% < TBBMD Menop Free T4 < idxa% < TBBMD Free T KEY Var = Variable TBBMD = Total body bone mineral density Menop = Menopausal Osmo = Osmometry Osmo < idxa% < TBBMD Osmo
81 CHAPTER 5 DISCUSSION This study investigated the %BF error measurements between the GE Lunar idxa and the BOD POD in a case-control study of 15 pairs of non-menopausal adult women. Although there have been other studies that compared various types of DXA densitometers with the BOD POD, this may have been the first that performed this comparison using the GE Lunar idxa. The studies that used fan-beamed DXA densitometers compared to the BOD POD are limited, but most suggest an error measurement of between 1 to 3 %BF (5, 8, 10, 15, 69, 73, 89, 94, 95). This study agrees with this estimate of error in that, for the groups studied, mean %BF idxa = 25.0% and %BF BOD POD = 23.8% with a non-significant difference between the two methods of 1.2%. Part of the observed differences seen in this study and other similar studies might be a result of improper test conditions. In the BOD POD, this may be a result of subjects not wearing appropriate clothing (tight swim suit or spandex shorts) and a swim cap. For valid test results, it is important that the clothing be correct to decrease the error caused from differences between adiabatic air and isothermal air. More clothing can cause the 70
82 BOD POD to underestimate %BF and this problem increases with more clothing (3, 35, 36, 96). A similar problem is found with hair. The more hair a person has that is not covered or accounted for, the more likely the BOD POD estimate of %BF will be underestimated (3, 26, 29, 35). In addition, subject movement can be a cause of error due to its impact on air volume and needs to be accounted for if it is observed occurring (26, 29, 35). Our study adequately controlled for clothing (and the required cap), body hair and subject movement. However, along the same line of thought about compressible air, it is noteworthy that these subjects may have great differences in metabolism, thus affecting this same isothermal air issue. Another consideration for potential error is room temperature and humidity where the BOD POD testing is performed. Several authors have addressed this issue, including recent research by Gillan with the BOD POD used in this study (35, 36, 97-99). Gillan noted that the BOD POD is responsive to changes in environmental temperature and humidity, and this may impact the body composition measures performed on the same subject at different times and especially between different machines in different locations. Climate control within the room housing the BOD POD is important and likely deserves to be measured and monitored. The room where the BOD POD in our study is housed is thermostatically controlled, however, early morning measures were noticeably cooler and not tracked early in the study. This may cause subjects to become thermogenic at individual levels and also influence the isothermal air layer around the subject. The results of this study indicated that cases (low bone mass) more closely matched in the BOD POD versus idxa measures, and hypothetically this could be a reflection of 71
83 suppressed response to a cold room. It is also noteworthy that thyroid hormones (as a potential indicator of metabolism) were included in various prediction models. Exploration of the impact of metabolic rate on the accuracy of BOD POD measures needs formal evaluation. Another source of potential error with BOD POD measures is whether predicted lung volumes are used versus actual lung (thoracic gas) volume measured during testing using the BOD POD s lung circuit. This issue has been raised by several authors, including McCrory and Collins who found no difference between the two approaches for thoracic gas measures (29, 35, 37, 97, 98, 100). However, others have noted modest differences between the two measures with direct testing (36, 38, 101). A review of the literature notes that, for measured lung volumes, the issue is whether the subjects can correctly perform repeated breathing maneuvers on the BOD POD lung circuit and produce similar results. As indicated by Collins in his 2004 study, it is extremely unlikely that the factors contributing to differences in repeat measures of thoracic gas volume can be eliminated (98). Since most researchers agree that the differences in measures between predicted and measured lung volumes are small, our study used predicted lung volumes for all BOD POD testing. The idxa and DXA machines in general, may produce potential errors of body composition measures related to the machine s operation. Most of the research found in the literature notes that a single operator was responsible for the body composition measures. The DXA, no matter the software package, relies on the machine operator for proper positioning and repositioning of subjects to achieve correct measures within 72
84 established parameters. A lack of training, experience or following manufacturer recommended guidelines can lead to errors in body composition measures. Another area of potential error for all DXA machines is the differences found between DXA manufacturers. There are significant differences in DXA machines (hardware) and their specific software packages (algorithms), all which may contribute to differences in body composition measures. The hardware differences arise when using a different DXA machines for secondary testing or with comparative research. The differences in technological capability can be profound, such as that found between a DXA using older pencil beam technology versus one that uses newer dual-energy, narrow fan beamed technology (47, 51, 58, 59, 88). In addition to the above cited hardware differences are the assumed variations in the analytic software employed by different manufactures, especially those by GE Healthcare, Norland, and Hologic. The proprietary analytic software for body composition measures is based on mathematical algorithm constructs specific to a particular manufacture and DXA machine (or model line). As was outlined in the 2010 report by the International Atomic Energy Commission, these differences in software capability between the manufactures can impact the measures of specific regions of interest (ROIs), and how well a particular DXA is able to parse out different tissue types (59). These differences, combined with a lack of common industry standards for bone density and body composition measures, make it difficult to directly compare estimates between devices and can lead to errors of body composition measures (47, 51, 58, 59, 88). 73
85 Another factor that may lead to potential errors in body composition measures is related to the discussion of manufacturer hardware and software capability. The ability of any DXA machine to measure body composition is directly linked to the limitations and/or problems inherent in the technology itself. DXA machines can only solve for two tissues at a time and must be able to parse out the different tissue types (bone, lean and fat) using the machines hardware (beam type, detector) and analytic software. The potential error that may arise from this model is that accurate estimates are assumed to be true based on calculations made by the manufacturer s analytical software and its ability to parse the different tissue types from each other. This can be particularly difficult when differentiating soft tissue from bone due to varying thickness of each tissue in different areas of the body and with obese subjects. There are several researchers who believe that this issue is an important problem with DXA technology and can lead to significant differences in body composition estimates (23, 47, 58-64). The idxa used in our study uses some of the most advanced, upgraded technology available in the industry. However, these questions remain even for the idxa and need continuing research to determine the accuracy of this technology. DXA fan beam x-ray magnification may be a potential source of error in body composition measures. The issue of fan beam x-ray magnification errors is an inherent problem related to the physics of fan beam technology. As previously described, as the distance from the x-ray source decreases from the scanned structures, the greater the magnification error will become with inherent increases in bone width estimates (65-69). This effect is especially pronounced in children, obese and elderly subjects whose body 74
86 size and tissue thickness is not within the expected range of a typical adult. Magnification can significantly alter BMC, bone area (area), and bone geometry estimates, which in turn impacts body composition estimates in whole body densitometry scanning (65-68). The GE Lunar idxa used in this study uses the TruView TM that the manufacturer states can correct for magnification error (49). It is important that magnification error associated with fan beam DXA technology be taken into account when comparing body composition measures with older DXA machines. An area of potential error for both the BOD POD and idxa is that of subject hydration. The literature has significant consideration of this issue for the DXA. Many researchers believe that hydration may have a limited impact on body composition measures, especially the FFM and %BF (46, 71-73). However, Lohman and Chen, in the second edition of Human Body Composition note that hydration may account for a 1% to 2.5% difference in the measure of %BF (73). It is well documented that extremes of hydration status can impact body weight in disease states such as congestive heart failure and ascites (70, 72). Based on the literature, it is clear that hydration may play a role in body composition measure, but the question remains of how much it changes the estimates. The BOD POD has limited research in this specific area and hydration findings are related to comparisons of BOD POD versus multi-component models. Several researchers believe that differences in %BF found between BOD POD and a fourcomponent may be related to the water fractions in the FFM (26, 30, 33). The literature indicates that the %BF differences found between the BOD POD and DXA is 1% to 3%. This margin is within the potential range of the effect of hydration on %BF considered 75
87 for both methods and needs further investigation as a potential source of error. Further studies on hydration status are needed, especially with direct comparisons of BOD POD and DXA body composition measures. In our study, hydration status was evaluated through urine osmometry prior to the idxa measures. However, this testing was not verified to have been adhered to for subjects that had to be scheduled on different days for their BOD POD testing. Because of this, hydration status could only be ascertained for the idxa and is reported as such in the study results. Gender is another area of potential error for both methods. Research with each method singly and those comparing the BOD POD and DXA directly, have shown significant differences between genders (10, 26, 73, 89, 94, 95, ). The researchers provide explanations for these differences as being related to body size, bone density, hydration, and other factors. Any research with these two methods that uses mixed gender groups must account for the individual gender differences. In our study, we only used female subjects so gender differences did not add potential error to our results. Of consideration for this study, a review of the literature sought studies that compared the BOD POD and idxa that evaluated osteopenic women with a preference for those measured by a fan beam DXA or idxa. No studies were found in the literature within these specific parameters. Based on the findings of this small study, further investigations comparing the BOD POD and idxa with osteopenic women, especially those who are younger women that are already exhibiting bone insufficiency are needed. In addition, areas of consideration within this group that could influence body 76
88 composition measures and bone density include diet, calorie intake and/or expenditure, energy metabolism, cortisol levels, thyroid function, and vitamin D status. For both the BOD POD and idxa, considerations for the source of differences that are covered in the literature include gender, ethnicity, specific illness conditions (including obesity), hydration, differences between the methods, and various manufacturers. The literature does not include analysis that examines the potential contribution of bone mass to the error in adult female runners within a fairly lean and homogenous range of body fatness. The range of body fatness found in our study for the BOD POD and idxa was 11.9% to 34.9% and 15.4 to 36.3% respectively. The range in the difference in percent body fat between the two methods was -2.15% to 3.60%, which is within the ranges reported in the literature. Though the formal planned evaluation of the differences between groups indicated no formal significant difference, there was evidence in regression modeling that bone mass may play a role in the difference in measures between the machines. Limitations A major limitation of this study was small sample size. While no significant differences were found in %BF in the comparison of the BOD POD and idxa, several trends were established that indicate the need for further studies using larger samples. Another limitation was in the time frames that particular subjects who qualified for the study received their BOD POD measures. Several of the subjects did not get measured with the BOD POD on the same day as the idxa, and may not have had their hydration 77
89 status evaluated. Future research would be better served by controlling for these factors. In addition, another limitation was not taking temperature and humidity readings for each subject s BOD POD measures. This issue was not discovered in the literature until after the study had begun and subjects had already received their BOD POD measures. Temperature and humidity measures were instituted during the study, but those findings were not reported due to the incompleteness of the data. Future Research Future research for both methods needs to continue the evaluation of the underlying two and three compartment methods for validity. The BOD POD would benefit from studies that considered subject hydration, metabolism and heat factors both inside and outside of the machine. The idxa would benefit from more accuracy studies, both individually and in comparison to other fan-beamed DXA machines. All DXA machines would benefit from studies to standardize DXA protocols and algorithms across the industry. For future comparison studies of the BOD POD and idxa, research is needed that compares gender and ethnic group differences among the general population and athletes. Conclusion This small case-control study sought to compare the error differences in a select group of female runners with the BOD POD and GE Lunar idxa. While no significant differences were found in %BF between the two methods, regression analysis revealed 78
90 several trends relating to bone status, menopausal state, thyroid hormone levels and hydration. Further studies are needed to confirm and build on this preliminary work and to identify potential causal factors in a larger population. 79
91 REFERENCES 1. Brant R. Power/Sample Size Calculator. Internet: (accessed 01/ ). 2. McCrory MA, Gomez TD, Bernauer EM, Mole PA. Evaluation of a new air displacement plethysmograph for measuring human body composition. Med Sci Sports Exerc 1995;27: Dempster P, Aitkens S. A new air displacement method for the determination of human body composition. Med Sci Sports Exerc 1995;27: Laskey MA. Dual-energy X-ray absorptiometry and body composition. Nutrition 1996;12: Ball SD, Altena TS. Comparison of the Bod Pod and dual energy x-ray absorptiometry in men. Physiol Meas 2004;25: Andreoli A, Scalzo G, Masala S, Tarantino U, Guglielmi G. Body composition assessment by dual-energy X-ray absorptiometry (DXA). Radiol Med 2009;114: Koda M, Ando F, Nino N, Tsuzuku S, Shimokata H. Comparison between the air displacement method and dual energy x-ray absorptiometry for estimation of body fat. J Epidemiol 2000;10:S Maddalozzo GF, Cardinal BJ, Snow CA. Concurrent validity of the BOD POD and dual energy x-ray absorptiometry techniques for assessing body composition in young women. J Am Diet Assoc 2002;102: Wagner DR, Heyward VH. Techniques of body composition assessment: a review of laboratory and field methods. Res Q Exerc Sport 1999;70: Heyward V, Wagner D. Applied Body Composition Assessment - Second Edition. Champaign, IL: Human Kinetics,
92 11. Tothill P, Hannan WJ. Re: "DXA in vivo BMD methodology: an erroneous and misleading research and clinical gauge of bone mineral status, bone fragility, and bone remodeling" by H.H. Bolotin (found in: Bone 2007; 41: ). Bone 2008;42: Verdich C, Barbe P, Petersen M, et al. Changes in body composition during weight loss in obese subjects in the NUGENOB study: Comparison of bioelectrical impedance vs. dual-energy X-ray absorptiometry. Diabetes Metab 2011; 13. Oates MK, Puhl S, Wacker WK. Total body %fat - Comparison of DXA with other body composition methods. Journal Bone Mineral Research 2006;21:S Beeson WL, Batech M, Schultz E, et al. Comparison of body composition by bioelectrical impedance analysis and dual-energy X-ray absorptiometry in Hispanic diabetics. Int J Body Compos Res 2010;8: Ballard TP, Fafara L, Vukovich MD. Comparison of Bod Pod and DXA in female collegiate athletes. Med Sci Sports Exerc 2004;36: Warner ER, Fornetti WC, Jallo JJ, Pivarnik JM. A Skinfold Model to Predict Fat-Free Mass in Female Athletes. J Athl Train 2004;39: Brozek J, Grande F, Anderson JT, Keys A. Densitometric Analysis of Body Composition: Revision of some Quantitative Assumptions. Ann N Y Acad Sci 1963;110: Widdowson EM, McCance RA, Spray CM. The chemical composition of the human body. Clinical Science 1951; Forbes RM, Cooper AR, Mitchell HH. The composition of the adult human body as determined by chemical analysis. Journal of Biological Chemistry 1953; Siri WE. The gross composition of the body. In: Anonymous New York: Academic Press, 1956: Siri WE, ed. Body composition from fluid spaces and density: Analysis of methods. Washington, D.C.: National Academy of Science, Lohman TG. Applicability of body composition techniques and constants for children and youths. Exerc Sport Sci Rev 1986;14: Ellis KJ. Human body composition: In vivo methods. Physiological Reviews 2000;
93 24. Behnke AR, Feen BG, Welham WC. The specific gravity of healthy men. Body weight and volume as an index of obesity. Journal of the American Medical Association 1942;118: Wang ZM, Deurenberg P, Wang W, Pietrobelli A, Baumgartner RN, Heymsfield SB. Hydration of fat-free mass: Review and critique of a classic body composition constant. American Journal of Clinical Nutrition 1999;69: Fields DA, Goran MI, McCrory MA. Body-composition assessment via airdisplacement plethysmography in adults and children: a review. Am J Clin Nutr 2002;75: Life Measurement Inc. BOD POD - Photo from Labs in Life, Columbus Ohio 2011; 28. Cosmed. BOD POD Component Diagram - Retrieved from November 5, Internet: (accessed 11/5 2011). 29. Fields DA, Hunter GR, Goran MI. Validation of the BOD POD with hydrostatic weighing: influence of body clothing. Int J Obes Relat Metab Disord 2000;24: Fields DA, Wilson GD, Gladden LB, Hunter GR, Pascoe DD, Goran MI. Comparison of the BOD POD with the four-compartment model in adult females. Med Sci Sports Exerc 2001;33: Bentzur KM, Kravitz L, Lockner DW. Evaluation of the BOD POD for estimating percent body fat in collegiate track and field female athletes: a comparison of four methods. J Strength Cond Res 2008;22: Biaggi RR, Vollman MW, Nies MA, et al. Comparison of air-displacement plethysmography with hydrostatic weighing and bioelectrical impedance analysis for the assessment of body composition in healthy adults. Am J Clin Nutr 1999;69: Collins MA, Millard-Stafford ML, Sparling PB, et al. Evaluation of the BOD POD for assessing body fat in collegiate football players. Med Sci Sports Exerc 1999;31: Wagner DR, Heyward VH, Gibson AL. Validation of air displacement plethysmography for assessing body composition. Med Sci Sports Exerc 2000;32: Collins AL, McCarthy HD. Evaluation of factors determining the precision of body composition measurements by air displacement plethysmography. European Journal of Clinical Nutrition 2003;57:
94 36. Anderson DE. Reliability of air displacement plethysmography. J Strength Cond Res 2007;21: McCrory MA, Mole PA, Gomez TD, Dewey KG, Bernauer EM. Body composition by air-displacement plethysmography by using predicted and measured thoracic gas volumes. J Appl Physiol 1998;84: Demerath EW, Guo SS, Chumlea WC, Towne B, Roche AF, Siervogel RM. Comparison of percent body fat estimates using air displacement plethysmography and hydrodensitometry in adults and children. International Journal of Obesity and Related Metabolic Disorders 2002;26: Levenhagen DK, Borel MJ, Welch DC, et al. A comparison of air displacement plethysmography with three other techniques to determine body fat in healthy adults. JPEN J Parenter Enteral Nutr 1999;23: Vescovi JD, Zimmerman SL, Miller WC, Hildebrandt L, Hammer RL, Fernhall B. Evaluation of the BOD POD for estimating percentage body fat in a heterogeneous group of adult humans. Eur J Appl Physiol 2001;85: Vescovi JD, Hildebrandt L, Miller W, Hammer R, Spiller A. Evaluation of the BOD POD for estimating percent fat in female college athletes. J Strength Cond Res 2002;16: Petroni ML, Bertoli S, Maggioni M, et al. Feasibility of air plethysmography (BOD POD) in morbid obesity: a pilot study. Acta Diabetol 2003;40 Suppl 1:S Aasen G, Fagertun H, Halse J. Body composition analysis by dual X-ray absorptiometry: in vivo and in vitro comparison of three different fan-beam instruments. Scand J Clin Lab Invest 2006;66: Mazess RB, Peppler WW, Gibbons M. Total body composition by dual-photon ¹⁵³GD absorptiometry. American Journal of Clinical Nutrition 1984;40: Mazess RB, Barden HS, Bisek JP, Hanson J. Dual-energy X-ray absorptiometry for total-body and regional bone-mineral and soft -tissue composition. American Journal of Clinical Nutrition 1990;51: Pietrobelli A, Formica C, Wang Z, Heymsfield SB. Dual-energy X-ray absorptiometry body composition model: Review of physical concepts. American Journal of Physiology 1996;271:E941-E
95 47. Sakai Y, Ito H, Meno T, Numata M, Jingu S. Comparison of body composition measurements obtained by two fan-beam DXA instruments. J Clin Densitom 2006;9: Fornetti WC, Pivarnik JM, Foley JM, Fiechtner JJ. Reliability and validity of body composition measures in female athletes. Journal of Applied Physiology 1999;87: GE Medical Systems. GE Healthcare - Lunar idxa. 2006; Albanese CV, Diessel E, Genant HK. Clinical applications of body composition measurements using DXA. J Clin Densitom 2003;6: Hull H, He Q, Thornton J, et al. idxa, Prodigy, and DPXL dual-energy X-ray absorptiometry whole-body scans: a cross-calibration study. J Clin Densitom 2009;12: Cole L, McClung M. Cross calibration of GE-Lunar idxa and Prodigy bone densitometers (abstract). Journal of clinical densitometry: the official journal of the International Society for Clinical Densitometry 2006;9:P GE Healthcare. idxa: GE Medical Systems EnCore operator s manual and product information. 54. Berlin E, Marcus C, Ruiz JC, Eschard JP, Leutenegger M. Measurement of visceral adipose tissue by DXA combined with anthropometry in obese humans. International Journal of Obesity 2000;24: Sutcliffe JF. A review of in vivo experimental methods to determine the composition of the human body. Physics in Medicine and Biology 1996;41: Aasen G, Fagertun H, Tonstad S, Halse J. Leg fat mass as measured by dual X-ray absorptiometry (DXA) impacts insulin resistance differently in obese women versus men. Scand J Clin Lab Invest 2009;69: Tothill P, Laskey MA, Orphanidou CI, van Wijk M. Anomalies in dual energy X-ray absorptiometry measurements of total-body bone mineral during weight change using Lunar, Hologic and Norland instruments. Br J Radiol 1999;72: Yang Y, Zhu WD, Paton NI. Comparison of dual-energy X-ray absorptiometry machines measuring fat distribution changes of HIV-associated lipodystrophy. Antiviral Therapy 2004;9:
96 59. Davidson L, Ellis K, Heymsfield S, Lohman T. Dual Energy X-ray Absorptiometry For Bone Mineral Density and Body Composition Assessment. International Atomic Energy Agency Human Health Series 2010;15: Bolotin HH, Sievanen H, Grashuis JL. Patient specific DXA bone mineral density inaccuracies: Quantitative effects of non-uniform extraosseous fat distribution. Journal Bone Mineral Research 2003;18: Wang MC, Bachrach LK, Van Loan M. The relative contribution of lean tissue mass and fat mass to bone density in young women. Bone 2005;37: Javed F, Wang J, Colt E. The validity of idxa in determining bone mineral content (BMC), bone mineral density (BMD) and body fat (BF) with changes in subcutaneous tissue thickness (STT). International Journal of Body Composition Research 2008;6:15-P. 63. Javed F, Yu W, Thornton J, Colt J. Effect of fat on measurement of bone mineral density. International journal of body composition research 2009;7: Colt E, Kalvesten J, Cook K, Khramov N, Javed F. The effect of fat on the measurement of bone mineral density by digital x-ray radiogrammetry (DX-BMD). International journal of body composition research 2010;8: Griffiths MR, Noakes KA, Pocock NA. Correcting the magnification error of fan beam densitometers. Journal Bone Mineral Research 1997;12: Koo WW, Hammami M, Shypailo RJ, Ellis KJ. Bone and body composition measurements of small subjects: discrepancies from software for fan-beam dual energy X-ray absorptiometry. J Am Coll Nutr 2004;23: Tothill P, Hannan WJ. Precision and accuracy of measuring changes in bone mineral density by dual-energy X-ray absorptiometry. Osteoporos Int 2007;18: Helba M, Binkovitz LA. Pediatric body composition analysis with dual-energy X-ray absorptiometry. Pediatr Radiol 2009;39: Toombs RJ, Ducher G, Shepard JA, De Souza MJ. The impact of recent technological advances on the trueness and precision of DXA to assess body composition. Obesity 2011;July: Porth CM. Pathophysiology: Concepts of Altered Health States - Sixth Edition. Philadelphia, Pennsylvania: Lippincott-Raven,
97 71. Pietrobelli A, Wang Z, Formica C, Heymsfield SB. Dual-energy x-ray absorptiometry: fat estimation errors due to variation in soft tissue hydration. American Journal of Physiology 1998;274:E St-Onge MP, Wang Z, Horlick M, Wang J, Heymsfield S. Dual-energy x-ray absorptiometry lean soft tissue hydration: independent contributions of intra- and extra-cellular water. American Journal of Physiology Endocrinology and Metabolism 2004;287:E Heymsfield SB, Lohman TG, Wang Z, Going SB, eds. Human Body Composition - 2nd Edition. Champaign, IL: Human Kinetics, Heymsfield SB, Wang ZM, Withers RT. Multicomponent molecular level models of body composition analysis. In: Roche, AF, Heymsfield, SB and Lohman, TG, eds. Human Body Composition. Champaign, IL: Human Kinetics, 1996: Wang ZM, Deurenberg P, Guo SS, et al. Six-compartment body composition model: inter-method comparisons of total body fat measurement. Int J Obes Relat Metab Disord 1998;22: Lohman TG, Harris M, Teixeira PJ, Weiss L. Assessing body composition and changes in body composition: Another look at dual-energy x-ray absorptiometry. Annals of the New York Academy of Sciences 2000;904: Van Der Ploeg GE, Withers RT, Laforgia J. Percent body fat via DEXA: comparison with a four-compartment model. Journal of Applied Physiology 2003;94: Williams JE, Wells JC, Wilson CM, Haroun D, Lucas A, Fewtrell MS. Evaluation of Lunar Prodigy dual-energy X-ray absorptiometry for assessing body composition in healthy persons and patients by comparison with the criterion 4-component model. Am J Clin Nutr 2006;83: Santos DA, Silva AM, Matias CN, Fields DA, Heymsfield SB, Sardinha LB. Accuracy of DXA in estimating body composition changes in elite athletes using a four compartment model as the reference method. Nutr Metab (Lond) 2010;7: Lohman TG, Slaughter MH, Boileau RA, Bunt J, Lussier L. Bone mineral measurements and their relation to body density in children, youth and adults. Hum Biol 1984;56: Arngrimsson S, Evans EM, Saunders MJ. Validation of body composition estimates in male and female distance runners using estimates from a four-compartment model. American Journal of Human Biology: The Official Journal of the Human Biology Council 2000;12:
98 82. Deurenberg-Yap M, Schmidt G, van Staveren WA, Hautvast JG, Deurenberg P. Body fat measurements among Singaporean Chinese, Malays and Indians: a comparative study using a four-compartment model and different two-compartment models. British Journal of Nutrition 2001;85: Schoeller DA, Tylavsky FA, Baer DJ. QDR 4500A dual-energy X-ray absorptiometer underestimates fat mass in comparison with criterion methods in adults. American Journal of Clinical Nutrition 2005;81: 84. Baumgartner RN, Heymsfield SB, Lichtman S, Wang J, Pierson RN. Body composition in elderly people: Effect of criterion estimates on predictive equations. Journal of Clinical Nutrition 1991;53: Tothill P, Avenell A, Love J, Reid DM. Comparisons between Hologic, Lunar and Norland dual-energy X-ray absorptiometers and other techniques used for wholebody soft tissue measurements. Eur J Clin Nutr 1994;48: Tothill P, Avenell A, Reid DM. Precision and accuracy of measurements of wholebody bone mineral: comparisons between Hologic, Lunar and Norland dual-energy X-ray absorptiometers. Br J Radiol 1994;67: Tothill P, Hannan WJ, Wilkinson S. Comparisons between a pencil beam and two fan beam dual energy X-ray absorptiometers used for measuring total body bone and soft tissue. Br J Radiol 2001;74: Tothill P, Hannan WJ. Comparisons between Hologic QDR 1000W, QDR 4500A, and Lunar Expert dual-energy X-ray absorptiometry scanners used for measuring total body bone and soft tissue. Ann N Y Acad Sci 2000;904: Mahon AK, Flynn MG, Iglay HB, et al. Measurement of body composition changes with weight loss in postmenopausal women: comparison of methods. J Nutr Health Aging 2007;11: Soriano JMP, Loannidou E, Wang J, et al. Pencil-Beam vs Fan-Beam Dual-Energy X-Ray Absorptiometry Comparisons Across Four Systems: Body Composition and Bone Mineral. Journal of clinical densitometry: the official journal of the International Society for Clinical Densitometry 2004;7: Hind K, Oldroyd B, Truscott JG. In vivo precision of the GE Lunar idxa densitometer for the measurement of total body composition and fat distribution in adults. European Journal of Clinical Nutrition 2011;65:
99 92. Rezzi S, Ginty F, Beaumont A. Body composition precision with the Lunar idxa. Journal of clinical densitometry: the official journal of the International Society for Clinical Densitometry 2009;12: Lee K, Lee S, Kim Y. Waist circumference, dual energy x-ray absorptiometry measured abdominal adiposity, and computed tomographically-derived intraabdominal fat area on detecting metabolic risk factors in obese women. Nutrition 2008;24: Frisard MI, Greenway FL, Delany JP. Comparison of methods to assess body composition changes during a period of weight loss. Obes Res 2005;13: Weyers AM, Mazzetti SA, Love DM, Gomez AL, Kraemer WJ, Volek JS. Comparison of methods for assessing body composition changes during weight loss. Med Sci Sports Exerc 2002;34: Ball SD. Interdevice variability in percent fat estimates using the BOD POD. Eur J Clin Nutr 2005;59: Fields DA, Higgins PB, Hunter GR. Assessment of body composition by airdisplacement plethysmography: influence of body temperature and moisture. Dyn Med 2004;3: Collins AL, Saunders S, McCarthy HD, Williams JE, Fuller NJ. Within and betweenlaboratory precision in the measurement of body volume using air displacement plethysmography and its effect on body composition assessment. Int J Obes Relat Metab Disord 2004;28: Gillan RM. Inter-device reliability of the BOD POD for clinical and research use. 2010; Noreen EE, Lemon PW. Reliability of air displacement plethysmography in a large, heterogeneous sample. Med Sci Sports Exerc 2006;38: Lockner DW, Heyward VH, Baumgartner RN, Jenkins KA. Comparison of airdisplacement plethysmography, hydrodensitometry, and dual X-ray absorptiometry for assessing body composition of children 10 to 18 years of age. Ann N Y Acad Sci 2000;904: Wong WW, Hergenroeder AC, Stuff JE, Butte NF, Smith EO, Ellis KJ. Evaluating body fat in girls and female adolescents: Advantages and disadvantages of dualenergy X-ray absorptiometry. American Journal of Clinical Nutrition 2002;76:
100 103. Wosje KS, Knipstein BL, Kalkwarf HJ. Measurement error of DXA: interpretation of fat and lean mass changes in obese and non-obese children. J Clin Densitom 2006;9:
101 APPENDIX A LIST OF ABBREVIATIONS ADP AndBone AndFat AndLM BMI BP DXA FFM FM GynBone GynFat GynLM HipBMD Hip-T Hip-Z idxa Air Displacement Plethysmography Android Bone Android Fat Android Lean Mass Body Mass Index BOD POD Dual Energy X-ray Absorptiometry Fat Free Mass Fat Mass Gynoid Bone Gynoid Fat Gynoid Lean Mass Hip Bone Mineral Density Hip T-Score Hip Z-Score Intelligent Dual Energy X-ray Absorptiometry 90
102 LIL L-BMD LT LTM L-T L-Z NeckBMD Neck-T Neck-Z pdif Labs In Life Lumbar Spine Bone Mineral Density Lean Tissue Lean Tissue Mass Lumbar Spine T-Score Lumbar Spine Z-Score Neck of Femur Bone Mineral Density Neck of Femur T-Score Neck of Femur Z-Score Percent Difference between idxa and BOD POD PFatBP pfatidxa STM TB TBArea TBBone TBFat TBLM TB-T TB-Z TBBMC Percent Body Fat BOD POD Percent Body Fat DXA Soft Tissue Mass Total Body Total Body Area Total Body Bone Total Body Fat Total Body Lean Mass Total Body T-Score Total Body Z-Score Total Body Bone Mass Content 91
103 TBBMD UWW Total Body Bone Mass Density Underwater Weighing 92
104 APPENDIX B LIST OF DEFINITIONS Air-Displacement Plethysmography: A two-compartment densitometric body composition technique that is measured through a commercially available product known by the trade name BOD POD. Body Composition: The chief functional constituents of the human body; water, fat, protein, and minerals. Body Density: Ratio of body mass to body volume. Body Mass Index (BMI): Used to estimate risk of overweight in adults (kg/m²). Dual-Energy X-ray Absorptiometry: A three-compartment method of assessing body composition and bone density. Body composition using this method is determined by measuring the attenuation of the x-ray beam over the body on a pixel per-pixel basis. Fat Free Mass: The total amount of body mass that is not fat mass and is divided into water, mineral and protein. Fat Mass: The total amount of body mass that is not fat free mass. 93
105 Four-Compartment Model: Body composition measured by fat mass and fat free mass then accounting for the variability in fat free mass by measuring total body water and bone minerals. Hydrostatic Underwater Weighing: A method used to estimate body density by dividing body weight out of the water by weight in the water. Obesity: BMI 30 in adults and > 95th BMI-for-age percentile in children and adolescents. Overweight: BMI in adults. Percent Body Fat: Proportion of the body that is fat mass. Residual Volume: Residual volume is the volume of air remaining in the lungs at the end of a maximal expiration. Three-Compartment Model: A method of analyzing body composition. Derived by dividing the body into fat mass, water, and fat-free solid (Siri, 1961); or by dividing the body into fat, mineral and protein plus water (Lohman, 1986). Two-Compartment Model: A method of analyzing body composition. It considers that the body is composed of fat and the fat-free mass (Keys & Brozek, 1953; Siri 1961). Underweight: BMI < 18.5 in adults. 94

106 APPENDIX C GE LUNAR idxa SAMPLE PRINTOUTS 95
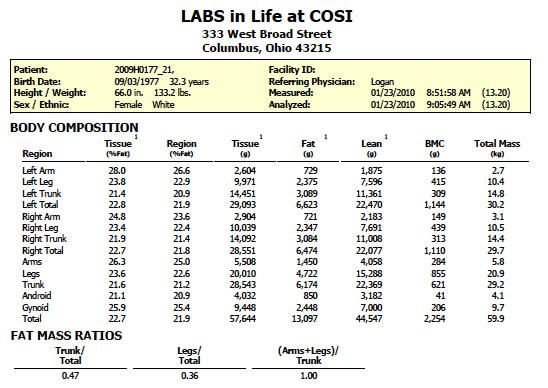
107 96
Chapter 17: Body Composition Status and Assessment
 Chapter 17: Body Composition Status and Assessment American College of Sports Medicine. (2010). ACSM's resource manual for guidelines for exercise testing and prescription (6th ed.). New York: Lippincott,
Note that metric units are used in the calculation of BMI. The following imperial-metric conversions are required:
 Body Composition Body Composition: Assessment and Interpretation Body composition has great practical and functional significance for many of us: scientists, clinicians and the general population. It can
Norland Densitometry A Tradition of Excellence
 Norland Densitometry A Tradition of Excellence Norland DXA Bone Density Measurement Osteoporosis is a disease marked by reduced bone strength leading to an increased risk of fractures. About 54 million
DEXA Bone Mineral Density Tests and Body Composition Analysis Information for Health Professionals
 DEXA Bone Mineral Density Tests and Body Composition Analysis Information for Health Professionals PERFORMANCE DEXA is an advanced technology originally used to, and still capable of assessing bone health
New Dual-energy X-ray Absorptiometry Machines (idxa) and Vertebral Fracture Assessment
 and Vertebral Fracture Assessment") Case 1 New Dual-energy X-ray Absorptiometry Machines (idxa) and Vertebral Fracture Assessment (VFA) History and Examination Your wealthy friend who is a banker brings his 62-year-old mother to your office
Case 1 New Dual-energy X-ray Absorptiometry Machines (idxa) and Vertebral Fracture Assessment (VFA) History and Examination Your wealthy friend who is a banker brings his 62-year-old mother to your office
Bone Densitometry. Total 30 Maximum CE 14. DXA Scanning (10) 7
 7") STRUCTURED SELF ASSESSMENT CONTENT SPECIFICATIONS SSA LAUNCH DATE: JANUARY 1, 2018 Bone Densitometry The purpose of continuing qualifications requirements (CQR) is to assist registered technologists in
STRUCTURED SELF ASSESSMENT CONTENT SPECIFICATIONS SSA LAUNCH DATE: JANUARY 1, 2018 Bone Densitometry The purpose of continuing qualifications requirements (CQR) is to assist registered technologists in
Copyright is owned by the Author of the thesis. Permission is given for a copy to be downloaded by an individual for the purpose of research and
 Copyright is owned by the Author of the thesis. Permission is given for a copy to be downloaded by an individual for the purpose of research and private study only. The thesis may not be reproduced elsewhere
EXAMINATION CONTENT SPECIFICATIONS ARRT BOARD APPROVED: JANUARY 2017 IMPLEMENTATION DATE: JULY 1, 2017
 EXAMINATION CONTENT SPECIFICATIONS Bone Densitometry The purpose of the bone densitometry examination is to assess the knowledge and cognitive skills underlying the intelligent performance of the tasks
The Bone Densitometry Examination
 The Bone Densitometry Examination The purpose of The American Registry of Radiologic Technologist (ARRT ) Bone Densitometry Examination is to assess the knowledge and cognitive skills underlying the intelligent
STRUCTURED EDUCATION REQUIREMENTS IMPLEMENTATION DATE: JULY 1, 2017
 STRUCTURED EDUCATION REQUIREMENTS Bone Densitometry The purpose of structured education is to provide the opportunity for individuals to develop mastery of discipline-specific knowledge that, when coupled
Lunar Prodigy Advance
 GE Medical Systems Lunar Prodigy Advance Direct-Digital Densitometry imagination at work Your practice needs to move fast, yet you want peace of mind. A partnership is a journey - expertise, support and
Prevalence of Osteoporosis p. 262 Consequences of Osteoporosis p. 263 Risk Factors for Osteoporosis p. 264 Attainment of Peak Bone Density p.
 Dedication Preface Acknowledgments Continuing Education An Introduction to Conventions in Densitometry p. 1 Densitometry as a Quantitative Measurement Technique p. 2 Accuracy and Precision p. 2 The Skeleton
Body Composition. Lecture Overview. Measuring of Body Composition. Powers & Howely pp Methods of measuring body composition
 Body Composition Powers & Howely pp 344-356 Lecture Overview Methods of measuring body composition Two-component system Body fatness for health & fitness Obesity and weight control Diet, exercise, and
COMPARISON OF AIR DISPLACEMENT PLETHYSMOGRAPHY TO HYDROSTATIC WEIGHING FOR ESTIMATING TOTAL BODY DENSITY IN CHILDREN
 COMPARISON OF AIR DISPLACEMENT PLETHYSMOGRAPHY TO HYDROSTATIC WEIGHING FOR ESTIMATING TOTAL BODY DENSITY IN CHILDREN Geo Claros 1, Holly R Hull 1, and David A Fields 1,2 * 1 Department of Health and Exercise
Whole Body Dual X-Ray Absorptiometry to Determine Body Composition
 Page: 1 of 6 Last Review Status/Date: March 2015 Determine Body Composition Description Using low dose x-rays of two different energy levels, whole body dual x-ray absorptiometry (DXA) measures lean tissue
DXA When to order? How to interpret? Dr Nikhil Tandon Department of Endocrinology and Metabolism All India Institute of Medical Sciences New Delhi
 DXA When to order? How to interpret? Dr Nikhil Tandon Department of Endocrinology and Metabolism All India Institute of Medical Sciences New Delhi Clinical Utility of Bone Densitometry Diagnosis (DXA)
Lunar idxa. The intelligent DXA. gehealthcare.com
 Lunar idxa The intelligent DXA gehealthcare.com The best of DXA technology for bone and metabolic health assessment With a state-of-the-art design, Lunar idxa offers research-grade image resolution and
PhenX Measure: Body Composition (#020300) PhenX Protocol: Body Composition - Body Composition by Dual-Energy X-Ray Absorptiometry (#020302)
 PhenX Protocol: Body Composition - Body Composition by Dual-Energy X-Ray Absorptiometry (#020302)") PhenX Measure: Body Composition (#020300) PhenX Protocol: Body Composition - Body Composition by Dual-Energy X-Ray Absorptiometry (#020302) Date of Interview/Examination (MM/DD/YYYY): A downloadable PDF
PhenX Measure: Body Composition (#020300) PhenX Protocol: Body Composition - Body Composition by Dual-Energy X-Ray Absorptiometry (#020302) Date of Interview/Examination (MM/DD/YYYY): A downloadable PDF
Prodigy. from GE Healthcare. Most trusted, reliable and best-selling DXA system with one of the largest installed base in the world. gehealthcare.
 Prodigy from GE Healthcare Most trusted, reliable and best-selling DXA system with one of the largest installed base in the world gehealthcare.com Prodigy High performance, efficient and reliable DXA system
Bone Densitometry Equipment Operator
 Bone Densitometry Equipment Operator The purpose of the Bone Densitometry Equipment Operator Examination, which is made available to state licensing agencies, is to assess the knowledge and cognitive skills
Standard Operating Procedure TCRC Dual-Energy X-ray Absorptiometry (DXA)
") 1. RELEVANCE a. This SOP outlines the instructions to completing Duel Energy X-Ray Absorptiometry (DXA) including: scanning, analysis, review and filing. 2. SCOPE a. This SOP applies to all TCRC RDs. 3.
1. RELEVANCE a. This SOP outlines the instructions to completing Duel Energy X-Ray Absorptiometry (DXA) including: scanning, analysis, review and filing. 2. SCOPE a. This SOP applies to all TCRC RDs. 3.
Evaluation and Validation of BODPOD Body Scan Method as Compared to DEXA, Effect of Calcium and Caloric Intake in Female Collegiate Track Athletes
 Utah State University DigitalCommons@USU Undergraduate Honors Theses Honors Program 5-2010 Evaluation and Validation of BODPOD Body Scan Method as Compared to DEXA, Effect of Calcium and Caloric Intake
Whole Body Dual X-Ray Absorptiometry (DXA) to Determine Body Composition
 to Determine Body Composition") Whole Body Dual X-Ray Absorptiometry (DXA) to Determine Body Composition Policy Number: 6.01.40 Last Review: 4/2018 Origination: 4/2005 Next Review: 4/2019 Policy Blue Cross and Blue Shield of Kansas City
Whole Body Dual X-Ray Absorptiometry (DXA) to Determine Body Composition Policy Number: 6.01.40 Last Review: 4/2018 Origination: 4/2005 Next Review: 4/2019 Policy Blue Cross and Blue Shield of Kansas City
Introducing the. BodyMetrix is used throughout the world by Elite Sporting Clubs and Fitness Centres such as:
 BodyMetrix is used throughout the world by Elite Sporting Clubs and Fitness Centres such as: Introducing the P a g e 1 The BodyMetrix Professional System combines a hand-held ultrasound wand with innovative
Bone Densitometry Radiation dose: what you need to know
 Bone Densitometry Radiation dose: what you need to know John Damilakis, PhD Associate Professor and Chairman University of Crete, Iraklion, Crete, GREECE Estimation of bone status using X-rays Assessment
Understanding Body Composition
 PowerPoint Lecture Outlines 7 Understanding Body Composition Objectives Define body composition. Explain why the assessment of body size, shape, and composition is useful. Explain how to perform assessments
Introducing the future of DXA. Powerful images. Clear answers. Horizon DXA System
 Introducing the future of DXA Powerful images. Clear answers. Horizon DXA System Hologic turns ideas into innovation. Again. Hologic cares about you and your patients about keeping their bones healthy,
RADIATION PROTECTION IN DIAGNOSTIC AND INTERVENTIONAL RADIOLOGY. L19: Optimization of Protection in Mammography
 IAEA Training Material on Radiation Protection in Diagnostic and Interventional Radiology RADIATION PROTECTION IN DIAGNOSTIC AND INTERVENTIONAL RADIOLOGY L19: Optimization of Protection in Mammography
Healthy aging. It s vital.
 GE Healthcare Healthy aging. It s vital. encore 17 The leading edge of DXA applications This trio of new encore 17 functions will take your clinical assessment capability to the next level. We are pleased
Body composition in children and adults by air displacement plethysmography
 European Journal of Clinical Nutrition (1999) 53, 382±387 ß 1999 Stockton Press. All rights reserved 0954±3007/99 $12.00 http://www.stockton-press.co.uk/ejcn Body composition in children and adults by
Sports Performance 15. Section 3.2: Body Composition
 Sports Performance 15 Section 3.2: Body Composition The relative percentage of muscle, fat, bone and other tissue in the body Our primary concern in this unit is body fatness and how it pertains to athletic
Adina Alazraki, MD, FAAP Assistant Professor, Radiology and Pediatrics Emory University School of Medicine Children s Healthcare of Atlanta
 Adina Alazraki, MD, FAAP Assistant Professor, Radiology and Pediatrics Emory University School of Medicine Technical: Patient positioning Performance of the scan Analysis of the data Theoretical: Identification
Body Composition Analysis by Air Displacement Plethysmography in Normal Weight to Extremely Obese Adults
 Body Composition Analysis by Air Displacement Plethysmography in Normal Weight to Extremely Obese Adults Kazanna C. Hames 1,2, Steven J. Anthony 2, John C. Thornton 3, Dympna Gallagher 3 and Bret H. Goodpaster
Body Composition. Chapters 18 and 23
 Body Composition Chapters 18 and 23 Somatotype (Body Type) Soft roundness? endormorphy High muscle mass? mesomorphy Linearity and fragility? ectomorphy Body Composition Methods Height Weight Tables e.g.
Weight And Body Fat! Why do I lose weight but my body fat doesn t change much? Scales by How does it work? Is it accurate?
 Weight And Body Fat! How does it work? While body fat can be measured in many ways, the method used in your scale is bioelectrical impedance. This indirect method of determining body fat starts when a
Fitness Assessment Body Composition. PaedDr. Lucia Malá, Ph.D. PaedDr. Tomáš Malý Ing. František Zahálka, Ph.D. prof. Ing. Václav Bunc, CSc.
 Fitness Assessment Body Composition PaedDr. Lucia Malá, Ph.D. PaedDr. Tomáš Malý Ing. František Zahálka, Ph.D. prof. Ing. Václav Bunc, CSc. Reviewed by: doc. RNDr. Pavel Bláha, CSc. prof. RNDr. Jarmila
Medical Policy. MP Whole Body Dual X-Ray Absorptiometry to Determine Body Composition
 Medical Policy MP 6.01.40 BCBSA Ref. Policy: 6.01.40 Last Review: 09/28/2017 Effective Date: 09/28/2017 Section: Radiology End Date: 09/18/2018 Related Policies 6.01.44 Vertebral Fracture Assessment With
Dual-energy Vertebral Assessment
 Dual-energy Vertebral Assessment gehealthcare.com Dual-energy Vertebral Assessment More than 40% of women with normal or osteopenic BMD had a moderate or severe vertebral deformation seen with DVA. Patrick
Documentation, Codebook, and Frequencies
 Documentation, Codebook, and Frequencies Dual-Energy X-ray Absorptiometry Femur Bone Measurements Examination Survey Years: 2005 to 2006 SAS Transport File: DXXFEM_D.XPT January 2009 NHANES 2005 2006 Data
Annotations Part III Vertebral Fracture Initiative. International Osteoporosis Foundation March 2011
 Annotations Part III Vertebral Fracture Initiative International Osteoporosis Foundation March 2011 Slide 1-3 Topics to be covered: What is vertebral fracture assessment? How does VFA compare to standard
This is a digitised version of a dissertation submitted to the University of Bedfordshire. It is available to view only.
 Title The Validity of Two Compartment Model Methods of Body Composition as Compared to Magnetic Resonance Imaging in Asian Indian Versus Caucasian Males Name Ben Davies This is a digitised version of a
Applied Physiology, Nutrition, and Metabolism
 Applied Physiology, Nutrition, and Metabolism Predicted Versus Measured Thoracic Gas Volumes of Collegiate Athletes Made by the BOD POD Air Displacement Plethysmography System Journal: Applied Physiology,
Use of DXA / Bone Density in the Care of Your Patients. Brenda Lee Holbert, M.D. Associate Professor Senior Staff Radiologist
 Use of DXA / Bone Density in the Care of Your Patients Brenda Lee Holbert, M.D. Associate Professor Senior Staff Radiologist Important Websites Resources for Clinicians and Patients www.nof.org www.iofbonehealth.org
Segmental Body Composition Assessment for Obese Japanese Adults by Single-Frequency Bioelectrical Impedance Analysis with 8-point Contact Electrodes
 Segmental Body Composition Assessment for Obese Japanese Adults by Single-Frequency Bioelectrical Impedance Analysis with 8-point Contact Electrodes Susumu Sato 1), Shinichi Demura 2), Tamotsu Kitabayashi
Lateral Vertebral Analysis DXA Body Composition Quality Assurance in DXA
 Strong Bone Asia 2013 Osteoporosis in ASEAN Lateral Vertebral Analysis DXA Body Composition Quality Assurance in DXA Chris Schultz Scientist-in-Charge (Bone Densitometry) Royal Adelaide Hospital, Adelaide,
Development of a Viable Bedside Ultrasound Protocol to Accurately Predict Appendicular Lean Tissue Mass
 Development of a Viable Bedside Ultrasound Protocol to Accurately Predict Appendicular Lean Tissue Mass by Michael Paris A thesis presented to the University of Waterloo in fulfillment of the thesis requirement
Adult BMI Calculator
 For more information go to Center for Disease Control http://search.cdc.gov/search?query=bmi+adult&utf8=%e2%9c%93&affiliate=cdc-main\ About BMI for Adults Adult BMI Calculator On this page: What is BMI?
C H A P T E R 14 BODY WEIGHT, BODY COMPOSITION, AND SPORT
 C H A P T E R 14 BODY WEIGHT, BODY COMPOSITION, AND SPORT Learning Objectives Differentiate among body build, body size, and body composition. Find out what tissues of the body constitute fat-free mass.
COMPARISON OF BODY COMPOSITION ASSESSMENT IN WOMEN USING SKINFOLD THICKNESS EQUATIONS, BIOELECTRICAL IMPEDANCE ANALYSIS AND UNDERWATER WEIGHING
 STUDIES IN PHYSICAL CULTURE AND TOURISM Vol. 17, No. 3, 2010 EFTEKHAR MOHAMMADI, SAEID SHAKERIAN Faculty of Physical Education & Sports Science, Shahid Chamran University, Iran COMPARISON OF BODY COMPOSITION
Effect of Precision Error on T-scores and the Diagnostic Classification of Bone Status
 Journal of Clinical Densitometry, vol. 10, no. 3, 239e243, 2007 Ó Copyright 2007 by The International Society for Clinical Densitometry 1094-6950/07/10:239e243/$32.00 DOI: 10.1016/j.jocd.2007.03.002 Original
Solutions at GE Inspection Technologies
 Solutions at GE Inspection Technologies Business Overview Paul A. Meyer Our Company A global leader in technology-driven inspection solutions that deliver productivity, quality, and safety to our customers
FAT MASS ESTIMATION BY BIOELECTRICAL IMPEDANCE ANALYSIS
 FAT MASS ESTIMATION BY BIOELECTRICAL IMPEDANCE ANALYSIS FAT MASS ESTIMATION BY BIOELECTRICAL IMPEDANCE ANALYSIS Epidemiological studies have shown that relative risk of diabetes and cardiovascular diseases
The physical educator s role is evolving into that of a teacher who is well educated
 Assessment and Interpretation of Body Composition in Physical Education PAT VEHRS RON HAGER Should you use skinfolds, bio-electrical impedence, or BMI? The physical educator s role is evolving into that
Fitness Nutrition Coach. Part IV - Assessing Nutritional Needs
 Part IV - Assessing Nutritional Needs 62 For the FNC, a nutrition assessment provides information on your client s diet quality and awareness about nutrient information. Clients should be encouraged to
The Assessment of Body Composition in Health and Disease
 The Assessment of Body Composition in Health and Disease Giorgio Bedogni, Paolo Brambilla, Stefano Bellentani and Claudio Tiribelli CHAPTER 3 BODY AND NUTRITIONAL STATUS Nutritional status can be operationally
Duncan Macfarlane IHP, HKU Parts of this lecture were based on lecture notes provided by the Lindsay Carter Anthropometric Archive, AUT, NZ
 Body composition assessment issues in athletes 1 Duncan Macfarlane IHP, HKU Parts of this lecture were based on lecture notes provided by the Lindsay Carter Anthropometric Archive, AUT, NZ LEARNING OUTCOMES:
2013 ISCD Official Positions Adult
 2013 ISCD Official Positions Adult These are the Official Positions of the ISCD as updated in 2013. The Official Positions that are new or revised since 2007 are in bold type. Indications for Bone Mineral
In-vivo precision of the GE Lunar idxa for the measurement of visceral adipose tissue in
 1 2 In-vivo precision of the GE Lunar idxa for the measurement of visceral adipose tissue in adults: the influence of body mass index 3 4 Running title: Precision of the idxa for the measurement of visceral
MP Whole Body Dual X-Ray Absorptiometry to Determine Body Composition
 Medical Policy MP 6.01.40 BCBSA Ref. Policy: 6.01.40 Last Review: 09/19/2018 Effective Date: 09/19/2018 Section: Radiology Related Policies 6.01.44 Vertebral Fracture Assessment With Densitometry 9.01.502
Does standardized BMD still remove differences between Hologic and GE-Lunar state-of-the-art DXA systems?
 Osteoporos Int (2010) 21:1227 1236 DOI 10.1007/s00198-009-1062-3 ORIGINAL ARTICLE Does standardized BMD still remove differences between Hologic and GE-Lunar state-of-the-art DXA systems? B. Fan & Y. Lu
The Bone Wellness Centre - Specialists in Dexa Scanning 855 Broadview Avenue Suite # 305 Toronto, Ontario M4K 3Z1
 Birth Date: 24.7 years Height / Weight: 8.0 cm 79.0 kg Sex / Ethnic: Male Patient ID: Total Body Tissue Quantitation Composition Reference: Total Tissue 40% 30% 20% 0% 20 30 40 50 60 70 80 90 00 Centile
ESPEN Congress The Hague 2017
 ESPEN Congress The Hague 2017 Paediatric specificities of nutritional assessment Body composition measurement in children N. Mehta (US) 39 th ESPEN Congress The Hague, Netherlands Body Composition Measurement
bioelectrical impedance measurements. Aviation Space and Environmental Medicine, 59,
 MS ID: 9761874491197639 Authors: Macias et al Title: Body fat measurement by bioelectrical impedance versus air displacement plethysmography: a validation to design bioelectrical impedance equations in
Development of Ultrasound Based Techniques for Measuring Skeletal Muscle Motion
 Development of Ultrasound Based Techniques for Measuring Skeletal Muscle Motion Jason Silver August 26, 2009 Presentation Outline Introduction Thesis Objectives Mathematical Model and Principles Methods
QP33.5 Au2 blthr C.l G The Balm e Library. flid B llllill
 QP33.5 Au2 blthr C.l G365780 The Balm e Library flid B llllill 3 0692 1078 5910 8 RELIABILITY OF THE BOD POD COMPARED TO TRADITIONAL REFERENCE METHODS FOR MEASURING BODY COMPOSITION BY ALEX KOJO ANDERSON
As of the wrestling season, the National
 Evaluation of Air Displacement for Assessing Body Composition of Collegiate Wrestlers ALAN C. UTTER 1, FREDRIC L. GOSS 2, PAMELA D. SWAN 3, GREGORY S. HARRIS 1, ROBERT J. ROBERTSON 2, and GREGORY A. TRONE
Roberto D Sainz and Alessandro Urlando
 Evaluation of a new pediatric air-displacement plethysmograph for body-composition assessment by means of chemical analysis of bovine tissue phantoms 1 3 Roberto D Sainz and Alessandro Urlando ABSTRACT
Understanding Body Composition
 Understanding Body Composition Chapter 7 Body Composition n Body composition is the ratio between fat and fat-free mass n Fat-free mass includes all tissues exclusive of fat (muscle, bone, organs, fluids)
Manipulating Pretesting Conditions for Measuring Body Composition Using the BodPod and Bioelectrical Impedance AN HONORS THESIS (HONR 499)
") Manipulating Pretesting Conditions for Measuring Body Composition Using the BodPod and Bioelectrical Impedance AN HONORS THESIS (HONR 499) Jenna Elwert Thesis Advisor Paul Nagelkirk Signed Ball State University
Manipulating Pretesting Conditions for Measuring Body Composition Using the BodPod and Bioelectrical Impedance AN HONORS THESIS (HONR 499) Jenna Elwert Thesis Advisor Paul Nagelkirk Signed Ball State University
Validity of non-invasive methods for body composition measurements in older adults
 Graduate Theses and Dissertations Graduate College 2012 Validity of non-invasive methods for body composition measurements in older adults Yulong Li Iowa State University Follow this and additional works
The Bone Wellness Centre - Specialists in DEXA Scanning 855 Broadview Avenue Suite # 305 Toronto, Ontario M4K 3Z1
 Birth Date: 40.2 years Height / Weight: 158.0 cm 52.0 kg Sex / Ethnic: Female Patient ID: Total Body Tissue Quantitation Composition Reference: Total Tissue 50% 40% 30% 20% 20 30 40 50 60 70 80 90 100
QUANTUM. Body Composition Scale. 396lb x 0.2lb 180kg x 0.1kg
 QUANTUM Body Composition Scale 396lb x 0.2lb 180kg x 0.1kg Quantum Manual Thank you for purchasing the American Weigh Quantum Body Composition Scale. Please read all operating instructions carefully before
Can the LeanScreen App Accurately Assess Percent Body Fat and Waistto-Hip
 Can the LeanScreen App Accurately Assess Percent Body Fat and Waistto-Hip Ratio? EXCLUSIVE ACE SPONSORED RESEARCH BY RAY MARX, JOHN P. PORCARI, PH.D., SCOTT DOBERSTEIN, M.S., RICHARD MIKAT, PH.D., AND
BODY MASS INDEX AND BODY FAT CONTENT IN ELITE ATHLETES. Abstract. Introduction. Volume 3, No. 2, 2011, UDC :572.
 EXERCISE AND QUALITY OF LIFE Volume 3, No. 2, 2011, 43-48 UDC 796.034.6-051:572.087 Research article BODY MASS INDEX AND BODY FAT CONTENT IN ELITE ATHLETES Jelena Popadiã Gaãeša *, Otto Barak, Dea Karaba
Body Composition. Sport Books Publisher 1
 Body Composition Sport Books Publisher 1 The body composition The body composition is affected by the proportions of the body component (bones, muscles, and other tissues) It can be seen that the major
Premium solution for your health
 770 Premium solution for your health See What You re Made of Reveal the efficiency of your consultation throughout the InBody Test The InBody Test clearly visualize internal change of the body. Weight
CT Imaging of skeleton in small animals. Massimo Marenzana
 CT Imaging of skeleton in small animals Massimo Marenzana Introduction Osteoporosis is a disease in which bones become fragile and more likely to break. It can be defined as a systemic skeletal disease
Advanced Point-of-Care Bone Health Assessment HOLOGIC OSTEOPOROSIS ASSESSMENT
 O S T E O P O R O S I S A S S E S S M E N T Advanced Point-of-Care Bone Health Assessment HOLOGIC OSTEOPOROSIS ASSESSMENT Identify Patients at Risk The evaluation of bone health has become an essential
The Bone Wellness Centre - Specialists in DEXA Scanning 855 Broadview Avenue Suite # 305 Toronto, Ontario M4K 3Z1
 The Bone Wellness Centre - Specialists in DEXA Scanning 855 Broadview Avenue Suite # 305 Toronto, Ontario M4K 3Z1 Patient: Birth Date: 48.2 years Height / Weight: 150.0 cm 72.0 kg Sex / Ethnic: Female
The Bone Wellness Centre - Specialists in DEXA Scanning 855 Broadview Avenue Suite # 305 Toronto, Ontario M4K 3Z1
 The Bone Wellness Centre - Specialists in DEXA Scanning 855 Broadview Avenue Suite # 305 Toronto, Ontario M4K 3Z1 Patient: Birth Date: 43.4 years Height / Weight: 170.0 cm 66.0 kg Sex / Ethnic: Female
Body Composition of Infants with Gastroschisis Assessed by Air Displacement Plethysmography
 Body Composition of Infants with Gastroschisis Assessed by Air Displacement Plethysmography by Manar Abduljalil H Bakhsh A thesis submitted in conformity with the requirements for the degree of Master
Comparison of Body Composition Assessment Techniques in Older Adults
 University of Tennessee, Knoxville Trace: Tennessee Research and Creative Exchange Masters Theses Graduate School 8-2005 Comparison of Body Composition Assessment Techniques in Older Adults Rebekah Ann
Assessment of body composition of Sri Lankan Australian children using ethnic specific equations
 J.Natn.Sci.Foundation Sri Lanka 2015 43 (2): 111-118 DOI: http://dx.doi.org/10.4038/jnsfsr.v43i2.7938 RESEARCH ARTICLE Assessment of body composition of Sri Lankan Australian children using ethnic specific
Application of Phased Array Radar Theory to Ultrasonic Linear Array Medical Imaging System
 Application of Phased Array Radar Theory to Ultrasonic Linear Array Medical Imaging System R. K. Saha, S. Karmakar, S. Saha, M. Roy, S. Sarkar and S.K. Sen Microelectronics Division, Saha Institute of
What Is Body Composition?
 Chapter Six What Is Body Composition? Body composition is the body s relative amounts of fat mass and fat-free mass Body fat includes two categories: Essential fat is crucial for normal body functioning
Body composition techniques and the four-compartment model in children
 J Appl Physiol 89: 613 620, 2000. Body composition techniques and the four-compartment model in children DAVID A. FIELDS AND MICHAEL I. GORAN Division of Physiology and Metabolism, Department of Nutrition
QDR Series. Discovery and Explorer Advanced Health Assessment
 O S T E O P O R O S I S A S S E S S M E N T QDR Series Discovery and Explorer Advanced Health The Hologic QDR Series bone densitometers combine the proven clinical value of bone mineral density (BMD) measurement
Luís B Sardinha, Timothy G Lohman, Pedro J Teixeira, Dartagnan P Guedes, and Scott B Going
 Comparison of air displacement plethysmography with dual-energy X-ray absorptiometry and 3 field methods for estimating body composition in middle-aged men 1,2 Luís B Sardinha, Timothy G Lohman, Pedro
Radiation Detection and Measurement
 Radiation Detection and Measurement Range of charged particles (e.g.,!: µm; ": mm) Range of high energy photons (cm) Two main types of interactions of high energy photons Compton scatter Photoelectric
Current Voltage characteristic of biological tissue: Body resistance
 6_Current Voltage characteristic of biological tissue.xlsx/work procedure Study group: Year of study: Current Voltage characteristic of biological tissue: Body resistance Objective: Establish the mean
Interpreting DEXA Scan and. the New Fracture Risk. Assessment. Algorithm
 Interpreting DEXA Scan and the New Fracture Risk Assessment Algorithm Prof. Samir Elbadawy *Osteoporosis affect 30%-40% of women in western countries and almost 15% of men after the age of 50 years. Osteoporosis
Bone Densitometry. What is a Bone Density Scan (DXA)? What are some common uses of the procedure?
? What are some common uses of the procedure?") Scan for mobile link. Bone Densitometry What is a Bone Density Scan (DXA)? Bone density scanning, also called dual-energy x-ray absorptiometry (DXA) or bone densitometry, is an enhanced form of x-ray technology
Scan for mobile link. Bone Densitometry What is a Bone Density Scan (DXA)? Bone density scanning, also called dual-energy x-ray absorptiometry (DXA) or bone densitometry, is an enhanced form of x-ray technology
Sports Nutrition Care Manual Available Fall 2011
 Sports Nutrition Care Manual Available Fall 2011 View the SNCM demo site: http://sports.adancm.com/demo/sports.cfm Features: Research-based nutrition information written by authors who are Board Certified
2013 ISCD Combined Official Positions
 2013 ISCD Combined Oicial Positions Oicial Positions of the International Society for Clinical Densitometry The International Society for Clinical Densitometry (ISCD) is a not-for-profit multidisciplinary
Portfolio Requirements and Instructions 2018
 Portfolio Requirements and Instructions 2018 Introduction The purpose of the portfolio is to demonstrate your understanding and practical ability in bone densitometry across four sections. It is to provide
Glass Body Fat Scale Instructions for use
 Glass Body Fat Scale Instructions for use The scale is specially designed to test your body weight, body fat, hydration, muscle and bone percentages and to help you keep a close eye on the daily changes
BODY COMPOSITION COMPARISON: BIOELECTRIC IMPEDANCE ANALYSIS WITH DXA IN ADULT ATHLETES
 BODY COMPOSITION COMPARISON: BIOELECTRIC IMPEDANCE ANALYSIS WITH DXA IN ADULT ATHLETES A Thesis Presented to the Faculty of the Graduate School University of Missouri In Partial Fulfillment of the Requirements
special communication
 special communication Determining bone and total body mineral content from body density and bioelectrical response spectroscopy STEVEN F. SICONOLFI, 1 RANDAL J. GRETEBECK, 2 WILLIAM W. WONG, 3 SHERIL S.
Measurement of total body water using 2 H dilution: impact of different calculations for determining body fat
 British Journal of Nutrition (2002), 88, 325 329 q The Authors 2002 DOI: 10.1079/BJN2002654 Measurement of total body water using 2 H dilution: impact of different calculations for determining body fat
The Influence of Exogenous Fat and Water on Lumbar Spine Bone Mineral Density in Healthy Volunteers
 Original Article http://dx.doi.org/10.3349/ymj.2012.53.2.289 pissn: 0513-5796, eissn: 1976-2437 Yonsei Med J 53(2):289-293, 2012 The Influence of Exogenous Fat and Water on Lumbar Spine Bone Mineral Density