Relationship between the intake of total flavonoid. and flavan-3-ols, and 5-year cardiovascular disease. risk scores in New Zealand adults
|
|
|
- Juliana Hall
- 5 years ago
- Views:
Transcription
1 Relationship between the intake of total flavonoid and flavan-3-ols, and 5-year cardiovascular disease risk scores in New Zealand adults Kirsten Sim A thesis submitted in fulfillment of the requirements for the degree of Masters in Dietetics At the University of Otago Dunedin, New Zealand June 2013
2 Abstract Objective: The aim of the study was to expand the New Zealand Food Composition Database (NZFCD) to include flavonoid data, in order to determine the relationship between the intake of (a) total flavonoids and (b) flavan-3-ols, and 5-year cardiovascular disease (CVD) risk score in New Zealand adults. Design: The present study used data from the New Zealand Adult Nutrition Survey (NZANS) 08/09 - a national population-based nutrition survey, conducted in a sample of 4271 participants. Flavonoid and Flavan-3-ol intake was assessed using 24-hour food recalls. Data on blood pressure, lipid status, diabetes status (HbA1c), smoking status, ethnicity, age and gender were used to determine 5-year CVD risk scores. Each food in the FOODfiles dataset of the NZFCD was updated using the flavonoid databases: USDA and Phenol explorer. To determine the relationship between flavonoid intake and CVD risk, logistic regression was used to investigate relationships between categories of X intake with categories of CVD risk. Results: Those in the high total flavonoid intake category were less likely to have a high CVD risk score than those with a low total flavonoid intake, after adjustment for age, body mass index (BMI), sex, ethnicity and New Zealand Deprivation Index (NZdep). Similarly, those with a high intake of flavan-3-ols were less likely to have a high CVD risk score. Those with a low intake of flavan-3-ols, were more likely to have a high CVD risk score. Foods that contributed most to the quantitative intake of flavan-3-ols were sugar/sweets, fruit, alcoholic and non-alcoholic beverages. Conclusions: New Zealand adults with a higher intake of total flavonoids and in particular flavan-3-ols are likely to have a lower CVD risk score. Therefore, consuming foods higher in flavan-3-ols, such as cocoa products, fruit and tea, may help to reduce the risk of developing CVD, as long as a balanced diet is followed.! i!
3 Preface The flavonoid database was developed jointly by the candidate and Carly Fry (Master of Dietetics student). We were jointly responsible for: Matching foods from the FOODfiles list of 2710 foods to that from the Flavonoid database from the United States Department of Agriculture (USDA), which contained flavonoid values for approximately 500 foods. If foods could not be matched to this database, they were matched to an alternate database named Phenol Explorer, which also contained flavonoid values for approximately 500 foods. Developing composites for foods in which no match could be made. We used packet ingredients and website recipes to compile a composite. Refer to the methods section for more detail on the development of composites. Determining which foods were cooked and/or processed, so retention factors could be applied due to loss of flavonoids from the raw to cooked food. Determining foods that needed to be concentrated. Checking energy content of matched foods to ensure they were a close enough match, and making changes where necessary. The candidate was also responsible for interpreting the statistical analyses carried out by Dr Jill Haszard, and for writing the thesis. Cecilia Sam was responsible for coding the flavonoid database, and thus matching flavonoid values to all foods and composites. She was also responsible for developing the coding for CVD risk score, so flavonoid intake could be compared to CVD risk.! ii!
4 Acknowledgements I would like to thank the following people for their assistance: i. Dr Paula Skidmore and Liz Fleming, my two supervisors, for their guidance, suggestions and support throughout the project. ii. iii. iv. Dr Jill Haszard for her input in the statistical methods and analysis of my data. Cecilia Sam, for coding the database and making it possible to generate results. The participants from the NZANS, and all those from the University of Otago Department of Human Nutrition who helped conduct this study. v. Charlie Blakey and Liz Fleming, who were responsible for updating the web based program Kai-culator with flavonoid values, in order to determine flavonoid intake of the NZANS participants. Without their input none of this would have been possible.! iii!
5 1 Table of Contents 1 Introduction Literature Review Introduction CVD Risk Assessment Tools CVD Risk Assessment in New Zealand CVD and Diet Flavonoids Flavonoids and Chronic Disease Flavonoids Mechanisms of action Flavan-3-ol Flavan-3-ol and CVD Flavan-3-ol Mechanisms of Action Conclusions Objective statement Hypothesis Participants and Methods Study Design New Zealand Adult Nutrition Survey 2008/2009 Methods Participants Hour Food Recalls Matching to Nutrient Data Anthropometry Blood Pressure Blood Samples... 39! iv!
6 4.2.7 Diabetes New Zealand Index of Deprivation Ethnic Groups CVD Risk Score Flavonoid Database Development Flavonoid Databases Matching FOODfiles to USDA Matching FOODfiles to Phenol Explorer Retention Factors Flavonoid Classes and Subclasses Composite Development Retention factors for composites Adjustments for Concentrated Foods Flavonoid Calculations Participant Categories Statistical Methods Results Response Rate and Data Used for Analyses Sample Characteristics Differences in Flavonoid and Flavan-3-ol Intake Between Age Categories, BMI, Sex, Prioritised Ethnicity and NZdep Quintile Cardiovascular Disease Risk Categories Mild CVD Risk Category Moderate to High CVD Risk Category High CVD Risk Category Main Food Sources of Flavonoids and Flavan-3-ol... 58! v!
7 5.6 Intake of Flavonoids and Flavan-3-ols for each CVD Risk Category Total Flavonoid Intake and CVD Risk Flavan-3-ol Intake and CVD Risk Discussion and Conclusions Main Findings Strengths and Limitations of the Present Study Strengths Limitations Implications for Future Research Conclusions Application to Dietetic Practice References Appendix... 79! vi!
8 List of Tables Table 2.1 Worldwide cardiovascular risk assessments scores... 8 Table 2.2 Studies investigating flavan-3-ol and CVD Table 5.1 Table 5.2 Table 5.3 Table 5.4 Table 5.5 Table 5.6 Table 5.7 Demographic data for NZANS participants by categories of CVD risk and total flavonoid and flavan-3-ol intake Main food groups contributing to total flavonoid intake and flavan-3-ol intake Mean total flavonoid and flavan-3-ol intake by CVD risk category in unadjusted analyses Relationships between groups of total flavonoid intake and CVD risk categories. Results are presented as Odds Ratio (CI) for being in a particular total flavonoid intake group for each CVD risk category, compared to the low total flavonoid intake group Relationships between groups of total flavonoid intake and CVD risk categories. Results are presented as Odds Ratio (CI) for being in a particular total flavonoid intake group for each CVD risk category Relationships between groups of flavan-3-ol intake and CVD risk categories. Results are presented as Odds Ratio (CI) for being in a particular flavan-3-ol intake group for each CVD risk category, compared to the low flavan-3-ol intake group Relationships between groups of flavan-3-ol intake and CVD risk categories. Results are presented as Odds Ratio (CI) for being in a particular flavan-3-ol intake group for each CVD risk category... 64! vii!
9 List of Figures Figure 3.1 New Zealand Cardiovascular Risk Charts Figure 3.2 Composite for a Black Bean and Beef Stir-fry Using Foods From FOODfiles Figure 3.3 Retention Factors for Cooked versus Uncooked Ingredients in a Composite using foods from FOODfiles... 49!! viii!
10 List of Abbreviations ANOVA analysis of variance ASSIGN Scottish Intercollegiate Guidelines Network to Assign Preventative Treatment Score BMI body mass index BP blood pressure CI confidence interval CHD coronary heart disease CVD cardiovascular disease DALYs Disability Adjusted Life Years DASH Dietary Approaches to Stop Hypertension DBP diastolic blood pressure DHA docosahexaenoic acid ECG electrocardiogram EDTA ethylene diamine tetra-acetic acid EPA eicosapentaenoic acid EPIC Europoean Prospective Investigation into Cancer and Nutrition enos endothelial nitric oxide synthase FFQ food frequency questionnaire FMD flow mediated dilatation GRADE Grading of Recommendations Assessment, Development and Evaluation HDL high density lipoprotein HOMA-IR Homeostasis Model of Assessment - Insulin Resistance IHD ischemic heart disease ISI insulin sensitivity index LDL low density lipoprotein MI myocardial infarction MOH Ministry of Health NADH nicotinamide adenine dinucleotide! ix
11 NO nitric oxide NOS nitric oxide synthase NZ New Zealand NZANS New Zealand Adult Nutrition Survey 2008/2009 NZFCDB New Zealand Food Composition Database OR odds ratio PFR Plant and Food Research PROCAM Prospective Cardiovascular Münster score QRISK QRESEARCH Cardiovascular Risk score QUICKI Quantitative Insulin Sensitivity Check Index RCT randomised controlled trial RNO sum of nitrosylated and nitrosated species SCORE Systematic Coronary Risk Evaluation score SE standard error SES socioeconomic status SBP systolic blood pressure T2DM type two diabetes mellitus TC total cholesterol NZDep New Zealand Deprivation Index UK United Kindgdom US United States USDA United States Department of Agriculture WHO World Health Organisation!! x
12 1 Introduction Over the past century, CVD has gone from being a relatively uncommon disease, to one of the leading causes of morbidity and mortality worldwide (1). Improved health care and pharmacological methods to decrease the rates of CVD mortality over the past decade have been successful and there has been a decline in the rates observed in New Zealand (2). However, as the population ages the number of people burdened by CVD has increased. There are various economic, cultural and social influences that continue to increase certain risk factors for CVD (1). As this disease bears such a great burden on society, researchers continue to address this matter, with the ultimate goal of further reducing the prevalence of CVD. Along with risk factors such as obesity, diabetes mellitus, tobacco use, and hypertension, it has been demonstrated by various epidemiological studies that diet plays a significant role in the development of CVD (1-3). There is convincing evidence that high consumption of linoleic acid, fish and fish oils (EPA and DHA), vegetables and fruits (including berries), potassium, and a low to moderate alcohol intake is likely to decrease the risk of developing CVD (2). Epidemiological evidence as to the health benefits of other non-nutrients in foods is advancing, in particular the possible health benefits of the phenolic substances found in plant foods: flavonoids (2,4). Flavonoids are found in various plant foods such as fruit, vegetables, soy products, nuts and seeds, spices, cocoa, and beverages such as tea and wine. Previous research has demonstrated that flavonoids have a wide range of potential health benefits such as antioxidant, anti-carcinogenic and anti-inflammatory effects (5). Studies have investigated the effects of total flavonoid intake, as well as the effects of specific flavonoids. There is growing evidence that suggests there may be an inverse association between the flavonoid! 1!
13 subclass flavan-3-ols, and CVD (6). Flavan-3-ols are one of the seven major flavonoid subclasses, and particularly high levels are found in apples, black tea, wine, blueberries, cocoa and cocoa products (6). It has been proposed that flavan-3-ol may have specific effects on vasculature, in particular enhancing the activity of endothelial nitric oxide synthase (enos), which promotes endothelial relaxation, thus improving vascular health (7). Furthermore, it may have antioxidant and anti-inflammatory properties, which all help to explain its potential effect on reducing the risk of CVD (8). The health and wellbeing of many New Zealanders could potentially be improved by increasing their consumption of flavonoids, as long as a balanced diet high in fruits, vegetables and whole grains, and low consumption of foods high in added sugar, sodium and fat (particularly trans and saturated fats) is followed. The aim of this thesis is to develop a flavonoid database so the intake of flavonoids in New Zealand adults can be determined. This will be used to investigate whether a higher intake of flavonoids, in particular flavan-3-ols, is associated with lower 5-year CVD risk score in New Zealand adults.! 2!
14 2 Literature Review 2.1 Introduction CVD is defined as any abnormal condition characterised by dysfunction of the heart and blood vessels and includes coronary heart disease (CHD) or ischemic heart disease (IHD), cerebrovascular disease or stroke, and peripheral artery disease (2). CVD is an ongoing burden on society, and is a leading cause of death for adults worldwide (2). In New Zealand, CVD accounts for 40% of all deaths annually (9). The two leading causes of death from CVD are IHD and cerebrovascular disease (2). Worldwide, CVD accounts for approximately 30% of all deaths, resulting in approximately 17.5 million deaths annually (10). It is predominantly a burden in developed countries, but rates are also increasing in developing countries (2,6,9). Decreases in rates of CVD can be seen in countries where active attempts have been made to reduce cardiovascular risk factors, and where resources and facilities are available to treat those suffering acute cardiovascular events (2). In New Zealand age-standardized CVD mortality has halved over the past 30 years as a result of active attempts to reduce CVD risk factors, in part as a result of increased rates of prescription medications such as statins and lower rates of smoking (2). However, rates still remain high, and burden certain populations within New Zealand more than others. Maori, Pacific Islanders and those of low socioeconomic status bear the greatest burden of CVD in New Zealand (11). Mortality rates from IHD in the Maori population are 2.5 times that of non-maori, and Maori are 1.5 times more likely to be hospitilised due to IHD than non-maori. Further, stroke mortality is 1.7 times higher for Maori than non- Maori, and stroke hospitilisation rates are twice as high (12). Many individuals are affected and die prematurely as a result of this largely preventable! 3!
15 disease (13). Approximately a quarter of Disability Adjusted Life Years (DALYs) lost by New Zealanders are as a result of CVD. IHD results in approximately 73,804 DALYs, with stroke resulting in DALYs (14). Furthermore, there is a significant economic burden on the health sector as a result of CVD. A study by Scott et al (1993) estimated that in New Zealand, direct medical costs attributed to CVD were $179 million, and indirect costs such as practitioners fees, and the need to supplement wages were between $14-$24 million (15). This study took place between 1989 and 1992, thus costs are likely to be higher in today s economy. There are also various intangible and indirect costs of CVD due to pain, suffering and anxiety experienced by not only individuals suffering from CVD, but their families too CVD Risk Assessment Tools There are various well established CVD risk factors including obesity, hypertension, dyslipidaemia, smoking and diabetes (6,16,17). Due to the synergistic interaction of CVD risk factors, various multivariate risk prediction tools have been developed worldwide to yield estimates of absolute CVD risk by combining risk factor information (Table 2.1) (18,19). There have also been disease-specific formulations developed to predict specific components of CVD such as stroke or CHD (19). In terms of primary care, individual health care interventions should be targeted at those with a high total or absolute cardiovascular risk instead of single risk factor levels above traditional thresholds (20). Risk assessment tools help identify those with many marginal risk factors which act synergistically to have potentially harmful overall effects. It also helps to ensure those with one isolated risk factor are not unnecessarily alarmed, as having a single risk factor does not necessarily mean they have a high risk of CVD (16,19,21,22).! 4!
16 Risk assessment tools are derived from data from cohort studies that assess the relationship between risk factors and risk of CVD. The first risk assessment tool was developed from the Framingham Heart study in 1967, which was based on a population of mostly Caucasian Americans. It has since been modified to determine total CVD risk, as well as risk for outcomes such as CHD and stroke, as it recognised that different risk factors contribute to these diseases (23). The Framingham risk score has been validated in both African-American and Caucasian populations in the United States, and with calibration, can be used on certain populations in Europe, the Mediterranean and Asia (19). However, this tool is not necessarily reliable at predicting CVD risk in other populations, as risk assessment depends on the background risk of the population that is being assessed (24). Environment and behavioral differences between countries results in different rates of CVD morbidity and mortality, therefore unique risk scores need to be used for each population (2,18,25). As shown in Table 2.1, various risk prediction tools have been produced since the Framingham risk score including the Reynolds risk score, the Scottish Intercollegiate Guidelines Network to assign preventative treatment (ASSIGN) score, the Systematic Coronary Risk Evaluation (SCORE) score, the Prospective Cardiovascular Münster (PROCAM) score, and the QRESEARCH Cardiovascular Risk (QRISK1 and QRISK2) algorithms (6,18). These risk scores have been adapted for use in primary care as simple charts, tables and computer programs or tools, for ease of use by health care professionals in establishing those at greater risk of CVD (24). These risk scores are different as they have been developed to detect CVD risk in each specific population. They take into account different risk factors that are most important for the particular population they are estimating CVD risk for.! 5!
17 2.1.2 CVD Risk Assessment in New Zealand Identifying those with increased CVD risk is important if New Zealand is to reduce levels of CVD morbidity and mortality. As discussed previously, using multiple risk factors is more advantageous than investigation of single factors (26). Therefore, in New Zealand, risk assessment charts have been developed which assess an individual s absolute 5-year CVD risk, so individuals at high risk of cardiovascular events can be identified and receive appropriate lifestyle advice and/or drug treatments (26,27). These risk charts were developed based on the risk equation used from the Framingham Heart study (26). The New Zealand risk score charts are believed to predict 5-year cardiovascular events in New Zealand in men years, and women years, more accurately than the Framingham risk score (26). This is because it takes into account population specific information such as higher CVD risk in Maori, Pacific and Indo-Asian populations within New Zealand, and it calibrates the formula accordingly CVD and Diet Primary prevention of CVD is predominately attainable by maintaining a healthy lifestyle, including physical activity and a well balanced diet (4,21). There is convincing evidence from various intervention and epidemiological studies that diet can be modified to reduce CVD risk (2,28). For example, the Dietary Approaches to Stop Hypertension (DASH) trials demonstrated that relatively high intake of fruits, vegetables and low-fat dairy, and low intake of sodium, resulted in improvements in BP (2,3,9,10). The Oslo trial in 1989, which consisted of 1232 males with a total cholesterol (TC) between , found that with a total and saturated fat reduction, and higher intake of fibre rich fruit, vegetables and wholegrains, TC was reduced by an average of 13 percent (2,29).! 6!
18 Various epidemiological studies demonstrate how dietary patterns can influence the risk of CVD. For example, there are lower rates of CVD in those who consume a Mediterranean diet, which is low in total and saturated fat, and high in oleic and alphalinoleic acids, fruits, vegetables and wholegrains (2,30). For example, the Lyon Diet Heart Study, a randomised controlled trial (RCT) consisting of 605 participants, demonstrated the beneficial effects of the Mediterranean-style diet (25). The experimental group were instructed to eat more bread, more vegetables, fruit at least once daily, more fish, less red meat (replace with poultry), margarine instead of butter and cream, and to use rapeseed and olive oil. Those in the control group received general dietary advice. After 46 months of follow up it was noted that there were significant beneficial effects in the experimental group consuming the Mediterranean diet, with 50-70% lower risk of recurrent heart disease than those in the control group (25). The so called Western Diet with higher than recommended intakes of saturated and trans-fats, salt and sugar, and low intakes of cardioprotective foods such as fruit and vegetables is a contributing factor in the high rates of CVD observed in New Zealand (2). It is likely that specific nutrients in foods (such as potassium in fruit in vegetables, or linoleic acid, DHA and EPA in fish and fish oils) can reduce risk of CVD (2,31). There are also other non-caloric, non-nutrient constituents in plant foods that may have cardioprotective benefits, one being flavonoids (6,32). Epidemiological data surrounding the association between flavonoids and CVD is growing (33).! 7!
19 Table 2.1 Worldwide cardiovascular risk assessments scores Risk Assessment Score Participants Sample size Years of followup Factors included in risk score Risk score purpose, and inclusion criteria Major changes Limitations Rationale for inclusion Reference Framingham Men and women from the original Framingham cohort aged years. Conducted in the United States of America. N= men 2669 women 12 years Sex, age, serum TC, systolic blood pressure (SBP), relative weight, haemaglobin, smoking status ECG or Left ventricular hypertrophy. Probability/risk of developing CHD in 12 years, Including: definite myocardial infarction (MI), coronary insufficiency, angina pectoris, and/or death from coronary heart disease. This study was the original CVD risk study which was used to develop risk assessment score, named the Framingham risk score. Truett, Cornfield et al. (1967) (23) Framingham Men and women from the original Framingham cohort aged years. Conducted in the United State of America. N=not reported 16 years Sex, age, TC, SBP, smoking status, glucose tolerance, left ventricular hypertrophy. Probability/risk of developing CHD in 6 years, including: MI, coronary insufficiency, angina pectoris, sudden death, and/or coronary attack. Glucose tolerance introduced. Didn t use weight or haemoglobin. ECG abnormality was restricted to left ventricular hypertrophy. It recognised that several independent factors lead to CVD and they must all be assessed to develop a risk score. Gordon et al. (1971) (34)! 8
20 Risk Assessment Score Framingham Participants Men and women from the original Framingham cohort aged years at baseline. Conducted in the United States if America. Sample size Years of followup Factors included in risk score N=5,209 8 years Age, gender, TC, diastolic blood pressure (DBP), smoking, glucose tolerance, left ventricular hypertrophy. Risk score purpose, and inclusion criteria Probability/risk of developing CVD in 8 years: coronary heart disease, brain infarction, intermittent claudication, hypertensive heart failure, total CVD. Major changes Includes glucose intolerance. Limitations Cannot be used once CVD has developed. Only appropriate for those free of CVD. Rationale for inclusion This enabled assessment of separate CVD outcomes that significantly contribute to mortality, and may require different treatment measures. Reference Kannel, McGee et al. (1976) (35) Framingham Men and women from the original Framingham cohort aged years at baseline. Conducted in the United States if America. N=5, years Age, gender, TC, HDL cholesterol, SBP, smoking, glucose tolerance, left ventricular hypertrophy. Probability/risk of developing Coronary Arterial Disease in 6 years. HDL cholesterol introduced. Cannot be used once CVD has developed. Only appropriate for those free of CVD. This is the first time HDL was considered for CVD risk. It is used in New Zealand s CVD risk charts today as part of the cholesterol: HDL ratio. This is recognised as a significant CVD risk factor today, so its inclusion is paramount. Wilson et al. (1987) (36)! 9
21 Risk Assessment Score Participants Sample size Years of followup Factors included in risk score Risk score purpose, and inclusion criteria Major changes Limitations Rationale for inclusion Reference PROCAM study 1979 Men and Women from PROCAM study in Munster, Germany. N = 5389 men aged years 10 years Age, LDL cholesterol, smoking status, HDL cholesterol SBP, family history of premature MI, diabetes mellitus, triglycerides. Global risk of MI. A major coronary event was defined as the occurrence of sudden cardiac death or definite fatal or nonfatal myocardial infarction on the basis of ECG and/or cardiac enzyme changes. Included information of family history of CHD, triglycerides, and LDL cholesterol, as well as diabetes mellitus. Didn t include left ventricular hypertrophy. This study included only the hard end points of definite MI or sudden coronary death. Took into consideration family history and diabetes mellitus, which are two significant risk factors for CVD. Assmann et el. (2002) (37) SCORE Pooled dataset of cohort studies from 12 European countries: Finland Russia, Norway, UK (BRHS), UK (Scotland). Denmark, Sweden, Belgium, Germany, Italy, France, and Spain. N = women, men 2.7 million person years Age, gender, smoking status, TC:HDL ratio or TC against SBP. 10-year fatal cardiovascular risk. Looking at fatal CVD as the only endpoint. Used TC against SBP. Only looked at fatal CVD risk, instead of fatal, and non-fatal endpoints such as that in Framingham. Didn t include other well established risk factors such as diabetes mellitus. Looked at total CVD risk rather than coronary heart disease risk. Only looking at fatal CVD, as it is difficult to replicate those studies with multiple nonfatal CVD endpoints, which are difficult to ascertain. Also a very large sample size used. Conroy et at. (2003) (38)! 10
22 Risk Assessment Score Participants Sample size Years of followup Factors included in risk score Risk score purpose, and inclusion criteria Major changes Limitations Rationale for inclusion Reference ASSIGN Scottish Heart Health Extended Cohort (SHHEC). includes: Women aged years across 25 districts of Scotland ; the Scottish MONICA project recruited in Edinburgh and North Glasgow 1989 and 1995, North Glasgow again in 1989 and 1995, ages and 1992, ages N = 6540 men and 6757 women Range from 10 to 21 years Age, Scottish Index of Multiple Deprivation, family history, diabetes, smoking status, cigarettes per day (smokers), SBP, TC: HDL ratio. 10 year CVD risk. Endpoints included: deaths from CVD causes, or any hospital discharge diagnosis postrecruitment for coronary heart disease, or cerebrovascular disease or for coronary artery interventions. Used to mitigate potential unfairness in Framingham and similar risk scores when applied across different social groups in the same population. This risk score may overestimate the CVD risk as socioeconomic status is not as decisive an endpoint as something like HDL cholesterol, or smoking status. However, it is an important consideration. This score helps to take into account social deprivation. Social deprivation, or socioeconomic status is a powerful determinant of CVD risk and also decreases chances of receiving medical attention promptly during a coronary event. Woodward et al. (2007) (39)! 11
23 Risk Assessment Score Participants Sample size Years of followup Factors included in risk score Risk score purpose, and inclusion criteria Major changes Limitations Rationale for inclusion Reference QRISK Prospective open cohort study using routinely collected data from general practice. UK practices contributing to the QRE- SEARCH database. Aged years, registered at 318 practices. N = 1.8 million patients 17 years Age, gender, smoking status, SBP, TC: HDL ratio, BMI, family history of coronary heart disease (first degree related aged less than 60), area measure of deprivation, existing treatment with antihypertensive agent. 10 year estimated CVD risk. Endpoints included first recorded diagnosis of cardiovascular disease, MI, CHD, stroke, and transient ischemic attacks. Includes additional variables, which improve risk estimates for patients with positive family history or those on antihypertensive treatment. Area measure of deprivation may overestimate CVD risk, as it is not a well-defined CVD risk factor. Likely to provide more appropriate estimates of risk, on the basis of age, gender and social deprivation. It will help to ensure treatments are directed towards those that are most likely to benefit. Hippisley- Cox et al. (2007) (40)! 12
24 Risk Assessment Score Participants and development of model Sample size Years of followup Factors included in risk score Risk score purpose, and inclusion criteria Major changes Limitations Rationale for inclusion Reference New Zealand Risk assessment charts Individuals Aged 35 to 74 years either enrolled in general electoral rolls or employed by a New Zealand-wide multi-industry corporation, in N = 6354 (4638 men and 1716 women) 5 years Age, gender, TC:HDL ratio, SBP, diabetes mellitus, smoking status, ethnicity (Maori, Pacific or Indo- Asian people), family history of premature coronary heart disease or ischemic stroke in a first-degree relative. 5-year cardiovascular risk score. Hospitilisation and mortality from cardiovascular disease. Only include SBP. Takes into account increased risk in Maori, Pacific and Indo-Asian as having increased risk. Quite population specific, as accounts for specific ethnic groups within New Zealand. Including only SBP as the most informative and conventionally measured BP parameter for CVD risk, so used instead of looking at both SBP and DBP. The risk scores are also calibrated so they can be used in different ethnic groups in New Zealand who are at higher risk. Primary care handbook (2002) (27)! 13
25 2.2 Flavonoids Flavonoids are phenolic substances that are found in various plant species, mainly fruit, vegetables, soy products, nuts and seeds, spices, cocoa, and beverages such as tea and wine (6). It is the glycosylated forms of flavonoids that contribute to the bright colour of many leaves, flowers and fruits (24,30,41). Flavonoids are formed in plants from the three amino acids phenylalanine, tyrosine and malonate. The flavan nucleus consists of 15 carbon atoms arranged in three rings. The different classes have different levels of oxidation, and substitutions around the rings. The flavonoid subclasses of particular interest in human health include flavones, flavanones, isoflavones, flavonols, flavanonols, flavan-3-ols, and anthocyanins, and their oligomeric and polymeric forms, which are found in a variety of plant foods (6,41). Altogether, there are over 8000 individual flavonoid compounds (19,20,41). It has been suggested that flavonoids have antioxidant properties, as they are able to reduce free radical formation and scavenge free radicals. It is also suggested they have antiviral, antiallergenic, anti-inflammatory and vasodilating actions (9,30,41,42). It is the oxidative damage caused by free radicals that plays a role in several diseases such as heart disease and cancer. There are certain antioxidant systems in the human body that work to prevent damage from free radicals, which work via endogenous antioxidants that are produced in the body, and exogenous antioxidants that are obtained from the diet (41). Dietary antioxidants have been studied intensively for many years, and include vitamins A, C, E, and carotenoids, which if consumed in high quantities help to reduce the detrimental impacts of oxidative damage over the life course (6,17,20,41). Over the past decade, it has been demonstrated that other substances in plant foods may also have antioxidant properties, such as the plant polyphenols: phenols, phenolic acids, flavonoids, tannins and! 14
26 lignans (9,14,41-44). Flavonoids have important roles in the physiology of plants, and are also important components in the human diet. They are considered a 'non-nutrient' as they have no caloric value, however, they are consumed in much higher quantities than antioxidant vitamins such as vitamin C (99mg/day for New Zealand men and women) or E (11.5mg/day for New Zealand males and 9.1mg/day for New Zealand females), with an intake of approximately mg/day (12,15,43,45,46). There have been no studies to date investigating flavonoid consumption in New Zealand adults Flavonoids and Chronic Disease Epidemiological evidence shows that flavonoids play a preventative role in chronic diseases such as CVD and cancer. Several RCTs have demonstrated that even modest intakes of flavonoid-rich foods may reduce the risk of certain CVD risk factors (2,6,8,17,20). Various observational studies have demonstrated the effects of flavonoid intake on chronic disease. A study by McCullough et al. (2012) - a large prospective cohort study carried out in the US on a total of 38,180 men and 60,289 women, demonstrated that higher intakes of flavan-3-ols are associated with a lower risk of CVD (6). There is also evidence that flavonoids reduce the risk of type 2 diabetes mellitus (T2DM). A study carried out in the US by Wedick et el. (2012), prospectively evaluated the association between flavonoid intake and T2DM in 3 large cohorts. The study included a total of 70,359 women in the Nurses' Health study (NHS) and NHS II, and 41,334 men in the Health Professionals Follow-up Study. It was found that higher intakes of the flavonoid subclass anthocyanins, was significantly associated with a lower risk of T2DM (45).! 15
27 2.2.2 Flavonoids Mechanisms of Action The antioxidant mechanism of action for flavonoids works by inhibiting superoxide anion production, and also the inhibition of the activity of enzymes that are involved in the generation of reactive oxygen species such as lipoxygenase, glutathione S-transferase and NADH oxidase (6,8,45). It is these antioxidant properties that reduces the risk of disorders such as coronary artery disease, stroke, and other vascular diseases, that occur partly as a result of oxidative stress (7). It has also been demonstrated that flavonoids have antiinflammatory actions, increase nitric oxide (NO) production and reduce LDL cholesterol oxidation (4,6,30). These functions help improve endothelial function leading to improvements in vasodilation and blood pressure, and thus reduce the risk of CVD. Other beneficial effects include improvements in insulin secretion and sensitivity, glucose tolerance and metabolism, and B-cell function, thus decreasing the risk of T2DM (6,45,47). It is outside the scope of this thesis to review the literature on all flavonoids and CVD risk factors, therefore the focus of this literature review will be on Flavan-3-ols. 2.3 Flavan-3-ols Flavan-3-ols are one of the seven major flavonoid subclasses. Monomers of flavan-3-ol include: (+)-Catechin, (+)-Catechin-3-gallate, (-)-Epicatechin, (-)-Epicatechin-3-gallate, (-) -Epigallocatechin, (-)-Epigallocatechin-3-gallate, (+)-Gallocatechin, and (+)- Gallocatechin-3-gallate (48). Common plant sources of include apples, black tea, red wine, blueberries, cocoa and cocoa products (6,28,30,33). Particularly high levels of flavan-3-ols are found in cocoa and subsequently chocolate (6,8,28,47). Darker chocolate contains more cocoa, and thus has a higher content of flavan-3-ols. The protective effect of cocoa on CVD has largely been ascribed to the high content of flavan-3-ol and its monomers (epicatechin and catechin) (31,49,50). Subsequently, the majority of research has focused! 16
28 on the effect of flavan-3-ols through intakes of cocoa products, and their effects on health Flavan-3-ols and CVD There has been recent interest in the relationship between different flavonoid subclasses and the risk of CVD. In particular, there has been evidence from both observational and experimental research that demonstrates there is an inverse relationship between the intake of the flavonoid subclass flavan-3-ol, and CVD risk (Table 2.2). Early migration studies demonstrated the relationship between cocoa intake and CVD. The Kunan Indians from indigenous islands in Panama had traditionally high cocoa consumption, and very little incidence of hypertension and CVD. It was observed that when they emigrated to Panama City, their consumption of cocoa containing beverages decreased by a factor of ~10, and their mean BP increased SBP by 3.8mmHg, and DBP by 5.6mmHg (50). As shown in Table 2.2, there have been several observational studies investigating the relationships between cocoa, chocolate and flavan-3-ol intake; and CVD biomarkers, rates of CVD events, and rates of CVD mortality. A study by Janszy et al (2008) in Sweden, demonstrated an inverse dose-dependent relationship between intake of chocolate, and risk of CVD events in 1169 non diabetic patients hospitalised with a confirmed first acute MI. Compared to those who never ate chocolate, there was a 27%, 44%, and 66% lower relative risk of cardiac mortality for those that ate chocolate less than once per month, up to once per week and twice or more per week respectively (43). This demonstrated even modest consumption of flavan-3-ol rich chocolate may reduce the risk of CVD events in those already susceptible to CVD. A large prospective cohort study by McCullough et al. (2012), which included 38,180 men! 17
29 and 60,289 women, investigated the intake of specific flavonoid subclasses and the risk of fatal CVD. It was found those in the highest quintile for flavan-3-ol intake had a 17% lower risk of fatal CVD than those in the in the lowest quintile for flavan-3-ol intake (6). In comparison, a cohort study from the Iowa Women s Health Study of 34,489 postmenopausal women who were free from CVD, found there was no relationship between flavan-3-ol intake and CVD (17). These differences in findings may be due to the difference in sample size, or potentially a difference in the effects of flavonoids between genders. In support of these findings from various observational studies, several RCTs have shown a positive relationship between cocoa and chocolate flavonoids on certain CVD risk factors such as lipid profile, BP, LDL oxidation, plasma antioxidant activity, arterial flow mediated dilatation (FMD), and platelet aggregation (28,31,41). Note that FMD is used as a marker of endothelium function, as it helps to determine the NOdependent endothelium-mediated dilatory response in an artery (28,41,51). There is also evidence that a high intake of flavan-3-ols is likely to have a beneficial effect on endothelial function in both healthy individuals and those with increased CVD risk. Heiss et al. (2003), found ingestion of high flavan-3-ol cocoa in individuals with one CVD risk factor, improved endothelial function via improved FMD 2 hours after ingestion (52). Similarly, a RCT by Wang-Polagruto et al. (2006), on 32 postmenopausal women with hypercholesterolemia, demonstrated that there were beneficial vascular effects as a result of consumption of flavan-3-ol rich chocolate (47). A study by Faridi et al (2008), looking at endothelial function in 45 obese individuals after consumption of either a cocoa beverage or a placebo, had similar findings (31). A RCT by Engler et al (2004), investigated the short term effects of flavonoid-rich dark chocolate intake on endothelial function in 21 healthy adult subjects. It was found high flavonoid rich chocolate! 18
30 consumption improved endothelium-dependent FMD of the brachial artery, compared to those consuming low-flavonoid rich chocolate (7). These results are important, as endothelial function is a key determinant of cardiovascular health. Although sample size in these studies is small, they are important as they demonstrate a high intake of flavan-3-ols may have significance in both the prevention of CVD, as well as in the management of disease in those with established CVD. Further studies with more participants are necessary to confirm these results. There have been several studies that have investigated the relationship between intake of flavan-3-ols and BP, a well-established CVD risk factor. An inverse association between flavan-3-ols and BP has been demonstrated in several studies. A recent systematic review of 31 RCTs used a meta-regression model to determine the relationship between the dose of the flavan-3-ol monomer epicatechin, and BP. It was found that an intake of 25mg of epicatechin/day (corresponding to 25-30g dark chocolate) significantly reduced both SBP (-4.2 mmhg) and DBP (-2.1mmHg), which may have clinically significant effects for CVD (49). Similarly, a systemic review of 42 RCTs and 1297 participants by Hooper et al. (2012) examined the effect of chocolate, cocoa, and flavan-3-ols on major CVD risk factors. It was found there were significant reductions in BP after intake of the flavan-3-ol monomer epicatechin at intakes >50mg/day (4). It has also been demonstrated that a high intake of flavan-3-ols has beneficial effects on other CVD biomarkers such as lipid profile, lipid oxidation, insulin sensitivity and resistance (4,26,44). Curtis et al (2012), examined the relationship of CVD and the combination of flavan-3-ols and isoflavones in postmenopausal women with T2DM (44). This study showed that combined flavan-3-ols and isoflavones significantly improved lipoprotein status and markers of insulin sensitivity (HOMA-IR and QUICKI). It was also observed that the estimated 10 year risk of CHD! 19
31 was reduced in the experimental group (44). As previously mentioned, there have been several observational studies that have demonstrated a beneficial effect of increased intake of cocoa containing food and beverages on the risk of CVD. It is important to note that cocoa products such as chocolate are often high in sugar and fat, and high intakes of these foods increase the risk of obesity, and thus CVD. In the German EPIC (European Prospective Investigation into Cancer and Nutrition) cohort, it was concluded to see the observed effects on CVD risk, one may have to consume around 50g chocolate/day, which provides ~230kcal. Thus, there is potential for adverse effects on weight if the diet is not energy balanced (4). Several RCTs have examined whether cocoa products with and without sugar affected its relationship to CVD, with findings that suggest both intake of both sugar-sweetened and sugar-free cocoa products have beneficial effects on endothelial function such as FMD. However there were close to significant findings that sugar may have attenuated the beneficial effects (31,53). Therefore, it is important to consider how much chocolate or cocoa products would be beneficial to recommend in practice, and whether it would be more beneficial to consider sugar-free cocoa products. The longest RCT was for 18 weeks, and only 7 trials had an intervention period of more than 6 weeks. It has been suggested that these outcomes were greatest in acute studies, suggesting there may not be long term benefits of cocoa consumption (4,28,30,52). GRADE suggests there is low to moderate quality evidence that there are beneficial effects with increasing doses of flavan-3-ols. There was no suggestion that increased intakes have any negative effects (4,8). Therefore, further larger long-term trials are required to give a better understanding of the relationship between flavan-3-ol and absolute CVD risk.! 20
32 2.3.2 Flavan-3-ols Mechanisms of Action In vitro studies suggest that flavonoids may have specific vascular effects, and certain mechanisms of action have been suggested. Endothelium derived NO is a signaling molecule that ensures vascular homeostasis. Bioactive NO helps reduce platelet adhesion as well as amplify relaxation of smooth muscle resulting in vasodilatation (49,51). Flavan- 3-ols may have the potential to increase nitric oxide synthase (NOS) activity, which in turn increases the pool of bioactive NO (4,8,28,41,52). This can explain improvements in BP and FMD after intake of flavan-3-ol rich cocoa products (8,41,46). It has also been demonstrated that flavan-3-ols have antioxidant and anti-inflammatory properties, which help to explain the observed reduction in LDL oxidation and platelet aggregation. It has also been shown in vitro to improve glucose transport, insulin sensitivity and insulin resistance (4,8,28,41). These mechanisms of action help to explain why improvements have been seen in tests such as HOMA-IR and QUICKI, and improved glucose tolerance in various RCTs. These mechanisms of action have been supported by evidence in vitro, ex vivo and in animal studies (28,41,46). However these findings cannot necessarily be translated to in vivo potentials in humans due to uncertainties surrounding bioavailability (28,41). It has been demonstrated that a small part of the ingested flavonoid is absorbed, however a large part is degraded by intestinal microflora to different phenolic acids, and high quantities do not reach the blood stream (41). Bioavailability may also depend on the kind of food that is ingested. It has been suggested that proteins may bind to the polyphenols, thereby reducing their availability (28,41). In comparison, alcohol (such as red wine), or fat (such as dark chocolate) may increase availability (41). This is important to consider in a clinical setting when recommending what level of flavan-3-ol intake would be required to show benefits.! 21
33 Table 2.2 Studies investigating flavan-3-ol intake and CVD risk Reference Heiss et al. (2003) (52) Purpose/ Objective To assess the time-course of flavan-3-ol effects on FMD after intake of flavan-3-ol. Population, Setting, Sample, Age Range N = 26 participants with at least 1 CVD risk factor, with mean age of 45 years, and mean BMI 25. Study conducted in Germany. Study Design Double blind crossover RCT. FMD was measured at 0,2,4,6 hours after ingestion of a 100mL cocoa drink containing 176mg of flavan-3-ol (70mg epicatechin plus catechin, 106mg of procyanidins), or control (100ml cocoa with <10mg flavan-3-ol). Methods/ Measures The sum of nitrosylated and nitrosated species (collectively referred to as RNO) were measured. Also measured the FMD of the brachial artery. Key Findings Conclusions Rationale for inclusion Ingestion of 100mL of cocoa with flavan-3-ol increased FMD maximally at 2 hours. Cocoa drink with no flavan-3-ol did not affect FMD. Increase in RNO from 22 to 36 in the group with high flavan-3-ol cocoa (p<0.001), and changes in RNO and FMD were correlated (p = 0.02). A single dose of 100ml cocoa drink high in flavan-3-ol transiently increases NO bioactivity in plasma, and reverses endothelial dysfunction. There is a correlation between FMD and RNO suggesting the effects on endothelial function are a result of increased NO availability. This was one of the first studies to demonstrate high intakes of flavan-3-ol are likely to improve vascular function in those with increased risk of CVD. It also depicted the relationship between flavan- 3-ol and nitric oxide availability and thus activity. Limitations and Further Research Needed Very short term study. It therefore doesn t conclude the long-term clinical effect of high intakes of flavan-3-ol and CVD risk.! 22
34 Reference Purpose/ Objective Population, Setting, Sample, Age Range Study Design Methods/ Measures Key Findings Conclusions Rationale for inclusion Limitations and Further Research Needed Engler et al. (2004) (7) To determine the effect of flavonoid-rich dark chocolate on endothelial function. N = 21 healthy adult subjects. Study conducted in California, Unites States of America. Randomised, double-blind, placebocontrolled trial over 2 week period. Subjects randomly assigned to daily intake of high-flavonoid (213mg procyanidins, 46mg epicatechin), or low-flavonoid dark chocolate. FFQ to determine intake of other antioxidant nutrients. Triacylglycerol, TC, LDL, HDL, LDL oxidation, epicatechin, total antioxidant capacity. Also endotheliumdependent FMD of brachial artery and BP. The means change in FMD was significantly different in the high versus lowflavonoid group after 2 weeks of chocolate consumption (p = 0.024). There was a significant increase in plasma epicatechin concentration in the high-flavonoid group (p <0.001), but not the lowflavonoid group. No change in biomarkers of antioxidant and oxidative stress. Dark chocolate high in flavonoids improved endotheliumdependent vasodilation. It was demonstrated that this was associated with the observed increase in epicatechin concentration after consumption of high-flavonoid chocolate. First clinical trial to demonstrate improved endothelial function in healthy adults following short-term intake of high flavonoid chocolate. Small sample size, and short duration of study. This may have been a reason for lack of results of lipid profile and oxidative stress measures.! 23
35 Reference Grassi et al. (2005) (54) Purpose/ objective To compare the effects of different kinds of chocolate bars (either dark or white) on BP, glucose and insulin response, and oral-glucose tolerance tests in healthy subjects. Population, setting, sample, age range 15 Healthy persons (7 men and 8 women) aged /- 7.6years recruited from medical staff. Study conducted in L Aquila, Italy. Study Design Randomised controlled trial: Participants randomly assigned to 100g dark chocolate bars, which contained ~500mg polyphenols, or 90g white chocolate bars, which contained no polyphenols, for 15 days. Methods/ measures Effects of dark or white chocolate bars on BP and glucose and insulin response to an oral glucosetolerance test. Key Findings Conclusions Rationale for inclusion HOMA-IR was significantly lower after dark chocolate than after white chocolate ingestion (0.94 +/ compared with /- 0.62; p < 0.001). SBP was lower after dark than after white chocolate ingestions ( /- 8.6 compared with /- 8.4mmHg; p <0.05). This study demonstrated that dark chocolate which is high in polyphenols reduces BP, and improves insulin sensitivity in comparison to white chocolate. Indication that dark chocolate may have a protective action on the vascular endothelium. This demonstrates that chocolate rich in polyphenols are likely beneficial for CVD risk factors, in comparison to a food with a similar nutrient composition but no polyphenols. Limitations of Study and further research needed Small sample size. Larger scale trial would be needed to confirm these observed effects on BP and insulin sensitivity. Only carried out in healthy subjects, so would be useful to determine impacts on those who have hypertension or are overweight/ob ese.! 24
36 Reference Wang- Polagruto et al. (2006) (47) Purpose/ Objective To determine if chronic dietary intake of flavonoid rich cocoa-based products on endothelial function and cardiovascular health on hypercholesterole mic postmenopausal women. Population, Setting, Sample, Age Range N = 32 postmenopausal women with hypercholesterolemia. Study conducted in California, United States of America Study Design Randomised, double-blind, parallel-arm study. Participants were assigned to either a highflavanol cocoa beverage (446mg total flavanols), or a low-flavanol cocoa beverage (43mg total flavanols) for 6 weeks. Methods/ Measures Endothelial function was determined by brachial artery reactive hyperemia. Plasma was analysed for lipids (TC, HDL, LDL), hormones, total nitrate/nitrite, activation of cellular adhesion markers, and platelet function and reactivity. Key Findings Conclusions Rationale for inclusion There was a significant increase (76%) in brachial artery hyperemic blood flow (p<0.05) after 6 weeks of cocoa ingestion in the group consuming high flavanol cocoa, compared with only a non significant (32%) increase in the low flavanol cocoa group. There was also a 2% increase in FMD. There was a significant decrease in plasma levels of soluble vascular cell adhesion molecule-1. It was concluded there were beneficial vascular effects of consumption of high flavanol-cocoa products in hypercholesterolemic women. As the vascular health is a primary regulator of cardiovascular disease, these improvements suggest that high-flavanol products will help reduce the risk of CVD. This was the first study to look at flavanol consumption in this group of individuals, which is important as this group is at higher risk of CVD. This adds to the body of evidence that a flavanol rich diet provides cardiovascular protection. The study also measured plasma epicatechin concentration so this could be correlated to improved FMD. Limitations and Further Research Needed Small sample size. Was not clear which specific components of the flavanolrich chocolate contributed to the observed benefits, so cannot be concluded if it is purely attributable to flavan-3-ol.! 25
37 Reference Mink et al. (2007) (17) Purpose/ Objective Using the USDA database, estimate dietary flavonoid intake and determine the relationship between flavonoid intake and CVD mortality. Population, Setting, Sample, Age Range N = postmenopausal women from the Iowa Women s Health Study who were free from CVD. Study conducted in Iowa, United States of America. Study Design Cohort study from the Iowa Women s Health Study, of postmenopausal women who were free from CVD. Completed a FFQ at baseline, and determined intake of 7 subclasses of flavonoids. Intakes were categoriesed into quintiles. Women were followed up after 16 years. Methods/ Measures CVD, CHD, stroke and total mortality. Key Findings Conclusions Rationale for inclusion The only flavonoids associated were: anthocyanidins and CHD, CVD and total mortality, and between flavanones and CHD, and between flavones and total mortality. For individual foods, chocolate was associated with CVD (as well as bran, apples or pears or both and red wine, grapefruit and strawberries either CVD, CHD, stroke, or total mortality). Certain flavonoids and food groups were associated with reduced risk of CHD, CVD and all causes mortality. This study showed that flavan-3-ol may not be significantly associated with reduced risk of CVD, but that chocolate (which is high in flavan-3-ol), may reduce risk, therefore it may be other components in chocolate other than flavan-3-ol that acts to reduce CVD risk. Limitations and Further Research Needed This study is only observational, and they may not have determined all foods high in flavan-3-ol in the FFQ, for example dark chocolate, which will significantly contribute to total flavan-3- ol intake.! 26
38 Reference Faridi et al. (2008) (31) Purpose/ Objective To determine the effects of dark chocolate and liquid cocoa intake on BP and endothelial function in obese individuals. Population, Setting, Sample, Age Range N = 45 adults. Mean age 52 years. Study conducted in Connecticut, United States of America. Study Design Randomized, controlled, single-blind crossover trail. Phase 1 - Participants consumed either a solid dark chocolate bar (22g cocoa powder) or a cocoa-free placebo bar. Phase 2 participants consumed sugar-free cocoa (22g cocoa powder), sugared cocoa (22g cocoa powder) or a placebo (0g cocoa). Methods/ Measures Endothelial function via FMD, BP (SBP and DBP). Key Findings Conclusions Rationale for inclusion Solid dark chocolate and liquid cocoa improved FMD compared with placebo (p <0.001). Dark chocolate and sugar-free cocoa reduced BP compared to placebo (p = 0.01). Sugar-free cocoa improved endothelial function significantly more than regular cocoa (p <0.001). Both dark chocolate, and liquid cocoa improve endothelial function and BP in overweight individuals. Sugar-free cocoa products may augment these effects. Various studies have demonstrated benefits of chocolate and cocoa on CVD risk factors due to high flavanol content, but this was the first study that demonstrated that the sugar in these foods might attenuate its effects. This is important, as high sugar intake is associated with obesity, which increases the risk of CVD. Limitations and Further Research Needed The study was of short duration, so only demonstrated the short term effects of chocolate and cocoa ingestion, and not its long term impacts on CVD risk, or risk factors. Further, it did not specify the amount of flavonoid in the chocolate, or measure blood levels of epicatechin, thus one cannot determine if beneficial effects are a result of these compounds.! 27
39 Reference Janszky et al. (2009) (43) Purpose/ Objective To determine the long-term effects of chocolate consumption in those with established CHD. Population, Setting, Sample, Age Range N = 1169 nondiabetic patients hospitilised with a confirmed first acute MI. Study conducted in Stockholm, Sweden. Study Design Populationbased inception cohort study, in Sweden, as part of the Stockholm Heart Epidemiology Program. Participants self-reported their usual chocolate intake over the past year. 8 year follow up. Methods/ Measures Cardiac mortality, and nonfatal outcomes. Key Findings Conclusions Rationale for Inclusion There was a significant inverse association between chocolate consumption and cardiac mortality. Hazard ratios for those who consumed chocolate less than once per month, up to once per week and twice or more per week was 0.73, 0.56, and 0.34 respectively. Chocolate, which is high in flavonoids, reduced the risk of cardiac mortality. This relationship is dose dependent, with higher chocolate intakes associated with lower CVD risk. This study clearly demonstrated there is a doseresponse relationship between high flavonoid chocolate and CVD. This is important as it demonstrates those at higher risk of CVD events may benefit from moderate chocolate consumption. Limitations and Further Research Needed Causality cannot be determined as the study is subject to various confounding variables. The type of chocolate consumed was not differentiated, so levels of cocoa, and thus flavonoids cannot be determined. May have been more beneficial to determine quantity of dark chocolate consumed.! 28
40 Reference Njike et al. (2011) (53) Purpose/ Objective To determine the effect of intake of sugarsweetened versus sugarfree cocoa beverages on endothelial function. Population, Setting, Sample, Age Range N = 44 overweight but otherwise healthy individuals. Study conducted in Connecticut, United States of America. Study Design Randomized, controlled, crossover trial. Participants received a sugar free cocoa (22g/d), a sugarsweetened cocoa (22g/d cocoa and 91g/d sugar) or placebo (no cocoa, 110g/day sugar. Treatments were administered twice daily for 6 weeks, with a 4 week washout period. Methods/ Measures Primary outcome measure was endothelial function via FMD in brachial artery. Key Findings Conclusions Rationale for Inclusion Consumption of cocoa-containing beverages (in both sugar-sweetened and sugar-free groups) resulted in improved FMD in comparison to placebo group (p = <0.01). BMI and body weight did not change in the treatment groups versus the placebo. Both sugar-free and sugarsweetened cocoa beverages have the potential to improve endothelial function in overweight but healthy participants. This was the first trial to assess the effects of sugar-free versus sugarsweetened cocoa on endothelial function. It demonstrated that presence of sugar did not impact the beneficial effects of cocoa on endothelial function. Limitations and Further Research Needed Doesn t specify the quantity of flavan-3-ol (or any other flavonoid) in the cocoa beverages. Larger sample size and duration may have seen significant differences between sugarfree and sugarsweetened beverages on endothelial function and waist circumference, which were close to significance.! 29
41 Reference Curtis et al. (2012) (44) Purpose/ Objective To examine the effect of flavan-3-ol on CVD risk in postmenopausal women with type 2 diabetes currently receiving standard care including statin therapy. Population, Setting, Sample, Age Range N = 93 participants aged years receiving standard care for type 2 diabetes. Study conducted in Norfolk, United Kingdom. Study Design Parallel-design, placebocontrolled trail. Subjects consumed 27 g/day (split dose) flavonoidenriched chocolate (850mg flavan- 3-ol [90mg epicatechin] and 100mg isoflavones, or matched placebo for 1 year. Methods/ Measures Insulin resistance (HOMA-IR and QUICKI), HbA1c, blood glucose, TC:HDL cholesterol, LDL cholesterol, 10 year coronary heart disease risk (derived from UK Prospective Diabetes Study algorithm) and BP. Key Findings Conclusions Rationale for Inclusion Reduction in peripheral insulin resistance (HOMA-IR P = 0.004), insulin sensitivity (QUICKI p = 0.04) resulting from decreases in insulin levels (p = 0,02). Significant reduction in TC:HDL ratio (p = 0.01) and LDL cholesterol (p = 0.04). 10-year CHD risk was attenuated (p = 0.02). There was no impact on BP, HbA1c or glucose. This study found that after 1 year intake of flavan-3-ol and isoflavone rich chocolate, CVD risk biomarkers improved suggesting there may be added benefit of flavonoids to the standard CVD risk management in postmenopausal type 2 individuals. This study was the first to look at flavonoid intake and CVD risk in medicated postmenopausal women with T2DM, which is particularly important as this group has increased CVD risk. It also looked at 10 year CHD risk score, instead of exclusively examining CVD risk biomarkers. Was also longer in duration than most other studies. Limitations and Further Research Needed There were various limitations of this study, as it had a high dropout rate (21%), as it was difficult for them to consume the chocolate for the duration of the study. Levels of flavonoid given may be unachievable in a normal diet, so the extent to which the findings can be portrayed in reality is questionable.! 30
42 Reference Ellinger et al. (2012) (49) Purpose/ Objective To determine the effect of epichatechin ingested via cocoa products on change in BP. Population, Setting, Sample, Age Range Not defined. Study Design Systematic review of 16RCTs of SBP and 15 RCTs on DBP, a nonlinear metaregression model was used to determine the relationship of epicatechin dose and BP. Methods/ Measures SBP and DBP. Key Findings Conclusions Rationale for Inclusion An intake of 25mg epicatechin/day resulted in a mean reduction of - 4.2mmHg in SBP and -2.0mmHg in DBP. It was found that BP reduction is dependent on the dose of epicatechin. The reductions observed in BP have clinical significance, as only a small amount (25-30g) dark chocolate (providing 25mg epicatechin), is required to significantly reduce SBP and DBP, and thus the risk of CVD. This study helps to explain why there were no observed effects in certain studies looking at the relationship between epicatechin and BP, and that higher doses are required to have a more beneficial or significant effect. Limitations and Further Research Needed The studies were mostly done in prehypertensive and hypertensive individuals, so these results may not be applicable for normotensive individuals.! 31
43 Reference Hooper et al. (2012) (4) Purpose/ Objective To carry out a systematic review of literature concerning the effects of chocolate, cocoa and flavan-3-ols on major CVD risk factors. Population, Setting, Sample, Age Range N = 1297 Study Design Systematic review and meta-analysis of 42 acute or short-short term chronic parallel or crossover RCTs of chocolate, cocoa, or flavan-3-ols. Methods/ Measures Outcomes included FMD, lipoprotein concentration, BP, fasting insulin, glucose, HbA1c, insulin resistance (by using HOMA-IR and QUICKI, insulin sensitivity index, mean arterial pressure, and CRP. Key Findings Conclusions Rationale for Inclusion Meta-analysis showed there was acute improvement in FMD 2 hours after ingestion of chocolate/cocoa, and after chronic intake. There were also significant reductions in fasting serum insulin concentrations, serum insulin after glucose challenge, HOMA-IR, and ISI after chocolate or cocoa interventions. There were also significant reductions in DBP after chronic intake, as well as marginal significant improvements on LDL and HDL cholesterol. Greater effects This systematic review was able to demonstrate that chocolate or cocoa intervention reduces insulin resistance as a result of a reduction in secretion of insulin. They also concluded the strongest relationship between CVD biomarkers and cocoa intake was FMD. There are weaker relationships between DBP, triglycerides and mean arterial pressure. Benefits of HDL were more significant in This is an upto-date review on all studies looking at flavan-3-ol, chocolate and cocoa consumption, and its relationship to cardiovascular disease. This study also demonstrates there may be a dose-dependent effect of flavan-3-ol (epicatechin), and reduction of DBP, so higher levels of intake may be required to observe significant effects. Limitations and Further Research Needed There were no trials that were at low risk of bias, few were independently funded (i.e. they were funded by industry), which may have effected the conclusions drawn. Therefore results must be interpreted with caution. The studies were all of short duration (<18 weeks). No long term trials have examined the effect of chocolate or cocoa intake and CVD risk biomarkers. As chocolate has the potential! 32
44 Hooper et al. (2012) continued seen at doses of epicatechin >50mg/day. long-term trials. It was concluded the 1.3% increase in FMD is likely to have clinical importance, especially in combination with improved HOMA-IR. to cause energy imbalance in humans, it would be necessary to determine if long-term intakes did impact CVD risk biomarkers, and also CVD risk.! 33
45 Reference McCullough et al. (2012) (6) Purpose/ Objective To observe the relationship between seven different flavonoid subclasses and CVD. Population, Setting, Sample, Age Range N = 38,180 men and 60,289 women with mean age of 70 and 69 years respectively. Study conducted in Massachusetts, United States of America. Study Design Prospective cohort study. Cancer Prevention Study II Nutrition Cohort. Completed questionnaires on medical history and lifestyle behaviors, and a validated FFQ of 152 food items. Cox proportional hazards modeling used to determine RR seven subclasses of flavonoids and CVD mortality after a 7-year follow up. Methods/ Measures CVD mortality. Key Findings Conclusions Rationale for Inclusion Mean flavonoid intakes for both men and women were 268mg/d. It was found the subjects (both men and women) with flavonoid intakes in the top (compared to the bottom) quintile had a decreased risk of fatal CVD. Multivariateadjusted: 17% reduced RR for fatal CVD (men and women) in highest intake of flavan-3-ol, compared to the lowest quintile (p = 0.02) Supports other observational and experimental findings that flavan-3-ol reduces the risk of CVD. Also concluded even small amounts of flavonoid intake may be beneficial, as many of the observations were nonlinear, with lower risk in those with modest intakes. The large size of this prospective study enabled the authors to clearly portray the relationship between flavonoid subclasses and the risk of CVD. It helps support previous observational data that higher intakes of flavan-3-ol reduce the risk of fatal CVD. Limitations and Further Research Needed The data is observational, so causality cannot be concluded. It is possible that flavonoid intake was misclassified, as dark chocolate (a main food containing flavan-3-ol) was not included.! 34
46 2.4 Conclusions The literature demonstrates there may be an inverse relationship between the intake of a) total flavonoids, and b) flavan-3-ols, and CVD risk. However, findings are not homogeneous and there are still gaps in the literature as to dose required, the long-term health benefits of total flavonoids and flavan-3-ols, and their potential effects on CVD. Further, there is yet to be any research investigating the relationship between flavonoid intake and CVD in New Zealand. Therefore, the aforementioned knowledge needs now be applied to the New Zealand population. Findings from other countries may not translate to New Zealand, and the different cultural groups who experience different rates of CVD, specifically Maori and Pacific Islanders. As CVD is one of the leading causes of death in New Zealand, it is of paramount importance to expand on research that may help reduce its prevalence. No studies have investigated the relationship between flavan-3-ol intake and 5- year CVD risk score using a nationally representative sample, or assessed if there is a difference between genders or ethnicities. The present study aims to achieve these objectives.! 35!
47 3 Objective Statement Literature suggests intake of flavonoids/flavan-3-ols and CVD are related; however no research has investigated whether this relationship holds true in New Zealand. The relationships demonstrated from various studies internationally provide insight into what may be expected in New Zealand, yet results cannot be generalized to this population. Thus the objectives of this study are as follows: To expand the NZFCDB to include flavonoids using the two major flavonoid databases in use worldwide: The United States Department of Agriculture (USDA) flavonoid database and Phenol Explorer. To estimate the total flavonoid intake and specifically intake of flavan-3-ols in adults in New Zealand adults using dietary intake data from the NZANS 2008/2009, and to determine if there are differences in intake between different age groups, BMI categories, sex, NZdep quintiles and ethnicities. To assess the relationship between flavonoid/flavan-3-ol intake and 5-year CVD risk scores. Researchers are continuously looking for ways in which diet can influence the risk of chronic diseases, so findings will be important for both science and society. 3.1 Hypothesis A higher total intake of total flavonoids and flavan-3-ols is associated with lower 5-year CVD risk score in New Zealand adults.! 36!
48 4 Participants and Methods 4.1 Study Design The current study is a cross-sectional study design, looking at the relationship between dietary intake of flavan-3-ol and 5-year cardiovascular disease risk score in participants from the NZANS. As this study involves secondary analysis of the NZANS data, no ethical consent was necessary. The Ministry of Health has given permission to use the NZANS data. 4.2 New Zealand Adult Nutrition Survey 2008/2009 Methods Participants The NZANS was a national population-based nutrition survey, conducted on a total of 4721 adult participants. Face-to-face interviews were carried out with each participant to obtain data on their dietary intake and eating patterns, dietary supplement use, food security, body size, BP and biochemical measures. Data from 24-hour food recalls is the primary data used to determine nutrient intake, and ultimately flavonoid intake for the purpose of this study. This study had a total of 1040 Maori, and 757 Pacific Island participants. A representative sample was achieved by oversampling such ethnic groups, as well as younger and older age groups, primarily though screened sampling Hour Food Recalls During the interviews, 24-hour food recalls were carried out in the participant s homes. Interviewers asked each participant to recall all the food and drinks they consumed in the past! 37!
49 24 hours, or the previous day. Interviews were aided using the LINZ24 module of the Abbey software package, a four-step program that helped ensure detailed information was obtained. The first step was a basic food recall, or a quick list of the foods, beverages and supplements consumed over the chosen 24-hour period. The second step required more detailed information to be obtained from the participants, including brand or product names, what time the food was consumed, and where the food was obtained. The third step included questions about how much food or beverage was consumed. This was done using aids such as food photographs and volume measures. The fourth and final step consisted of a comprehensive review of all recorded food and beverages to ensure everything was correct, and give participants another chance to add anything they may have missed out. Interviews were conducted in an even spread throughout the week, with a minimum of 10% during the weekend days to enable data collection representative of food consumption across the week. Further, 25% of the participants were asked to repeat a 24-hour diet recall within one month of the first interview to determine any intra-individual variation in food and thus nutrient intake. This method of dietary assessment was used, as it allowed for an accurate representation of the food and nutrients consumed by each participant Matching to Nutrient Data Food and beverages that were consumed according to the 24-hour recalls were matched to the NZFCDB a database developed and updated by Plant and Food Research Ltd (PFR). Within this database is an electronic subset of data named FOODfiles, which contains 55 core components of 2710 foods. This was used as the primary source of food composition data. There were 11,850 food descriptions reported by the participants, and these food descriptions! 38!
50 were firstly matched to the nutrient line of a food in FOODfiles. If no match was found, overseas food composition data was used. If consumption of the food item was high enough, and there was no match in any database, the food was analysed. For lower frequency food items a recipe was developed and the nutrient content calculated by PFR Anthropometry The participants BMI was measured while they were wearing light clothing and no shoes. Two measurements of height (m), and weight (kg), were taken, and if these differed by >1% a third was taken. The mean of these two (or three) measurements was used to determine BMI using the Quetelet formula: BMI = weight (kg) / height (m) Blood Pressure A total of 4407 participants had their BP measured. In the current study BP measurements from the NZANS were used to determine the participant s 5-year CVD risk scores. BP was measured using an OMRON HRM 907 instrument, which has an automatic cuff inflation, and records pulse, diastolic and SBP. Blood pressure was measured in triplicate. SBP was the only BP measurement used to determine 5-year CVD risk score Blood Samples A total of 3349 participants gave a blood sample. These indices were measured using blood samples collected into three vacutainers from a forearm vein. One 4 ml vacutainer containing ethylene diamine tetra-acetic acid (EDTA) was transported to Canterbury Health Laboratories at 4 C to test HbA1c. One 10ml vacutainer with no additive was allowed to separate at the! 39!
51 local laboratory and the serum was also transported to Canterbury Health Laboratories at 4 C and analysed for TC and HDL cholesterol. Participants were required to give informed consent before any blood samples were collected Diabetes The participant s diabetic status was determined by the history of diagnosed diabetes and the HbA1c measurement in blood. Participants that were categorised as having diagnosed diabetes, or had an HbA1c of greater than 6.5%, were deemed as diabetic New Zealand Index of Deprivation The NZ Index of Deprivation 2006 is a measure of the level of socioeconomic deprivation in each defined meshblock according to the following Census variables: income, benefit receipt, transport (access to car), household crowding, home ownership, employment status, qualifications, support (sole-parent families), and access to a telephone. Individuals are then placed into quintiles 1-5, with quintile 1 being the least deprived areas, and quintile 5 being the most deprived areas. Note meshblocks vary in size from part of a city block to large areas of rural land. Each meshblock abuts another to cover all of New Zealand (27,55). There were a total of 32,173 meshblocks defined in the 2006 Census Ethnic Groups Participants were able to report affiliation with up to nine different ethnic groups. For the NZANS, total response standard output was used. However, prioritised ethnicity was used for the purpose of the current study. This method allocates each participant who affiliates with! 40!
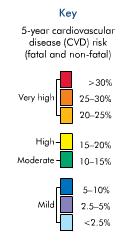
52 one or more ethnic groups to a single mutually exclusive ethnic group based on the predetermined hierarchy system. Ethnicity was classified hierarchically into three ethnic groups: Maori, Pacific and New Zealand European and Others (NZEO) (55). For example, if the participants reported being both Maori and Pacific, they were classified as being Maori. 4.3 CVD Risk Score Based on the self-reported data from the NZANS questionnaire and the blood test results from the NZANS, an individual s 5-year absolute CVD risk was calculated using the New Zealand Cardiovascular Risk Charts (Figure 3.1). The ANS participants were categorized into three risk levels (mild, moderate to high, and high) according to their sex, diabetic status, smoking history, the TC:HDL ratio, SBP, and age. As the age category years is not included in the New Zealand Cardiovascular Risk Charts, calculations for someone who is 35 were used.! 41!

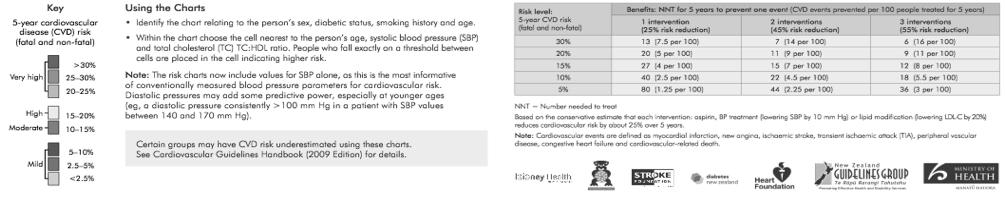
53 Figure 3-1 New Zealand Cardiovascular Risk Charts! 42
54 4.4 Flavonoid Database Development As FOODfiles does not contain data on flavonoid values for foods, it was not previously possible to determine flavonoid intake for participants in the NZANS, and thus in New Zealand. Therefore, in the present study flavonoid data were estimated for the foods in the FOODfiles database using information from the two most complete flavonoid databases worldwide, the flavonoid USDA and the Phenol Explorer databases Flavonoid Databases The USDA Database for the Flavonoid Content of Selected Foods was developed in the United States of America due to the growing evidence and interest in the health effects of dietary flavonoids. This database contains data on 26 different flavonoid compounds from 5 subclasses (flavonols, flavones, flavanones, flavan-3-ols, and anthocyanidins), found in 500 different foods. The data was obtained through analysis of flavonoid content of food in various studies, and only included when the particular data was generated by acceptable analytical procedures. These included methods that lead to good separation of flavonoid compounds such as column chromatography and high-performance liquid chromatography. As well as controlling for analytical methods, all food composition data used was evaluated using a quality index that considered the sampling plan, sample handling, number of samples and quality control. As this database is known for its accuracy in the estimation of flavonoid content in food, it was the primary database used to estimate flavonoid values for the foods the FOODfiles list, in accordance with previous research.! 43!
55 4.4.2 Matching FOODfiles to USDA In order to estimate to flavonoid values for the FOODfiles foods, where possible, direct matches were made to foods from the USDA database. This was done by making sure the names of foods being matched were the same, or the food was very similar. In order to determine if foods were a correct match, energy values (kj) per 100g of the FOODfiles food, and the USDA food were compared. If a food was not considered a close enough match then where appropriate, data from Phenol Explorer database was used, or a composite was developed Matching FOODfiles to Phenol Explorer There were a number of foods in the FOODfiles list that contained flavonoids, for which there was no match in the USDA database. In this case, data from the European FCDB Phenol Explorer was used. This database contains more than 35,000 content values for 500 different polyphenols in ~500 food and beverages. Flavonoid data was derived from the systematic collection of more than 60,000 original content values found in more than 1,300 scientific publications. Each of these publications were critically evaluated before they were included in the FCDB (52,56) Retention Factors It has been reported there is a loss of flavonoids during culinary preparation of raw foods (5,7). Only a small number of cooked foods have been analysed for their flavonoid value in each flavonoid FCDB. As many of the foods in FOODfiles are cooked, there was no exact match in either flavonoid FCDB. If these foods were not included in the updated FOODfiles database, it would underestimate flavonoid consumption. Therefore, cooked foods in! 44!
56 FOODfiles were matched to a raw food in either USDA or Phenol explorer, and adjustments were made due to loss of flavonoids during the cooking process. There are different retention factors depending on the cooking method used. Retention factors are; 0.7 when foods are fried/roasted, 0.35 when microwaved or steamed, and 0.25 when foods are boiled (5,54). These retention factors were applied to all flavonoid subclasses except isoflavones, as they have no cooking losses. The same method was used to provide flavonoid values for cooked foods in the Spanish EPIC cohort by Zamora-Ros et al (2010) (5) Flavonoid Classes and Subclasses Names of flavonoid subclasses used in the USDA were matched to those in Phenol explorer. As names of certain subclasses were different between the two databases, even though they have the same structure, and thus are the same subclass of flavonoid, chemical structure of these were checked to ensure the correct match was made. Data on the following flavonoid Classes were obtained: flavanones, flavones, flavonols, flavan-3-ols, anthocyanidins, isoflavones, and proanthocyanidins. and subclasses are (-)-Epicatechin, (-)-Epicatechin 3- gallate, (-)-Epigallocatechin, (-)-Epigallocatechin 3-gallate, (+)-Catechin, (+)-Gallocatechin, (+)-Gallocatechin 3-gallate, Apigenin, Cyanidin, Eriodictyol, Hesperetin, Isorhamnetin, Kaempferol, Luteolin, Myricetin, Naringenin, Pelargonidin, Peonidin, Quercetin, Theaflavin, Theaflavin-3,3'-digallate, Theaflavin-3'-gallate, Theaflavin-3-gallate, Vanillic acid, Protocatechuic acid, 4-Hydroxybenzoic acid, 2-Hydroxybenzoic acid and 3-Hydroxybenzoic acid Composite Development There were a number of foods in the FOODfiles list that contained flavonoids, however there! 45!
57 was no match in the USDA database or Phenol Explorer. For example, a chocolate-coated biscuit or a vegetable stir-fry would be rich in flavonoids, yet there was no match for these in either database. Therefore a number of composites were developed in order to obtain flavonoid values for these foods. Composites were developed by using either the ingredients on the packaging of the particular food, or finding a recipe on the internet. Recipes from New Zealand websites were used when possible, for example, from Women s Weekly or Healthy Food Guide. The amount or proportion of each ingredient in the composite recipe was based on that in the chosen recipe. Proportions were often adjusted so energy, carbohydrate, protein, fat and water were matched as closely as possible to the FOODfiles food. When recipes were developed using ingredient information from food packaging, proportions were estimated unless specified on the package. Proportions were again adjusted to match the nutrient line of the FOODfiles food as closely as possible. When developing recipes that contained fruit or vegetables, dietary fibre was matched as closely as possible to give a better indication if proportions were accurate. Recipes from the Internet were sometimes used in conjunction with packet ingredient information to make estimations more accurate. Refer to Figure 3.2 for an example of a composite.! 46!
58 Food Name Water g/100g Energy kj/100g Protein, total; calculated from total nitrogen g/100g Fat, total g/100g CHO, available g/100g Proportion of recipe/ingredient in a recipe Nutrient line for food from FOODfiles trying to match: Stirfry, Black Bean Beef, Chinese Recipe using ingredients from FOODfiles in g/100g Pepper,Red Chilli,flesh,raw Sauce,soy Ginger,raw,peeled Garlic,cloves,raw,peeled Beans,black,seeds,raw Onion,flesh,raw Sherry,dry Beef,schnitzel,lean,raw Carrot,raw Broccoli,fresh,raw Mushrooms,flesh and stem,raw Oil,vegetable,blend Courgette,raw Water,municipal Nutrient Line for recipe in g/100g Figure 3-2 Composite for a black bean and beef stir-fry using foods from FOODfiles! 47!
59 4.4.7 Retention factors for composites Retention factors were also applied to composites. In cases where all foods in the composite are cooked (for example, in the stir-fry above), then one retention factor was applied to the whole composite. In some cases, certain ingredients within a composite were not cooked, such as lettuce and tomatoes in a burger. In this case, retention factors were only applied to the foods within the composites that were cooked. Refer to Figure 3.3 for an example of a composite with retention factors applied.! 48!
60 Food Name Water g/100g Energy kj/100g Protein, total; calculated from total nitrogen g/100g Fat, total g/100g CHO, available g/100g Proportion of recipe/ ingredient in a recipe Retention factor Burger,`Big Mac',McDonald's Recipe using ingredients from FOODfiles Yeast,baker's,dried Flour,wheat,white,s tandard Flour,soy,full fat Oil,canola Water,municipal N/A* Salt,iodised,table N/A Tomatoes,assorted variety,flesh,skin and seeds,raw Beef,patty, McDonald's Lettuce,assorted variety,heart,fresh N/A Pickle,McDonald's Cheese, Cheddar, Tasty Sesame seeds, whole, dried, raw N/A Onion,flesh,raw Nutrient Line for recipe in g/100g * N/A given as these foods do not contain any flavonoids, so a retention factor is not applicable Figure 3-3 Retention Factors for Cooked versus Uncooked Ingredients in a Composite using foods from FOODfiles! 49!
61 4.4.8 Adjustments for Concentrated Foods There were several foods in the FOODfiles list that were a concentrated form of a raw ingredient, for example tomato sauce, and instant coffee. Such foods will contain higher levels of flavonoids than the raw food per 100g. Because of this, adjustments were made. The flavonoid content in the raw food was multiplied by a factor that accounted for how much more concentrated the food was in comparison to its raw form. For example, instant coffee powder was 135 times more concentrated than brewed coffee, so the USDA value for coffee, brewed from grounds was multiplied by 135 for each flavonoid in order to give the value for coffee powder from the FOODfiles list Flavonoid Calculations Once all FOODfiles foods had been allocated to either a direct match, a composite had been developed, or it was decided there was no flavonoids in the particular food, flavonoid values were calculated. This was done using Microsoft Excel where flavonoid values from USDA and Phenol explorer were inserted into a spreadsheet beside the FOODfiles foods. They were then adjusted according to retention factors, concentration of foods, and composite foods proportions as described previously. Once flavonoid values were generated the main food sources of total flavonoids and flavan3-ols were also identified from the data. 4.5 Participant Categories For the purposes of this study, data from ANS participants was categorised for various characteristics. Age was split into five categories: 15-18, 19-30, 31-50, and 71+. BMI was split into four categories: underweight (<18), normal (18-25), overweight (25-30) and obese (>30). Sex was split into two categories: male and female. Ethnicity was split into three! 50!
62 categories: Maori, Pacific and NZEO. Finally, NZdep was split into five categories: quintile 1 (least deprived) - quintile 5 (most deprived). Participants were split into tertiles for intake of total flavonoid as follows: Low < 71.32mg/day Moderate intake = 71.32mg mg/day High intake > mg/day Participants were split into tertiles for intake of flavan-3-ols as follows: Low intake <1.82 mg/day Moderate intake = 1.82mg mg/day High intake > mg/day 4.6 Statistical Methods Within each category comparisons were made to determine if there were significant differences for total mean flavonoid intake and mean flavan-3-ol intake; for example it was determined whether there was a difference in total flavonoid intake between different age categories. ANOVA was used to determine if there were differences between the categories and a Bonferonni correction applied for multiple comparisons. Comparisons between demographic groups were also made within CVD risk category using a chi-squared test; for example, whether there was a difference between age categories in those in the mild CVD risk category.! 51!
63 In order to determine the relationship between total flavonoid intake and being in a particular CVD risk category, logistic regression was used to look at the odds ratio of being in each CVD risk category, using low, medium and high flavonoid intakes. This was then adjusted for age, BMI, sex, NZdep, and ethnicity. In an additional analysis, those in the low flavonoid intake group were used as the reference group, and given an OR of 1.0. Those in the moderate and high intake groups were then compared to those in the low intake group (reference group) to determine whether flavonoid intake affected the odds of being in a particular CVD risk category. The same was done for the relationship between intake categories of flavan-3-ols and CVD risk category. Odds ratios, 95% confidence intervals and p-values were calculated. All analyses were carried out for those NZANS participants with a complete set of data to determine their 5-year CVD risk score and who had 24-hour recall data.! 52!
64 5 Results 5.1 Response Rate and Data Used for Analyses The target population for the NZANS was comprised of approximately 3.2 million adults who were current New Zealand citizen s aged 15 years and over. The final weighted response rate was 61%, with a 31% refusal to participate, and 8% uncontactable. A total of 4721 participants were included in the final survey. Of the 4721 participants in the survey, data from a total of 3126 participants (66%) were used in these analyses. These were the participants that had completed data for 24-hour diet recalls and all data required for calculating CVD risk score profile. 5.2 Sample Characteristics Table 5.1 shows socio-demographic characteristics of the participants included in the flavonoid dataset, and their mean total flavonoid and flavan-3-ol intake. The sample was predominantly NZ European (69% of participants), with 19% Maori, and 12% Pacific. Participants were predominantly female (56%). 5.3 Differences in Flavonoid and Flavan-3-ol Intake Between Age Categories, BMI, Sex, Prioritised Ethnicity and NZdep Quintile As shown in Table 5.1, when comparing mean total flavonoid intakes, there were significant differences in intake between age categories. The highest intake was in those aged 71+ years (679.8mg/day), and the lowest intake in those aged years (117.1mg/day) (p<0.0001). There were also significantly higher intakes in females compared to males, and in NZ Europeans compared to other ethnic groups. Similarly, for flavan-3-ol intake, there were! 53!
65 significant difference between age categories with the highest intake in those aged 71+ years (60.7mg/day), and lowest intake in those aged years (6.5mg/day). There were also significantly higher intakes in females compared to males, and in NZ Europeans compared to other ethnic groups. 5.4 Cardiovascular Disease Risk Categories Mild CVD Risk Category As shown in Table 5.1, for those in the mild CVD risk category, there was a significant difference between age categories with 31.7% in the age category years, and the minority aged 71+ years (10%) (p <0.0001). There were more people in the normal BMI category than other categories, compared to those who were underweight, overweight or obese, more females than males and more in quintile 5 (most deprived) than other quintiles Moderate to High CVD Risk Category For those in the a moderate to high CVD risk category, there was a significant difference between age categories, with more of those aged 71+years (46.3%) in this CVD risk category, and minority of those aged years (0%) (p <0.0001). There were also more people in the obese BMI category compared to other BMI categories High CVD Risk Category For those in the a high CVD risk category, there was a significant difference between age categories, with a majority aged 71+ years (67.4%), and a minority aged 15-18, and 19-30! 54!
66 (0%) (p <0.0001). There were also more people in the overweight BMI category than other BMI categories, more males than females, and more NZ Europeans than other ethnicities.! 55!
67 Table 5.1 Demographic data for NZANS participants by categories of CVD risk and total flavonoid and flavan-3-ol intake Total n (%) n = 3126 Mild CVD risk n (%) a n = 2010 Moderate to high CVD risk n (%) n = 717 High CVD risk n (%) n = 399 Mean total flavonoid intake (mg/day) (SE) Mean flavan-3-ol intake (mg/day) (SE) Age category (y) (13.3%) 416 (20.7%) 0 (0%) 0 (0%) (8.9) 6.5 (0.8) (12.0%) 366 (18.2%) 10 (1.4%) 0 (0%) (34.2) 19.9 (3.2) (27.2%) 745 (37.1%) 100 (13.9%) 6 (1.5%) (27.0) 39.6 (2.5) (21.8%) 281 (14.0%) 275 (38.4%) 124 (31.1%) (32.2) 58.1 (3.1) (25.7%) 202 (10.0%) 332 (46.3%) 269 (67.4%) (24.5) (2.3) P-value b < < < < < BMI category (kg/m 2 ) Underweight (<18) 65 (2.1%) 41 (63.0%) 15 (2.1%) 9 (2.3%) (54.8) 23.4 (5.0) Normal (18-25) 954 (30.5%) 745 (37.1%) 147 (20.5%) 62 (15.5%) (30.0) 41.2 (2.8) Overweight (26-30) 1105 (35.3%) 664 (33.0%) 266 (37.1%) 175 (43.9%) (23.1) 41.1 (2.3) Obese (>30) 1002 (32.1%) 560 (27.9%) 289 (40.3%) 153 (38.3%) (28.7) 37.6 (2.7) P value c < < < Sex Male 1374 (44.0) 732 (36.4%) 336 (46.9%) 306 (76.7%) (20.7) 35.7 (2.0) Female 1752 (56.0%) 1278 (63.6%) 381 (53.1%) 93 (23.3%) (21.6) 43.7 (2.1) P value d < < ! 56
68 Prioritised Ethnicity Total n (%) n = 3126 Mild CVD risk n (%) a n = 2010 Moderate to high CVD risk n (%) n = 717 High CVD risk n (%) n = 399 Mean total flavonoid intake (mg/day) (SE) Mean flavan-3-ol intake (mg/day) (SE) Maori 585 (18.7%) 380 (18.9%) 153 (21.3%) 52 (13.0%) (25.7) 28.4 (2.4) Pacific 383 (12.3%) 267 (13.3%) 83 (11.6%) 33 (8.3%) (28.1) 24.5 (2.7) NZEO 2158 (69.0%) 1363 (67.8%) 481 (67.1%) 314 (78.7%) (18.0) 42.2 (1.7) P value e < < < NZ Deprivation quintile 1 (least deprived) 485 (15.5%) 311 (15.5%) 104 (14.5%) 70 (17.5%) (34.4) 42.8 (3.2) (18.7%) 398 (12.7%) 122 (17.0%) 63 (115.8%) (31.0) 40.5 (3.0) (16.9%) 347 (17.3%) 112 (15.6%) 70 (17.5%) (43.1) 42.1 (4.1) (22.0%) 448 (22.3%) 159 (22.2%) 83 (20.8%) (34.8) 37.9 (3.4) 5 (most deprived) 839 (26.8%) 506 (25.2%) 220 (30.7%) 113 (28.3%) (28.0) 35.7 (2.7) P value f a Percentage of those in each age, BMI, Sex, Ethnicity or NZdep index group, for each CVD risk category b For differences between age groups. c For differences between BMI categories. d For differences between genders. e For differences between ethnic groups f For differences between NZdep quintiles! 57
69 5.5 Main Food sources of Flavonoids and Flavan-3-ol As seen in Table 5.2, the main food groups contributing to total flavonoid intake and flavan-3-ol intake include sugar and sweets, non-alcoholic beverages, alcoholic beverages, fruit and vegetables. Sugar and sweets included chocolate, which is known to be high in flavan-3-ols, however that it is outside the scope of the thesis to investigate each individual food, therefore it is unknown how much individual foods contributed to intake. Table 5.2 Main food groups contributing to total flavonoid intake and flavan-3-ol intake* Food group Sugar and sweets Examples of food items included Sugars, syrups, confectionery, chocolate, jam, honey, jelly, sweet toppings and icing, ice-blocks, artificial sweeteners Total flavonoid intake by food group (% total intake) Total Flavan-3- ol intake by food group (% total intake)* 64% 81% Non-alcoholic beverages Fruit Vegetables All teas, coffee and substitutes, hot chocolate drinks, juices, cordial, soft drinks, water, powdered drinks, sports and energy drinks All fruit, fresh, canned, cooked and dried All vegetables (fresh, frozen, canned) including mixes, coleslaw, tomatoes, green salads, legumes and pulses, legume products and dishes (baked beans, hummus, tofu), vegetable dishes Red wine, white wine, dessert wine, cider, beer Alcoholic beverages *See appendix for a full list of food groups ** Values may not add up to 100 due to rounding. 25% 17% 6% 1% 2% 0% 1% 0%! 58!
70 5.6 Intake of Flavonoids and Flavan-3-ols for each CVD risk category As seen in Table 5.3, the majority of participants were in the mild CVD risk category (64.3%) with a minority in the high CVD risk category (12.7%). Those in the high CVD risk category had the highest flavonoid intake, with those in the mild CVD risk category consuming the least. Those in the mild CVD risk category had the lowest flavan-3-ol intake, with those in the moderate to high CVD risk category consuming the most. Table 5.3 Mean total flavonoid and flavan-3-ol intake by CVD risk category in unadjusted analyses Cardiovascular risk Total n (%) Mean total flavonoid intake (mg/day) (SE) Mean flavan-3-ol intake (mg/day) (SE) Mild CVD risk 2010 (64.3%) (17.1) 36.0 (1.7) Moderate to High CVD risk 717 (22.9%) (32.0) 53.6 (3.0) High CVD risk 399 (12.7%) (48.0) 55.3 (4.6) Total 3126 (100%) (15.6) 39.9 (1.5) 5.7 Total Flavonoid Intake and CVD risk As seen in Table 5.4, in the unadjusted analyses, those with a low moderate and high flavonoid intake were less likely to have a low CVD risk score than those with a low flavonoid intake. Those with a high flavonoid intake were more likely to be in the high CVD category compared to those with a low flavonoid intake. Adjusted results show that the only significant relationship seen was that those in the highest CVD risk category were almost half as likely (OR=0.052, CI:0.29,0.91) to be in the highest category for total flavonoid intake compared to the other groups (p=0.023).! 59!
71 Table 5.4 Relationships between groups of total flavonoid intake and CVD risk categories. Results are presented as Odds Ratio (CI) for being in a particular total flavonoid intake group for each CVD risk category, compared to the low total flavonoid intake group Moderate total flavonoid Mild CVD risk score Moderate to high CVD risk score High CVD risk score Unadjusted results as Odds Ratio (CI) for being in a particular total flavonoid intake group for each CVD risk category, compared to the low total flavonoid intake a group intake b 0.68 (0.52,0.89) 1.52 (1.11,2.11) NS! P value NS! High total flavonoid intake c 0.38 (0.30,0.50) 2.60 (1.94,23.48) 1.85 (1.24,2.78) P value < < Moderate total flavonoid Adjusted results d as Odds Ratio (CI) for being in a particular total flavonoid intake group for each CVD risk category, compared to the low total flavonoid intake a group intake b 0.93 (0.60,1.45) 1.15 (0.80,1.69) 0.74 (0.40,1.37) P value NS! NS! NS! High total flavonoid intake c 0.95 (0.63,1.44) 1.26 (0.88,1.80) 0.52 (0.29,0.91) P value NS! NS! a Low < 71.32mg b Moderate intake = 71.32mg mg c High intake > mg d Adjusted for age, BMI, gender, NZdep index and prioritised ethnicity NS = not significant As seen in Table 5.5, in the unadjusted analyses, those in the lowest category of total flavonoid intake were twice as likely to be in the lowest risk category for CVD, compared to those in the medium and high flavonoid intake groups. Adjusted results show those with a higher total flavonoid intake are around 40% less likely (OR=0.62 CI:0.41,0.92) to have a high CVD risk score (p=0.017).! 60!
72 Table 5.5 Relationships between groups of total flavonoid intake and CVD risk categories. Results are presented as Odds Ratio (CI) for being in a particular total flavonoid intake group for each CVD risk category! Low total flavonoid Mild CVD risk score Moderate to high CVD risk score High CVD risk score Unadjusted results as Odds Radio (CI) for being in a particular total flavonoid intake group for each CVD risk category intake a 1.94 (1.54,2.46) 0.50 (0.38,0.65) 0.66 (0.46,0.96) P value < Moderate total flavonoid intake b 1.16 (0.92,1.46) 0.88 (0.67,1.15) 0.86 (0.62,1.18) P value NS! NS! NS! High total flavonoid intake c 0.48 (0.38,0.60) 2.05 (1.60,2.63) 1.67 (1.22,2.30) P value Low total flavonoid Adjusted results d as Odds Ratio (CI) for being in a particular total flavonoid intake group for each CVD risk category intake a 1.06 (0.72,1.56) 0.82 (0.60,1.15) 1.67 (0.96,2.87) P value NS! NS! NS Moderate total flavonoid intake b 0.96 (0.67,1.37) 1.00 (0.73,1.36) 1.17 (0.76,1.80) P value NS! NS! NS! High total flavonoid intake c 0.99 (0.71,1.39) 1.14 (0.85,1.53) 0.62 (0.41,0.92) P value NS! NS! a Low < 71.32mg b Moderate intake = 71.32mg mg c High intake > mg d Adjusted for age, BMI, gender, NZdep index and prioritised ethnicity NS = not significant 5.8 Flavan-3-ol intake and CVD risk As seen in Table 5.6, in the unadjusted results, those with a moderate and high flavan-3-ol intake were less likely to have a low CVD risk score than those with a low flavan-3-ol intake. Those with a high flavonoid intake were more likely to be in the high CVD! 61!
73 category compared to those with a low flavan-3-ol intake. In the adjusted analyses, the only significant relationship seen was that those in the highest CVD risk category were around half as likely (OR=0.48, CI:0.29,0.80) to be in the highest category for flavan-3-ol intake compared to those in the lowest flavan-3-ol intake category (reference group) (p=0.004) Table 5.6 Relationships between groups of flavan-3-ol intake and CVD risk categories. Results are presented as Odds Ratio (CI) for being in a particular flavan-3-ol intake group for each CVD risk category, compared to the low flavan-3-ol intake group Moderate Flavan-3-ol Mild CVD risk score Moderate to high CVD risk score High CVD risk score Unadjusted results as Odds Ratio (CI) for being in a particular flavan-3- ol intake group for each CVD risk category, compared to the low flavan- 3-ol intake a group intake b 0.74 (0.57,0.97) 1.36 (1.00,1.87) 1.20 (0.80,1.78) P value NS NS High Flavan-3-ol intake c 0.40 (0.31,0.51) 2.50 (1.86,3.36) 1.89 (1.28,2.80) P value < < Moderate Flavan-3-ol Adjusted results d as Odds Ratio (CI) for being in a particular flavan-3-ol intake group for each CVD risk category, compared to the low flavan-3-ol intake a group intake b 1.01 (0.66,1.56) 1.10 (0.75,1.61) 0.69 (0.39,1.20) P value NS NS NS High Flavan-3-ol intake c 1.04 (0.70,1.56) 1.19 (0.83,1.70) 0.48 (0.29,0.80) P value NS NS a Low intake <1.82mg/day b Moderate intake = 1.82mg-49.84mg/day c High intake > 49.84mg/day d Adjusted for age, BMI, gender, NZdep index and prioritised ethnicity! 62!
74 As seen in Table 5.7, in the unadjusted analyses, those in the lowest category of flavan-3- ol intake were almost twice as likely to be in the lowest risk category for CVD, compared to those in medium and high flavn-3-ol intake groups. Adjusted results show those in the lowest flavan-3-ol intake category (<1.82mg/day) are 80% more likely (OR=1.80, CI:1.12,2.90) to have a high CVD risk score (p=0.016). Those in the highest flavan-3-ol intake category (>49.84mg/day) are 40% less likely (OR=0.6, CI:0.40,0.89) to have a high CVD risk score (p=0.011).! 63!
75 Table 5.7 Relationships between groups of flavan-3-ol intake and CVD risk categories. Results are presented as Odds Ratio (CI) for being in a particular flavan-3-ol intake group for each CVD risk category Low Flavan-3-ol Mild CVD risk score Moderate to high CVD risk score High CVD risk score Unadjusted results as Odds Radio (CI) for being in a particular flavan-3- ol intake group for each CVD risk category intake a 1.85 (1.47,2.33) 0.54 (0.41,0.70) 0.66 (0.45,0.94) P value Moderate Flavan-3-ol intake b 1.25 (0.99,1.57) 0.81 (0.62,1.06) 0.84 (0.61,1.15) P value NS! NS! NS! High Flavan-3-ol intake c 0.47 (0.37,0.58) 2.0 (1.64,2.69) 1.71 (1.25,2.35) P value Low Flavan-3-ol Adjusted results d as Odds Ratio (CI) for being in a particular total flavonoid intake group for each CVD risk category intake a 0.97 (0.67,1.41) 0.87 (0.63,1.21) 1.80 (1.12,2.90) P value NS! NS! Moderate Flavan-3-ol intake b 0.98 (0.69,1.41) 0.98 (0.72,1.34) 1.15 (0.75,1.76) P value NS! NS! NS! High Flavan-3-ol intake c 1.03 (0.74,1.45) 1.12 (0.84,1.50) 0.6 (0.40,0.89) P value NS! NS! a Low intake <1.82mg/day b Moderate intake = 1.82mg-49.84mg/day c High intake > 49.84mg/day d Adjusted for age, BMI, gender, NZdep index and prioritised ethnicity NS not significant! 64!
76 6 Discussion and Conclusions The present study was carried out to develop a flavonoid database in order to determine the flavonoid intake of participants in the NZANS. This database was used to investigate whether higher flavonoid intake was associated with lower CVD risk. This discussion focuses on the relationship between flavan-3-ol and CVD in New Zealand adults. It will also discuss the accuracy of the flavonoid database that was developed as the main component of this thesis. 6.1 Main Findings The unadjusted results of the current study indicated that higher intakes of flavan-3-ol were associated with a higher CVD risk. However, when adjusted for age, sex, BMI, ethnicity and NZdep, results indicate that those with a higher intake of flavan-3-ol have a significantly lower chance of having a high CVD risk score. Those in the lowest flavan-3- ol intake category had a significantly higher chance of being in the high CVD risk category. It is not surprising that these results differed after adjustment for these factors, which are known to influence CVD risk. Results were similar for total flavonoid intake, showing that those in the highest intake group for total flavonoids had a significantly lower chance of being in the high CVD risk category. These results are consistent with studies carried out overseas (4,6), which have largely found those with a higher flavonoid intake, particularly flavan-3-ol, have a lower CVD risk. It has been demonstrated that higher intakes of flavan-3-ol decreases risk of CVD by various mechanisms. Firstly it has been suggested that high flavan-3-ol intake is involved in the pathophysiology of CVD by means of the NOS system. It has been suggested in vitro, that flavan-3-ol helps to activate endothelial NOS, which helps to enhance the relaxation of the endothelium, thus! 65!
77 modulating vascular tone and improving vascular health (7). It has also been suggested high intakes can reduce the susceptibility of LDL cholesterol oxidation, which in turn reduces risk endothelial dysfunction and vascular disease (5,7). These functions help to explain why a higher intake of flavan-3-ols would reduce the risk of CVD.! In the present study it was found the mean intake of total flavonoids was 471.1mg/day. The Spanish EPIC cohort by Zamora-Ros et al (2010) carried out on 40,683 subjects aged 35 to 64 years from northern and southern regions of Spain, found participants had a mean total flavonoid intake of mg/day (5). A Finnish study on 2007 Finnish adults found participants had a mean intake of 208.9mg/day (57). A US study assessing flavonoid intake in a total of 8809 individuals from the NHANES , reported participants had a mean flavonoid intake of 189.7mg/day (58). This shows total flavonoid intake was slightly higher in the present study than several overseas studies. This may be due to different methods used for dietary assessment. The Spanish EPIC study used information on usual food intake during the preceding year, which took into account seasonal variation, with data collected on cooking methods, frequency of consumption per week, and usual portion size, along with a detailed diet history questionnaire (5). Therefore it would have taken into consideration total flavonoid intake year round. The present study used 24-hour recalls to assess dietary intake, therefore it may not show participant s habitual year round intake of flavonoids. However, the Finnish study by Ovaskainen et al. (2008), used 48-hour dietary recalls, and the US study by Chun et al. (2007) used 24-hour recalls similar to the present study, therefore there may be other reasons for the higher intakes observed in the New Zealand population (57,58). Differences may be due to dietary habits in these different populations, which are often dictated by culture and thus affect the intake of flavonoids (58).! 66!
78 In the present study it was found the main food group contributing to total flavonoid intake was sugar and sweets. This was followed (in quantity) by non-alcoholic beverages, fruit, vegetables and alcoholic beverages. The main foods contributing to total flavonoid intake in the Spanish EPIC study were fruit, alcoholic beverages, chocolate, and vegetables (5,6). Berries and other fruit were the main sources of flavonoids in the Finnish study (57), and tea, citrus fruit juices, wine and citrus fruits were the main sources of flavonoids in the US study (58). Different dietary patterns in these populations may be reasons for differences seen in the main foods contributing to flavonoids, as well as different mean intakes. Similar to the present study, the Spanish EPIC cohort by Zamora-Ros et al. (2010) used the USDA database to estimate flavonoid intake, applied retention factors to cooked foods, and developed a number of recipes (5). This may be a reason the findings from the present study are most comparable to this study than other overseas studies. The US study by Chun et al. (2007) did use the USDA database to estimate flavonoid intake, however they did not adjust cooked foods using retention factors (58). This may have resulted in an overestimation of flavonoid intake for this particular study. They did not however compile composites such as in the present study, which may have resulted in an underestimation of intake. In the Finnish study by Ovaskainen et al. (2008), 110 food items were individually analysed for flavonoid content, and this was compiled with data from other sources to update a Finnish FCDB (57). This method may have resulted in some foods consumed by the Finnish population being excluded from the study, thus leading to potential underestimation of intake. They did consider retention factors, and also considered flavonoids in recipes, therefore results are comparable to the present study.!! 67!
79 The mean flavan-3-ol intake for the present study was 39.9mg/day. This was very similar to that found in the Spanish EPIC cohort (2010), which found participants had a mean flavan-3-ol intake of 32.47mg/day (5). The Finnish study by Ovaskainen et al. (2008), found participants had an intake of 12mg/day, and the US study by Chun et al. (2007) reported an intake of 156.6mg/day (5,57,58). It has been suggested people in the US drink a lot of tea, which may be a reason for the higher observed intake of flavan-3-ols in this study (5). The Spanish EPIC cohort (2010) used similar methods to the present study, which may be why intakes were very similar. Differences in flavan-3-ol intake between the present study compared to the Finnish (57) and US (58) studies may be due to differences in methodology mentioned earlier. In the present study, the main food group contributing to flavan-3-ol intake was sugar/sweets. Although no values were produced for individual foods, it is likely that the individual food that contributed to this was chocolate, which is known to contain high amounts of flavan-3-ols. Non-alcoholic beverages (such as tea and chocolate flavored drinks) were the second highest contributing food group, followed by fruit then alcoholic beverages. Similarly, in the EPIC study, tea, red wine, fruit (mainly apples) and chocolate were observed as the main contributors of flavan-3-ol intake (5). Further research is needed to identify the individual foods that contribute most to total flavonoid and flavan-3-ol intake in this population.! 6.2 Strengths and Limitations of the Present Study Strengths The present study was the first in New Zealand to investigate the relationship between flavonoid intake and CVD risk. The participant data used was from the NZANS, which was a large and national population based sample (16). Therefore an accurate representation on the effects of flavan-3-ol intake and CVD risk score at the New Zealand! 68!
80 population level was possible. As the sample size was large, it gave a large sample for each CVD risk category, and flavonoid/flavan-3-ol intake category, enabling accurate comparisons to be made. It was a strength to use a CVD risk score profile, as it takes into account the CVD risk factors TC:HDL ratio, SBP, ethnicity, tobacco use, diabetes, and age; which is preferable to using a single endpoint for CVD risk (26). This is because single risk factors that fall above the normal range may not necessarily increase ones risk of CVD. Those with many marginal risk factors are at increased risk, as they act synergistically to have potentially harmful overall effects (26). The CVD risk profile used was also specific to New Zealand and considered higher risk of certain ethnic groups (27). There are various strengths in the methodology of the database development. A conservative approach was taken, in line with other studies investigating flavonoid consumption (5). The present study used the same protocol for matching foods as that used in the Spanish EPIC cohort by Zamora-Ros et al. (2010) (5). This method ensured that foods were matched as accurately as possible. Several methods were used to ensure flavonoid intake was not overestimated or underestimated whilst developing the database. It has been demonstrated that postharvest handling and manufacturing processes of plant foods can lead to reduction, and/or elimination of flavonoids (5,6). Thus, applying retention factors to cooked and manufactured products meant that flavonoid intake from cooked foods was not overestimated. To ensure flavonoid intake was not underestimated, composites were developed. That is, packet ingredients and/or recipes were used to make a match to the food as closely as possible. If this step in the development of the database was excluded,! 69!
81 foods that contained flavonoids but did not have a direct match to a food in either database, would have been given a flavonoid value of 0mg/100g. Thus, flavonoid intake would have been greatly underestimated. Although recipes could not be entirely accurate, developing a composite is preferable to leaving particular foods out altogether.! As in the Spanish EPIC Cohort by Zamora-Ros et al. (2010), we used both the USDA and Phenol explorer databases, calculated flavonoid values for composite foods, and used recognised retention factors (5) This ensured as many foods as possible in FOODfiles were given an accurate flavonoid value. Flavonoid underestimation is a problem with various studies; therefore intake of total flavonoids and flavan-3-ols may be more accurate than has been demonstrated in other overseas studies. However, it must be acknowledged that 24-hour recalls were used, and this is not a measure of habitual diet, thus food intake methods could be improved to more accurately determine flavonoid intake in New Zealand Limitations Similar to the Spanish EPIC study (2010), when developing the new FCDB, foods were matched as closely as possible (5). In some cases the USDA database and Phenol Explorer did not contain all the exact foods on the FOODfiles list. Exceptions were made if foods were not an exact match, but were very close and contained a similar amount of flavonoids. For example the beverage port in FOODfiles was matched to a red wine from USDA database, as the flavonoid content would be expected to be similar given the composition of both products. Further, there was no data for certain foods that are likely to be high in flavonoids, for which consumption in New Zealand is also high. For example, there was no match for flaxseed oil, but there was a high consumption of this food in the NZANS. We were unable to substitute this for another type of oil, therefore this may result in underestimation of flavonoid intake. Although it was a strength of the study to develop! 70!
82 composites, there were challenges in determining the exact proportions of ingredients. Furthermore, as there were limited cooked foods in the flavonoid databases, adjustments were made to raw foods to account for potential loss of flavonoids during the cooking process. The retention factors applied were based on the reported cooking methods, and may not be an exact representation of the flavonoid content of each of these cooked foods. There is limited data about retention factors for flavonoids for cooked foods in the literature. As the timeframe for this project was been limited, the flavonoid dataset generated provides a picture of flavonoid values. Each recipe or composite, once calculated, was checked by a trained nutritionist and, not all the suggested modifications were able to be made during the time period of this research. This has implications for the flavonoid values produced, and may be an additional reason why calculated total flavonoid values found in this study were higher than in previous research. It was found that fruit, vegetables and red wine contributed highly to flavnon-3-ol intake. It has been demonstrated that high consumption of fruit, vegetables and moderate consumption of red wine is likely to reduce ones risk of CVD (2). Therefore, compounds other than flavonoids in these foods may have somewhat contributed to the observed results. However, these were not confounders that could be adjusted for. 6.3 Implications for Future Research There are difficulties with all studies investigating the relationship between flavonoids and CVD, due to difficulties with dietary exposure assessment. That is, the FCDB used needs to provide accurate quantitative information on the specific compound in foods that is being investigated in order to estimate exposure of participants in the studies (59). The! 71!
83 flavonoid database produced in the present study is still a work in process, and refinements still need to be made to give a more accurate representation of flavonoid content of New Zealand foods. It must be noted it was outside the scope of this thesis to complete the database, and analyses should be completed once all necessary modifications to the database are made. From the results of the present study it can be seen that there is a relationship between flavonoid intake and CVD risk. These analyses should be repeated in the completed flavonoid database, thus providing a more accurate quantitative assessment of flavonoid content in the NZFCDB. Further RCTs and observational studies carried out in New Zealand will help to further clarify the relationship and amounts of flavonoids required to decrease ones risk of CVD. 6. Conclusions In summary, the present study demonstrated a relationship between high total flavonoid/flavan-3-ol intake, and mild/low CVD risk in New Zealand. Those with a habitual high total and flavan-3-ol intake may reduce their risk of developing CVD. Furthermore, it may reduce the likelihood of a cardiovascular event occurring in those already at risk of CVD.! 72!
84 7 Application to Dietetic Practice As high consumption of flavonoids/flavan-3-ols is likely associated with lower risk of CVD, we may see a decline in rates of CVD if consumption of foods high in flavonoids/flavan-3-ols is promoted. It must be considered that the food that contributes highly to flavan-3-ol intake is chocolate. While consuming chocolate with a high percentage of cocoa (that is dark chocolate) may provide benefits this must be in the context of a well balanced diet. It would not be recommended to consume large amounts of chocolate, as this may impact energy balance and cause weight gain, a known risk factor for CVD. Along with flavan-3-ols, a higher total flavonoid intake appears to reduce risk of CVD, thus it would be recommended to increase consumption of other foods high in total flavonoids such as tea, fruit and vegetables, as these foods contain other nutrients that are cardio-protective, and may help reduce the risk of other chronic diseases.!!! 73!
85 8 References 1. Levenson JW, Skerrett PJ, Gaziano JM. Reducing the global burden of cardiovascular disease: The role of risk factors. Preventive Cardiology. 2002;5(4): Mann J, Chisholm A. Cardiovascular disease. Essentials of Human Nutrition. 4th ed. Oxford: Oxford University Press; p Sacks FM, Svetkey LP, Vollmer WM, Appel LJ, Bray GA, Harsha D, et al. Effects on blood pressure of reduced dietary sodium and the dietary approaches to stop hypertension (DASH) diet. New England Journal of Medicine. 2001;344(1): Hooper L, Kay C, Abdelhamid A, Kroon PA, Cohn JS, Rimm EB, et al. Effects of chocolate, cocoa, and flavan-3-ols on cardiovascular health: a systematic review and meta-analysis of randomized trials. American Journal of Clinical Nutrition. 2012;95(3): Zamora-Ros R, Andres-Lacueva C, Lamuela-Raventos RM, jakszyn TBP, Barricarte A, Ardanaz E, et al. Estimation of dietary sources and flavonoid intake in a Spanish adult population (EPIC-Spain). Journal of the American Dietetic Association. 2010;110: McCullough ML, Peterson JJ, Patel R, Jacques PF, Shah R, Dwyer JT. Flavonoid intake and cardiovascular disease mortality in a prospective cohort of US adults. American Journal of Clinical Nutrition. 2012;95: Engler MB, Engler MM, Chen CY, Malloy MJ, Browne A, Chiu EY, et al. Flavonoid-rich dark chocolate improves endothelial function and increases plasma epicatechin concentrations in healthy adults. Journal of the American College of Nutrition. 2004;23(3): Sies H, Schewe T, Heiss C, Kelm M. Cocoa polyphenols and inflammatory mediators. American Journal of Clinical Nutrition. 2005;81:304S 12S. 9. Heart Foundation. Statistics [Internet]: Heart Foundaiton; 2012 [cited 2012Sep.17]; Available from: Deaton C, Froelicher ES, Wu LH, Ho C, Shishani K, Jaarsma T. The global burden of cardiovascular disease. Journal of Cardiovascular Nursing. 2011;26(4S):S5 S Cameron VA, Faatoese AF, Gillies MW, Robertson PJ, Huria TM, Doughty RN, et al. A cohort study comparing cardiovascular risk factors in rural Maori, urban Maori and non-maori communities in New Zealand. British Medical Journal. 2012;2:e Ministry of Health. Cardiovascular Disease (35+ years) [Internet]: Ministry of Health; 2008 [cited 2012Sep.17]. Available from: 74!
86 indicators/cardiovascular-disease-35-years 13. World Health Organisation. Noncommunicable disease country profiles Geneva: World Health Organisation; Ministry of Health. Report on New Zealand cost-of-illness studies on long-term conditions. Wellington: Ministry of Health; Scott WG, White HD, Scott HM. Cost of coronary heart disease in New Zealand. New Zealand Medical Journal. 1993;106(962): Ministry of Health. A Portrait of Health: key results of the 2006/07 New Zealand health survey. Wellington: Ministry of Health; Mink PJ, Scrafford CG, Barraj LM, Harnack L, Hong C-P, Nettleton JA, et al. Flavonoid intake and cardiovascular disease mortality: a prospective study in postmenopausal women. American Journal of Clinical Nutrition. 2007;85: Siontis GCM, Tzoulaki I, Siontis KC, Ioannidis JPA. Comparisons of established risk prediction models for cardiovascular disease: systematic review. British Medical Journal. 2012;344:e D Agostino RB, Vasan RS, Pencina MJ, Wolf PA, Cobain M, Massaro JM, et al. General Cardiovascular Risk Profile for Use in Primary Care. Circulation. 2008;117(6): World Health Organisation. Global status report on noncommunicable diseases Geneva: World Health Organisation; Williams M. Risk assessment and management of cardiovascular disease in New Zealand. The New Zealand Medical Journal. 2003;116(1185): Arruda H, editor. Framingham Heart Study [Internet]: Framingham Heart Study Organisation; 2012 [cited 2012Sep.12]. Available from: Truett J, Cornfield J, Kannel W. A multivariate analysis of the risk of coronary heart disease in Framingham. Journal of Chronic Diseases. 1967;20(7): Brindle P, Beswick A, Fahey T, Ebrahim S. Accuracy and impact of risk assessment in the primary prevention of cardiovascular disease: a systematic review. Heart. 2006;92: Kris-Etherton P, Eckel RH, Howard BV, Jeor SS, Bazzarre TL. Lyon diet heart study. Circulation. 2001;103: Milne R, Gamble G, Whitlock G, Jackson R. Discriminative ability of a riskprediction tool derived from the Framingham Heart Study compared with single risk factors. The New Zealand Medical Journal. 2003;116(1185): New Zealand Guidelines Group. New Zealand Primary Care Handbook rd ed. Wellington: New Zealand Guidelines Group; 2012.! 75!
87 28. Jalil AMM, Ismail A. Polyphenols in cocoa and cocoa products: is there a link between antioxidant properties and health? Molecules. 2008;13: Hjermann I, Holme I, Byre KV, Leren P. Effect of diet and smoking intervention on the incidence of coronary heart disease. International Journal of Cardiology. 1981;318(8259): Heiss C, Kleinbongard P, DeJam A, Perre S, Schroeter H, Sies H, et al. Acute consumption of flavanol-rich cocoa and the reversal of endothelial dysfunction in smokers. Journal of the American College of Cardiology. 2005;46(7): Faridi Z, Njike VY, Dutta S, Ali A, Katz DL. Acute dark chocolate and cocoa ingestion and endothelial function: a randomized controlled crossover trial. American Journal of Clinical Nutrition. 2008;88: Sesso HD, Gaziano JM, Liu S, Buring JE. Flavonoid intake and the risk of cardiovascular disease in women. American Journal of Clinical Nutrition. 2003;77: Schroeter H, Heiss C, Balzer J, Kleinbongard P, Keen CL, Hollenberg NK, et al. ( )-Epicatechin mediates beneficial effects of flavanol-rich cocoa on vascular function in humans. PNAS. 2006;103(4): Gordon T, Kannel WB. Premature Mortality From Coronary Heart Disease: The Framingham Study. The Journal of the American Medical Association. American Medical Association; 1971;215(10): Kannel WB, McGee D, Gordon T. A General Cardiovascular Risk Profile: The Framingham Study. The American Journal of Cardiology. 1976;38: Wilson PWF, Castelli WP, Kannel WB. Coronary risk prediction in adults (The Framingham Heart Study). The American Journal of Cardiology. 1987;59(14): Assmann G, Cullen P, Schulte H. Simple scoring scheme for calculating the risk of acute coronary events based on the 10-Year follow-up of the prospective cardiovascular Münster (PROCAM) study. Circulation. 2002;105: Conroy RM, Pyörälä K, Fitzgerald AP, Sans S, Menotti A, De Backer G, et al. Estimation of ten-year risk of fatal cardiovascular disease in Europe: the SCORE project. European Heart Journal. 2003;24: Woodward M, Brindle P, Tunstall-Pedoe H. Adding social deprivation and family history to cardiovascular risk assessment: the ASSIGN score from the Scottish Heart Health Extended Cohort (SHHEC). Heart. 2007;93: Hippisley-Cox J, Coupland C, Vinogradova Y, Robson J, May M, Brindle P. Derivation and validation of QRISK, a new cardiovascular disease risk score for the United Kingdom: prospective open cohort study. British Medical Journal. 2007;335(7611): Pietta PG. Flavonoids as Antioxidants. Journal of Natural Products. American Chemical Society; 2000;63(7): ! 76!
88 42. Havsteen B. Flavonoids, a class of natural products of high pharmacological potency. Biochemical Pharmacology. 1983;32(7): Janszky I, Mukamal KJ, Ljung R, Ahnve S, Ahlbom A, Hallqvist J. Chocolate consumption and mortality following a first acute myocardial infarction: the Stockholm Heart Epidemiology Program. Journal of Internal Medicine. 2009;266(3): Curtis PJ, Sampson M, Potter J, Dhatariya K, Aedin C. Chronic ingenstion of flavan-3-ols and isoflavones improves insulin sensitivity and lipoprotein status and attenuates estimated 10-year CVD risk in medicated postmenopausal women with type 2 diabetes: a 1-year, double blind, randomized, controlled trial. Diabetes Care. 2012;35(2): Wedick NM, Pan A, Cassidy A, Rimm EB, Sampson L, Rosner B, et al. Dietary flavonoid intakes and risk of type 2 diabetes in US men and women. American Journal of Clinical Nutrition. 2012;95(4): Ministry of Health. A Focus on Nutrition: Key findings of the 2008/09 New Zealand Adult Nutrition Survey. Wellington: Ministry of Health; Wang-Polagruto JF, Villablanca AC, Polagruto JA, Lee L, Holt RR, Schrader HR, et al. Chronic consumption of flavanol-rich cocoa improves endothelial function and decreases vascular cell adhesion molecule in hypercholesterolemic postmenopausal women. Journal of Cardiovascular Pharmacology. 2006;47:S Bhagwat S, Haytowitz DB, Holden JM. USDA Database for the Flavonoid Content of Selected Foods. Beltsville, Maryland; p Ellinger S, Reusch A, Stehle P, Helfrich H-P. Epicatechin ingested via cocoa products reduces blood pressure in humans: a nonlinear regression model with a Bayesian approach. American Journal of Clinical Nutrition. 2012;95: McCullough ML, Chevaux K, Jackson L, Preston M, Martinez G, Schmitz HH, et al. Hypertension, the Kuna, and the Epidemiology of Flavanols. Journal of Cardiovascular Pharmacology. 2006;47:S103-S Davison K, Coates AM, Buckley JD, Howe PRC. Effect of cocoa flavanols and exercise on cardiometabolic risk factors in overweight and obese subjects. International Journal of Obesity. 2008;32(8): Heiss C, DeJam A, Kleinbongard P, Schewe T, Sies H, Kelm M. Vascular effects of cocoa rich in flavan-3-ol. The Journal of the American Medical Association. 2003;290(8): Njike VY, Faridi Z, Shuval K, Dutta S, Kay CD, West SG, et al. Effects of sugarsweetened and sugar-free cocoa on endothelial function in overweight adults. International Journal of Cardiology. 2011;149(1): Grassi D, Lippi C, Necozione S, Desideri G, Ferri C. Short-term administration of dark chocolate is followed by a significant increase in insulin sensitivity and a decrease in blood pressure in healthy persons. American Journal of Clinical! 77!
89 Nutrition. 2005;81: University of Otago, Ministry of Health. Methodology Report for the 2008/09 NZ Adult Nutrition Survey. Wellington: Ministry of Health; Neveu V, Perez-Jiménez J, Vos F, Crespy V, du Chaffaut L, Mennen L, Knox C, E isner R, Cruz J, Wishart D, Scalbert A. (2010) Phenol-Explorer: an online comprehensive database on polyphenol contents in foods. Database, doi: /database/bap Ovaskainen ML, Törrönen R, Koponen JM, Sinkko H, Hellström J, Reinivuo H, et al. Dietary intake and major food sources of polyphenols in Finnish adults. The Journal of Nutrition. 2008;138(3): Chun OK, Chung SJ, Song WO. Estimated dietary flavonoid intake and major food sources of U.S adults. The Journal of Nutrition. 2007;137: Li G, Zhu Y, Zhang Y, Lang J, Chen Y, Ling W. Estimated daily flavonoid and stilbene Intake from fruits, vegetables, and nuts and associations with lipid profiles in Chinese adults. Journal of the Academy of Nutrition and Dietetics. 2013;113(6): !!!! 78!
90 9 Appendix Full list of food groups contributing to total Flavonoid and Flavan-3-ol (")*+,-+*."/"0#,0/)*12,34$5 (")*+,!+*.*/676"+8,0/)*12,34$5,9:,-""#,$%"&'8 (")*+,;/)<"=:*/0/8,0/)*12,34$5 (")*+,>:#%"92/?"0=,*=0#8,0/)*12,34$5!"#$%&'"("&)'*+,-,.%/, :;:265:678 62;25: :841734;: <.=)> :83: :37859;: :;568:99616?&'"("&)'*+,-,.%/,0 :324564;736 3;;57898;93 8:1546: : :39:9 : ::6 C,/,>%+&, ;:978 7;56; ; :16 D">%>",0E*F=G%.%*%#H*>%." :6:32: ;259277;8;6 :5:;619343; I%).J*K."H='>0 ;: ; :151334;7: : : ;2: ;9837;37 :93:5248: 15;26342;; ;5; ;84 L%F,0*%#H*G=MM)#0 : ; ;:7:1 35;316;;17 :516:: ;1;798: :843 N.,%FM%0>*',.,%&0 4457; ;; ;2787: O.%)#0*%#H*D%0>% 64:5136:39; ; : N,,M*%#H*C,%& ; :6;4;; ;4:;76 25::96;8:87 D=HH)#/0AH,00,.>0 : :4 2529; :726679: N)0'=)>0 185;7267:;: ; ;;62:73 N.,%H*P)#'&=H,0*."&&0*%#H*0K,')%&)>J*+.,%H0Q :8;5642:619 :5;29211:33 252:;86; ;91 N.,%H*+%0,H*H)0(,0 ;656978;8; :7: ;6284 R)&F :;;9 1579; :8;691:88 L(,,0, N=>>,.*%#H*R%./%.)#, <%>0*%#H*")& ::92; S//0*%#H*,//*H)0(, T%G+AR=>>"# 25783: D".F :578;229; : :474 D"=&>.J : ;2:8 U>(,.*G,%> ;; :628 D),0*%#H*K%0>),0 95:6:; : <)0(A@,%M""H ;5288; ; ;; ; : :3; :2: I),>%.J*0=KK&,G,#>0 2529:19;;41 252:96; ! 79!
91 ! 80!
92 @3+0-10*+23-."%-;AA-;BC-'+%*1=1'+0*(-40DEFGH6!""#$%"&'( )"*+,-.,+/"0"1#-10*+23-45$6 )"*+,-!,+/+0787",(-10*+23-45$6-9:-.""#-$%"&'( )"*+,-;0*<"=:+010(-10*+23-45$6 )"*+,->:#%"930?"1=-+=1#(-10*+23-45$6!"#$%&'#%(')#&*# +,-.+/ /0,3/ /4,+344/- 5"6#AB#&*'86"6#9& 5$&8:$*&,+.4/220,01 1., ,4-1 4./430--2,/ C#A6&'#%('D:BB$%& 4./--, "6#('>#&6('($&E6& 4.4,1/030-/ 4.1@ @+44+@@1 H$9A ,.1-4+2@ @/4@/1/22 I#$"='<";(:8*& 4.@4@0/1-01 CE66& :**6"'#%('H#"F#"$% J#*&'#%(';$9& 4.44,+/@+, @+230 KFF&'#%('6FF'($&E6& B'#%('L6# ,+--/1 4.4,0,--@/- 4.4/110//30 4.@@+@-0,// M#D>GH:**;% 4.23@@4-4@ @,,3 4.44/@ ,/33+/1 );:9*"=,@ @ @@ @-4@22@ N*E6"'D6#* O#:&#F6&'#%('<";86&&6('D6#*& 4.-/12,+// @444@,@/ )$6&'#%('<#&*$6& -.-13,, @+2/2+ J$&EGO6#B;;( 3.0+,+0@1/ @/-@@@ ,3/-+ L6F6*#>96& 0,30.123// +@./-@1@, @4/// 4.,-/3//40+ );*#*;6&P'A:D#"#'#%('*#"; 0,/.33/@/30 4.4,, O%#8A'B;;(& , @3@, 4 4.4@142,-@3 J":$* 1.-/+0@04-/ 1.142@, ,03 O:F#"G&R66*& 1@, O;:<&'#%('&*;8A& +.@1-0@4++/ 4.@0003-4/@ 4 4.4/2-0+4@2 3.,042,/13, 2.2/0/032@, ,.@2-24,3-/ @ @ 0.@-,,11@-1 I$6*#"='&:<<96D6%*& 4.43@ @2032/ O%#8A'>#"& ,-/ 4.4-,30-242! 81!
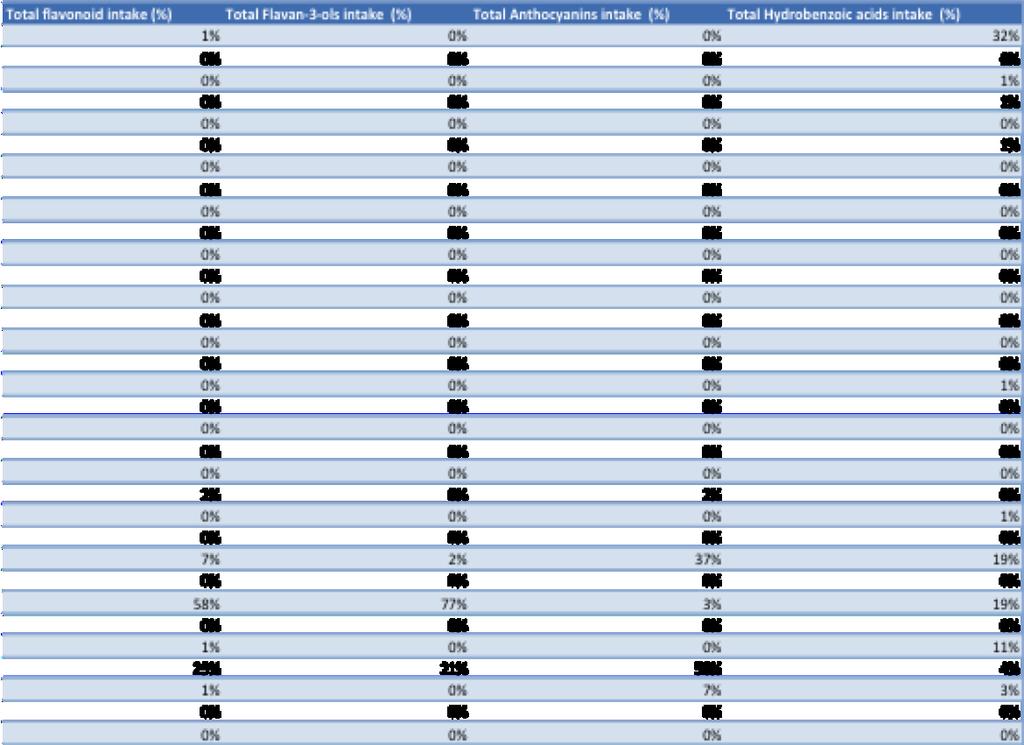
93 ! 82!
Flavonoids and their contribution to health: a look at the scientific support
 Flavonoids and their contribution to health: a look at the scientific support Frank Hu, MD, PhD Professor of Nutrition and Epidemiology Harvard School of Public Health Professor of Medicine Harvard Medical
THE SAME EFFECT WAS NOT FOUND WITH SPIRITS 3-5 DRINKS OF SPIRITS PER DAY WAS ASSOCIATED WITH INCREASED MORTALITY
 ALCOHOL NEGATIVE CORRELATION BETWEEN 1-2 DRINKS PER DAY AND THE INCIDENCE OF CARDIOVASCULAR DISEASE SOME HAVE SHOWN THAT EVEN 3-4 DRINKS PER DAY CAN BE BENEFICIAL - WHILE OTHERS HAVE FOUND IT TO BE HARMFUL
Cocoa beans as the starting ingredients in manufacturing dark chocolate
 Cocoa beans as the starting ingredients in manufacturing dark chocolate Raw cocoa beans contain large amounts of flavanols Polyphenols Flavonoids Flavonols Flavones Isoflavones Flavanones Anthocyanidins
Antioxidants in food, drinks and supplements for cardiovascular health
 Position statement Antioxidants in food, drinks and supplements for cardiovascular health This position statement provides recommendations for the consumption of antioxidantrich food, drinks and supplements
2003 World Health Organization (WHO) / International Society of Hypertension (ISH) Statement on Management of Hypertension.
 / International Society of Hypertension (ISH) Statement on Management of Hypertension.") 2003 World Health Organization (WHO) / International Society of Hypertension (ISH) Statement on Management of Hypertension Writing Group: Background Hypertension worldwide causes 7.1 million premature
2003 World Health Organization (WHO) / International Society of Hypertension (ISH) Statement on Management of Hypertension Writing Group: Background Hypertension worldwide causes 7.1 million premature
Heart Disease Genesis
 Heart Disease Genesis The Ultimate Lecture on CAD origins Petr Polasek MD FRCPC FACC Copyright 2017 by Sea Courses Inc. All rights reserved. No part of this document may be reproduced, copied, stored,
7/6/2012. University Pharmacy 5254 Anthony Wayne Drive Detroit, MI (313)
") University Pharmacy 5254 Anthony Wayne Drive Detroit, MI 48202 (313) 831-2008 Be able to identify the signs of a heart attack or stoke Identify what puts you at a higher risk for cardiovascular disease,
University Pharmacy 5254 Anthony Wayne Drive Detroit, MI 48202 (313) 831-2008 Be able to identify the signs of a heart attack or stoke Identify what puts you at a higher risk for cardiovascular disease,
NATIONAL INSTITUTE FOR HEALTH AND CLINICAL EXCELLENCE
 NATIONAL INSTITUTE FOR HEALTH AND CLINICAL EXCELLENCE QUALITY AND OUTCOMES FRAMEWORK (QOF) INDICATOR DEVELOPMENT PROGRAMME Briefing paper QOF indicator area: Primary prevention of CVD Potential output:
American Diabetes Association: Standards of Medical Care in Diabetes 2015
 American Diabetes Association: Standards of Medical Care in Diabetes 2015 Synopsis of ADA standards relevant to the 11 th Scope of Work under Task B.2 ASSESSMENT OF GLYCEMIC CONTROL Recommendations: Perform
Cardiovascular health benefits of plant-based eating
 Cardiovascular health benefits of plant-based eating Ian Rowland University of Reading Alpro Foundation Student Symposium March 2017 Leeds Overview What is plant-based eating? Cardiovascular disease Benefits
Numerous epidemiology studies support the concept that diets rich in plant foods are associated with a reduced risk for vascular disease.
 13 Numerous epidemiology studies support the concept that diets rich in plant foods are associated with a reduced risk for vascular disease. Fruits/Vegetables - Multivariate adjusted RR for >=3 times/day
Traditional Asian Soyfoods. Proven and Proposed Cardiovascular Benefits of Soyfoods. Reduction (%) in CHD Mortality in Eastern Finland ( )
 in CHD Mortality in Eastern Finland ( )") Proven and Proposed Cardiovascular Benefits of Soyfoods Mark Messina, PhD, MS Soy Nutrition Institute Loma Linda University Nutrition Matters, Inc. markjohnmessina@gmail.com 1000 80 20 60 40 40 60 20 80
Proven and Proposed Cardiovascular Benefits of Soyfoods Mark Messina, PhD, MS Soy Nutrition Institute Loma Linda University Nutrition Matters, Inc. markjohnmessina@gmail.com 1000 80 20 60 40 40 60 20 80
Fruits and Vegetables Why More Matters
 Fruits and Vegetables Why More Matters Francene Steinberg, PhD, RD Professor and Chair Department of Nutrition University of California, Davis September 22, 2012 Obesity & Nutrition in a Changing World
Case Study #4: Hypertension and Cardiovascular Disease
 Helen Jang Tara Hooley John K Rhee Case Study #4: Hypertension and Cardiovascular Disease 7. What risk factors does Mrs. Sanders currently have? The risk factors that Mrs. Sanders has are high blood pressure
Guidelines on cardiovascular risk assessment and management
 European Heart Journal Supplements (2005) 7 (Supplement L), L5 L10 doi:10.1093/eurheartj/sui079 Guidelines on cardiovascular risk assessment and management David A. Wood 1,2 * 1 Cardiovascular Medicine
Session 21: Heart Health
 Session 21: Heart Health Heart disease and stroke are the leading causes of death in the world for both men and women. People with pre-diabetes, diabetes, and/or the metabolic syndrome are at higher risk
well-targeted primary prevention of cardiovascular disease: an underused high-value intervention?
 well-targeted primary prevention of cardiovascular disease: an underused high-value intervention? Rod Jackson University of Auckland, New Zealand October 2015 Lancet 1999; 353: 1547-57 Findings: Contribution
Insert logo. Linda Main, Dietetic Adviser
 Insert logo Linda Main, Dietetic Adviser HEART UK The Cholesterol Charity Our Vision: To prevent avoidable and early deaths caused by high cholesterol. We want the majority of UK adults to know their cholesterol
Proven and Proposed Cardiovascular Benefits of Soyfoods
 Proven and Proposed Cardiovascular Benefits of Soyfoods Mark Messina, PhD, MS Soy Nutrition Institute Loma Linda University Nutrition Matters, Inc. markjohnmessina@gmail.com Alpro Foundation 20 years symposium
Marshall Tulloch-Reid, MD, MPhil, DSc, FACE Epidemiology Research Unit Tropical Medicine Research Institute The University of the West Indies, Mona,
 Marshall Tulloch-Reid, MD, MPhil, DSc, FACE Epidemiology Research Unit Tropical Medicine Research Institute The University of the West Indies, Mona, Jamaica At the end of this presentation the participant
A Proposed Randomized Trial of Cocoa Flavanols and Multivitamins in the Prevention of Cardiovascular Disease and Cancer
 A Proposed Randomized Trial of Cocoa Flavanols and Multivitamins in the Prevention of Cardiovascular Disease and Cancer JoAnn E. Manson, MD, DrPH Howard D. Sesso, ScD, MPH Brigham and Women's Hospital
Term-End Examination December, 2009 MCC-006 : CARDIOVASCULAR EPIDEMIOLOGY
 MCC-006 POST GRADUATE DIPLOMA IN CLINICAL CARDIOLOGY (PGDCC) 00269 Term-End Examination December, 2009 MCC-006 : CARDIOVASCULAR EPIDEMIOLOGY Time : 2 hours Maximum Marks : 60 Note : There will be multiple
Mediterranean Diet: Choose this heart-healthy diet option
 Mediterranean Diet: Choose this heart-healthy diet option The Mediterranean diet is a heart-healthy eating plan combining elements of Mediterraneanstyle cooking. Here s how to adopt the Mediterranean diet.
The Paleolithic Diet. A Review
 The Paleolithic Diet A Review by: Philip Rouchotas, MSc, ND Bolton Naturopathic Clinic 64 King St. W, Bolton, Ontario L7E 1C7 info@boltonnaturopathic.ca What is the Paleolithic Diet? Today s modern diet
STAYING HEART HEALTHY PAVAN PATEL, MD CONSULTANT CARDIOLOGIST FLORIDA HEART GROUP
 STAYING HEART HEALTHY PAVAN PATEL, MD CONSULTANT CARDIOLOGIST FLORIDA HEART GROUP What is Heart Disease Cardiovascular Disease (CVD): Heart or Blood vessels are not working properly. Most common reason
Cardiovascular disease, studies at the cellular and molecular level. Linda Lowe Krentz Bioscience in the 21 st Century September 23, 2009
 Cardiovascular disease, studies at the cellular and molecular level Linda Lowe Krentz Bioscience in the 21 st Century September 23, 2009 Content Introduction The number 1 killer in America Some statistics
Cardiovascular disease physiology. Linda Lowe-Krentz Bioscience in the 21 st Century November 2, 2016
 Cardiovascular disease physiology Linda Lowe-Krentz Bioscience in the 21 st Century November 2, 2016 Content Introduction The number 1 killer in America Some statistics Recommendations The disease process
DECLARATION OF CONFLICT OF INTEREST. None
 DECLARATION OF CONFLICT OF INTEREST None Dietary changes and its influence on cardiovascular diseases in Asian and European countries Problems of Eastern European countries for cardiovascular disease prevention
Effects of whole grain intake on weight changes, diabetes, and cardiovascular Disease
 Effects of whole grain intake on weight changes, diabetes, and cardiovascular Disease Simin Liu, MD, ScD Professor of Epidemiology and Medicine Director, Center for Global Cardiometabolic Health Brown
L III: DIETARY APPROACH
 L III: DIETARY APPROACH FOR CARDIOVASCULAR DISEASE PREVENTION General Guidelines For Dietary Interventions 1. Obtain a healthy body weight 2. Obtain a desirable blood cholesterol and lipoprotein profile
Heart disease and stroke major health problems
 Understanding Heart Disease Introduction We all know that heart health is important and that we should maintain a healthy diet and take regular exercise, but our hectic lifestyles don t always allow for
Impact of Lifestyle Modification to Reduce Cardiovascular Disease Event Risk of High Risk Patients with Low Levels of HDL C
 Impact of Lifestyle Modification to Reduce Cardiovascular Disease Event Risk of High Risk Patients with Low Levels of HDL C Thomas P. Bersot, M.D., Ph.D. Gladstone Institute of Cardiovascular Disease University
Optimizing risk assessment of total cardiovascular risk What are the tools? Lars Rydén Professor Karolinska Institutet Stockholm, Sweden
 Optimizing risk assessment of total cardiovascular risk What are the tools? Lars Rydén Professor Karolinska Institutet Stockholm, Sweden Cardiovascular Disease Prevention (CVD) Three Strategies for CVD
Diet, nutrition and cardio vascular diseases. By Dr. Mona Mortada
 Diet, nutrition and cardio vascular diseases By Dr. Mona Mortada Contents Introduction Diet, Diet, physical activity and cardiovascular disease Fatty Fatty acids and dietary cholesterol Dietary Dietary
NUTRITION IN THE AGE OF EVIDENCE D A N A H. M A N N I N G P H A R M. D., R. D., L D N
 NUTRITION IN THE AGE OF EVIDENCE D A N A H. M A N N I N G P H A R M. D., R. D., L D N OBJECTIVES List controversial points from the current Dietary Guidelines for Americans (DGA). Recognize the policy
Absolute cardiovascular disease risk management
 Quick reference guide for health professionals Absolute cardiovascular disease risk management This quick reference guide is for use by health professionals for primary prevention of cardiovascular disease
Professor Clare Collins
 Dietary Patterns and Cardiovascular Disease (CVD) Outcomes: An evidence summary Professor Clare Collins PhD, BSc, Dip Nutr&Diet, Dip Clin Epi, advapd, FDAA Director of Research, School of Health Sciences,
2013 ACC/AHA Guidelines on the Assessment of Atherosclerotic Cardiovascular Risk: Overview and Commentary
 2013 ACC/AHA Guidelines on the Assessment of Atherosclerotic Cardiovascular Risk: Overview and Commentary The Johns Hopkins Ciccarone Center for the Prevention of Heart Disease Becky McKibben, MPH; Seth
The COSMOS Trial. (COcoa Supplement and Multivitamins Outcomes Study) JoAnn E. Manson, MD, DrPH Howard D. Sesso, ScD, MPH
 JoAnn E. Manson, MD, DrPH Howard D. Sesso, ScD, MPH") COSMOS Trial The COSMOS Trial (COcoa Supplement and Multivitamins Outcomes Study) JoAnn E. Manson, MD, DrPH Howard D. Sesso, ScD, MPH Brigham and Women's Hospital Harvard Medical School Garnet L. Anderson,
COSMOS Trial The COSMOS Trial (COcoa Supplement and Multivitamins Outcomes Study) JoAnn E. Manson, MD, DrPH Howard D. Sesso, ScD, MPH Brigham and Women's Hospital Harvard Medical School Garnet L. Anderson,
Tea Expert Newsletter Issue five. Scientific update on tea, flavonoids and blood pressure
 Tea Expert Newsletter Issue five Scientific update on tea, flavonoids and blood pressure Scientific update on tea, flavonoids and blood pressure From the editors The worldwide epidemic of cardiovascular
Clinical Care Performance. Financial Year 2012 to 2018
 Clinical Care Performance Financial Year 2012 to 2018 SHP Clinical Care Performance Diabetes Mellitus Hyperlipidemia Hypertension Diabetes Mellitus Find out how our patients are doing for: HbA1C HbA1c
EXECUTIVE SUMMARY OF THE MINOR RESEARCH PROJECT Submitted to UNIVERSITY GRANTS COMMISSION
 1 A STUDY ON THE EFFECT OF DIET & LIFE STYLE ON THE INCIDENCE OF CORONARY ARTERY DISEASE IN MODERATELY DRINKING EX MILITARY MEN IN PATHANAMTHITTA DISTRICT. EXECUTIVE SUMMARY OF THE MINOR RESEARCH PROJECT
Examining the relationship between beverage intake and cardiovascular health. Ian Macdonald University of Nottingham UK
 Examining the relationship between beverage intake and cardiovascular health Ian Macdonald University of Nottingham UK Outline Assessment of evidence in relation to health risks of dietary components Cardiovascular
Foods for healthy ageing. Parmeet Kaur M.Sc (Foods & Nutrition),PhD, R.D. Senior Dietician All India Institute of Medical Sciences New Delhi
,PhD, R.D. Senior Dietician All India Institute of Medical Sciences New Delhi") Foods for healthy ageing Parmeet Kaur M.Sc (Foods & Nutrition),PhD, R.D. Senior Dietician All India Institute of Medical Sciences New Delhi Motivating Quote What is ageing? Ageing is a progressive process
Foods for healthy ageing Parmeet Kaur M.Sc (Foods & Nutrition),PhD, R.D. Senior Dietician All India Institute of Medical Sciences New Delhi Motivating Quote What is ageing? Ageing is a progressive process
SIGN 149 Risk estimation and the prevention of cardiovascular disease. Quick Reference Guide July Evidence
 SIGN 149 Risk estimation and the prevention of cardiovascular disease Quick Reference Guide July 2017 Evidence ESTIMATING CARDIOVASCULAR RISK R Individuals with the following risk factors should be considered
4 Nutrient Intakes and Dietary Sources: Micronutrients
 Nutrient Intakes and Dietary Sources: Micronutrients New Zealanders obtain the energy and nutrients they require from a wide variety of foods and beverages, and in some cases from dietary supplements as
Victor Tambunan. Department of Nutrition Faculty of Medicine Universitas Indonesia
 Victor Tambunan Department of Nutrition Faculty of Medicine Universitas Indonesia 1 Handbook of Clinical Nutrition 4th ed., 2006, by D. C. Heimburger & J. A. Ard Krause s Nutrition & Diet Therapy 12th
Adherence to a healthy diet in relation to cardiovascular incidence and risk markers: evidence from the Caerphilly Prospective Study
 DOI 10.1007/s00394-017-1408-0 ORIGINAL CONTRIBUTION Adherence to a healthy diet in relation to cardiovascular incidence and risk markers: evidence from the Caerphilly Prospective Study Elly Mertens 1,2
Section Editor Steven T DeKosky, MD, FAAN Kenneth E Schmader, MD
 Prevention of dementia Author Daniel Press, MD Michael Alexander, MD Section Editor Steven T DeKosky, MD, FAAN Kenneth E Schmader, MD Deputy Editor Janet L Wilterdink, MD Last literature review version
Essential Fatty Acids Essential for Good Health SIE
 Page 1 of 6 Essential Fatty Acids Essential for Good Health SIE By Yousry Naguib, PhD Essential fatty acids (EFAs) must be obtained through the diet and cannot be synthesized by the human body. EFAs are
Dyslipedemia New Guidelines
 Dyslipedemia New Guidelines New ACC/AHA Prevention Guidelines on Blood Cholesterol November 12, 2013 Mohammed M Abd El Ghany Professor of Cardiology Cairo Universlty 1 1 0 Cholesterol Management Pharmacotherapy
NATIONAL INSTITUTE FOR HEALTH AND CLINICAL EXCELLENCE
 NATIONAL INSTITUTE FOR HEALTH AND CLINICAL EXCELLENCE QUALITY AND OUTCOMES FRAMEWORK (QOF) INDICATOR DEVELOPMENT PROGRAMME Briefing paper QOF indicator area: Peripheral arterial disease Potential output:
Can foods change your health? Good fats and bad fats: what is the evidence? Kay-Tee Khaw. Main categories of fats
 Can foods change your health? Good fats and bad fats: what is the evidence? Kay-Tee Khaw UNIVERSITY OF CAMBRIDGE Hong Kong July 6 213 Yerushalmy J Hilleboe HE NY State J Med 1957 Coronary heart disease
Prevention of Heart Disease. Giridhar Vedala, MD Cardiovascular Medicine
 Prevention of Heart Disease Giridhar Vedala, MD Cardiovascular Medicine What is Heart Disease? Heart : The most hard-working muscle of our body pumps 4-5 liters of blood every minute during rest Supplies
Statistical Fact Sheet Populations
 Statistical Fact Sheet Populations At-a-Glance Summary Tables Men and Cardiovascular Diseases Mexican- American Males Diseases and Risk Factors Total Population Total Males White Males Black Males Total
Key causes of preventable deaths in New Zealand In a population of 10,000 New Zealanders, every year there will be about:
 Preventive care - Chronic Disease Management in primary care: a population perspective Rod Jackson University of Auckland New Zealand (22/11/8) Key causes of preventable deaths in New Zealand In a population
!!! Aggregate Report Fasting Biometric Screening CLIENT!XXXX. May 2, ,000 participants
 Aggregate Report Fasting Biometric Screening CLIENTXXXX May 2, 2014 21,000 participants Contact:404.636.9437~Website:www.atlantahealthsys.com RISK FACTOR QUESTIONNAIRE Participants Percent Do not exercise
Nutrition Counselling
 Nutrition Counselling Frieda Dähler Augustiny, Nutritional Counsellor Preventive Cardiology & Sports Medicine University Clinic of Cardiology Optimal Diet for Prevention of Coronary Heart Disease Diet
Eating Patterns. did you know. Peanuts and Peanut Butter 67% Peanut butter is one of the most frequently consumed plant proteins in the U.S.
 Peanuts are the Most Popular Nut Peanuts are the most commonly eaten nuts in America. When peanut butter is factored in, they comprise over 2/3 of the nut consumption in the U.S. Pecans 4% 2% Pistachios
Lipids Types, Food Sources, Functions
 Lipids Types, Food Sources, Functions What Are Lipids? Lipids Diverse group of molecules that are insoluble in water Fats The lipid content of diets and foods 1 Lipids in Body Cells and Tissues Types of
Type of intervention Primary prevention; secondary prevention. Economic study type Cost-effectiveness analysis and cost utility analysis.
 A predictive model of the health benefits and cost effectiveness of celiprolol and atenolol in primary prevention of cardiovascular disease in hypertensive patients Milne R J, Hoorn S V, Jackson R T Record
Screening Results. Juniata College. Juniata College. Screening Results. October 11, October 12, 2016
 Juniata College Screening Results Juniata College Screening Results October 11, 2016 & October 12, 2016 JUNIATA COLLEGE The J.C. Blair Hospital CARES team screened 55 Juniata College employees on October
Flavonoids and Cardiovascular Disease
 Flavonoids and Cardiovascular Disease Julie Lovegrove Hugh Sinclair Professor of Human Nutrition University of Reading Micronutrients and Health APPG University of Reading 2014 www.reading.ac.uk Global
What should I eat? I am so confused. Jennifer Lyon DO
 What should I eat? I am so confused. Jennifer Lyon DO Conflict of Interest Disclosure I have no conflict of interest to report Overview 2015-2020 Dietary Guidelines 5 primary guidelines Sugar intake Sodium
13/09/2012. Dietary fatty acids. Triglyceride. Phospholipids:
 CARDIOVASCULAR DISEASES (CVD) and NUTRITION Major cause of morbidity & mortality in Canada & other developed countries e.g., majority of approved health claims on food labels relate to lowering CVD Relation
Cardiac patient quality of life. How to eat adequately?
 Cardiac patient quality of life How to eat adequately? François Paillard CV Prevention Center CHU Rennes JESFC, Paris, 17/01/2013 Mrs. L. 55 yrs, Coronary artery disease, normal weight, mild hypertension
HEART HEALTH. Anjanette Fraser. The Natural Alternative Health & Wellbeing Ltd
 HEART HEALTH Anjanette Fraser The Natural Alternative Health & Wellbeing Ltd AGENDA 1 Heart conditions 2 Blood pressure 3 Diabetes 4 Cholesterol 5 Smoking 6 Alcohol 7 Exercise 8 Weight UK STATISTICS Chronic
Where are we heading?
 Unit 5: Where are we heading? Unit 5: Introduction Unit 1: What s in your food? Unit 2: How does your body use food? Unit 3: What is metabolic disease? Unit 4: How do I identify good and bad food? Unit
Using the New Hypertension Guidelines
 Using the New Hypertension Guidelines Kamal Henderson, MD Department of Cardiology, Preventive Medicine, University of North Carolina School of Medicine Kotchen TA. Historical trends and milestones in
HEART HEALTH AND HEALTHY EATING HABITS
 HEART HEALTH AND HEALTHY EATING HABITS ELIZABETH PASH PENNIMAN RD,LD CLINICAL DIETITIAN Professional Member American Heart Association; Council on Nutrition, Physical Activity and Metabolism PURPOSE: Recognize
Lecture 8 Cardiovascular Health Lecture 8 1. Introduction 2. Cardiovascular Health 3. Stroke 4. Contributing Factors
 Lecture 8 Cardiovascular Health 1 Lecture 8 1. Introduction 2. Cardiovascular Health 3. Stroke 4. Contributing Factors 1 Human Health: What s Killing Us? Health in America Health is the U.S Average life
 Five chapters 1. What is CVD prevention 2. Why is CVD prevention needed 3. Who needs CVD prevention 4. How is CVD prevention applied 5. Where should CVD prevention be offered Shorter, more adapted to clinical
10/3/2016. SUPERSIZE YOUR KNOWLEDGE OF the CARDIAC DIET. What is a cardiac diet. If it tastes good, spit it out!!
 SUPERSIZE YOUR KNOWLEDGE OF the CARDIAC DIET What is a cardiac diet If it tastes good, spit it out!! 2 1 Heart healthy diet includes: Limiting saturated fat Including unsaturated fats Including omega 3
Women and Heart Disease
 Patient Education Women and Heart Disease Heart disease is the concern of every woman today. You might think that breast cancer and osteoporosis are the 2 biggest diseases that affect women. But, women
Lipids. PBHL 211 Darine Hachem, MS, LD
 Lipids PBHL 211 Darine Hachem, MS, LD Outline Functions of lipids in our body Types of lipids Sources of lipids Recommendation of fat intake Fat association with heart diseases Provide energy (9Kcal/g
Cardiovascular disease, studies at the cellular and molecular level. Linda Lowe Krentz Bioscience in the 21 st Century October 4, 2010
 Cardiovascular disease, studies at the cellular and molecular level Linda Lowe Krentz Bioscience in the 21 st Century October 4, 2010 Content Introduction The number 1 killer in America Some statistics
Managing High Blood Pressure Naturally. Michael A. Smith, MD Life Extension s Healthy Talk Series
 Managing High Blood Pressure Naturally Michael A. Smith, MD Life Extension s Healthy Talk Series Part 1 What is Blood Pressure? Blood Pressure Systole Systolic Forward Pressure 110 mmhg 70 mmhg Diastole
Latest evidence for the cardiovascular health benefits of polyphenols. Prof Kevin D Croft University of Western Australia
 Latest evidence for the cardiovascular health benefits of polyphenols Prof Kevin D Croft University of Western Australia New England J Medicine 369(10), 954, 2013 Outline Population cohort studies How
Guidelines: Saturated fatty acid and trans-fatty acid intake for adults and children
 Guidelines: Saturated fatty acid and trans-fatty acid intake for adults and children Contents Acknowledgements... 2 Abbreviations and acronyms... 2 Executive summary... 3 Introduction... 15 Scope and purpose...
Andrew Cohen, MD and Neil S. Skolnik, MD INTRODUCTION
 2 Hyperlipidemia Andrew Cohen, MD and Neil S. Skolnik, MD CONTENTS INTRODUCTION RISK CATEGORIES AND TARGET LDL-CHOLESTEROL TREATMENT OF LDL-CHOLESTEROL SPECIAL CONSIDERATIONS OLDER AND YOUNGER ADULTS ADDITIONAL
Results/ conclusion. Reference Duration Number subjects. Study description. Limitations of the data. Randomized controlled trial (RCT)
") (original) Appel, 1997 8 weeks 459 459 ; all received a control SAD for 3 weeks then randomized to (i) control (ii) a diet rich in fruits and veg (FV) or (iii) a combination diet (combo) rich in fruits,
(original) Appel, 1997 8 weeks 459 459 ; all received a control SAD for 3 weeks then randomized to (i) control (ii) a diet rich in fruits and veg (FV) or (iii) a combination diet (combo) rich in fruits,
 http://noodlemaz.wordpress.com/category/science/cancer/ Outline Introduction Serious nature of Cardiovascular Disease (CVD) How to prevent CVD? The disease process Damage and plaque development Current
Chocolate, red wine, peanuts health foods or indulgences? Alison Coates, PhD, RNutr
 Chocolate, red wine, peanuts health foods or indulgences? Alison Coates, PhD, RNutr Annual Food Industry Forum for Nutrition Research August 31 st 201 0 Functional Foods Chocolate, red wine and peanuts
EFFECT OF PLANT SOURCE DIETARY INTAKE ON BLOOD PRESSURE OF ADULTS IN BAYELSA STATE
 EFFECT OF PLANT SOURCE DIETARY INTAKE ON BLOOD PRESSURE OF ADULTS IN BAYELSA STATE 1 Dr. Olusegun, A. Kuforiji & 2 John Samuel 1 Department of Agricultural Technology, Federal Polytechnic, Ekowe, Bayelsa
CHOLESTEROL CONTENT CREATED BY. Learn more at
 CHOLESTEROL CONTENT CREATED BY Learn more at www.health.harvard.edu TALK WITH YOUR DOCTOR Table of Contents what is cholesterol? 4 Whether this is your first visit or a follow-up, asking your doctor these
Metabolic Factors Frequency of Chocolate Consumption and Body Mass Index
 School of Medicine, Health Sciences and Engineering Susquehanna Township High School Lecture Series Week 23, February 4 2014 Clinical Relevance of This Week s Topic Metabolic Factors Frequency of Chocolate
Exploring the links between Food, Diet and Non-Communicable Disease
 Exploring the links between Food, Diet and Non-Communicable Disease Evidence and Controversies Ian T Johnson Emeritus Fellow, Quadram Institute Bioscience, Norwich Almost everything we think we know about
Diabetes Mellitus: A Cardiovascular Disease
 Diabetes Mellitus: A Cardiovascular Disease Nestoras Mathioudakis, M.D. Assistant Professor of Medicine Division of Endocrinology, Diabetes, & Metabolism September 30, 2013 1 The ABCs of cardiovascular
Dyslipidemia in the light of Current Guidelines - Do we change our Practice?
 Dyslipidemia in the light of Current Guidelines - Do we change our Practice? Dato Dr. David Chew Soon Ping Senior Consultant Cardiologist Institut Jantung Negara Atherosclerotic Cardiovascular Disease
Instructor s Manual for Unit 2 The Inside Story about Nutrition and Health
 Instructor s Manual for Unit 2 The Inside Story about Nutrition and Health Class Preparation Materials in the Instructor s Manual for Unit 2 Learning Objectives Brief Chapter Outline Answers to Global
Total risk management of Cardiovascular diseases Nobuhiro Yamada
 Nobuhiro Yamada The worldwide burden of cardiovascular diseases (WHO) To prevent cardiovascular diseases Beyond LDL Multiple risk factors With common molecular basis The Current Burden of CVD CVD is responsible
Facts on Fats. Ronald P. Mensink
 Facts on Fats Ronald P. Mensink Department of Human Biology NUTRIM, School for Nutrition, Toxicology and Metabolism Maastricht University Maastricht The Netherlands Outline of the Presentation Saturated
Building Our Evidence Base
 Plant-Based Diets Neal D. Barnard, MD, FACC Adjunct Associate Professor of Medicine George Washington University School of Medicine Physicians Committee for Responsible Medicine Washington, DC Building
Chronic Disease and Nutritional Underpinnings. Patrick Gélinas Dept. of Exercise and Sports Science USC Aiken
 Chronic Disease and Nutritional Underpinnings Patrick Gélinas Dept. of Exercise and Sports Science USC Aiken Modern Diseases Difficult (impossible?) to gain information regarding diseases among prehistoric
Primary and Secondary Prevention of Cardiovascular Disease. Frank J. Green, M.D., F.A.C.C. St. Vincent Medical Group
 Primary and Secondary Prevention of Cardiovascular Disease Frank J. Green, M.D., F.A.C.C. St. Vincent Medical Group AHA Diet and Lifestyle Recommendations Balance calorie intake and physical activity to
The Mediterranean Diet: The Optimal Diet for Cardiovascular Health
 The Mediterranean Diet: The Optimal Diet for Cardiovascular Health Vasanti Malik, ScD Research Scientist Department of Nutrition Harvard School of Public Health Cardiovascular Disease Prevention International
Northwestern University Feinberg School of Medicine Calculating the CVD Risk Score: Which Tool for Which Patient?
 Northwestern University Feinberg School of Medicine Calculating the CVD Risk Score: Which Tool for Which Patient? Donald M. Lloyd-Jones, MD, ScM, FACC, FAHA Senior Associate Dean Chair, Department of Preventive
ENERGY NUTRIENTS: THE BIG PICTURE WHY WE EAT FUNCTIONS FATS FAT, CARBS, PROTEIN
 ENERGY NUTRIENTS: FAT, CARBS, PROTEIN Angeline B. David, DRPH, MHS NAD Health Summit March 14, 2013 The science of cooking is not a small matter.... This art should be regarded as the most valuable of
Nutrients and Circulatory Function
 Clinical Nutrition Research Centre Nutrients and Circulatory Function Peter Howe Clinical Nutrition Research Centre University of Newcastle Nutritional Physiology Research Centre University of South Australia
How to Prevent Heart Disease
 How to Prevent Heart Disease Introduction Heart disease is the leading cause of death worldwide. You can reduce your risk of heart disease with healthy habits. This reference summary explains heart disease