Response-shock delay as the controlling mechanism on avoidance behavior.
|
|
|
- Reynold Copeland
- 5 years ago
- Views:
Transcription
1 University of Massachusetts Amherst Amherst Doctoral Dissertations February 2014 Dissertations and Theses Response-shock delay as the controlling mechanism on avoidance behavior. James Orel Benedict University of Massachusetts Amherst Follow this and additional works at: Recommended Citation Benedict, James Orel, "Response-shock delay as the controlling mechanism on avoidance behavior." (1973). Doctoral Dissertations February This Open Access Dissertation is brought to you for free and open access by the Dissertations and Theses at ScholarWorks@UMass Amherst. It has been accepted for inclusion in Doctoral Dissertations February 2014 by an authorized administrator of ScholarWorks@UMass Amherst. For more information, please contact scholarworks@library.umass.edu.

2

3 I RESPONSE-SHOCK DELAY AS THE CONTROLLING MECHANISM IN AVOIDANCE BEHAVIOR A Dissertation Presented By James Orel Benedict Submitted to the Graduate School of the University of Massachusetts In partial fulfillment of the requirements for the degree of DOCTOR OF PHILOSOPHY June, 1973 Major Subject: Psychology

 G/{I^(Head of D^artment) 'J.")
4 RESPONSE-SHOCK DELAY AS THE CONTROLLING MECHANISM IN AVOIDANCE BEHAVIOR A Dissertation By James Orel Benedict Approved as to style and content by: (Chairman of Committee) G/{I^(Head of D^artment) 'J. (Member),' r (Member) (Member) June 1973


5 ill Acknowledgment The writer wishes to extend his deep gratitude to Dr. John J. B. Ayres, Chairman of the dissertation committee, for his able direction and guidance In this research and during my four years of work with him. The writer also wishes to express his appreciation to members of the dissertation committee, Dr. John W. Donahoe, Dr. Morton G. Harmatz and Dr. Theodore D. Sargent, for their constructive criticisms and corrections of the manuscript. Special thanks is due to Jean Pickens, who spent many an hour helping with data analysis and to Mark and Janle Witcher who helped me with writing the data-analysis computer program and with data analysis. But especially I thank my wife, Martle, who constantly encouraged me and supported me throughout graduate school.


6 iv Table of Contents List of Tables List of Figures Abstract Introduction Experiment 1 Method Results and Experiment 2 Method Results Experiment 3 Method Results Experiment A Method Results Discussion Experiment 5 Method Discussion Page V vl viii Results and Discussion 70 General Discussion References 83
7 V List of Tables Table 1 Average Latency Predictions for Each Condition in Experiment 1 Page 16 Response Rate and Shock Rate per minute for First Phase of Preliminary Training 17 3 Sequence of Procedures for Each Animal in Experiment 1 4 The Number of Trials before each Subject made its Second Response during the Constant Delay Preliminary Training and the first Session of the Experimental Delay Treatment 20 39


8 vi List of Figures Figure 1 Schema for the procedures in Experiment 1 2 The percent response and average latencies for five animals placed on the CD condition 3 Latency distributions for the Constant Delay Condition A The percent response and average latencies for six animals placed on the L-LD condition 5 The Latency distribution date for the L-LD Condition 6 The percent response and average latencies for six animals placed on the S-LD condition 7 The Latency distribution data for the S-LD Condition Page The percent response and average latencies for six animals placed on the DTA condition 42 9 The Latency distribution data for the DTA Condition 2^4 10 The percent response and average latencies for five animals in the No-Delay condition The Latency distribution data for the No-Delay Condition The range of percent response for each condition The range of average latencies for each condition The effect of late and early avoidance on percent response and average latency for two subjects The effect of the No-Delay procedure on subjects that had received the partial avoidance procedure 64

9 vii List of Figures (cont'd) Figure 16 Relative frequencies for L3 and L4 in a 31-sec cycle and on a 41-sec cycle 17 Percent responses for No-Delay subjects on a Titration^of-Delay procedure Page 57 72


10 vili Abstract When rats were placed on procedures in which responses only delayed shock, they responded in such a way as to maximize the interval or delay between response and shock. Responding was not maintained by the termination of external stimuli or of internal temporal stimuli. Responding was also not maintained by maximizing the interval between trial onset and shock. When short latencies produced the longest response-shock delay, animals made short latency responses. When long latencies maximized the response-shock delay, animals made long latency responses. When all response latencies produced the same response-shock delay, animals made differing average latency responses. And when responses did not delay shock, animals primarily engaged in post-shock responding.


11 An avoidance procedure involves two contingencies for the animal. First, if the animal does not make the correct response, he receives an aversive event such as electric shock. The shock may be programmed to occur at regular or irregular intervals, and it may or may not be preceded by a signal. Second, if the animal does make the correct response, the shock which was scheduled will not occur. When an animal responds on such a procedure, what maintains his behavior? It is possible to identify four potential sources of reinforcement and one source of eliciting stimuli. First, responses may be reinforced by the termination of some external conditioned aversive signal (Solomon and Wynne, 1953). Second, responding may be reinforced by the termination of some internal conditioned aversive temporal stimulus associated with shock onset (Anger, 1963). Third, responding may be reinforced by the reduction of the overall frequency of aversive stimulation (Sidman, 1962; Hernstein and Hineline, 1966). Fourth, responses may be elicited by shock (Hutchinson, Renfrew, and Young, 1971). Or, fifth, responding may be reinforced by delaying the onset of aversive stimulation (Hineline, 1970). In this research it will be argued that a sufficient and perhaps a necessary condition for avoidance behavior is that the behavior delay the onset of aversive stimulation. Delay of shock after a response is usually considered necessary for acquisition and maintenance of avoidance behavior (e.g., Bolles & Popp, 196A). Bolles and Popp (1964) ran a modified Sidman avoidance procedure. In a normal Sidman procedure, every response begins the response-shock (R-S) interval. Bolles and Popp changed the procedure

 have recently presented some data that tend to demonstrate that delay may not be necessary for avoidance learning.")
12 so that responses made during the shock-shock (S-S) interval did not begin the R-S Interval until the S-S Interval had delivered the next scheduled shock. They found that none of the animals placed on this procedure learned to avoid shock. This is evidence that delay of shock after a response may be a necessary condition for the acquisition of avoidance behavior. Lambert, Bersh, Hineline, and Smith (1973) have recently presented some data that tend to demonstrate that delay may not be necessary for avoidance learning. They found that animals would respond to avoid scheduled pulse trains of five shocks even though each response was followed by one shock. Since shock immediately followed each response, it might be argued that shock delay is not necessary in avoidance. However, since the response-produced shock was probably less aversive than the series of five shocks, the results of Lambert et a]^ do not refute the argument that delay of shock may be necessary. They may indicate only that under some conditions the reinforcing effects of delaying one aversive event may overpower the punishing effects of a less aversive event. Hopefully, the results of the present research may help answer the question whether delay of shock is necessary and sufficient for the maintenance of avoidance behavior. Before the methods of the research are described, several experiments will be discussed to show how delay is a feature of every avoidance procedure. However, it is a feature whose importance is difficult to assess because it has always been completely confounded with several other possible sources of reinforcement.


13 3 Solomon and Wynne (1953) placed dogs on an avoidance procedure in which an external signal preceded shock. If the dogs crossed a hurdle during the signal, they would avoid the shock and the signal would terminate. Solomon and Wynne argued that, via classical conditioning, the signal came to elicit diffuse emotional responses in the dogs; these emotional reactions increased the drive level of the animals; the act of crossing the hurdle, which terminated the aversive signal, reduced the drive; and drive reduction reinforced the instrumental response. It should be noted, however, that when the dogs crossed the hurdle, they not only terminated the aversive signal, but also reduced shock density and delayed the onset of shock. In fact, in this experiment and many others like it, all four of the possible sources of reinforcement were confounded. It is impossible to determine which source of reinforcement maintained the behavior. Bolles, Stokes and Younger (1966) in a series of five experiments tried to eliminate the confounding of the CS-termination contingency and the avoidance contingency. In one procedure responses terminated the CS but did not avoid shock; in another, responses avoided shock but did not terminate the CS; and, in another, the CS terminated before the response was made. They found that CS termination had some small effect on the strength of the avoidance response but that the major factor in avoidance learning appeared to be the avoidance of shock. In the discrete trial running-wheel procedures they used, the avoidance of shock (or shock frequency reduction) was always confounded with response-produced delay of shock. Delay of shock was present, but the procedures used made it impossible to assess the relative

14 Importance of this source of reinforcement. By using no external CS, Sidman (1962) eliminated the CS-termination contingency completely. He provided animals with two response levers, each associated with a different schedule of shock presentation. For instance, shocks associated with lever A were presented every 20 sec and shocks associated with lever B were presented every 40 sec. He found that animals did not respond on both levers but chose to respond on only one. Moreover, the animals usually chose the lever that afforded the greatest reduction in shock frequency. Sidman therefore concluded, that the source of reinforcement for avoidance behavior was the reduction of shock frequency. This type of procedure does eliminate the confounding of external stimulus termination with the other three sources of reinforcement. It may also eliminate the confounding of any Internal temporal stimulus termination. Since shocks were delivered by either the timer associated with lever A or with lever B, it was probably very difficult for an animal to form any temporal discrimination about the onset of shock. However, Sidman's procedure still left three variables confounded: Shock frequency reduction, response-produced delay of shock and shock elicited behavior. Not only did responses reduce the frequency of shocks, but they also Increased the average delay between shocks; it is also possible that the responding was simply shock elicited. Heonsteln and Hlnellne (1966) devised a very clever procedure in which shocks occurred randomly in time so that the rat could not use any exteroceptive or Internal temporal cue to guide his responding. After each short shock, a response could reduce the probability


15 of the next shock from 0.3 to 0.1 per 2 sec. This reduced probability of shock was in effect until the next shock, at which time the higher probability of shock was again programmed. Responses between shocks were not effective in reducing the probability of shock. After extended training, Bernstein and Hineline found stable responding in 17 of 18 animals placed on the procedure. They therefore contended that their results showed that reduction in shock frequency was sufficient to maintain avoidance behavior and that neither internal nor external CS termination was necessary. Henastein and Hineline 's procedure again confounded two other variables with shock frequency reduction. First, responses increased the delay of shock. Without responding, shocks were programmed to occur every 6.7 sec on the average. With responding, shocks were programmed to occur every 20 sec on the average. Second, all re- -sponses may have been shock elicited. Hutchinson, Renfrew and Young (1971) and Hake and Campbell (1972) have reported that animals will respond to shock onset without any avoidance contingency. Hineline (1970), realizing the possible importance of delay as a source of reinforcement in avoidance procedures, ran three experiments that bear directly on the position that delay may be the sufficient condition for avoidance behavior. The procedure in his Experiment 1 enabled a response to delay a shock without changing the overall shock frequency. At the beginning of each 20-sec cycle, a loud buzzer was Initiated and a retractable bar was quickly extended into the chamber. If a response on the bar did not occur, a shock was delivered at Sec 8; 2 sec later the bar was retracted and the buzzer

16 6 terminated. If a response did occur the bar was quickly retracted, the noise terminated, and the shock delayed until Sec 18 of the cycle. Hineline found quite stable responding from the three rats placed on the procedure even though responses served only to delay the onset of shock from Sec 8 to Sec 18 of the cycle and had no effect on the frequency of shocks delivered per cycle. In his second experiment responses delayed shock, but also increased shock density. Specifically, if no response was made, the procedure was identical to that used in his Experiment 1 with a new cycle initiating every 20 sec. If the animal did respond, the bar retracted and the shock was delivered 8 sec after the response. Two sec after the shock, the bar was extended again into the chamber. A response, therefore, produced both a delay of 8 sec and a short cycle. These shorter cycles served to increase the frequency of shocks the animal received in a session. Hineline found that his subjects responded initially and then stopped responding. He argued that responding failed to be maintained in this experiment because it produced an increase in shock frequency. Hineline' 8 discrete trial procedure is by far the best procedure that has been developed for the study of avoidance behavior. It allows one to control for and/or manipulate each of the five possible controlling variables which may account for avoidance responding. This type of procedure also allows one to specify what delay the animal is maximizing, if in fact the animal is maximizing some delay. This brings our attention to the major problems in Hineline's (1970) experiments which this research will study.


17 7 First, in Experiment 1 it is difficult to evaluate the importance of the delay between the response and shock because of the fact that the duration of this delay was variable. Since the response-delayed shock was always given at Sec 18 of the cycle, the duration of the delay could vary from a maximum of 18 sec to a minimum of 10 sec. Second, responding in Experiment 1 may have been maintained by the termination of an external warning signal, e.g., retraction of the lever, or by the termination of internal conditioned aversive temporal stimuli. In Hineline's procedures, response-produced delay of shock was always confounded with the termination of possible internal conditioned aversive temporal stimuli. According to Anger (1963), rats will make long latency responses because responding just before shock will lead to the greatest reduction in conditioned aversiveness. Third, responding in Experiment 2 may have ceased because the response-produced delay of shock was reduced to 8 sec and not because the shock density increased as Hineline suggested. Several questions arise from these problems. First, is the rat sensitive to the delay of shock? And if so, will it respond to maximize that delay? Second, is the delay between response and shock (R-S delay) more important than the delay between the onset of the trial and shock (0-S)? This might be determined by seeing which delay the animal maximizes. Third, will an animal respond merely to terminate the stimulus compound of bar retraction and noise offset? The results of Bolles, Stokes and Younger (1966) would suggest not. And fourth, will an animal respond to terminate the conditioned aversive


18 8 temporal stimuli associated with the time period just before shock? The present research attempted to answer these questions by using a retractable lever procedure similar to that of Hineline. For the experimental groups a response on a cycle changed only the location of the shock on that cycle, but did not change the frequency of shock. The procedure also minimized the effect of shock elicited responding, because responses immediately after shock, when the bar was extended, had no effect on the location of the next shock and because responsedelayed shocks occurred when the bar was retracted and not available. These shocks always occurred at least 2 sec before the next cycle in which the bar was reinserted. Experiment 1 Five different groups were run. The delay produced by responding will be defined in terms of the R-S delay. In the three experimental groups each response delayed the onset of the shock for some specific length of time. In the first group the length of the delay or length of the R-S interval was independent of the response latency and was a constant 19 sec from the response. The second group received a procedure in which the shorter the response latency from the onset of the retractable bar, the longer the delay until shock. A third group received a procedure in which the longer the response latency, the longer the delay until shock. Two control groups were run. In one of the control groups, each response terminated the warning signal and retracted the lever but did not change the location of shock. This control was included in the


19 study to determine if responding would be maintained by warning-signal termination. In the other control group each response functioned to avoid the shock on that cycle as well as to terminate the warning signal and retract the bar. This second group was Included for purposes of comparing the different response latencies and response stabilities produced by these avoidance animals and the delay-ofshock animals. Subjects Method The subjects were 31 naive albino rats days old at the start of experimentation. Nine were males which were acquired from the Animal Research Center of Massachusetts, Inc., New Braintree, Massachusetts. Twenty-two were females which were acquired from the Holtzman Company, Madison, Wisconsin. All subjects were given at least a week to adapt to the colony and were frequently handled before the experiment. During the course of the experiment, they always had free access to food and water in their home cages but neither food nor water was available in the experimental chambers. Apparatus Two Gerbrand Model B operant conditioning chambers with leftside dipper feeders were housed in ventilated sound -attenuated enclosures. One enclosure was a 0.62-m cube made of 12-7-mm plywood lined with acoustical tile. The other was 0.75-m long, 0.52-m high and 0.62-m wide and was lined with 5 cm styrofoam. The front wall of the chamber containing the Standard Gerbrands
 was located on the right side wall of each chamber 8 cm from the grid floor and centered in the middle of the wall 6.")

20 10 box and dipper receptable was covered with a piece of tin that fully extended to the sides and top and bottom of the chamber. A cue light was placed 6 cm above the retractable lever. A Lehigh Valley retractable bar (Model 1A05M) was located on the right side wall of each chamber 8 cm from the grid floor and centered in the middle of the wall 6.5 cm from the back wall of the chamber. The lever in each chamber was modified so that the time for full extension to occur was reduced. The 15-rpm AC motor which moved the lever in and out was replaced with a 75-rpm DC Barber -Coleman motor. The cam connected to the lever was modified to accommodate the faster motor. The duration of the extension or retraction of the lever was reduced from 1.9 sec with the 15-rpm motor to 0.5 sec with the 75-rpm motor. Hineline (1970) also used a very fast lever to eliminate the opportunity of more than one response per cycle. White noise of 87-dB was begun when the bar was extended into the chamber and terminated when the bar was retracted. The speaker was located on the left side wall, that is, the wall opposite the lever. Scrambled shocks of 0.8-ma intensity were provided by two Grason Stadler shock sources (Model E1064GS). A Lehigh Valley Interact Computer System in a near-by room controlled all of the events and recorded all responses made in the experimental chambers. Procedure Preliminary Training. Two phases of preliminary training were run to enable the subjects to develop stable discrete trial bar pressing. During the first phase, which continued for two 2-hour sessions.


21 11 all subjects were placed in a discrete-trial avoidance procedure. Bar extension and white noise initiated each session. If a response did not occur within 10 sec, a.5 sec, 0.8-ina shock was delivered to the grid floor every 3 sec until a bar press occurred. When a response occurred the bar retracted, the white noise was terminated, and all remaining shocks were avoided until the next trial which began 21 sec after the response. The second phase immediately followed the first and continued for three consecutive sessions. Four of the five groups were placed on the Constant Delay procedure diagrammed in Figure 1, panel CD. Each session was divided into sec cycles. At the beginning of each cycle the bar was extended into the chamber and the white noise turned on. If a response did not occur within 10 sec, a.5-sec,.8^ma shock was delivered In the 10th sec, and the bar was retracted at the 11th sec. If a response did occur, the bar retracted, the white noise terminated, and the shock was delayed for 19 sec from the response. Subjects always received one shock per cycle, but the response delayed the shock from Sec 10 to a point between Sec 19 and Sec 29 of the cycle. The fifth group was placed on a discrete trial avoidance procedure in which only one shock was given per cycle if no response occurred. The procedure is diagrammed in Figure 1, panel DTA. A bar press retracted the bar, terminated the noise, and avoided, the shock programmed for that cycle. Group DTA received this procedure for the duration of the study.
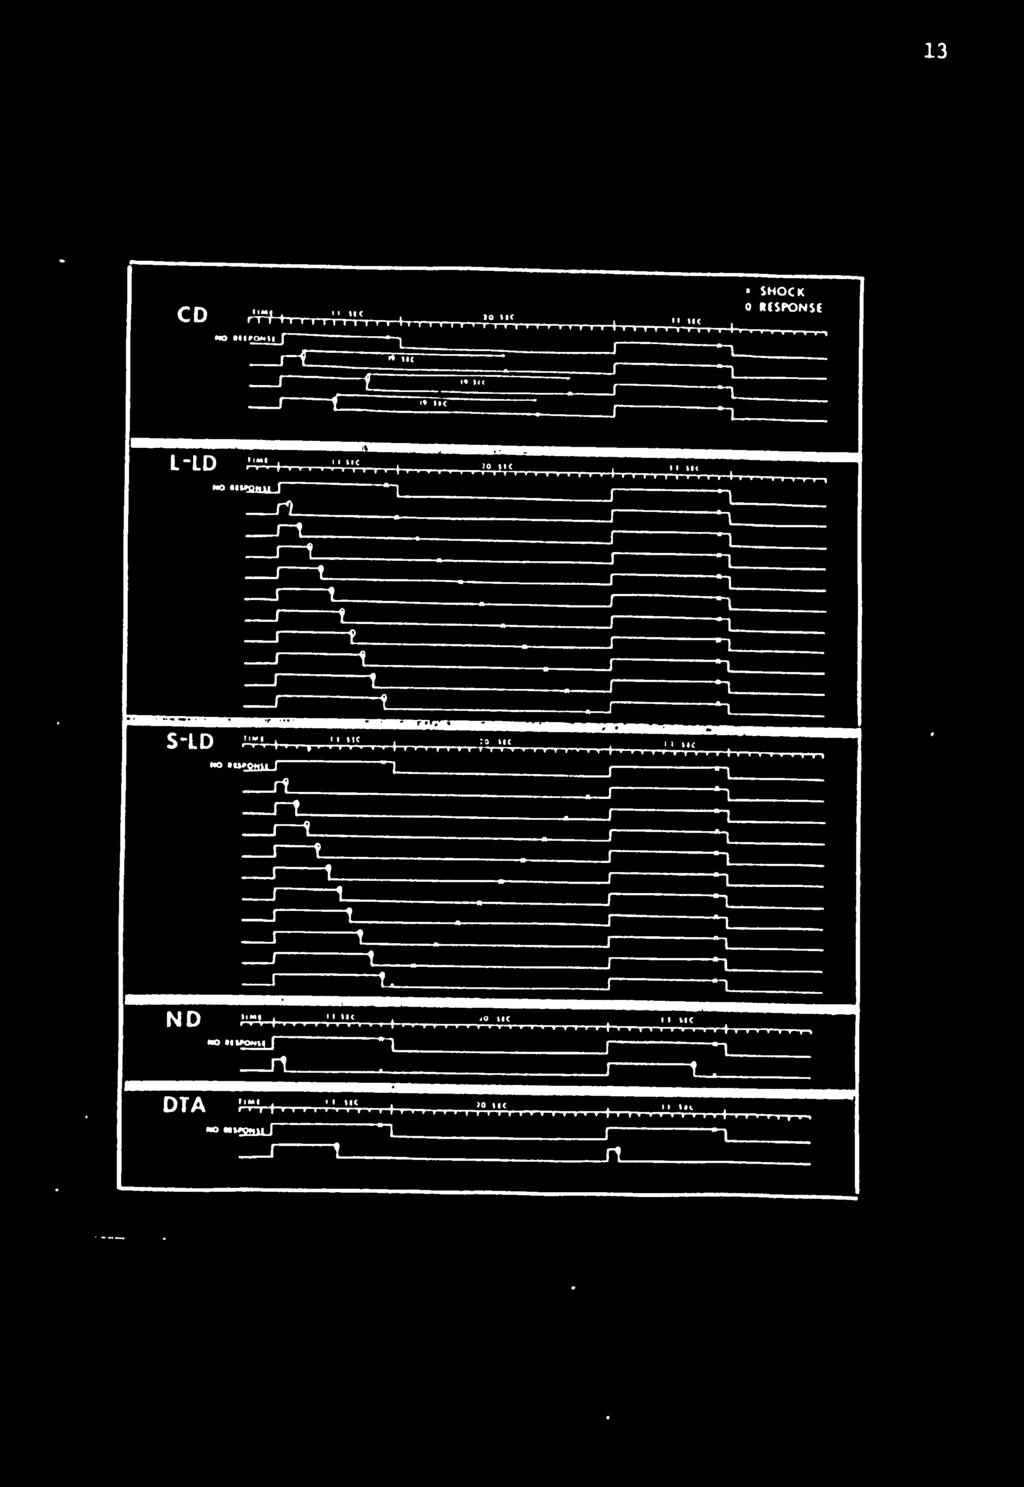
22 12 Figure 1 Schema for the procedures in Experiment 1. Upward displacement of a line indicates insertion of the lever and onset of the white noise. Downward displacement indicates retraction of the lever and offset of the white noise. The cycle length in each condition was 31 sec long.
23 13


24 14 Since the purpose of the study was to determine whether response latencies were sensitive to the duration of the delay of shock, only those subjects that were responding on more than 50% of the cycles during the last session of phase 2 of preliminary training were used in the main part of the study. Delay Training. After preliminary training, the four delay-ofshock groups continued to receive sec cycles with one shock per cycle. However, the groups differed with respect to how long a given response would delay shock. The Constant Delay (CD) Group continued to receive the same procedure it received during the second phase of preliminary training, i.e., each response delayed the shock for 19 sec after the response. The Short-Latency-Long-Delay (S-LD) Group received a procedure outlined in Figure 1, panel S-LD. A short response latency delayed shock for a longer duration than a long one did. For example, a response latency of 1 sec delayed shock for 28 sec, while a latency of 8 sec delayed shock for only 4 sec. The Long-Latency-Long-Delay (L-LD) Group received a procedure outlined in Figure 1, panel L-LD. In this procedure a long response latency delayed shock for a longer duration than a short one did. For example, a response with a latency of 1 sec delayed shock for only 10 sec while a response with a latency of 8 sec delayed shock for 17 sec. The No-Delay (ND) Group, diagrammed in Figure 1, panel ND, was a control group in which a response did not delay shock but served only to terminate the white noise and retract the lever. Shocks were always delivered at Sec 10. After preliminary training, any animal that responded on less than

25 15 10% of the cycles for 5 consecutive days was dropped from the study. The delay training was continued for 20 days for the remaining animals, and the entire procedure was replicated two additional times so that a total of six animals was run in each of the five conditions. Table 1 shows four possible response schemes the animals might use to determine their response latencies. The entries in the table predict for each response scheme what the average response latency should be under each of the five different experimental procedures. A "short latency" might be one less than 2 sec, and a "long latency" might be one greater than 2 sec. A "variable latency" prediction might indicate that different animals would choose different latencies and also that the particular response scheme really makes no a priori prediction about the average latency. A "no-response" entry indicates that animals placed on a given procedure should stop responding. Results and Discussion Preliminary Training Phase 1, Discrete Trial Avoidance. Table 2 shows the response rate per minute and shock rate per min for each animal in the study on the second day of the discrete trial avoidance procedure. Most of the animals emitted about 2.5 responses per min with most of these responses occurring within the first 2-3 sec of bar extension. Since animals could respond only after the 21-sec R-S interval when the bar was again extended, the absolute maximum response rate was 2.85 responses per min. The actual response rates were very close to the maximum, reflecting short latencies.
 Interval long short long no resp.")
26 16 Table 1 Average Latency Predictions For Each Condition Schemes Maximize Response-Shock Interval (R-S) Groups CD S-LD L-LD ND DTA variable short long no resp. variable CS onset and shock (0-S) Interval long short long no resp. variable Terminate: CS onset short short short short short Conditioned Aversive Temporal Stimuli long long long no resp. long


27 17 Table 2 Response Rate and Shock Rate Per Minute for Session Two of Discrete Trial Avoidance Preliminary Training Animal Response Rate Shock Rate Nl N2 N3 N Al A2 A3 A4 36 CI C2 C3 C LI L2 L3 L m.d m. d m.d m.d A r\i Fl F2 SI S2 S3 S m.d. A printer malfunction led to the loss of part of the data for these two animals on the second day of phase 1.
.")

28 18 Shock rates also reflected good avoidance behavior. The overall average was about 1 shock every four minutes. Most of these shocks were delivered in the early portion of the avoidance session during a warmup period (see Hoffman, 1966). Every animal was responding consistently to avoid shock by the second day of avoidance pretraining. Phase 2, Constant Delay Training, Four of the five groups received three days of constant delay training, i.e., each response produced a constant R-S delay of 19 sec until shock. The fifth group, Group DTA, was continued on a Discrete Trial Avoidance procedure that delivered only one shock per cycle if no response occurred (Figure 1, panel DTA). Of the 31 subjects that received constant delay training, 28 met the 50% criterion on the third day. The three animals that did not meet the criterion responded on 0,0 and 48% of the cycles on the third day. Of those animals that did meet the criterion, one animal responded in the 50% range, one in the 70% range, three in the 80% range and the remainder in the 90% range. Their average latencies ranged from 0.02 to 5.20 sec. Experimental Treatments On the day following preliminary training, the DTA Group continued to receive the discrete trial avoidance procedure. The remaining animals that had met the 50% criterion on the third day of CD preliminary training were assigned to groups in such a way that after the three replications there would be five or six subjects in each group.

29 19 Table 3 shows the sequence of procedures for each animal in the experiment. Constant Delay Condition. In this treatment, a high percentage of responses were predicted and Table 1 shows there were three possible average latency predictions. The left panel of Figure 2 shows the percent response plotted as a function of days for each animal. The solid lines are plots of all responses before and after shock. However, only response latencies less than 10 sec produced a delay of shock. The dotted lines on the figure plot the percent responses before shock. Responding occurred on approximately 100% of the cycles for three animals. Very few of these responses occurred after shock. The response rate of C2 and C4, plotted on the bottom of the figure, decreased over days. During each successive session these two subjects did not begin responding until later and later in the session, but by the last 30 cycles both usually responded on at least 90% of the cycles. After day 15 C2 did not respond on more than 67% of the cycles during any 30-cycle block; however, the highest percent always occurred during the last block. The average response latencies for each animal are plotted in the right panel of Figure 2. Remember that every response latency less than 10 sec produced a 19-8ec delay until shock. A response latency after shock did not affect the location of shock. It only terminated white noise and retracted the lever. Response latencies varied greatly between subjects, but each subject displayed a fairly consistent average latency over days. Three animals had average latencies greater than 4 sec and two had average latencies less than 2 sec.


30 20 Table 3 Sequence of Procedures for Each Animal in Experiment 1 Preliminary Training Group Animal Avoidance Constant Experimental D@l av ireatment N D * ** Nl N N N4 2 3 DTA Al A A A C D CI C C C L-LD LI L L L S-LD * * 0 Fl F ** SI S S S4*** * These animals were terminated from the study after the third day of CD preliminary training because their response probability was less than 50%. ** These animals were terminated from the study after they responded on less than 10% of the cycles on 5 consecutive days.

31 21 Table 3 (cont'd) *** This subject met the criterion for being dropped from the study after 9 days on the S-LD procedure; however, it was then placed on the L-LD procedure for 4 sessions and on the DTA procedure for 8 sessions. Animals designated by a two digit number were males. Animals designated by a letter and a number were females.
32 22 Figure 2 The percent response and average latencies for five animals in the Constant-Delay condition. The data plotted to the left of the vertical dotted lines are from the three sessions of Constant-Delay Preliminary Training. Solid lines connecting solid circles plot all responses. Dotted lines connecting open circles plot responses made before shock.
 m 0 100 50 0 C4 I v.")
33 j CD CI / 2 n RESPONSE! C3 o o o 100 Z t:j 50 ec Ui 0 36 ^^>;! V ^J->«10 oo > < 10 m 8 6 > O 4 m 2 0 LA 10 m -H Z a 6 n 4 -< 2 </) m C4 I v S» IS 30 S 10 IS 20 SESSIONS #
 is the probability of a given latency conditional on the number of times at least that latency is reached.")
.")
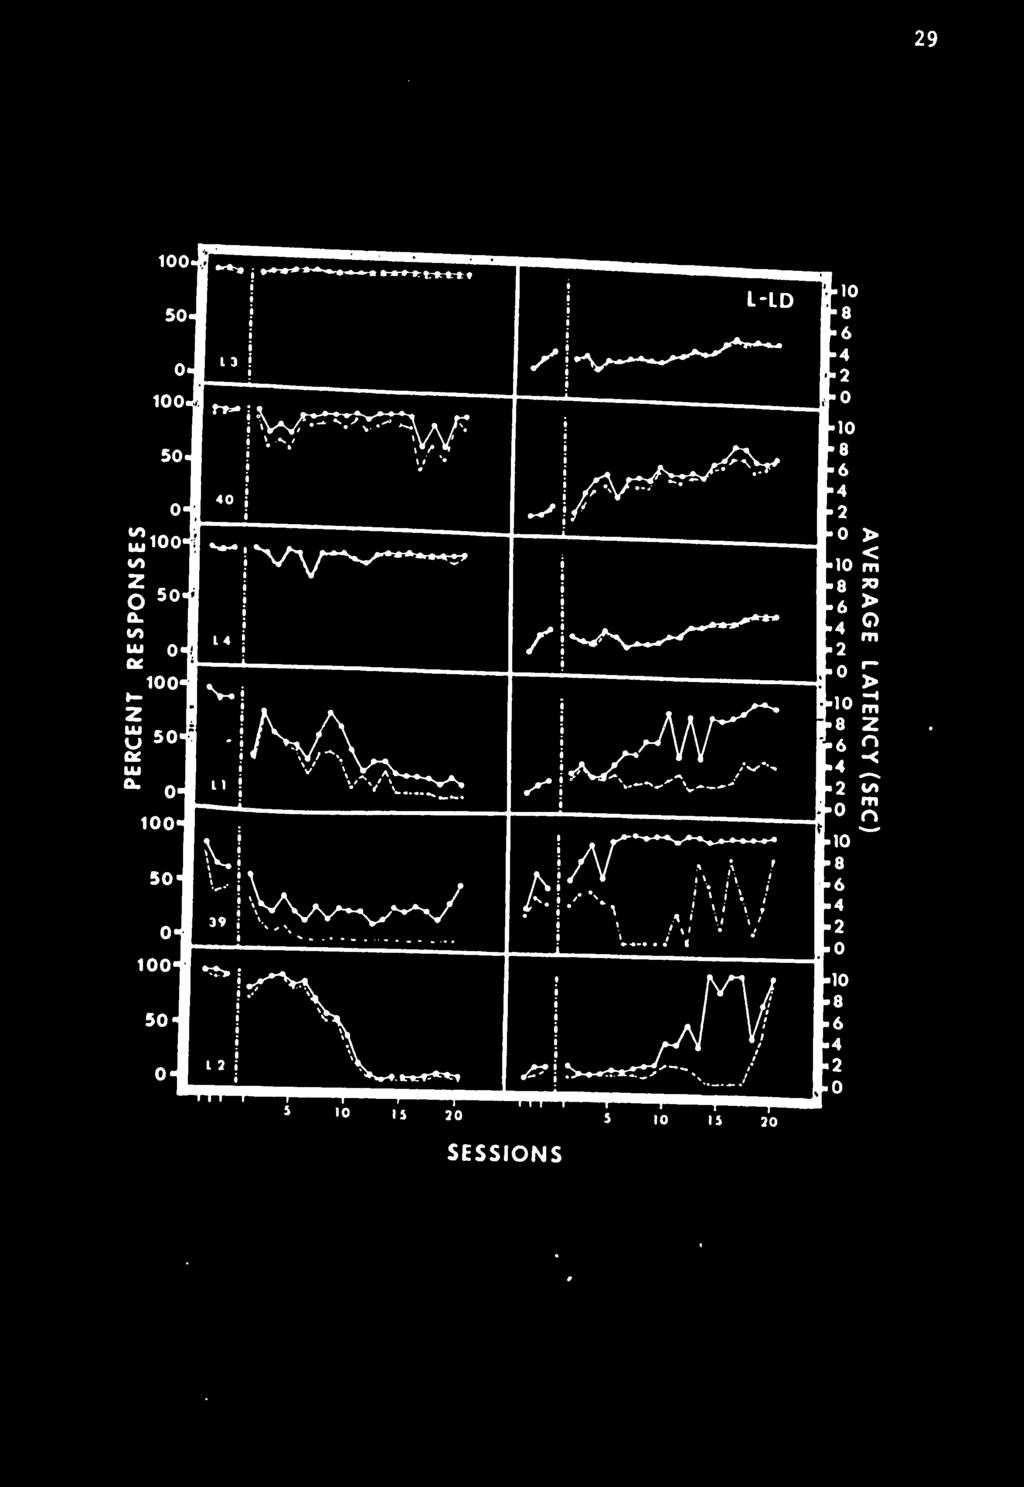
34 24 The latency-distribution data for Day 15 are plotted in Figure 3. The data are plotted in terms of two measures. The dotted line represents the conditional probabilities of any given latency. This measure (LA/OP) is the probability of a given latency conditional on the number of times at least that latency is reached. The solid line connecting the circles represents the relative frequencies of any given latency. The former measure is analogous to "interresponse times per opportunity" in free operant situations (see Anger, 1963). The figure shows that subjects varied greatly in terms of their latency distributions. For those subjects who responded on more than 94% of the cycles, conditional probabilities showed a distinct rise near the middle of the interval. Hineline (1970) also reported a similar rise from the delay procedures he used. However, Hineline also reported a steep descent from the peak just before shock. Figure 3 shows that this was not always the case for these animals. Long-Latency-Long-Delay Condition. In this treatment long latencies produced longer delays of shock than short latencies did. In accordance with Hineline 's results, consistent responding was expected; and, unique to this procedure, long latencies were generally predicted (see Table 1). The left panel of Figure 4 shows the percent responses for each of the six subjects. Only three of the six maintained a high response probability during the 20 days of the treatment. The poor responders did not show increasingly longer periods of warm-up as did the poor responders in the CD condition. For example, L2, a poor responder, usually made fewer responses during the last 30-cycle block than it
. On the L-LD procedure this latency produced a delay of 11 sec, only 1 sec more delay than if no response had occurred.")
35 did during earlier blocks. The right panel of Figure 4 shows the average latencies for each subject plotted over sessions. Rat L2, a poor responder. initially made very short latencies (approximately 1 sec). On the L-LD procedure this latency produced a delay of 11 sec, only 1 sec more delay than if no response had occurred. This short delay might account for the within-session and between-session response decrement. There was some warm-up for Rats 39 and LI but it was minimal. Notice that the three rats that stopped responding before shock responded after shock to a much greater extent than did those rats that maintained a high response probability. This can be seen by comparing the before shock response, represented by the dotted line in Figure 4, and the total response curve, represented by the solid line. This observation also is evident in the latency distribution data in Figure 5. The poor responders placed over 70% of their responses after shock while the high responders placed less than 10% after shock. The high responders all showed a gradual increasing LA/OP curve and a small decrease after the peak just before shock. The peak was between 8 and 9 sec for all three of the responders. The LA/OP curve increased after shock, which shows that if the subjects did not respond before shock, they took every opportunity to respond after shock. This finding is again in disagreement with Hineline's results. He found a decreased LA/OP curve after shock for his subjects, even though subjects had 2 sec after shock in which to respond
36 26 Figure 3 The latency distributions for the five animals In the Constant-Delay condition on Day 15 of the treatment. The vertical solid line at Sec 10 delineates the location of shock if no response occurred. The percent response for each animal on Day 15 Is found under the animal number.


37 27. o4 LOO 44% 5.40 CD o at a. J20H t.60 < to.40h O oc a. I 'I I I I III SEC. li^i i I I SEC. LOO 98% V.60 f m O at '^.2o^ SEC. LOOn 100%.80 < m.20l rviv SEC.
38 28 Figure 4 The percent response and average latencies for six animals In the Long-Latency-Long- Delay condition. The data plotted to the left of the vertical dotted lines are from the three sessions of the Constant-Delay Preliminary Training. Solid lines connecting solid circles plot all responses. Dotted lines connecting open circles plot responses made before shock.
39 # 29
40 30 Figure 5 The latency distributions for the six anin^ls in the Long-Latency-Long-Delay condition on Day 15 of the treatment. The vertical solid line depicts the location of shock if no response occurred. The percent response for each animal on Day 15 is located under the animal number.

41 ' % % :.60 CO O ec O-.20- ^.40- a..20-i I I I I 'l" 8 f ",ll SEC. ^ I I I I I I I / I SEC. 1.00^ l-^ 31% 2% ^.60- >:.60- CD O o. ec '^ SEC. ijoo-i rrr,"i"i"i"i*r SEC. L4 98% Relative Frequency LA/O 5*0 O - JBO- > A SEC.
42 32 Figure 6 The percent response and average latencies for six animals in the Short-Latency-Long-Delay condition. The data plotted to the left of the vertical dotted lines are from the three sessions of the Constant-Delay Preliminary Training. Solid lines connecting solid circles plot all responses. Dotted lines connecting open circles plot responses made before shock.


43 33

44 34 The average response latencies before shock for responders reached asympote consistently at a value between A-5 sec. This specific latency with this procedure produced a delay of 15 sec between response and shock and 20 sec between the beginning of the cycle and shock. The average response latency for poor responders was close to 10 sec. Short-Latency-Long-Delay Condition. In this treatment, short latencies produced longer R-S delays of shock than did long latencies. Consistently high response probability was expected and unique to this procedure, short latencies were generally predicted (see Table 1). The left panel of Figure 6 shows the percent responses for each of the six subjects In the condition. Three animals maintained a very high response probability. Of these three subjects, SI and S3 had average latencies less than 2 sec which are shown in the right panel. This specific latency produced a shock delay of 24 sec from the onset of the cycle and 22 sec from the response (see Figure 1). The third animal that maintained responding, Fl, had an asymptotic average latency between 3 and 4 sec. This latency produced a delay of 19 sec after the response. This was the same delay that the CD animals always received after a response and that this animal had received under the CD condition during preliminary training. The three poor and the three good responders responded differently on the first session of the S-LD procedure. The poor responders Initially made long latency responses that produced short delays of shock while the good responders initially made short latency responses which produced long delays. This difference can be seen by looking

45 35 at the median delay produced by the first ten responses made by each subject on the first session of the S-LD procedure. The three good responders, Fl, SI, and S3, responded to produce a median R-S delay of 22, 28, and 28 sec respectively. The three poor responders, S2, SA, and F2, responded to produce a median R-S delay of 1A.5, 13, and 28 sec respectively. F2, which responded initially to produce a 28-sec delay, maintained a near perfect response probability until Day 4 of the S-LD procedure at which time it almost stopped responding. On this day the median delay produced by its first ten responses was 5.5 sec. This short delay reflected the fact that most of its latencies were very long. One might conjecture that an animal would continue to respond if its initial responses produced long delays and that an animal would cease responding if its initial responses produced short delays. However, since the poor responders initially had long latencies, it can not be determined if the controlling factor leading these animals not to respond was the latency of the response or the duration of the delay of shock. When the poor responders stopped responding they also shifted their few responses from before shock to after shock. Good responders seldom responded after shock. For instance, S2 stopped responding before shock on the second day of the procedure and shifted its response latency almost exclusively after shock. This change in response latency was accompanied by an increase in response probability up to 85%. Rat S2 was the only animal in the experiment that changed Its response strategy after extended exposure to a condition. Usually


46 36 after the first few days on a procedure, it was possible to predict the general asymptotic behavior of each animal. S4 also quickly stopped responding when placed on the S-LD procedure. It was terminated from the condition when it had met the termination criterion of five consecutive days of a response probability of less than 10%. SA was then placed on the L-LD procedure for four sessions, but it still did not respond. Finally it was placed on the DTA procedure and its response probability quickly recovered and its average latencies decreased. Shock delay appeared not to be sufficient. The latency distribution data for the S-LD condition was plotted in Figure 7. It can be seen that the good responders placed over 95% of their responses before shock while the two poor responders placed 60% of their responses before shock. The remaining 40% of their responses occurred in the 1 sec after shock while the lever was still available. The plots of the S-LD responders are very different from the plots of the L-LD responders. The S-LD peaks occurred much earlier. In fact the LA/OP curves and relative frequencies curves show peaks between 0 and 1 sec for rats SI and S3. The two poor responders who had not been terminated by Day 15 had their peak LA/OP curves between 10 and 11 sec, i.e., after shock. Again, as in the other conditions, poor responders responded mainly after shock. Analysis of Poor Responders Approximately half of the animals that were placed on the delay procedures failed to maintain responding. A careful analysis of their latency data during the two phases of preliminary training was made to determine if the poor reeponder could be identified at a point

47 37 before the different delay procedures were begun. Several measures were studied to determine if poor and good responders could be discriminated. During the first session of the Discrete Trial Avoidance preliminary training, it was not possible to separate the asymptotic good responders from the asymptotic poor responders. For example, the median number of avoidances was 240 for the poor responders and 2A2 for the good responders. The median number of shocks received was 70 for the poor responders and 75 for the good responders. The median latency for the first ten trials was sec for the poor responders and sec for the good responders. The differences between the medians did not approach significance in any of the comparisons. On Day 2 of the Discrete Trial Avoidance preliminary training, these measures again did not differentiate the good and poor responders. A difference did appear, however, between these two types of responders during the second phase of preliminary training, the Constant Delay training. In short, those animals that became poor responders took more trials to begin responding than did the good responders. This was observed on each of the three days of CD training and on the first day of the experimental-delay training. Table 4 shows the number of trials each animal received until it made at least two responses. The second and not the first response was used as a cut off because occasionally animals would accidently hit the lever on the very first trial but would not begin to consistently respond until much later. Comparisons of the means at the bottom of each column show that the good responders on the average, started

 condition in which responding, maintained during the CD preliminary training, was expected to extinguish. Discrete Trial Avoidance Condition (DTA).")
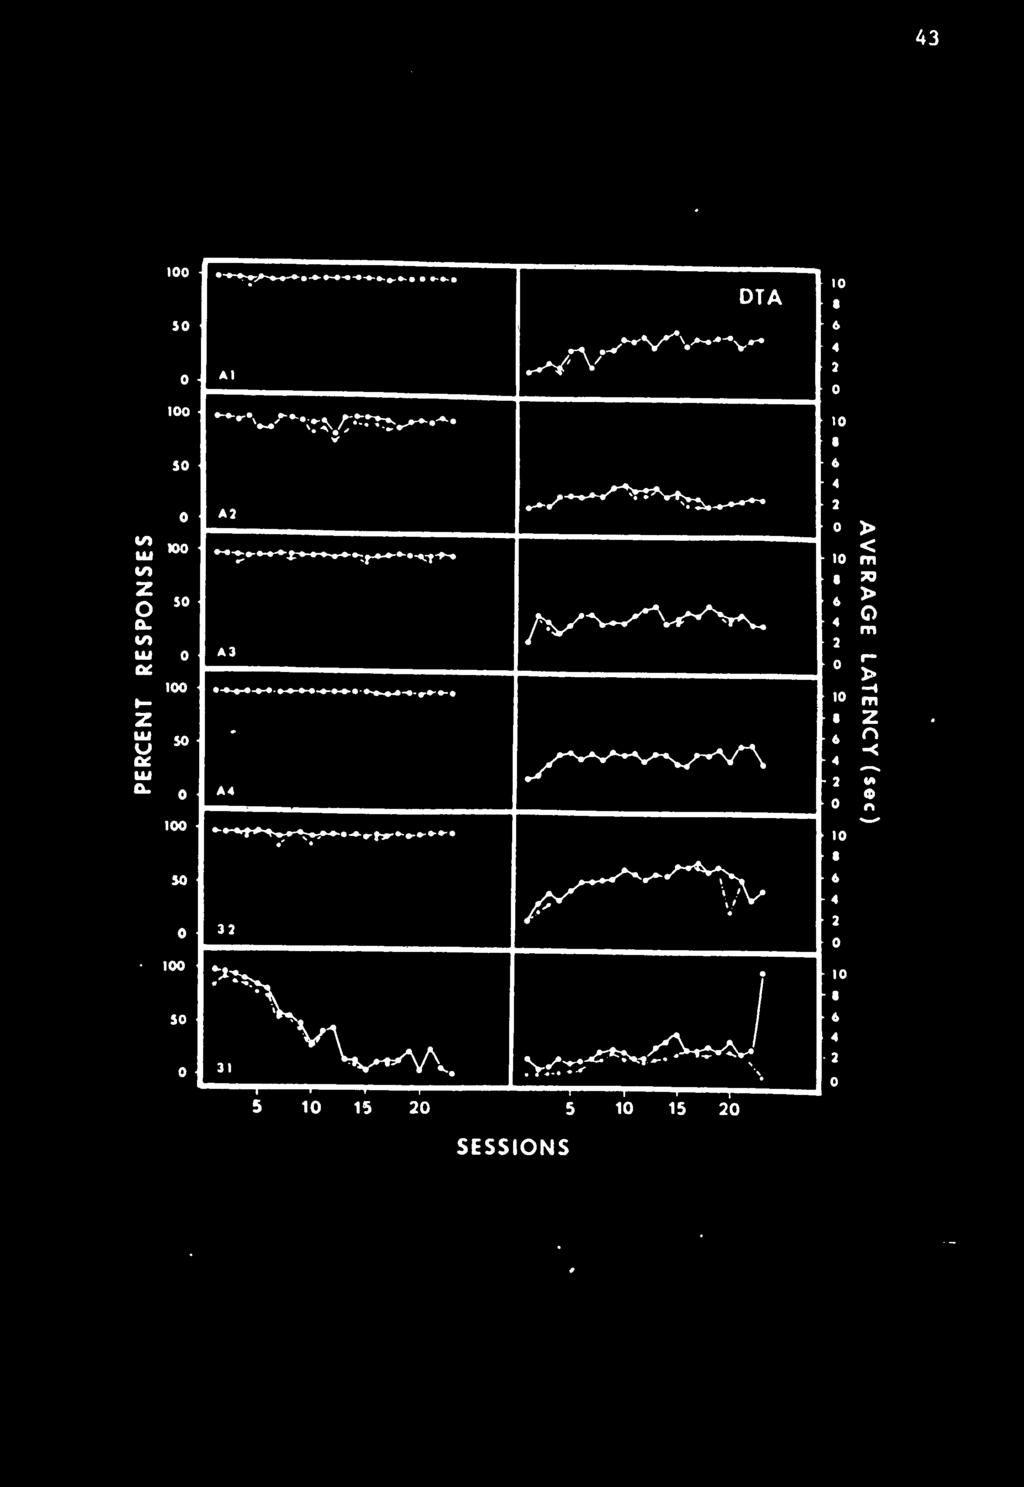
48 38 responding much sooner than the poor responders did. The t-values and two-tailed probabilities associated with each t-value can also be found at the bottom of the table. Control Conditions The two remaining conditions were designed to be control treatments. The first was a discrete trial avoidance condition (DTA) Since responses produced shock avoidance in this condition, a high response probability was expected. The second condition was a No-Delay (ND) condition in which responding, maintained during the CD preliminary training, was expected to extinguish. Discrete Trial Avoidance Condition (DTA). Figure 8 shows that five of the six animals placed on the DTA procedure responded on approxljnately 100% of the cycles on each of the 23 treatment days. The one rat that did not respond, Rat 31, was a male and showed a great deal of day to day and within-a-day variability. Extended warm-up was not a factor because this rat would often respond on 20 consecutive trials and then fail to respond on the next 30. Average latencies, shown in the right panel of Figure 8, were consistent within subjects over days and varied among subjects between 2 and 5 sec. When four of these animals were placed on a conventional extinction procedure of removing the shock, their response probabilities quickly decreased. This demonstrated that the white noise and bar extension were probably not unconditioned aversive stimuli and that this termination was not sufficient to maintain respond Ing.

 0.26 0. 23 0.06 0.05 95.6 19 A 30 7 85 7 26 A6 28.0 7.36.")
49 39 Table 4 The Number of Trials before each Subject made its Second Response during the Constant Delay Preliminarv Tr Jn^ and the first Session of the Exper^m^^taf S:LV^re:t:Lt Type of Responder CD Preliminary Training Experimental Delay Asymptotic * Percent Response Days Good L3 L4 40 Fl SI S3 C3 CI A Means ,AA O.AA 0.89 Poor LI L A A3 27 F S S C C Means t -values A 2. OA 2.1A Probabilities (2-tailed) A A The asymptotic percent response was found by taking the median percent response for the last five days of the experimental treatment for each subject.
50 40 Figure 7 The latency distributions for six animals in the Short-Latency-Long-Delay condition on Day 15 of the treatment. The vertical line at Sec 10 depicts the location of shock if no response occurred. The percent response for each animal on Day 15 is located under the animal number.


51 looi SI 98«lOOi S2 68«JBO t -60 <, O ec a. JO to Ol.20 A /"V '?>nrn:: I I I I I SEC ' SeI «' IDOi S3 97* 100 S4 2» 4KX.80 s ^ 40 S A \ CO O * \ \ 1 inii^fi;a,at^ir^ n SEC..20 A SEC. lool 80 F1 98X #^--«la/o R«lativ«Fr«qu«ncy i
52 ^2 Figure 8 The percent response and average latencies for six animals In the Dlscrete-Tr lal-avoldance condition. Solid lines connecting solid circles plot all responses. Dotted lines connecting open circles plot responses made before shock.
53 43
54 44 Figure 9 The latency distributions for six animals in the Discrete-Trial-Avoidance condition on Day 15 of the treatment. The vertical line at Sec 10 depicts the location of shock if no response occurred. The percent response for each animal on Day 15 is located under the animal number.

55
56 46 Figure 10 The percent response and average latencies for five animals in the No-Delay condition. The data plotted to the left of the vertical dotted lines are from the three sessions of the Constant-Delay Preliminary Training. Solid lines connecting solid circles plot all responses. Dotted lines connecting open circles plot responses made before shock.

57 SESSIONS A7

58 48 Most of the responders showed typical avoidance timing with long latencies (see Figure 9). The relative frequency curves for Rats 32, A3, and A4 peaked at 5-6 sec and the LA/ OP curves increased throughout the 11 sec interval with a slight drop just before shock. A2, which had the shortest average latency (see Figure 8) placed most of its responses during the first 2 sec of the white noise signal. The relative frequency and LA/ OP curves both peaked very early for this animal. It should be mentioned that the good responders seldom placed their responses after shock. No-Delay Condition (ND). The second control treatment was expected to extinguish responding. Decreased responding was expected because responses had no effect on the location of shock. Responses merely terminated the white noise and retracted the lever. As Figure 10 shows, only two of the five animals placed on the condition decreased their responding. The other three rats consistently responded on more than 80% of the cycles during each of the 20 sessions. Rat Nl responded almost exclusively after shock. Rat N3 responded on approximately 30% of the cycles before shock with an average latency of 8 sec and responded on 50% of the cycles after shock. Rat N2 responded on 70% of the cycles before shock and 20% of the cycles after shock. During a session, N2 would respond after shock during the first part of the session and then respond before shock on the later part of the session. For Instance, on Day 15, its average latency during the first 30-cycle block was 5.14 and during the last 30-cycle block its average latency was Latency-distribution data plotted in Figure 11 reflects this predominance of post-shock responding except for Rat N2


59 who also responded a great deal very early in the cycle. Summary Data Figure 12 summarizes the asymptotic percent response data for each of the five treatments. In graphing the data, each group was divided into two kinds of responders: Those who responded on more than 50% of the cycles and those who responded on fewer than 50%. The ranges for each subdivision of data for each group were plotted and the median for each range was identified with a closed circle (good responders) or an X (poor responders). The plots show that animals responded at the extreme values. For instance in the S-LD condition the four good responders had a range between 85 and 99 percent, while the two poor responders responded on as few as 7 percent of the cycles during the last five days of the treatment. These dichotomous results occurred in every group. Those animals that responded, responded on almost every cycle and those anixaals that were poor responders responded in almost every occasion on much fewer than 50% of the cycles. This observation was less true for the CD Group but remember those two animals that were poor responders had extended warm-up periods, while the poor responders in other groups did not. If the percent response from the later part of each session had been plotted instead of the overall percent response, perhaps the data points for the two CD poor responders would have been much closer to 90%. Figure 13 is a summary of the asymptotic average latency data for each of the five treatments. Only animals that responded on at least 50% of the cycles at the end of treatment were included in the
60 50 Figure 11 The latency distributions for four animals in the No-Delay condition on Day 15 of the treatment. The vertical line at Sec 10 depicts the location of shock if no response occurred. The percent response for each animal on Day 15 is located under the animal number.
61 51.80 N1 94% LA/O Relative Frequency too N2 96«.80 >: <.40 o «.40 O.20 1 SECON DS N3 83« N4 ll«5ao- < O « < 2 40i T*>r^«i«ii'i«i/ SECONDS

62 52 Figure 12 The range of percent response for each condition. The solid bars depict the range of percent response for animals that responded on more than 50% of the cycles during the last 5 sessions. The solid circles represent the median percent response. The number of animals in each range are shown in parenthesis. The dotted bars and X's represent the same data for those animals that responded on less than 50% of the cycles during the last 5 sessions.


63 53
64 54 Figure 13 The range of median latencies for each condition for those animals that responded on more than 50% of the cycles during the last 5 sessions. The solid bars represent the range of latencies for the subjects in each condition during the last 5 sessions, and the solid circles represent the medians for each range.
65 (3) 8 r 6- u Z Ui /J. (3) I (3)V (5) a 1 U) 2 1 S-LD L-LD CD OTA N D GR OU PS
. This reflects the large percentage of post-shock responding.")
66 figure. The range of latencies a.ong subjects in each group are shown. 56 The solid Circle on each bar designates the.edian latency for each group over the last five days of training. The ND subjects had the longest latencies (MD ). This reflects the large percentage of post-shock responding. The L-LD subjects had long latencies, and every L-LD subject had longer average latencies than every S-LD subject. The CD subjects displayed the largest range of latencies for delaying shock. The figure also shows that the subjects in Group DTA displayed response latencies which were very similar to those displayed by subjects that could only delay shock. It can be concluded, therefore, that response latencies and response stabilities are similar on avoidance and delay-of-shock procedures. The results of Experiment 1 are best accounted for by the hypothesis that responding is controlled by the duration of the R-S delay, (see Table 1). Animals did not always respond to maximize the CS onset and shock (0-S) interval because this hypothesis falsely predicted that the response latencies from the CD condition would always be long. However, two of the six animals in this condition had very short latencies. The CS termination hypothesis can also be disregarded because first, it falsely predicted that the response latencies would be short for all delay groups and second, it falsely predicted that animals in the ND condition would make short latency responses. These animals mainly responded after the shock. The termination of conditioned aversive temporal stimuli can also be rejected as a hypothesis because it falsely predicted that the latencies for all


67 57 the delay groups would be long. This was not the case because the S-LD subjects had very short latencies. The one hypothesis that Is supported by the data is that responding was controlled by the duration of the R-S delay. Experiment 2 Experiment 1 found that if an animal will respond to delay shock, it will place its responses in such a way as to maximize that delay. Experiment 2 was run to answer two questions: First, could an avoidance-type procedure be devised that would develop responding in the poor responder? Second, could the average latency be changed by a different avoidance procedure? A modified delay-avoidance procedure was used in which certain response latencies delayed shock and other latencies avoided shock; For some animals a short latency of less than 4 seconds avoided shock, and a latency greater than or equal to A seconds merely delayed shock for 19 sec. For other animals the opposite was true. Thus short latencies, less than 4 sec, delayed shock and latencies greater than or equal to 4 sec avoided it. This partial avoidance procedure is similar to one that Sidman (1966) used and termed "interval avoidance." Method Subjects Ten subjects from Experiment 1 were used. They were CI, C2, C3, C4, SI, S2, S3, S4, LI, and L2. They were all responding on at least 10% of the cycles by the end of their training.

 were placed on the late avoidance procedure. Animals that tended to have long latencies in Experiment 1 (i.e., CI, C3.")
68 58 Apparatus The apparatus was the same as used in Experiment 1. Procedure With the partial avoidance or the limited interval avoidance procedure, one of two contingencies occurred. Either short latencies less than A sec avoided shock and long latencies equal to or greater than 4 sec delayed shock for 19 sec. or latencies less than 4 sec merely delayed shock and longer latencies avoided it. All other aspects of the procedure were identical with that used in the Constant Delay condition of Experiment 1. Animals that tended to have short latencies from Experiment 1 (i.e.. SI, S3, C2) were placed on the late avoidance procedure. Animals that tended to have long latencies in Experiment 1 (i.e., CI, C3. S4) were placed on the early avoidance procedure. Animals that had low response probabilities were arbitrarily placed on one of the two procedures. Seven or eight sessions were run, depending upon the animal. Results and Discussion Early Avoidance procedure. Those animals on the early avoidance procedure shortened their average latencies almost immediately and maintained or developed a high response probability. L2 was a typical animal in the condition. As Figure 14 shows, its average latency decreased from near 10 sec to 1 sec and its response probability steadily Increased from 7% to 99%. Late Avoidance procedure. The animals placed on the late avoidance procedure did not change their response rate nor did they change


69 their average response latency. For instance. LI who was a poor responder during Experiment 1 did not change its response probability or its average latency during the partial avoidance procedure. After a long latency which avoided shock, LI would often follow on the next trial with a short latency which only delayed shock. LI would then fail to respond on the next few trials. These results differ from those that Sidman (1966) reported for his limited interval avoidance. He found the best responding in a procedure very similar to the late avoidance procedure in which long response latencies just before shock avoided it. The experimental conditions in his study, however, were quite different. He used a fixed bar, and a cycle length of 15 sec and no ITI. Also short response latencies in his procedure had no effect on the location of shock; while in this procedure they delayed it. From the results of this experiment it appears that animals favor avoidance of shock to delay of shock and that they quickly learn to make the avoidance response if avoidance follows short latencies. Experiment 3 The purpose of this experiment was to see if the No-Delay procedure would eliminate the responding maintained on the partial avoidance schedules. Method Subj ects Subjects C3, C4, S3, and SA from Experiments 1 and 2 were used.
70 60 Figure 14 The percent response and average latencies for two subjects that received either a late or early avoidance treatment. The data plotted to the left of the vertical dotted lines are from the last six sessions of Experiment 1 for each animal. Both animals were in the Long- Latency-Long-Delay condition in Experiment 1.

71 SESSIONS 61


72 62 Apparatus The apparatus was that used in Experiment 1. Procedure After the last day of partial avoidance, subjects were placed on the No-Delay procedure exactly as it was run in Experiment 1. During each session 240 Sl-sec cycles were given. Responses did not effect the location of shock but retracted the lever and terminated the white noise. Subjects were run for 5 days. Results The No-Delay procedure decreased the response probability for three of four rats and increased their average latencies. This increase in average latencies reflected the larger number of responses after shock. Figure 15 shows the effect of the No-Delay procedure on the probability of response and on the average latencies for each of the four animals. The No-Delay procedure may be more effective at eliminating responding after extended exposure to a response-avoidance procedure than after a brief exposure to a response-delay procedure. A parametric study with more animals would varify this point. Experiment 4 During observations of animals placed on the L-LD delay procedure, it was noticed that animals appeared to freeze during the period after the response and before the delayed shock. After the shock the animals again engaged in normal exploratory activity. Perhaps the time interval between the delayed shock and the next lever extension was important. Animals may maximize the U-S delay belter If there Is a


73 relatively long ti e between the shock and the onset of the ne«trial. In Experiment. two animals from the L-LD condition of Experiment 1 who were good responders were placed on 41-sec cycles, each. 10 sec longer than the cycle used In Experiment 1. The extra 10 sec were attached to the end of the cycle after the delayed shock and 10 sec before the onset of the next trial. Method Subjects Two subjects L3 and L4 from the L-LD condition who responded on approximately 100% of the trials of Experiment 1 were used. Apparatus The apparatus was the same as used in Experiment 1. Procedure Procedure was Identical to the L-LD condition of Experiment 1 but the cycle length was 41 sec instead of 31 sec. Latencies produced delays as shown in the panel L-LD in Figure 1, but 10 sec were added to the end of each cycle. Because of the increased cycle length, only 176 cycles were given in each of the 12 sessions. Results The two rats continued to respond on the longer cycles. Also each animal increased its average response latency. Figure 16 shows the relative frequencies for each latency before and after the change in the cycle length. On Day 15 of Experiment 1 the modal relative-
74 64 Figure 15 The percent response and average latencies for four animals that received No-Delay training after receiving either late or early avoidance training. Each section is divided into three panels. The left panel is the data from Experiment 1. The middle panel is the data from Experiment 2. And the right panel is the data from the No-Delay treatment of Experiment 3. The solid lines connecting solid circles plot all responses. Dotted lines connecting open circles plot responses made before shock.


75 65 I ATI A. NO OIIAY to a- 1! > 1 " i L «'4 2». ^A'* A NO OIIAY lati A. NO OIIAY 10 U loo / i C 3 / IA»IY A. NO OflAY 1,! latly A. NO n OIIAY 1 i j r' I > -< m i rv -4 < 1 lati A. i 1 NO DELAY lati A. NO OCIAY -ID 7S 1 1 -a j 6 4 j i \ -2 SES SIONS


76 66 frequencies for both anl^u were between 1 and 3 sec. However, after 9 sessions on the longer cycle length, their odal relatlve-,re<,uencles had shifted to longer latencies between 7 and 9 sec. Discussion The longer cycle lengths allowed the two subjects to n«ke longer response latencies. On the L-LD procedure these longer latencies produced longer R-S delays. Presumably the longer cycles enabled these rats to better maximize the R-S delay. However, it is not known whether the longer cycles produce longer latencies independent of the delay contingencies or whether longer cycles enable subjects to better maximize the R-S delay independent of the duration of the latency. For example, if the latter possibility is correct, the subjects on the S-LD procedure should shorten their latencies on the longer cycles. An experiment should be run comparing the latencies of S-LD and L-LD subjects on long cycles after they have received these same procedures on shorter cycles. This would eliminate the confounding of the two variables of R-S delay and duration of latency. Even though these two variables were confounded, the results of Experiment 4 are still interesting and unpredicted. The period between shock and the next trial was not initially considered to be important but these data show that animals are sensitive to the duration of this interval and that animals will change their behavior when the interval is lengthened. Experiment 5 It was expected in Experiment 1 that a procedure that programmed
77 67 Figure 16 Relative frequencies for L3 and LA on a 31- sec cycle and on a 41-sec cycle, under the Long- Latency-Long-Delay treatment. The data for rbe short cycle is taken from Session 15 of Experiment 1. The data for the long cycle is from the ninth session under the 41-sec cycle.

 l234s67t9k>lt")
78 L L4 t 50- > so CD 2 'OH o LONG CYCLE 30 ^ 20 ^LONG SHORT / CYCLE ' CYCLE ' loll SECONDS 10- A) l234s67t9k>lt SECONDS

79 69 no Shook delay after a response would lead the anl^l to stop responding. The results, however, showed that three of five animals under this condition continued to respond. Experiment 5 att.n>pted to eliminate this responding by titrating the delay of shock after each response, that Is by moving the shock closer to the beginning of the cycle each tl^e the anln^l responded and farther from the beginning of the cycle each time the anlinal failed to respond. Subjects Method Four subjects from Group No-Delay in Experiment 1 who had maintained responding were used. Apparatus Procedure The apparatus was the same that was used in Experiment 1. The procedure was the same as that used in the No-Delay condition in Experiment 1 except that each response latency less than 10 sec, subtracted 0.25 sec from the potential location of shock on the next trial if a response occurred. If the animal did not respond, then 0.25 sec was added to the potential location of shock on the next trial if a response occurred. For example, if a response was made on Trial 1, the shock was delivered at Sec 10. If a response was made on Trial 2, a shock was delivered at Sec However, if no response occurred on Trial 3 and a response occurred on Trial 4, then the shock was again delivered at Sec 10. If the shock delay had been reduced to 1 sec and a response occurred at the fourth sec, then the shock was


80 delivered l»edlately end the potential delay of shock on the next trial aa set at 0.75 sec. Shock could not be progra.ed to occur after Sec 10 or before Sec 0 of the cycle. Reeponaes after shock, that 18, responses between Sec 10 and Sec 11, had no effect on the titration procedure. Two subjects were run for 7 sessions and the Other two were run for 8 sessions. Results The titration procedure did not appreciably change or reduce the overall response probability of the four subjects. However, it did affect the distribution of pre- and post-shock responses for two of the rats as shown in Figure 17. N2, who had responded mainly before shock on the normal No-Delay procedure of Experiment 1, reduced its percentage of responses before shock to near zero. The titration procedure appeared to punish the pre-shock responding for this animal. The opposite results were found for N3. This animal had responded on approximately 25% of the cycles before shock during Experiment 1. During the titration procedure, this animal increased its percentage of before-shock responses to nearly 75%. Since every response before Sec 10 of the cycle decreased the delay of shock on the next trial, N3 was receiving over half of its shocks immediately after responses. During each of the last few sessions, N3 received about 90 shocks immediately after a response. Discussion The reasons for these results are very unclear. For one animal, the titration procedure decreased the probability ol pre-shock


81 71 responding. For another animal It Increased the probability of preshock responding. The pre-shock responder was seen to use the lever as a spring board to vault around the walls of the box when the response-produced shock was being given. This animal had complete control of when the shock would be given, and perhaps this Jumping behavior was an effective "avoidance" response. The No-Delay procedure might be modified so that the lever would retract just before or during shock. This would eliminate the postshock responding and would allow for a better evaluation of the effect of the No-Delay procedure. General Discussion There are several major findings from this research. First, most animals Initially responded to delay shock but only about half of these animals maintained this behavior over a period of days. Those animals that did maintain responding did so at a level that approximated 100%. Those animals that failed to maintain bar pressing usually responded on less than 30% of the cycles. Second, if an animal consistently depressed the bar to delay shock and if the duration of the delay depended on the response latency, then the animal adjusted its latencies to maximize the R-S delay. The data show that the good responders in the Short-Latency- Long-Delay condition all had shorter latencies than the good responders in the Long-Latency-Long-Delay condition. The luodian response latencies did not overlap between the two conditions. Third, if an animal consistently bar pressed to delay shock but its response latencies did not affect the duration of the R-S delay.
82 72 Figure 17 Thte percent response for the No-Delay subjects on a Titration-of -Delay procedure. The data to the left of each vertical dotted line is from Experiment 1. The solid lines, connecting solid circles, plot all responses. The dotted lines connecting open circles, plot response made before shock.


83 NO DELAY TITRATION I I I I N3 N4 I 7>! SESSIONS

84 then the median response latencies wert» vor.^ok^ alcncies were variable among subjects. range of response latencies for the CD condition was larger than for The either the S-LD or L-U) condition. In the CD condition In which every response latency produced 19 sec of R-s delay, the median latencies among subjects varied from approximately 1 sec to approximately 6 sec. a range of 5 sec. However, m the S-LD condition the latencies varied from approximately 0.5 sec to 3.5 sec. a range of only 3 sec; and in the L-LD condition the latencies varied from approximately A sec to 6.5 sec, a range of only 2.5 sec. Fourth, a poor responder usually placed Its few responses during the 1 sec after shock when the lever was still available. This result suggests that responses were shock elicited. Good responders, those that usually responded on almost 100% of the cycles, seldom made responses after shock. When post-shock latencies did occur, they were usually made in the very early portion of the session. Fifth, most of the subjects in the discrete trial avoidance procedure maintained their responding during the training period. Their latencies and response probabilities were very similar to the latencies and response probabilities of the shock-delay animals. Sixth, the No-Delay condition was not consistently effective in eliminating responding. Two animals stopped responding. Three did not. These three animals responded on more than 80% of the cycles; however; most of their responses were shock elicited and occurred immediately after shock. A titratlon-of -delay procedure did not eliminate responding either. However, it did change the response latency in two of four animals exposed to it. One animal that had

85 75 previously responded before shock before the titration procedure, responded mainly after shock following the titration procedure. The exact oppostie was true of a second animal. The No-Delay procedure developed more shock-elicited responding than any other procedure. Seventh, when two subjects from the L-LD condition were placed on the L-LD procedure with longer cycles, their modal relative frequencies shifted from between 1 and 3 sec on the short cycles to between 7 and 9 sec on the long cycles even though the R-S delays assigned to each latency remained the same. Eighth, several animals were placed on a procedure in which some latencies avoided shock while others only delayed shock. Animals placed on a procedure in which very short latencies produced avoidance quickly shortened their average latencies by as much as 4 sec. However, animals placed on a procedure in which long latencies produced shock avoidance, did not increase their average latency to any great extent even though they made some responses that avoided shock, and thus were exposed to the contingency. Hineline (1970) found that animals would respond to delay shock on approximately 80% of the trials even though responses did not reduce the overall frequency of shocks. The findings from this research support Hineline 's data in that animals did respond to delay shock. In fact some animals in the present study had a higher response probability than Hineline had found. In addition the probability of response to delay shock was very similar to the probability of response to nvold shock.

86 However, where Hineline found that all of his subjects would re- spond to delay shock, this research found that only about half of the subjects placed on the delay procedures would continue to respond to delay shock. The discrepancies in the two results may be due to the procedural differences in the two studies, or to the strains of rats used as subjects. Hineline used Lashley brown rats; the present study used albinos. Hineline used a cycle length of 20 sec; this research used a cycle length of 31 sec. On no-response trials Hineline delivered a shock at Sec 8 in the 10-sec bar extension period; this research delivered the shock during Sec 10 in the 11-sec bar extension period. Hineline always scheduled the response-delayed shock at Sec 18 of the 20-8ec cycle. However, in this research the location of the shock was variable and depended upon the response latency. For example, in the Constant Delay procedure the shock always occurred 19 sec after a response and therefore, depending on the latency, could occur between Sec 19 and Sec 29 of the cycle. It was observed in Experiment 1 that during the CD preliminary training all poor responders started to respond much later than the good responders did. Because of the nature of the CD delay procedure, this period of warm-up shown by the poor responders may have affected the strength of the lever-press response vis-a-vis other responses made by these animals. During the Discrete Trial Avoidance phase of preliminary training, the lever retracted and the white noise terminated only after a lever-press response. Perhaps this compound stimulus came to signal a period of safety (see Bolles, 1970) because it was followed by 21 sec of shock-free time. During the second phase
 1 sec after shock when no bar-press response occurred.")
87 77 of preliminary training which was the Constant Delay training, retraction of the lever now occurred under two circumstances: (1) After a bar-press response. (2) 1 sec after shock when no bar-press response occurred. During the initial trials of the CD procedure, it is possible that some other responses, not observed or measured, were occurring while the lever was being retracted 1 sec after shock. These unmeasured but reinforced responses then may have interferred with and competed for the discrete trial bar-press response causing these slow responders to become poor responders. One would need to use careful observational techniques to determine if in fact competing responses were being reinforced under the conditions that were used in this research. A larger proportion of responders survived on the CD procedure than on any other delay procedure. Since the R-S interval was fixed at 19 sec. the procedure enabled the subject to form a temporal discrimination and this discrimination made the subject better able to predict the onset of the delayed shock. In the S-LD and L-LD procedures a temporal discrimination was not as readily available because each different response latency produced a different delay of shock (see Figure 1) and, therefore, it would be difficult for an animal to predict when the shock was expected. Perhaps one of the conditions for good avoidance responding, when responses are not shock elicited, is that the delayed shock be located at a predictable point with respect to the response, (a constant R-S interval) or with respect to some external event (e.g., the onset of the CS and bar extension, Hineline, 1970). The variable delay of shock may also be a cause of the rapid decrease in responding for the several animals in the S-LD
.")
88 and L-LD conditions. The variable delay of shock does not allow the several researchers have suggested that animals prefer signalled to 78 ani^l to for. any temporal discrimination and the shock is unsignalled. unsignalled shock (Lockard. 1963; Badia. Stuart, and Culbertson. 1971; Perkins, Seymann, Levis, and Spencer, 1966). It should be possible to use a conditioned suppression paradigm to determine. (1) if the R-S delay period is aversive and, (2) if the delay period which is fixed in the CD procedure is less aversive than the delay period which is variable in the S-LD and L-LD procedures. A unique signal could be presented during the delay period and then tested using a conditioned suppression procedure to see if the signal had any suppressive effect on an appetitively-maintained response. The findings from the No-Delay condition were rather unexpected because it was predicted that responding would cease under this procedure, However, responding was maintained in three of five animals. Recently Gibbon and O'Connell (1973) have reported some data from a procedure very similar to the No-Delay procedure. Their data were very similar to the present results. They used a retractable bar procedure with an ITI of 100 msec. The ITI in this research was 20 sec. Responses on their procedure retracted the bar but did not change the location of shock. Gibbon and O'Connell found that three of their five animals acquired and maintained responding on this procedure, however, their responding was almost exclusively after shock or shock elicited. This shock-elicited responding also characterized the behavior that animals showed on the No-Delay condition In thla rchcardi. Tlu'He results support the conclusion of Hake and Campbell (1972) and others.

89 79 that animals will mainly respond after shocr when they have no control over its occurrence. In the delay procedures used in the research, anin^ls did control the location of shock and it was observed that their responses occurred almost exclusively before shock. The left panels of Figures and 6 show that the good responders in the delay conditions made almost no responses after shock. But the good responders in thfe No-Delay condition shown in Figure 10 placed most of their responses after shock. Also the poor responders in the delay and No-Delay conditions behaved in a similar fashion. Both made a relatively high frequency of responses after shock. In summary, the good responders in the No-Delay condition responded mainly after shock and the good responders in the CD, S-LD and L-LD delay conditions responded mainly before shock. This research also bears on the issue of whether animals respond to changes in the relative frequency of events (Herrenstein. 1969; Rescorla. 1967), or whether they respond to changes in temporal contiguities of events (Benedict and Ayres, 1972; Hlneline, 1970). If animals are really sensitive to the relative frequencies of events, what is the mechanism that enables relative frequencies to exert control on the animals? There are only two possible mechanisms. To use the avoidance procedure as an example, first, the animal may count shocks during some unit of time. And if the number of shocks before a response is greater than the number of shocks after a response, then the animal may discriminate the difference in number. If the two numbers are discrepant enough, the animal may form the discrimination that responses are effective at reducing relative frequencies


90 Of Shoe. This.echanls.. however, requires a great deal of e^ry fro. the anl..l and. thus. Is highly unlikely. Ihe second.echanis. Is based on a temporal discrimination. The animal "time" the intervals between shocks before and after a response. And. if the shock-response-shock interval is greater than the shock-shock interval, the animal may form a discrimination that responding decreases the temporal contiguity of shocks and increases the interval between shocks. The responding found in this research could not be maintained by the first discrimination process because the number of shocks before and after a response always remained the same. Animals always received one shock during every 31-sec cycle. Responding, however, could have been maintained by the second discrimination process. For example, in the S-LD procedure, animals could form a discrimination to respond after comparison of intervals between shocks with and without responses. In this procedure when an animal never responded, it received a shock every 31 sec. However, if the animal made a short latency response on a cycle, this would increase the time interval to the next shock by about 20 sec, making the interval between successive shocks equal to 51 sec. And if the animal did not respond on the very next trial, the interval between successive shocks could be as short as 12 sec. The response-delayed shock would occur at Sec 28 of cycle n and the no-response shock would occur at Sec 10 of cycle n+1. Thus, the animal might form the discrimination to respond because responses increase the duration between shocks. Gibbon (1972) has recently presented a mathematical model of

91 81 avoidance behavior that is based on this second discrimination process, the process of comparing different temporal intervals. He assumes that animals respond according to a scalar timing process and that they are capable of distinguishing different time intervals. Because of this capability, they are able to compare different shock-shock intervals. The two important intervals are one without a response and the other with at least one response. His model formulates a probability that an animal will make the discrimination that responses are worth their while and increase the interval between shocks. Gibbon argues that this discrimination is based on a biased decision rule because experimental literature (e.g.. Sidman, 1962) shows that rats will not respond to avoid shock until there is a huge advantage for doing so. This research supports Gibbon's model in showing that animals appear to make discriminations to respond based on a comparison of temporal intervals or temporal contiguities. However, Gibbon assumes that discriminations occur only after a shock. Perhaps discriminations can occur after other events as well. The two possible events in the procedures used in these studies are the beginning of each cycle and a response. The response appears to be the more important event for two reasons. First, it was with respect to the response that animals in the S-LD and L-LD conditions maximized the interval until shock. Second, if the beginning of each cycle were important then all of the animals in the CD procedure would have displayed long latencies in order to maximize the interval between trial onset and shock. But they all did not show long latencies. However, both events may be important in the discrimination process Perhaps the animal compares the time Interval between the onset of the

92 trial and shock and the tl.e Interval between response and shock. And 82 If the R-s interval Is sufficiently greater than the trial-onsetshock interval without a response, then the anl«l continue to respond. And If the R-s Interval Is not sufficiently greater, the anl^l chooses either not to respond at all or to respond only after shock. This post-shock response, In a way. does In fact produce the longest R-S Interval for ths subject If it does not respond before shock. Gibbon's model is successfully quite able to predict the asymptotic behavior on Sidman avoidance and on Herrnstein and Hineline's (1966) shock probability experiment. However, his model has some difficulty in predicting asymptotic behavior in Hineline's shock-postponement experiments, when Gibbon assumes that discrimination trials occur only after a shock. This research suggests that discriminations may also begin after responses, because animals were found to alter their response latencies in order to maximize the R-S interval. The results reported here can not be explained by shock density reduction, but can be explained via a shock delay mechanism. This mechanism is based on the delay of shock produced by a response and is demonstrated by the maximization of the Response-Shock interval.


93 References Anger. D. The role of temporal discriminations in the reinforcement of Sidman avoidance behavior. Journal of th^ Experiment. Analysis of Behavior. 1963, 6, Badia. P.. Culbertson, S.. and Lewis, P. The relative aversiveness of signalled vs. unsignalled avoidance. Journal of the F.vp p.^mental Analysis of Behavior. 1971, 16, Benedict, J. 0., and Ayres. J. J. B. Factors affecting conditioning in the truly random control procedure in the rat. Journal of Comparative and Physiolog ical Psycholo g y , Bolles, R. C. Species-Specific Defense Reactions and Avoidance Learning. Psychological Review. 1970, Bolles, R. C, and Popp, R. J.. Jr. Parameters affecting the acquisition of Sidman avoidance. Journal of the Experimental Analysis of Behavior. 1964, 7, Bolles, R. C, and Stokes, L. W., and Younger, M. S. Does CS termination reinforce avoidance behavior? Journal of Comparative and Physiological Psycholo ;^Y. 1966, 62, Gibbon, J. Timing and Discrimination of Shock Density in Avoidance. Psychological Review. 1972, 79, Gibbon, J, and O'Connell, M. E. Acquisition of lever pressing by rats under non-contingent shock: Aversive autoshaping? Paper presented at the meeting of the Eastern Psychological Association, Washington, May, 1973.


94 Honig (Ed.). Operant Behavior ; Areas of Research and Application. 84 Hake.,D. F. and Campbell. R. L. Characteristics and response displacement effects of shock-generated responding during negative reinforcement procedures: Pre-shock responding and post-shock aggressive responding. Journal of the Ex perimental Analy «^. Behavior. 1972, 17, Herrnstein, R. J. Method and theory in the study of avoidance. Psychological Review , Herrnstein. R. J. and Hineline. P. N. Negative reinforcement as shock-frequency reduction. Journal of the Experimental An.^y «^c of Behavior. 1966, 9, Hineline, P. N. Negative reinforcement without shock reduction. Journal o f the Experimental Analysis of Behavior^ 1970, 14, Hoffman. H. S. The analysis of discriminated avoidance. In W. K. New York: Appleton-Century-Crof ts, Hutchinson, R. R., Renfrew, J. W., and Young, G. A. Effects of longterm shock and associated stimuli on aggressive and manual responses. Journal of the Experimental Analysis of Behavior. 1971, 15, Lambert, J. V., Bersh, P. J., Hineline, P. N., and Smith, G. Avoidance conditioning with shock contingent upon the avoidance response. Journal of the Experimental Analysis of Behavior. 1973, 19, Lockard, J. S. Choice of a warning signal or no warning signal in an unavoidable shock situation. Journal of Comparative and


95 Perkins. C. C. Sey^ann. R. G.. Levis. D. J., and Spencer. H. R. 85 Factors affecting preference for signal-shock over shock-signal. Journal of Experimental P«y.hm.^^,, ig^^^ 72, Rescorla. R. A. Pavlovian conditioning and its proper control pro- Psychological Review. 1967, Sidman. M. Reduction of shock frequency as reinforcement for avoidance behavior. Journal of the Experimental An.iy^is of Beh.vin. 1962, 5, Sidman. M. Avoidance behavior. In W. K. Honig (Ed.). Operant Behavior : Areas of Research and Application. New York: Appleton-Century- Crofts Solomon. R. L., and Wynne, L. C. Tramatic avoidance learning: Acquisition in normal dogs. Psychological Monographs. 1953, (Whole no. 354). 67, 1-19.
96


97
Some Parameters of the Second-Order Conditioning of Fear in Rats
 University of Nebraska - Lincoln DigitalCommons@University of Nebraska - Lincoln Papers in Behavior and Biological Sciences Papers in the Biological Sciences 1969 Some Parameters of the Second-Order Conditioning
PROBABILITY OF SHOCK IN THE PRESENCE AND ABSENCE OF CS IN FEAR CONDITIONING 1
 Journal of Comparative and Physiological Psychology 1968, Vol. 66, No. I, 1-5 PROBABILITY OF SHOCK IN THE PRESENCE AND ABSENCE OF CS IN FEAR CONDITIONING 1 ROBERT A. RESCORLA Yale University 2 experiments
CAROL 0. ECKERMAN UNIVERSITY OF NORTH CAROLINA. in which stimulus control developed was studied; of subjects differing in the probability value
 JOURNAL OF THE EXPERIMENTAL ANALYSIS OF BEHAVIOR 1969, 12, 551-559 NUMBER 4 (JULY) PROBABILITY OF REINFORCEMENT AND THE DEVELOPMENT OF STIMULUS CONTROL' CAROL 0. ECKERMAN UNIVERSITY OF NORTH CAROLINA Pigeons
Stimulus control of foodcup approach following fixed ratio reinforcement*
 Animal Learning & Behavior 1974, Vol. 2,No. 2, 148-152 Stimulus control of foodcup approach following fixed ratio reinforcement* RICHARD B. DAY and JOHN R. PLATT McMaster University, Hamilton, Ontario,
The effects of Pavlovian CSs on two food-reinforced baselineswith and without noncontingent shock
 Animal Learning & Behavior 1976, Vol. 4 (3), 293-298 The effects of Pavlovian CSs on two food-reinforced baselineswith and without noncontingent shock THOMAS s. HYDE Case Western Reserve University, Cleveland,
CS DURATION' UNIVERSITY OF CHICAGO. in response suppression (Meltzer and Brahlek, with bananas. MH to S. P. Grossman. The authors wish to
 JOURNAL OF THE EXPERIMENTAL ANALYSIS OF BEHAVIOR 1971, 15, 243-247 NUMBER 2 (MARCH) POSITIVE CONDITIONED SUPPRESSION: EFFECTS OF CS DURATION' KLAUS A. MICZEK AND SEBASTIAN P. GROSSMAN UNIVERSITY OF CHICAGO
CONDITIONED REINFORCEMENT IN RATS'
 JOURNAL OF THE EXPERIMENTAL ANALYSIS OF BEHAVIOR 1969, 12, 261-268 NUMBER 2 (MARCH) CONCURRENT SCHEULES OF PRIMARY AN CONITIONE REINFORCEMENT IN RATS' ONAL W. ZIMMERMAN CARLETON UNIVERSITY Rats responded
The generality of within-session patterns of responding: Rate of reinforcement and session length
 Animal Learning & Behavior 1994, 22 (3), 252-266 The generality of within-session patterns of responding: Rate of reinforcement and session length FRANCES K. MCSWEENEY, JOHN M. ROLL, and CARI B. CANNON
FIXED-RATIO PUNISHMENT1 N. H. AZRIN,2 W. C. HOLZ,2 AND D. F. HAKE3
 JOURNAL OF THE EXPERIMENTAL ANALYSIS OF BEHAVIOR VOLUME 6, NUMBER 2 APRIL, 1963 FIXED-RATIO PUNISHMENT1 N. H. AZRIN,2 W. C. HOLZ,2 AND D. F. HAKE3 Responses were maintained by a variable-interval schedule
AMOUNT OF RESPONSE-PRODUCED CHANGE IN THE CS AND AVOIDANCE LEARNING 1
 Journal of Comparative and Physiological Psychology 1965, Vol. 59, No. 1, 13-17 AMOUNT OF RESPONSE-PRODUCED CHANGE IN THE CS AND AVOIDANCE LEARNING 1 GORDON BOWER, RONALD STARR, AND LEAH LAZAROVITZ Stanford
ANTECEDENT REINFORCEMENT CONTINGENCIES IN THE STIMULUS CONTROL OF AN A UDITORY DISCRIMINA TION' ROSEMARY PIERREL AND SCOT BLUE
 JOURNAL OF THE EXPERIMENTAL ANALYSIS OF BEHAVIOR ANTECEDENT REINFORCEMENT CONTINGENCIES IN THE STIMULUS CONTROL OF AN A UDITORY DISCRIMINA TION' ROSEMARY PIERREL AND SCOT BLUE BROWN UNIVERSITY 1967, 10,
KEY PECKING IN PIGEONS PRODUCED BY PAIRING KEYLIGHT WITH INACCESSIBLE GRAIN'
 JOURNAL OF THE EXPERIMENTAL ANALYSIS OF BEHAVIOR 1975, 23, 199-206 NUMBER 2 (march) KEY PECKING IN PIGEONS PRODUCED BY PAIRING KEYLIGHT WITH INACCESSIBLE GRAIN' THOMAS R. ZENTALL AND DAVID E. HOGAN UNIVERSITY
REACTION TIME AS A MEASURE OF INTERSENSORY FACILITATION l
 Journal oj Experimental Psychology 12, Vol. 63, No. 3, 289-293 REACTION TIME AS A MEASURE OF INTERSENSORY FACILITATION l MAURICE HERSHENSON 2 Brooklyn College In measuring reaction time (RT) to simultaneously
Serial compounds and trace conditioning procedures in the Kamin blocking paradigm.
 University of Massachusetts Amherst ScholarWorks@UMass Amherst Doctoral Dissertations 1896 - February 2014 Dissertations and Theses 1-1-1979 Serial compounds and trace conditioning procedures in the Kamin
The Application of the Species Specific Defense Reaction Hypothesis to Free Operant Avoidance
 Western Michigan University ScholarWorks at WMU Master's Theses Graduate College 8-1972 The Application of the Species Specific Defense Reaction Hypothesis to Free Operant Avoidance Deborah Ann Cory Western
INTRODUCING NEW STIMULI IN FADING
 JOURNL OF THE EXPERMENTL NLYSS OF BEHVOR 1979, 32, 121-127 NUMBER (JULY) CQUSTON OF STMULUS CONTROL WHLE NTRODUCNG NEW STMUL N FDNG LNNY FELDS THE COLLEGE OF STTEN SLND fter establishing a discrimination
A concurrent assessment of the positive and negative properties of a signaled shock schedule*
 Animal Learning & Behavior 1974, Vol. 2 (3),168-172. A concurrent assessment of the positive and negative properties of a signaled shock schedule* JOHN HARSH and PETRO BADA Bowling Green State University,
PSY402 Theories of Learning. Chapter 8, Theories of Appetitive and Aversive Conditioning
 PSY402 Theories of Learning Chapter 8, Theories of Appetitive and Aversive Conditioning Operant Conditioning The nature of reinforcement: Premack s probability differential theory Response deprivation
Conditioned inhibition of fear from negative Cs-us contingencies with shocks in the inhibitory Cs.
 University of Massachusetts Amherst ScholarWorks@UMass Amherst Masters Theses 1911 - February 2014 1974 Conditioned inhibition of fear from negative Cs-us contingencies with shocks in the inhibitory Cs.
Schedule Induced Polydipsia: Effects of Inter-Food Interval on Access to Water as a Reinforcer
 Western Michigan University ScholarWorks at WMU Master's Theses Graduate College 8-1974 Schedule Induced Polydipsia: Effects of Inter-Food Interval on Access to Water as a Reinforcer Richard H. Weiss Western
Within-event learning contributes to value transfer in simultaneous instrumental discriminations by pigeons
 Animal Learning & Behavior 1999, 27 (2), 206-210 Within-event learning contributes to value transfer in simultaneous instrumental discriminations by pigeons BRIGETTE R. DORRANCE and THOMAS R. ZENTALL University
DOES THE TEMPORAL PLACEMENT OF FOOD-PELLET REINFORCEMENT ALTER INDUCTION WHEN RATS RESPOND ON A THREE-COMPONENT MULTIPLE SCHEDULE?
 The Psychological Record, 2004, 54, 319-332 DOES THE TEMPORAL PLACEMENT OF FOOD-PELLET REINFORCEMENT ALTER INDUCTION WHEN RATS RESPOND ON A THREE-COMPONENT MULTIPLE SCHEDULE? JEFFREY N. WEATHERLY, KELSEY
STIMULUS FUNCTIONS IN TOKEN-REINFORCEMENT SCHEDULES CHRISTOPHER E. BULLOCK
 STIMULUS FUNCTIONS IN TOKEN-REINFORCEMENT SCHEDULES By CHRISTOPHER E. BULLOCK A DISSERTATION PRESENTED TO THE GRADUATE SCHOOL OF THE UNIVERSITY OF FLORIDA IN PARTIAL FULFILLMENT OF THE REQUIREMENTS FOR
PREFERENCE REVERSALS WITH FOOD AND WATER REINFORCERS IN RATS LEONARD GREEN AND SARA J. ESTLE V /V (A /A )(D /D ), (1)
(D /D ), (1)") JOURNAL OF THE EXPERIMENTAL ANALYSIS OF BEHAVIOR 23, 79, 233 242 NUMBER 2(MARCH) PREFERENCE REVERSALS WITH FOOD AND WATER REINFORCERS IN RATS LEONARD GREEN AND SARA J. ESTLE WASHINGTON UNIVERSITY Rats
JOURNAL OF THE EXPERIMENTAL ANALYSIS OF BEHAVIOR 23, 79, 233 242 NUMBER 2(MARCH) PREFERENCE REVERSALS WITH FOOD AND WATER REINFORCERS IN RATS LEONARD GREEN AND SARA J. ESTLE WASHINGTON UNIVERSITY Rats
CONDITIONED SUPPRESSION WITH NO CS-US CONTINGENCY IN THE RAT*
 CONDITIONED SUPPRESSION WITH NO CS-US CONTINGENCY IN THE RAT* VERNON L. QUINSEYf Dalhousie University ABSTRACT ess were presented to rats licking sucrose after one of several off-the-baseline Pavlovian
STUDIES OF WHEEL-RUNNING REINFORCEMENT: PARAMETERS OF HERRNSTEIN S (1970) RESPONSE-STRENGTH EQUATION VARY WITH SCHEDULE ORDER TERRY W.
 RESPONSE-STRENGTH EQUATION VARY WITH SCHEDULE ORDER TERRY W.") JOURNAL OF THE EXPERIMENTAL ANALYSIS OF BEHAVIOR 2000, 73, 319 331 NUMBER 3(MAY) STUDIES OF WHEEL-RUNNING REINFORCEMENT: PARAMETERS OF HERRNSTEIN S (1970) RESPONSE-STRENGTH EQUATION VARY WITH SCHEDULE
JOURNAL OF THE EXPERIMENTAL ANALYSIS OF BEHAVIOR 2000, 73, 319 331 NUMBER 3(MAY) STUDIES OF WHEEL-RUNNING REINFORCEMENT: PARAMETERS OF HERRNSTEIN S (1970) RESPONSE-STRENGTH EQUATION VARY WITH SCHEDULE
Value Transfer in a Simultaneous Discrimination Appears to Result From Within-Event Pavlovian Conditioning
 Journal of Experimental Psychology: Animal Behavior Processes 1996, Vol. 22. No. 1, 68-75 Copyright 1996 by the American Psychological Association. Inc. 0097-7403/96/53.00 Value Transfer in a Simultaneous
Transfer of Control in Ambiguous Discriminations
 Journal of Experimental Psychology: Animal Behavior Processes 1991, Vol. 17, No. 3, 231-248 Copyright 1991 by the Am n Psychological Association, Inc. 0097-7403/91/53.00 Transfer of Control in Ambiguous
STEPHEN P. KRAMER. (Kojima, 1980; Lattal, 1975; Maki, Moe, &
 JOURNAL OF THE EXPERIMENTAL ANALYSIS OF BEHAVIOR1 1982, 38, 71-85 NUMBER I (JULY) MEMORY FOR RECENT BEHAVIOR IN THE PIGEON STEPHEN P. KRAMER CORRECTIONS DIVISION, DRAPER, UTAH Variations of the symbolic
Defensive responding and leverpress topography compatibility: Effects of shock intensity, S-S interval, and lever position
 Anima/ Learning & Behavior 1977. 5 (1). 78 82 Defensive responding and leverpress topography compatibility: Effects of shock intensity, S-S interval, and lever position RONALD C. FELDT and LEE I. McCANN
TEMPORALLY SPECIFIC BLOCKING: TEST OF A COMPUTATIONAL MODEL. A Senior Honors Thesis Presented. Vanessa E. Castagna. June 1999
 TEMPORALLY SPECIFIC BLOCKING: TEST OF A COMPUTATIONAL MODEL A Senior Honors Thesis Presented By Vanessa E. Castagna June 999 999 by Vanessa E. Castagna ABSTRACT TEMPORALLY SPECIFIC BLOCKING: A TEST OF
Operant response topographies of rats receiving food or water reinforcers on FR or FI reinforcement schedules
 Animal Learning& Behavior 1981,9 (3),406-410 Operant response topographies of rats receiving food or water reinforcers on FR or FI reinforcement schedules JOHN H. HULL, TIMOTHY J. BARTLETT, and ROBERT
Supplemental Data: Capuchin Monkeys Are Sensitive to Others Welfare. Venkat R. Lakshminarayanan and Laurie R. Santos
 Supplemental Data: Capuchin Monkeys Are Sensitive to Others Welfare Venkat R. Lakshminarayanan and Laurie R. Santos Supplemental Experimental Procedures Subjects Seven adult capuchin monkeys were tested.
Chapter 5: Learning and Behavior Learning How Learning is Studied Ivan Pavlov Edward Thorndike eliciting stimulus emitted
 Chapter 5: Learning and Behavior A. Learning-long lasting changes in the environmental guidance of behavior as a result of experience B. Learning emphasizes the fact that individual environments also play
VERNON L. QUINSEY DALHOUSIE UNIVERSITY. in the two conditions. If this were possible, well understood where the criterion response is
 JOURNAL OF THE EXPERIMENTAL ANALYSIS OF BEHAVIOR LICK-SHOCK CONTINGENCIES IN THE RATT1 VERNON L. QUINSEY DALHOUSIE UNIVERSITY 1972, 17, 119-125 NUMBER I (JANUARY) Hungry rats were allowed to lick an 8%
Examining the Constant Difference Effect in a Concurrent Chains Procedure
 University of Wisconsin Milwaukee UWM Digital Commons Theses and Dissertations May 2015 Examining the Constant Difference Effect in a Concurrent Chains Procedure Carrie Suzanne Prentice University of Wisconsin-Milwaukee
Increasing the persistence of a heterogeneous behavior chain: Studies of extinction in a rat model of search behavior of working dogs
 Increasing the persistence of a heterogeneous behavior chain: Studies of extinction in a rat model of search behavior of working dogs Eric A. Thrailkill 1, Alex Kacelnik 2, Fay Porritt 3 & Mark E. Bouton
Pain-elicited aggression in the squirrel monkey: An implicit avoidance contingency
 Animal Learning & Behavior 1976, Vol. 4(lA), 89-95 Pain-elicited aggression in the squirrel monkey: An implicit avoidance contingency PHILIP J, DUNHAM and ADAM CARR Dalhousie University, Halifax, Nova
Animal memory: The contribution of generalization decrement to delayed conditional discrimination retention functions
 Learning & Behavior 2009, 37 (4), 299-304 doi:10.3758/lb.37.4.299 Animal memory: The contribution of generalization decrement to delayed conditional discrimination retention functions REBECCA RAYBURN-REEVES
Operant Conditioning B.F. SKINNER
 Operant Conditioning B.F. SKINNER Reinforcement in Operant Conditioning Behavior Consequence Patronize Elmo s Diner It s all a matter of consequences. Rewarding Stimulus Presented Tendency to tell jokes
CRF or an Fl 5 min schedule. They found no. of S presentation. Although more responses. might occur under an Fl 5 min than under a
 JOURNAL OF THE EXPERIMENTAL ANALYSIS OF BEHAVIOR VOLUME 5, NUMBF- 4 OCITOBER, 1 962 THE EFECT OF TWO SCHEDULES OF PRIMARY AND CONDITIONED REINFORCEMENT JOAN G. STEVENSON1 AND T. W. REESE MOUNT HOLYOKE
LEARNING-SET OUTCOME IN SECOND-ORDER CONDITIONAL DISCRIMINATIONS
 The Psychological Record, 2000, 50, 429-442 LEARNING-SET OUTCOME IN SECOND-ORDER CONDITIONAL DISCRIMINATIONS LUIS A. PEREZ-GONZALEZ, JOSEPH E. SPRADLIN, and KATHRYN J. SAUNDERS University of Oviedo, Spain
ANNA STATE HOSPITAL. peated measurement of the attack. A mechanical
 JOURNAL OF THE EXPERIMENTAL ANALYSIS OF BEHAVIOR VOLUME 8, NUMBER 3 MAY, 1965 THE OPPORTUNITY FOR AGGRESSION AS AN OPERANT REINFORCER DURING AVERSIVE STIMULATION' N. H. AZRIN, R. R. HUTCHINSON, AND R.
DISCRIMINATION IN RATS OSAKA CITY UNIVERSITY. to emit the response in question. Within this. in the way of presenting the enabling stimulus.
 JOURNAL OF THE EXPERIMENTAL ANALYSIS OF BEHAVIOR EFFECTS OF DISCRETE-TRIAL AND FREE-OPERANT PROCEDURES ON THE ACQUISITION AND MAINTENANCE OF SUCCESSIVE DISCRIMINATION IN RATS SHIN HACHIYA AND MASATO ITO
Effects of Discriminated Stimuli on Temporal Responding in a Free-Operant Discriminated Avoidance Procedure
 Western Michigan University ScholarWorks at WMU Master's Theses Graduate College 5-1968 Effects of Discriminated Stimuli on Temporal Responding in a Free-Operant Discriminated Avoidance Procedure Darrel
AUTOSHAPING OF KEY PECKING IN PIGEONS
 JOURNAL OF THE EXPERIMENTAL ANALYSIS OF BEHAVIOR 1969, 12, 521-531 NUMBER 4 (JULY) AUTOSHAPING OF KEY PECKING IN PIGEONS WITH NEGATIVE REINFORCEMENT' HOWARD RACHLIN HARVARD UNIVERSITY Pigeons exposed to
Motivational cues as determiners of stimulus control in rats
 Animal Learning & Behavior 1975. 101. (). ::50-56 Motivational cues as determiners of stimulus control in rats DAVID C'. ZUCKERMAN Vassar College, Poughkeepsie,.Vell' York 11 Four rats were each trained
Signaled reinforcement effects on fixed-interval performance of rats with lever depressing or releasing as a target response 1
 Japanese Psychological Research 1998, Volume 40, No. 2, 104 110 Short Report Signaled reinforcement effects on fixed-interval performance of rats with lever depressing or releasing as a target response
Value transfer in a simultaneous discrimination by pigeons: The value of the S + is not specific to the simultaneous discrimination context
 Animal Learning & Behavior 1998, 26 (3), 257 263 Value transfer in a simultaneous discrimination by pigeons: The value of the S + is not specific to the simultaneous discrimination context BRIGETTE R.
REPEATED MEASUREMENTS OF REINFORCEMENT SCHEDULE EFFECTS ON GRADIENTS OF STIMULUS CONTROL' MICHAEL D. ZEILER
 JOURNAL OF THE EXPERIMENTAL ANALYSIS OF BEHAVIOR REPEATED MEASUREMENTS OF REINFORCEMENT SCHEDULE EFFECTS ON GRADIENTS OF STIMULUS CONTROL' MICHAEL D. ZEILER UNIVERSITY OF IOWA 1969, 12, 451-461 NUMBER
A Memory Model for Decision Processes in Pigeons
 From M. L. Commons, R.J. Herrnstein, & A.R. Wagner (Eds.). 1983. Quantitative Analyses of Behavior: Discrimination Processes. Cambridge, MA: Ballinger (Vol. IV, Chapter 1, pages 3-19). A Memory Model for
Extinction of the Context and Latent Inhibition
 LEARNING AND MOTIVATION 13, 391-416 (1982) Extinction of the Context and Latent Inhibition A. G. BAKER AND PIERRE MERCIER McGill University The hypothesis that latent inhibition could be reduced by extinguishing
Discritninative vs motivational interpretations of avoidance extinction: Extensions to learned helplessness
 11/11/11111.,url/lII.~ l\ /Jlhullllr 1':173. 1111 I..\11 3.1':13-1';- Discritninative vs motivational interpretations of avoidance extinction: Extensions to learned helplessness CYNTHIA SCHEUER and CARY
THESES SIS/LIBRARY TELEPHONE:
 THESES SIS/LIBRARY TELEPHONE: +61 2 6125 4631 R.G. MENZIES LIBRARY BUILDING NO:2 FACSIMILE: +61 2 6125 4063 THE AUSTRALIAN NATIONAL UNIVERSITY EMAIL: library.theses@anu.edu.au CANBERRA ACT 0200 AUSTRALIA
Pigeons transfer between conditional discriminations with differential outcomes in the absence of differential-sample-responding cues
 Animal Learning & Behavior 1995, 23 (3), 273-279 Pigeons transfer between conditional discriminations with differential outcomes in the absence of differential-sample-responding cues LOU M. SHERBURNE and
THE EFFECTS OF TERMINAL-LINK STIMULUS ARRANGEMENTS ON PREFERENCE IN CONCURRENT CHAINS. LAUREL COLTON and JAY MOORE University of Wisconsin-Milwaukee
 The Psychological Record, 1997,47,145-166 THE EFFECTS OF TERMINAL-LINK STIMULUS ARRANGEMENTS ON PREFERENCE IN CONCURRENT CHAINS LAUREL COLTON and JAY MOORE University of Wisconsin-Milwaukee Pigeons served
PURSUING THE PAVLOVIAN CONTRIBUTIONS TO INDUCTION IN RATS RESPONDING FOR 1% SUCROSE REINFORCEMENT
 The Psychological Record, 2007, 57, 577 592 PURSUING THE PAVLOVIAN CONTRIBUTIONS TO INDUCTION IN RATS RESPONDING FOR 1% SUCROSE REINFORCEMENT JEFFREY N. WEATHERLY, AMBER HULS, and ASHLEY KULLAND University
Cooling as Reinforcing Stimulus in Aplysia
 AM. ZOOI.OCIST, 12:507-512 (1972). Cooling as Reinforcing Stimulus in Aplysia PAUL DOWNEY AND BEHRUS JAHAN-PARWAR Biology Department, Clark University, Worcester, Massachusetts 01610 and Worcester Foundation
Systematic manipulation of CS-US pairings in negative CS-US correlation procedures in rats
 Animal Learning & Behavior 1980, 8 (1), 67-74 Systematic manipulation of CS-US pairings in negative CS-US correlation procedures in rats ELIZABETH S. WITCHER and JOHN J. B. AYRES University ofmassachusetts,
APPLIED BEHAVIOR ANALYSIS (ABA) THE LOVAAS METHODS LECTURE NOTE
 THE LOVAAS METHODS LECTURE NOTE") APPLIED BEHAVIOR ANALYSIS (ABA) THE LOVAAS METHODS LECTURE NOTE 이자료는이바로바스교수의응용행동수정강의를리차드손임상심리학박사가요약해서 정리한것입니다. Lovaas Method Philosophy Children stay with family at home If not working (no positive changes
APPLIED BEHAVIOR ANALYSIS (ABA) THE LOVAAS METHODS LECTURE NOTE 이자료는이바로바스교수의응용행동수정강의를리차드손임상심리학박사가요약해서 정리한것입니다. Lovaas Method Philosophy Children stay with family at home If not working (no positive changes
UNIVERSITY OF WALES SWANSEA AND WEST VIRGINIA UNIVERSITY
 JOURNAL OF THE EXPERIMENTAL ANALYSIS OF BEHAVIOR 05, 3, 3 45 NUMBER (JANUARY) WITHIN-SUBJECT TESTING OF THE SIGNALED-REINFORCEMENT EFFECT ON OPERANT RESPONDING AS MEASURED BY RESPONSE RATE AND RESISTANCE
Basic characteristics
 Learning Basic characteristics The belief that the universe is lawful and orderly The occurrence of phenomena as a function of the operation of specific variables Objective observation Controlled experiments
ECONOMIC AND BIOLOGICAL INFLUENCES ON KEY PECKING AND TREADLE PRESSING IN PIGEONS LEONARD GREEN AND DANIEL D. HOLT
 JOURNAL OF THE EXPERIMENTAL ANALYSIS OF BEHAVIOR 2003, 80, 43 58 NUMBER 1(JULY) ECONOMIC AND BIOLOGICAL INFLUENCES ON KEY PECKING AND TREADLE PRESSING IN PIGEONS LEONARD GREEN AND DANIEL D. HOLT WASHINGTON
AVOIDANCE LEARNING IN SHUTTLING AND NONSHUTTLING SITUATIONS, WITH AND WITHOUT A BARRIER. Kobe Juvenile Detention and Classification Home
 Japanese Psychological Research 1964, Vol.6, No.3, 129-135 AVOIDANCE LEARNING IN SHUTTLING AND NONSHUTTLING SITUATIONS, WITH AND WITHOUT A BARRIER EIJI KUNITOMI, Kobe Juvenile Detention and Classification
MOUNT ALLISON UNIVERSITY
 JOURNAL OF THE EXPERIMENTAL ANALYSIS OF BEHAVIOR 00, 79, 6 NUMBER (MARCH) RESPONDING FOR SUCROSE AND WHEEL-RUNNING REINFORCEMENT: EFFECTS OF SUCROSE CONCENTRATION AND WHEEL-RUNNING REINFORCER DURATION
Subjects and apparatus
 THE MAINTENANCE OF BEHA VIOR BY THE TERMINA TION AND ONSET OF INTENSE NOISE' J. M. HARRISON and R. M. ABELSON BOSTON UNIVERSITY The purposes of the present investigation were, first, the establishment
The effects of reinforcement of the development of inhibitory stimulus control.
 University of Massachusetts Amherst ScholarWorks@UMass Amherst Masters Theses 1911 - February 2014 1971 The effects of reinforcement of the development of inhibitory stimulus control. Jeremiah P. Collins
3/7/2010. Theoretical Perspectives
 Theoretical Perspectives REBT (1955) Albert Ellis Action & Result Oriented Teaches how to identify self-defeating thoughts Replaces thoughts w/ life enhancing ones 1 A B C s of personality formation: A
Schedules of Reinforcement 11/11/11
 Schedules of Reinforcement 11/11/11 Reinforcement Schedules Intermittent Reinforcement: A type of reinforcement schedule by which some, but not all, correct responses are reinforced. Intermittent reinforcement
Oddity learning in the pigeon: Effect of negative instances, correction, and number of incorrect alternatives
 Animal Learning & Behavior 1980,8(4),621-629 Oddity learning in the pigeon: Effect of negative instances, correction, and number of incorrect alternatives THOMAS R. ZENTALL University ofkentucky, Lexington,
Amount of training effects in representationmediated food aversion learning: No evidence of a role for associability changes
 Journal Learning & Behavior 2005,?? 33 (?), (4),???-??? 464-478 Amount of training effects in representationmediated food aversion learning: No evidence of a role for associability changes PETER C. HOLLAND
ON THE EFFECTS OF EXTENDED SAMPLE-OBSERVING RESPONSE REQUIREMENTS ON ADJUSTED DELAY IN A TITRATING DELAY MATCHING-TO-SAMPLE PROCEDURE WITH PIGEONS
 ON THE EFFECTS OF EXTENDED SAMPLE-OBSERVING RESPONSE REQUIREMENTS ON ADJUSTED DELAY IN A TITRATING DELAY MATCHING-TO-SAMPLE PROCEDURE WITH PIGEONS Brian D. Kangas, B.A. Thesis Prepared for the Degree of
EFFECTS OF INTERRESPONSE-TIME SHAPING ON MULTIPLE SCHEDULE PERFORMANCE. RAFAEL BEJARANO University of Kansas
 The Psychological Record, 2004, 54, 479-490 EFFECTS OF INTERRESPONSE-TIME SHAPING ON MULTIPLE SCHEDULE PERFORMANCE RAFAEL BEJARANO University of Kansas The experiment reported herein was conducted to determine
Chapter 5: How Do We Learn?
 Chapter 5: How Do We Learn? Defining Learning A relatively permanent change in behavior or the potential for behavior that results from experience Results from many life experiences, not just structured
Jennifer J. McComas and Ellie C. Hartman. Angel Jimenez
 The Psychological Record, 28, 58, 57 528 Some Effects of Magnitude of Reinforcement on Persistence of Responding Jennifer J. McComas and Ellie C. Hartman The University of Minnesota Angel Jimenez The University
A TRANSLATIONAL EVALUATION OF THE INTERPOLATED REINFORCEMENT PROCEDURE WITH YOUNG CHILDREN
 Behavioral Interventions Behav. Intervent. 27: 5 55 (212) Published online in Wiley Online Library (wileyonlinelibrary.com) DOI: 1.12/bin.1337 A TRANSLATIONAL EVALUATION OF THE INTERPOLATED REINFORCEMENT
CONTROL OF IMPULSIVE CHOICE THROUGH BIASING INSTRUCTIONS. DOUGLAS J. NAVARICK California State University, Fullerton
 The Psychological Record, 2001, 51, 549-560 CONTROL OF IMPULSIVE CHOICE THROUGH BIASING INSTRUCTIONS DOUGLAS J. NAVARICK California State University, Fullerton College students repeatedly chose between
Chapter 6/9: Learning
 Chapter 6/9: Learning Learning A relatively durable change in behavior or knowledge that is due to experience. The acquisition of knowledge, skills, and behavior through reinforcement, modeling and natural
between successive DMTS choice phases.
 JOURNAL OF THE EXPERIMENTAL ANALYSIS OF BEHAVIOR 1996, 66, 231 242 NUMBER 2(SEPTEMBER) SEPARATING THE EFFECTS OF TRIAL-SPECIFIC AND AVERAGE SAMPLE-STIMULUS DURATION IN DELAYED MATCHING TO SAMPLE IN PIGEONS
Instrumental Conditioning I
 Instrumental Conditioning I Basic Procedures and Processes Instrumental or Operant Conditioning? These terms both refer to learned changes in behavior that occur as a result of the consequences of the
I. Classical Conditioning
 Learning Chapter 8 Learning A relatively permanent change in an organism that occur because of prior experience Psychologists must study overt behavior or physical changes to study learning Learning I.
How do Fornix-Fimbria Lesions Affect One-Way Active Avoidance Behavior?
 How do Fornix-Fimbria Lesions Affect One-Way Active Avoidance Behavior? Cem Kaner, Bob Osborne, Harvey Anchel, Mark Hammer & Abraham H. Black McMaster University 86 th Annual Convention of the American
CORRELATED DELAY OF REINFORCEMENT 1
 Journal of Comparative and Physiological Psychology 1961, Vol. 54, No. 2, 196-203 CRRELATED DELAY F REINFRCEMENT 1 It is well established that variations in an operant response can be differentiated by
Spacing extinction trials alleviates renewal and spontaneous recovery
 L132 NT MJA/cla Learning & Behavior 2009, 37 (1), 60-73 doi:10.3758/lb.37.1.60 Spacing extinction trials alleviates renewal and spontaneous recovery Gonzalo P. Urcelay University of Cambridge, Cambridge,
Transfer of memory retrieval cues attenuates the context specificity of latent inhibition
 Scholarly Commons Psychology Faculty Publications 2015 Transfer of memory retrieval cues attenuates the context specificity of latent inhibition James F. Briggs Timothy A. Toth Brian P. Olson Jacob G.
INFLUENCE OF RETROACTIVE INTERFERENCE ON THE CONTEXT SHIFT EFFECT
 INFLUENCE OF RETROACTIVE INTERFERENCE ON THE CONTEXT SHIFT EFFECT A thesis submitted to Kent State University in partial fulfillment of the requirements for the degree of Master of Arts By Erin Marie Fleming
on both components of conc Fl Fl schedules, c and a were again less than 1.0. FI schedule when these were arranged concurrently.
 JOURNAL OF THE EXPERIMENTAL ANALYSIS OF BEHAVIOR 1975, 24, 191-197 NUMBER 2 (SEPTEMBER) PERFORMANCE IN CONCURRENT INTERVAL SCHEDULES: A SYSTEMATIC REPLICATION' BRENDA LOBB AND M. C. DAVISON UNIVERSITY
Exemplar Memory and Discrimination
 Entire Set of Printable Figures For Exemplar Memory and Discrimination Chase and Heinemann Footnote 1. From a very different perspective, investigators such as Estes (1994, Hintzman (1988) and Nosofsky
Functionality. A Case For Teaching Functional Skills 4/8/17. Teaching skills that make sense
 Functionality Teaching skills that make sense Mary Jane Weiss, Ph.D., BCBA-D Eden Princeton Lecture Series April, 2017 A Case For Teaching Functional Skills Preston Lewis, Dec. 1987, TASH Newsletter excerpt
REINFORCEMENT OF PROBE RESPONSES AND ACQUISITION OF STIMULUS CONTROL IN FADING PROCEDURES
 JOURNAL OF THE EXPERIMENTAL ANALYSIS OF BEHAVIOR 1985, 439 235-241 NUMBER 2 (MARCH) REINFORCEMENT OF PROBE RESPONSES AND ACQUISITION OF STIMULUS CONTROL IN FADING PROCEDURES LANNY FIELDS THE COLLEGE OF
Occasion Setting without Feature-Positive Discrimination Training
 LEARNING AND MOTIVATION 23, 343-367 (1992) Occasion Setting without Feature-Positive Discrimination Training CHARLOTTE BONARDI University of York, York, United Kingdom In four experiments rats received
DIFFERENTIAL REINFORCEMENT OF OTHER BEHAVIOR AND RESPONSE SUPPRESSION:
 psychological Record, 1993, 43, 271-288 DIFFERENTIAL REINFORCEMENT OF OTHER BEHAVIOR AND RESPONSE SUPPRESSION: THE EFFECTS OF THE RESPONSE-REINFORCEMENT INTERVAL THOMAS S. RIEG, NELSON F. SMITH, and STUART
REINFORCEMENT AT CONSTANT RELATIVE IMMEDIACY OF REINFORCEMENT A THESIS. Presented to. The Faculty of the Division of Graduate. Studies and Research
 TWO-KEY CONCURRENT RESPONDING: CHOICE AND DELAYS OF REINFORCEMENT AT CONSTANT RELATIVE IMMEDIACY OF REINFORCEMENT A THESIS Presented to The Faculty of the Division of Graduate Studies and Research By George
Behavioural Processes
 Behavioural Processes 95 (23) 4 49 Contents lists available at SciVerse ScienceDirect Behavioural Processes journal homepage: www.elsevier.com/locate/behavproc What do humans learn in a double, temporal
Behavioral generalization
 Supplementary Figure 1 Behavioral generalization. a. Behavioral generalization curves in four Individual sessions. Shown is the conditioned response (CR, mean ± SEM), as a function of absolute (main) or
Learning: Some Key Terms
 Learning: Some Key Terms Learning: Relatively permanent change in behavior due to experience Reinforcement: Any event that increases the probability that a response will recur Focus on what can be seen
Unit 6 Learning.
 Unit 6 Learning https://www.apstudynotes.org/psychology/outlines/chapter-6-learning/ 1. Overview 1. Learning 1. A long lasting change in behavior resulting from experience 2. Classical Conditioning 1.
What is Learned? Lecture 9
 What is Learned? Lecture 9 1 Classical and Instrumental Conditioning Compared Classical Reinforcement Not Contingent on Behavior Behavior Elicited by US Involuntary Response (Reflex) Few Conditionable
Timing in pigeons: The choose-short effect may result from pigeons confusion between delay and intertrial intervals
 Psychonomic Bulletin & Review 1998, 5 (3), 516-522 Timing in pigeons: The choose-short effect may result from pigeons confusion between delay and intertrial intervals LOU M. SHERBURNE Wabash College, Crawfordsville,
Concurrent schedule responding as a function ofbody weight
 Animal Learning & Behavior 1975, Vol. 3 (3), 264-270 Concurrent schedule responding as a function ofbody weight FRANCES K. McSWEENEY Washington State University, Pullman, Washington 99163 Five pigeons