At What Latency Does the Phase of Brain Oscillations Influence Perception?
|
|
|
- Belinda Grant
- 5 years ago
- Views:
Transcription

1 This Accepted Manuscript has not been copyedited and formatted. The final version may differ from this version. Research Article: New Research Cognition and Behavior At What Latency Does the Phase of Brain Oscillations Influence Perception? Measuring the latency of EEG phase effects Sasskia Brüers 1,2 and Rufin VanRullen 1,2 1 Université De Toulouse Paul Sabatier, Toulouse, France 2 Centre De Recherche Cerveau Et Cognition, CNRS, UMR 5549 DOI: /ENEURO Received: 6 March 2017 Revised: 8 May 2017 Accepted: 15 May 2017 Published: 19 May 2017 Author Contributions: RV Designed research, SB performed research, RV and SB analyzed data and wrote the paper. Funding: European Research Council P-CYCLES (N{degree sign}614244) Conflict of Interest: Authors report no conflict of interest. This research was supported by the ERC grant P-CYCLES (N ) to RV. Correspondence should be addressed to Rufin VanRullen, Centre de Recherche Cerveau et Cognition (CerCo), CNRS, UMR 5549, Pavillon Baudot, CHU Purpan, BP 25202, Toulouse Cedex rufin.vanrullen@cnrs.fr Cite as: eneuro 2017; /ENEURO Alerts: Sign up at eneuro.org/alerts to receive customized alerts when the fully formatted version of this article is published. Accepted manuscripts are peer-reviewed but have not been through the copyediting, formatting, or proofreading process. This is an open-access article distributed under the terms of the Creative Commons Attribution 4.0 International ( which permits unrestricted use, distribution and reproduction in any medium provided that the original work is properly attributed. Copyright 2017 the authors
2 Title Page 1. Manuscript Title (50 word maximum) At what latency does the phase of brain oscillations influence perception? 2. Abbreviated Title (50 character maximum) Measuring the latency of EEG phase effects 3. List all Author Names and Affiliations in order as they would appear in the published article Sasskia Brüers 1,2 and Rufin VanRullen 1,2 1 Université de Toulouse Paul Sabatier, Toulouse, France 2 Centre de Recherche Cerveau et Cognition, CNRS, UMR Author Contributions RV Designed research, SB performed research, RV and SB analyzed data and wrote the paper 5. Correspondence should be addressed to (include address) Rufin VanRullen, Centre de Recherche Cerveau et Cognition (CerCo), CNRS, UMR 5549, Pavillon Baudot, CHU Purpan, BP 25202, Toulouse Cedex 03, (rufin.vanrullen@cnrs.fr) 6. Number of Figures 7. Number of Tables 8. Number of Multimedia 9. Number of words for Abstract: Number of words for Significance Statement: Number of words for Introduction: Number of words for Discussion: Acknowledgements We thank T. Baudry for his help with the control experiment s data acquisition. 14. Conflict of Interest Authors report no conflict of interest 15. Funding sources This research was supported by the ERC grant P-CYCLES (N ) to RV. 1
3 Abstract Recent evidence has shown a rhythmic modulation of perception: pre-stimulus ongoing EEG phase in the theta (4-8 Hz) and alpha (8-13 Hz) bands has been directly linked with fluctuations in target detection. In fact, the ongoing EEG phase directly reflects cortical excitability: it acts as a gating mechanism for information flow at the neuronal level. Consequently, the key phase modulating perception should be the one present in the brain when the stimulus is actually being processed. Most previous studies, however, reported phase modulation peaking 100 ms or more before target onset. To explain this discrepancy, we first use simulations showing that contamination of spontaneous oscillatory signals by target-evoked ERP and signal filtering (e.g. wavelet) can result in an apparent shift of the peak phase modulation towards earlier latencies, potentially reaching the pre-stimulus period. We then present a paradigm based on linear systems analysis which can uncover the true latency at which ongoing EEG phase influences perception. After measuring the impulse response function, we use it to reconstruct (rather than record) the brain activity of human observers during whitenoise sequences. We can then present targets in those sequences, and reliably estimate EEG phase around these targets without any influence of the target-evoked response. We find that in these reconstructed signals, the important phase for perception is that of fronto-occipital ~6Hz background oscillations at about 75 milliseconds after target onset. These results confirm the causal influence of phase on perception at the time the stimulus is effectively processed in the brain. 2
4 Significance statement When investigating the relationship between ongoing EEG oscillations and perception in humans, most studies report a peak influence of the EEG phase before stimulus onset. Yet, we should also be able to measure these effects post-stimulus, when the target is actually processed by the brain. First, we use simulations to show that a combined influence of the target-evoked potential and filtering can explain the lack of post-stimulus phase modulation in typical studies. Crucially, we then introduce a paradigm to uncover the true latency at which phase influences perception. The white-noise paradigm allows us to model background oscillations without target-evoked potentials. For the first time, we show that a theta-band ongoing oscillation influences perception about 75 ms after target onset. 3
5 Introduction Instead of continuously processing the incoming visual information, the perceptual cycles hypothesis suggests that our brain relies on a rhythmic sampling of the input. Ongoing oscillations have been proposed as a mechanism through which our environment is sampled from 5 to 15 times a second (VanRullen, 2016b; VanRullen & Koch, 2003). At the neuronal level, this is realized through a biasing of the neuronal firing by local field potential (LFP) phase in various frequency bands (Fries, Schröder, Roelfsema, Singer, & Engel, 2002; Jacobs, Kahana, Ekstrom, & Fried, 2007). This results in periodic fluctuations of the excitability of the cortex (Fries, 2005; Lakatos, Karmos, Mehta, Ulbert, & Schroeder, 2008): spikes in sensory cortices are more likely to occur at a given phase of LFP alpha oscillations than at the opposite phase (Haegens et al., 2015; Haegens, Nácher, Luna, Romo, & Jensen, 2011). At the global level, this relationship between excitability and phase has been studied using transcranial magnetic stimulation (TMS) and electro-encephalography (EEG): an illusory percept (a phosphene ) was most likely to occur when the TMS pulse was applied at a certain phase of the ongoing EEG oscillation than at the opposite phase (Dugué, Marque, & VanRullen, 2011). Moreover, ongoing EEG oscillations have also been linked with visual perception: for example, the ~7 Hz ongoing oscillation phase over fronto-central channels could account for 16% of the variability in the detection of near-perceptual threshold peripheral targets (Busch, Dubois, & VanRullen, 2009). Various studies have related ongoing EEG phase to behavioral and perceptual outcome using near-perceptual threshold target detection with attentional manipulation (Busch & VanRullen, 2010) or without it (Nunn & Osselton, 1974), using contour integration tasks at perceptual threshold (Hanslmayr, Volberg, Wimber, Dalal, & Greenlee, 2013), using supra-threshold stimuli detection (Callaway & Yeager, 1960; Mathewson, Gratton, Fabiani, Beck, & Ro, 2009), using eye-movement initiation (Drewes & VanRullen, 2011) and mis-localization (McLelland, Lavergne, & VanRullen, 2016) or using a temporal 4
6 illusion (Chakravarthi & VanRullen, 2012). Crucially, most of these experiments find the effects of the ongoing theta and/or alpha phase during the pre-stimulus period, sometimes peaking even up to 200 ms before stimulus onset (see VanRullen, 2016b for a review). Superficially, this pre-stimulus effect might seem counter intuitive: the critical phase for perception should be the one present in the cortex during stimulus processing. If oscillatory signals are consistent over time, this phase influence may of course be visible several hundred of milliseconds before but why does it vanish as stimulus onset approaches? The event-related potential (ERP) evoked after target presentation could be causing this seemingly contradictory finding: this relatively high-amplitude signal with similar phase values on every trial is likely to obscure any difference in background oscillatory phase of perceived and unperceived trials that would be present after stimulus onset, and thus apparently push back in time our ability to detect any such phase difference. This is especially true when considering window-based time-frequency analysis methods (a necessary step in oscillatory phase analysis), which will smear the effect in time (Hanslmayr et al., 2013; Lakatos et al., 2005; VanRullen, 2011, 2016a). Can we overcome these biases, and uncover the exact latency at which the phase of ongoing EEG oscillations modulates perception? First, we use simulations to control the exact timing and oscillatory frequency at which a phase modulation of perceptual outcome is inserted into an artificial EEG dataset. We then assess the latency at which a significant phase difference between two conditions can be detected, and verify that this latency can be vastly underestimated. Secondly, we introduce the White-Noise (WN) Paradigm, based on linear-systems analysis (Marmarelis & Marmarelis, 1978) and reverse correlation methods (Ringach & Shapley, 2004) which are used to characterize the systematic relationship between visual stimulation and brain response, i.e. the impulse response function (IRF). This approach has 5
7 been applied to EEG to measure evoked potentials (VESPA, Lalor, Pearlmutter, Reilly, McDarby, & Foxe, 2006) or to reveal "perceptual echoes" (VanRullen & Macdonald, 2012). Once extracted, a simple convolution with these IRFs can be used to model the brain s EEG response to any new WN sequence presented (Ringach & Shapley, 2004). Within these new WN sequences, we also embedded near-perceptual threshold targets, which had a medium gray luminance level with the same properties as any other frame in the sequence. Accordingly, they did not affect the convolution result. Thus, we effectively removed the target-evoked response from our signal, and only modeled the background oscillations. Therefore, we could measure the real latency at which this background oscillatory phase impacts visual perception. Method Measuring phase differences Both the simulation and the experimental paradigm relied on quantifying the phase difference between two conditions, whether simulated or based on the actual behavioral outcome of human observers. To this end, we used the phase opposition sum (POS) measure (VanRullen, 2016a), which relies on the inter-trial phase clustering (ITPC, also phase locking value or factor, Lachaux, Rodriguez, Martinerie, & Varela, 1999; Tallon-Baudry, Bertrand, Delpuech, & Pernier, 1996) and is computed as follows: The ITPC is, for a given time point t, and frequency of interest f, the norm of the complex average across n trials of the vector with unit length and phase φ. Consequently, the POS (VanRullen, 2016a) was computed as the sum of the ITPC for each condition corrected by subtracting the ITPC for the combined conditions, as follows: 6
8 Theoretically, the POS takes values between 0 and 2. A value of 0 arises when phase distributions for each condition are fully random (uniform) or when both conditions have their phases locked to the same angle. A value of 2 represents a perfect phase opposition between the two conditions, that is, all trials with behavioral outcome A have the same phase angle, and all trials with outcome B have the opposite angle (with no ITPC across the entire set of trials). Intermediate POS values reflect a partial phase opposition (a more plausible scenario) in which the phase modulates the probability of outcome A versus B. These theoretical values rely on the assumption that there is a perfect uniform sampling in the phases across all trials. Since this is unlikely to be the case in real experiments, it is better to compare the POS value to a corresponding distribution of surrogates POS values obtained by shuffling the labels between conditions. This will account for any bias in the underlying ITPC across all trials. The POS was computed separately for each dimension of the dataset (time, frequency, channels, and subjects). The strength of the effect was evaluated at each of these dimensions by creating a surrogate distribution of 1000 permuted POS values through shuffling of the labels between conditions (i.e. creating random partitions). The mean and variance of the surrogate distribution were extracted to compute the z-score of the observed POS, which was then transformed into a p-value using the normal cumulative distribution function (see VanRullen 2016a for a description of this method and a comparison with other measures). Section 1 Simulations In a first part, we used simulations of artificial datasets to look at how the ERP shape and frequency content, coupled with the time-frequency decomposition, influenced the latency at 7
9 which a phase difference between two conditions could be detected, depending on the frequency of the phase modulation. Creating artificial datasets To evaluate the full extent of the effect, we systematically varied the frequency at which the phase modulation was inserted from 3.99 Hz to 100 Hz in 24 logarithmically spaced steps. For each of the 24 frequency of interest, 100 artificial datasets (corresponding to the subjects in traditional EEG experiments) were created using an approach similar to that described in VanRullen (2016a). First the background electrophysiological signal was simulated by creating 500 white-noise sequences drawn from a Gaussian distribution with a mu of 0 and a sigma of 10 arbitrary units (Figure 1). These sequences lasted 3 seconds ([-1.5 to 1.5s]) and had a sampling rate of 500 Hz. Figure 1 here Once the artificial datasets had been generated, a phase modulation between two experimental conditions (i.e., trial groups) was artificially created using the phase of the frequency of interest at an arbitrarily chosen time point (40 milliseconds after target onset, see green line in Figure 1). This phase was extracted by filtering the datasets at the frequency of interest and then applying a Hilbert transform. It was then used to assign an experimental condition label to each trial. Each of the two conditions was equally likely to occur overall (i.e. mean probability of outcome A was equal to the probability of outcome B). However, the likelihood of a trial outcome was modulated using a cosine function of the phase angle at the critical time, with a modulation depth (denoted as mod in the following equation) fixed at 0.4 (arbitrarily defined parameters). It was computed as follows: 8
10 In our case, this means that for trials at phase 0, there was a 70% chance of the trial yielding outcome A, while at the phase π, the trial had 70% chance to yield outcome B. Finally, an ERP was added to each trial. Both conditions had an ERP drawn from the same process, which was composed of a P1 and an N1 waves with (arbitrarily defined) parameters. The exact shape of the ERP differed slightly on each trial, as the parameters were drawn from normal distributions with known mean and sigma defined for our purposes as follows (see average representation on Figure 1): the P1 mean amplitude was fixed at 20 units (amplitude sigma of 5) and its mean peak latency at 65 milliseconds (peak latency sigma of 10 milliseconds) with a mean duration of 50 milliseconds (duration sigma of 10 milliseconds). The N1 mean amplitude was fixed at 30 units (amplitude sigma of 10) with a mean peak latency of 155 milliseconds (peak latency sigma of 25 ms) and a mean duration of 130 milliseconds (duration sigma of 25 milliseconds). The scale of the arbitrary units was defined with respect to the standard deviation of the originally generated white-noise signal, equal to 10 units. The final signals with the added ERPs were then used as the artificial dataset to analyze. In the main simulations, Gaussian white-noise, with equal power at all frequencies, was used as a proxy for brain activity, as described above. Using pink noise instead of white noise could be deemed more biologically plausible; however, pink noise (or 1/f) signal is characterized by a power spectrum decreasing as a function of frequency, meaning that differences of signal-to-noise ratio between frequencies could then have confounded our ability to detect phase effects. Nonetheless, we also performed control simulations using pink noise, to verify that the conclusions held with more biologically plausible input data. The same parameters as above were used. These control simulations gave comparable results, which are not presented here for the sake of brevity. 9
11 Extracting the latency of the phase difference Once the final artificial datasets had been created, the time-frequency information was extracted using a wavelet decomposition, varying the numbers of cycles (logarithmically) from 3 cycles at 3Hz to 8 cycles at 100 Hz for each of the 50 (logarithmically spaced) frequency steps. The time course of the phase modulation was evaluated by looking at the time course of significant phase opposition using the p-values extracted (see Measuring phase differences above). For the purpose of these simulations we assume that the rhythmic modulation frequency is known, and we aim to derive the latency of the effect. To this end, we restricted our analysis in time and frequency to an analysis window spanning 800 ms around the true latency of the phase modulation (i.e. from -360 ms to 440 ms) at the actual frequency at which the phase modulation had been introduced in the dataset. For each of the 100 artificial datasets, the time course of significance of the POS was evaluated by only keeping p-values reaching or exceeding a Bonferroni threshold computed so as to correct for multiple comparisons across the 170 time points of the analysis window. This was taken as evidence for a significant phase difference between the two conditions at that particular latency. The time courses for each of the artificial datasets were then aggregated by computing the percentage of the simulated datasets which showed a significant POS at each time point. From this, we also computed the mean latency of the largest cluster for each of the time courses of the 100 datasets as a measure of central tendency. These latencies were then aggregated across all artificial datasets by looking at the confidence intervals for the median of latency of the phase modulation across artificial datasets, using the following formula by McGill, Tukey, & Larsen, (1978), where q1, q2 and q3 are respectively the 1st, 2nd (or median) and 3rd quartile of the distribution and N is the number of artificial datasets. 10

12 We also computed the significance of the temporal distortion effect using a Wilcoxon sign rank test comparing the observed median latency to the true modulation latency of 40 milliseconds, using an alpha level of Section 2 The White-Noise Paradigm In the experimental part, we introduce a paradigm based on linear-systems analysis methods, to help us uncover the true latency at which phase influences perception, avoiding the pitfalls induced by target-evoked responses. Participants, stimuli & procedure Twenty-one subjects (mean age of years, SD: 3.97 years, 23 to 39 years old) took part in the experiment after giving written informed consent. One subject was removed due to technical issues during the EEG recording, thus 20 subjects were analyzed (10 women, 15 righthanded, normal or corrected-to-normal vision, no history of epilepsy). The experiment consisted of two testing sessions of about 1 hour each, composed of 8 blocks of 48 white-noise (random luminance) sequences (WN). Each WN sequence lasted 6.25 seconds and had, on average, a flat power spectrum between 0 and 80 Hz. They were presented in a peripheral disk at 7 of visual angle from fixation point and subtending 7 of visual angle on a cathode ray monitor (resolution of 640 by 480 pixels and refresh rate of 160 Hz) situated 57 cm from the chin rest. In both sessions, participants had to detect near-perceptual threshold targets embedded in the stimuli sequences. In each trial, there were 2 to 4 targets composed of a lighter disk at the center with a darker surrounding annulus. They were presented within the peripheral flashing disk on a medium gray background disk for 1 frame only. The mean luminance of the target 11
13 was always a medium gray, identical to the mean gray level of the white noise sequence; only the contrast within the target was manipulated. A staircase procedure was carried out over the first 100 targets (i.e. ~30 trials) of each session using the quest function (Watson & Pelli, 1983) in the PsychToolBox (Brainard, 1997). The contrast between the darker annulus and the lighter inner circle was adjusted to converge to the luminance contrast at which people perceived 50% of targets on average. This contrast was then kept for the remainder of the session. Session 1 data revealed that the visibility of the target was influenced by immediately surrounding luminance values (see Classification Image ). This influence could have masked the (potential) effect of oscillatory phase. Therefore, in session 2 we decided to remove any luminance fluctuations around targets, setting 14 frames before (i.e ms) and 11 frames after (i.e ms) the target to the same medium gray value. Using a similar design and protocol, we ran a control experiment to assess whether the fluctuation-free periods could be used by subjects (N=6) to detect the targets. The only difference was that for 1/3 rd of the suppressed luminance time windows no targets was presented, creating catch trials of sorts. As with the main experiment, any button press after a target (from 150 ms to 800 ms) was counted as a hit. The same response window was used for catch trials: any button press within this 650 ms time window after the moment where a target would have been was counted as a false detection. The percentage of catch trials where a subject pressed the button was computed, similarly to the percentage of detected targets. Separately, we also assessed the false alarm rates of subjects, i.e. button presses falling outside of response time windows for either presented targets or catch trials. To get an estimate of the false alarm rate that is comparable with the other detection rates, we counted the number of 650 ms long time windows outside of target times and divided the number of false alarms by this number. 12
14 EEG recording and pre-processing During the first session, the EEG to white-noise sequences was recorded using a 64- channels Biosemi system (1024Hz sampling rate) with 3 external ocular channels recording the electro-oculogram. Only the behavioral responses (to new white-noise sequences) were recorded in the second session. The pre-processing of the EEG data from session 1 was carried out using the EEGlab toolbox (Delorme & Makeig, 2004) in Matlab, with the following steps : 1) rejection and interpolation of noisy channels if necessary, 2) down-sampling of the EEG signal to 160 Hz to match the presentation rate of stimuli and thus facilitate the cross-correlation of the two signals, 3) notch filtering (between 47 to 53 Hz) to remove any artifacts due to power line, 4) average-referencing, 5) high-pass filtering (1Hz) to remove any drifts in the signal, 6) creating epochs from -0.25s to 6.5s around each WN sequence, 7) removing the baseline, i.e. the mean activity from -0.25s to 0 before trial onset, 8) manual artifact rejection where whole epochs were removed (as needed) to get rid of eye blinks and muscular artifacts. Once the data had been pre-processed, the impulse response functions (IRF, also called VESPA by Lalor et al. 2006; or perceptual echoes by VanRullen & Macdonald, 2012) were extracted by crosscorrelating the pre-processed EEG data with the WN luminance sequences, yielding 64 IRFs for each of the 20 subjects (one IRF for each EEG channel). These functions were then used to reconstruct the brain activity ( reconstructed EEG ) to the new WN sequences presented in session 2, by convolution of the IRF with the white-noise. The target luminance (medium gray) was included in the WN sequence used to reconstruct the EEG. However, this value was no different from the surrounding values in the sequences, and thus there was no ERP evoked by the target in the reconstructed EEG. In session 2, the same random sequences (different from those in Session 1) were presented to all subjects in a randomized order so as to compare the visibility of the same targets across all subjects. This reconstructed EEG was epoched around each of the 821 presented targets ([-800 ms to +794 ms]). Finally, a wavelet transform was 13
15 applied to extract the oscillatory characteristics of the reconstructed EEG at each frequency band (2 8 cycles, 50 log-spaced frequencies from 3 to 100 Hz). Note that we limited our analysis to frequencies below 80 Hz as our signal was sampled at 160Hz (Nyquist frequency limit). Measuring the phase difference between conditions Further analyses of the phase differences between detected and undetected targets were evaluated only on the reconstructed EEG signals using the phase opposition method (see Measuring phase differences above). Before extracting the z-scores, we computed the grand average POS values (whether real or permuted) by first summing the POS across electrodes and subjects to aggregate information along these dimensions. To increase the robustness, this step was repeated for the surrogate POS by randomly selecting (without replacement) surrogates for each subjects and summing across subjects again, a large number of times, thus yielding grand average POS surrogates values. Using these grand averaged POS values, the z- scores and p-values were then extracted as previously described (see Measuring phase differences above). A false discovery rate (FDR) correction was applied across frequency and time points, using an alpha level of Once a time-frequency region of interest was found, we extracted the topography of the effect by going back to single channel data and summing the phase opposition values across subjects and the time and frequency points composing the largest significant cluster. Here again, to increase the robustness, we randomly selected (without replacement) surrogates for each subject and summed the POS across subjects again. This was carried out times before extracting the z-scores as previously described. Measuring phase dependent performance To evaluate the strength of the effect and compare it with previous reports (Busch et al., 2009), the performance variability attributable to phase changes was computed on the fronto- 14
16 central channel (Fz). The normalized hits ratio was extracted, for each subject and for each of the 11 phase bins as the proportion of hits in each bin, normalized by the mean performance of the subject. These were then averaged across subjects. A cosine fit was applied to the data and the resulting amplitude is reported as the amount of performance modulation for each study. Classification image We sought to test whether the luminance values of the WN sequences at any specific time point around the target time had an impact on perception. To this end, we used the classification image method (Ahumada, 2002), which can help identify which stimuli parameters have an impact on performance. For both sessions, we computed the mean luminance values across trials for hits and missed targets for each subject separately. An independent samples t-test was then applied for each subject to compare the distribution of luminance values for detected versus missed targets. A FDR correction was applied across time and subjects to correct for multiple comparisons in each of the sessions. Evoked response We also wanted to confirm that the reconstructed EEG did not in fact show any sign of an evoked response to the target presented in the WN sequence. We computed the ERP for the EEG recorded in session 1 (as a control) and for the reconstructed EEG for session 1 and session 2. This was done by first removing the baseline activity ([-200 to 0 ms]) to each time course and then averaging the different signals across trials and subjects. Because the signal was visual in nature, we looked at the ERP over the central parieto-occipital channel (POz). Measuring the correlation between recorded EEG and reconstructed EEG To test how well the reconstructed EEG modeled the recorded EEG, we used the data from session 1, for which the recorded EEG was available. First, the total number of trials for 15
 was computed on 90% of trials, and consequently used to reconstruct the EEG for the remaining 10 % of trials.")
17 each subject (which was variable due to artifact rejection) was sub-sampled to the trial count available for the subject with the fewest trials. Then, using a 10-fold cross-validation strategy, the model (i.e. IRF) was computed on 90% of trials, and consequently used to reconstruct the EEG for the remaining 10 % of trials. This reconstructed EEG was then correlated (using the Pearson correlation) with the EEG actually recorded on the remaining 10% of (independent) trials. This ensured that both the recorded and reconstructed EEG were available for the same sets of trials, while avoiding any circularity in the analysis: using the same trials to compute the IRF and the reconstructed EEG could have led to spuriously high correlations between reconstructed and recorded EEG. Moreover, this also reduced the influence of a sampling bias: using a cross-validation strategy in correlating the signals allowed us to get a better estimate of the true underlying correlation between the two signals. We also tested whether the EEG modeled using the IRF was more accurate for certain frequency bands by correlating the two signals (with the same cross-validation approach) filtered in 5 different frequency bands (FIR filter, delta: 2 4 Hz; theta: 4-8 Hz; alpha: 7 14 Hz; beta: Hz; gamma: Hz). Since the correlation coefficients were not normally distributed (as revealed by a onesample Kolmogorov-Smirnov test), a Fisher Z transform was applied to the data. It was computed as follows: Consequently, the mean transformed coefficients across all repetitions were extracted for each subject and channel and a one sample t-test against zero was applied. The p-values were corrected for multiple comparisons using a FDR correction across channels. To extract the correlation coefficient values for plotting purposes, the inverse Fisher z-transform was 16
18 applied. Only the correlation coefficients at the strongest channel are presented across subjects. Note that using a non-parametric test (instead of a Fisher Z transform and a t-test) gave equivalent results. As a comparison, we also tested how much of the variability in the signal could be explained by the event related potential (ERP) to the target embedded in white-noise. Here, we used target ERPs (rather than IRF) as a model for the target-evoked activity. Finally, for comparison purposes, we also wanted a measure of how noisy EEG data normally is (i.e., in typical ERP paradigms without ongoing white noise sequences). We tested this using a separate dataset from Busch and colleagues (2009), in which isolated targets were presented on a static background. The target-evoked ERP was again used as a model of evoked EEG activity. In both conditions (ERPs from targets embedded in white noise; ERPs from isolated targets), the ERPs were extracted on 90% of the trials and then convolved with a sequence of target onsets for the remaining 10% of trials, in a 10-fold cross-validation approach. Consequently, the same correlation method between recorded and reconstructed EEG (modeled here by the ERP) was applied as described above for the IRF-based EEG reconstruction model. Results Section 1 Simulations Using artificially created datasets with a true phase modulation introduced at 40 milliseconds after stimulus onset, we evaluated how early a significant phase opposition would be detected. We measured the time course of the p-values of the phase opposition sum (see Methods), aggregated across 100 simulated datasets (for more reliability). In particular, we tested various frequencies of phase modulation from 4 to 100 Hz to see if this factor influenced the latency at which a significant effect could be measured. 17
19 Figure 2 here At all frequencies of phase modulation, we did find evidence for a phase difference between conditions (as expected given that this phase modulation had been explicitly introduced in each dataset). But at frequencies of the phase modulation below 30 Hz, the observed phase modulation appeared to peak well before the true latency of the phase modulation. At lower frequencies (roughly below 20 Hz, Figure 2A), this effect was even visible in the pre-stimulus time window. This temporal displacement seemed to be frequency dependent: the lower the frequency, the earlier the phase modulation was detected (Figure 2A). In fact, the median latency of observed phase opposition effects was significantly different (Wilcoxon sign rank test) from the true phase modulation (at 40 milliseconds) at all frequencies between 3.99 Hz and 39.44Hz. At 3.99 Hz, the median measured phase modulation latency peaked at -143 milliseconds in the pre-stimulus window (95% CI: [-151 ms to -135 ms]). At Hz, the median latency of the effect was at milliseconds, i.e. 3 milliseconds prior to the true effect (95% CI: [35 ms to 39 ms]). At frequencies higher than 40 Hz, the median latency of the observed phase modulations effects was not significantly different from the true latency. Interestingly, these temporal displacements seemed to be closely linked to the timefrequency content of the ERP: the latencies at which the phase difference could be measured were pushed back in time by an amount commensurate with the temporal spread of ERP spectral power at the corresponding frequency (Figure 2B). As a matter of fact, when the ERP was removed from the simulated data, and all the analyses were performed again, the median latency of the phase modulation was not shifted (Figure 2C). The only effect seen in this case was a smearing around the true latency of the phase modulation due to the window-based timefrequency decomposition. In fact, this smearing of information can account for the specific shape of the temporal displacement created by the ERP: there is a strong correlation (Pearson 18
20 correlation, r = 0.81, p<0.05, 95% ci for r = to 0.827) between the error in the measured latency of the phase modulation effects (figure 2A) and the length of the window function at that frequency. Here the smearing had a chimney-like shape typical of wavelet analysis: the smear of information varied from 750 milliseconds at lower frequencies (at 4 Hz: window function of 3 cycles of 250 ms each) to 80 milliseconds at the highest frequency (100 Hz) around the region of interest. The absence of latency distortion in the absence of ERP confirms the notion that it is the stimulus-evoked activity (and its temporal smear caused by any windowbased time-frequency decomposition) that is likely responsible for the prevalence of EEG phase modulations reported to peak in the pre-stimulus time-window in the relevant literature (see VanRullen 2016b for a review). We showed that a phase difference between the two conditions in our artificially created datasets could be measured well before the latency at which the actual phase modulation was introduced. This temporal displacement could be quite dramatic at lower frequencies, with peak effects being apparently pushed by almost 200 milliseconds. It was evident that the timefrequency content of the ERP was responsible for this apparent shift for at least two reasons: first, the measured latency of the phase modulation directly followed the left edge of the timefrequency content of the ERP (Figure 2B); second, the temporal displacement disappeared when the analysis was replicated without an ERP (Figure 2C). Our simulations highlight a large uncertainty regarding the latency of EEG phase modulation. Importantly, this uncertainty is expected whenever ERPs are present and signal filtering is used, and would appear to be unavoidable for any experimental measure of phasedependent perception. Is there a way, then, of uncovering the true latency at which ongoing phase affects stimulus detection? 19
21 Section 2 The White-Noise Paradigm Here, we sought to experimentally investigate the time-course of phase effects using the white-noise (WN) paradigm, i.e. using WN sequences to constrain ongoing brain oscillations in a predictable manner. The IRF can serve to model the relationship between fluctuations of luminance values in the sequence and the brain response at different delays (see Figure 3; Lalor et al., 2006; Ringach & Shapley, 2004; VanRullen & Macdonald, 2012). It is extracted by crosscorrelating WN sequences with the concurrently recorded EEG. These IRFs can then be used to reconstruct the brain activity to any new WN sequences presented. This reconstruction was done by convolving the IRFs with the new WN sequences presented in the second session (see Figure 3). We call this signal the reconstructed EEG: a model of the brain activity in response to the white-noise sequences. Figure 3 here Before investigating the time course of phase effects, we verified that our new paradigm met specific requirements. First, we sought to quantify the correlation between the modeled brain activity (the reconstructed EEG) and the real data (recorded EEG). Correlating the reconstructed and recorded EEG We first quantified the similarity between the recorded EEG (in session 1) and the EEG reconstructed using the IRF as a model of the background activity in the EEG. This was achieved by correlating the two signals using a 10-fold cross-validation approach: the IRF was computed on 90% of trials, and then used to model the EEG response for the remaining 10% of trials, which we then correlated with the recorded EEG. Figure 4 here 20
22 A one-sample t-test revealed that the distribution of the mean (z-transformed) correlation coefficients using the raw signal was significantly different from 0 on all channels, with the mean correlation coefficient across subjects reaching a maximum on electrode Oz with a r of (t(19) = 7.78, p=2.51*10-7, 95% CI for r = ). We also investigated whether filtered signals would yield a better correlation depending on the frequency band. We found that the correlation strength was strongest for the alpha band on channel Oz (mean r = 0.163, t(19) = 8.21, p=1.14*10-7, 95% CI for r: ), closely followed by the theta band on channel POz (mean r = 0.125, t(19) = 13.69, p=2.69*10-11, 95% CI for r: to 0.144). The other frequency bands had lower correlation coefficients, with respectively a mean r of (channel POz) for the delta band (t(19) = 7.28, p = 6.60*10-7, 95% CI for r: to 0.075), a mean r of (on channel Oz) for the beta band (t(19) = 7.80, p=2.42*10-7, 95% CI for r: to 0.090) and a mean r of (on channel POz) for the gamma band (t(19) = 6.16, p=6.37*10-6, 95% CI for r: to 0.037). In order to better evaluate the quality of our EEG reconstructions, we decided to run two control analyses, as a basis for comparison. First, we wanted to know how much of the variability in the signal could be explained using the event related potential (ERP) instead of the IRF as a model of the EEG activity to targets presented in white-noise (see Methods, Measuring the correlation between recorded and reconstructed EEG for details). Using the ERP as a model for target evoked activity led to a correlation strength on par with that obtained using the IRF as a model of background activity. The correlation coefficient reached its maximum across subjects over the left central parietal channel (CP1) with an r of (t(19) = 10.92, p=1.25*10-9, 95% C.I. for r = to 0.118, see targets in WN, Figure 4). Secondly, we also evaluated the amount of signal variability that can be explained by the ERP to isolated targets in a more typical visual-evoked potential paradigm (i.e., without the concurrent white noise stimulation), using the data from Busch and colleagues (2009). This was done as a way 21
23 to estimate the noise in a typical EEG setting, for comparison purposes. A one-sample t-test revealed that the distribution of the mean (z-transformed) correlation across subject reached a maximum over channel (Pz) with an r of (t(13)=9.57,p=2.97*10-7, 95% C.I. for r: to 0.141, see isolated targets in Figure 4). In conclusion, using the IRF as a model for reconstructing the EEG is a useful, though far from perfect (i.e. r<0.2), characterization of the recorded EEG; although the obtained EEG reconstruction was clearly noisy, the reconstruction error was not much higher than that observed with ERP-based models of target-evoked activity. Behavioral results In both sessions, the participants had to detect targets embedded in the WN luminance sequences. The contrast of the target with regard to its medium gray background was adjusted to achieve 50% performance at the beginning of the experiment. The mean hit rate across the 20 participants for session 1 was 50.38% (SD: 9.17%) and % (SD: 10.88%) for session 2. For both sessions, the false alarm rate was relatively low with a mean false alarm rate of 1.65% (SD: 1.35%) and 1.65% (SD: 1.49%) for sessions 1 and 2 respectively. A control experiment revealed that the suppressed luminance fluctuations could not be used by subjects to detect the targets. The mean response rate to catch trials across subjects (i.e. suppressed luminance without targets presented) of 8.94% was not significantly different from the mean false alarm rate of 6.30% (Student s t-test, p=0.646). Moreover, both were much lower than the mean detection rate across subjects of 52.80% (Student s t-test, p<0.002). A classification image analysis of the data from session 1 showed that the luminance values immediately surrounding the target had a large impact on target detection. Systematically, higher luminance values just before and after the target led to decreased visibility while lower luminance values lead to increased visibility (see Figure 5B). In session 1, all 20 subjects showed a significant difference in the mean luminance values between 22
24 detected and missed target trials (independent sample t-test for each subject, with FDR correction, all 20 peak p-values below p<0.0008), and this difference affected at least 3 separate time points for all subjects (see Figure 5B). For this reason, we decided to remove luminance fluctuations around the target. In the second session, 87.5 ms (i.e. 14 frames) before the target and ms (i.e. 11 frames) after the target were replaced with medium gray values (see Figure 5A), the same medium gray used as the target s background. In session 2, this manipulation effectively cancelled the apparent masking or facilitation effects observed in session 1 (see Figure 5B): 18 of the 20 subjects showed no significant luminance difference between hits and misses at any time point; the remaining 2 subjects showed a significant difference at only a single time point. Note that we also verified that all results described in the following section (i.e., Figure 6) remained valid when these two subjects were discarded from the analysis. Figure 5 here The major advantage of using reconstructed EEG for our purposes is that there is no evoked response to the targets embedded in the stimulation sequences. This is because the luminance of the target frame (medium gray), which is taken into account when the convolution is done, is identical to the luminance of the surrounding frames. In other words, the presence of the target is invisible to the EEG reconstruction process (convolution). In fact, we can see that there is no evoked ERP to the target in the reconstructed EEG for session 2 (see Figure 5C). Latency of measured phase modulation effects in the absence of ERP Because the reconstructed EEG is virtually blind to the presence of target-evoked activity, we can estimate the background or ongoing signals around the time of target presentation. Thus, we can causally investigate the dynamics of the ongoing oscillations influence on perception, without having to restrict our analysis to the pre-stimulus window due to evoked response contamination. 23
25 Figure 6 here We applied a standard procedure to evaluate the oscillatory phase opposition between groups of trials in which the target was detected versus missed (VanRullen, 2016a); but in this case, the input data was the reconstructed EEG (obtained by convolution with the IRF) rather than an actually recorded EEG signal. The phase of ongoing oscillations in the theta band (~6Hz) seemed to be significantly different for detected versus missed targets, compatible with findings from previous studies (Busch et al, 2009). However, here the largest effect was present at about 75 ms after target onset (p = *10-6, Figure 6A). A scalp topography revealed that phase opposition was maximal over frontal and occipital channels (see Figure 6B). We then evaluated the amount of performance modulation that could be explained by the ongoing oscillatory phase at the peak of significance (i.e. 6Hz and 75 ms), by looking at the normalized hits rate averaged across subjects for electrode Fz (see Method). We found that the phase accounted for 11.62% of the performance modulation (see Figure 6C, left hand side). As a comparison, the results from Busch and colleagues (2009) have also been replotted here. In that experiment, after realigning phase bins across subjects to align maximal performance at zero phase (a procedure which was unnecessary in the present experiment), the ongoing EEG phase at 7Hz, -120 ms before stimulus onset explained 15.62% of the performance fluctuations (see Figure 6C, right hand side). To summarize, in this experiment we presented a method to study the dynamics of ongoing oscillations influence on perception, through the use of white-noise sequences. We found that the phase of theta band ongoing oscillations is causally linked to the detection of nearperceptual threshold targets. This rhythmic influence of theta oscillations extended in time up to 200 milliseconds after target onset, but was the largest at about 75 milliseconds post-stimulus and could explain up to ~12% of the performance modulations. 24
26 Discussion In this paper, we sought to reconcile the apparent gap between pre-stimulus EEG phase effects reported in the literature and the idea of phase as actively shaping perception. In a first section, we used simulations to show that a phase modulation, artificially introduced 40 milliseconds after stimulus onset, could be reliably detected in the pre-stimulus period. This depended on the ERP time-frequency content. In fact, we found that, at lower frequencies, the peak phase difference between conditions happened up to 200 milliseconds before the true phase modulation. The measured latencies for a phase modulation introduced at 7.08Hz are consistent with the results of Busch and colleagues (2009), who found an effect of the ~7Hz EEG phase on the detection of near-threshold peripheral stimuli about -120 ms before stimulus onset. Of note, the 7.08 Hz simulation resulted in a median latency of -79 milliseconds (95% CI: ms to ms) with 48/100 simulated datasets having a significant POS at -120 ms. Turning our result around, the pre-stimulus latency observed by Busch et al. (-120 ms) could in fact be compatible with the notion that the critical phase for stimulus detection was the phase that occurred during (rather than before) stimulus processing. It is important to highlight that the latencies reported here via simulations should not be used as a definite guide to determine the latency of the true phase modulation in a new EEG experiment. This cannot be done, because various parameters in the new EEG experiment would differ from those used in our simulations, such as the exact ERP shape on each trial, the parameters of the filters used, or the true latency at which the phase modulation occurs in the brain. All these could have a large impact on the measured latency of the phase modulation. In 25
27 other words, this simulation was only intended as a proof of concept and cannot serve as an exhaustive or quantitative evaluation. The implications of our simulations are twofold. First, any study of phase modulation of perception involving sizeable stimulus-evoked activity (that is most, if not all, studies) should be susceptible to temporal distortions of the oscillatory phase effects. Second, the numerous previous reports of pre-stimulus phasic influences on perception (such as Busch et al., 2009; Mathewson et al., 2009) may still be compatible with a true latency of phase modulation at or even after the stimulus onset. Although the evoked activity leads to a temporal distortion of oscillatory activity, the true latency of phase modulations cannot be retrieved, in our case, by simply subtracting the stimulus-evoked activity (i.e., the ERP) from the EEG signal although this approach has been successfully used in other studies (e.g. see Tallon-Baudry & Bertrand, 1999 for a review) to untangle the relative contribution of evoked (i.e. phase locked) and induced oscillations (i.e. non-phase locked). In our case, the postulated phase modulation effects are actually phaselocked to the stimulus onset (i.e., we hypothesize that all hits tend to show a similar oscillatory phase relative to stimulus onset, and likewise for the misses). Subtracting condition-specific ERPs from each trial would effectively flatten any systematic phase differences between the two groups. On the other hand, simply subtracting the common ERP for hits and misses from single-trial data is also not a viable option, because it is likely to introduce artefactual phase opposition when the ERPs between conditions differ. In a second section, we presented an experimental method based on linear-systems analysis methods (Lalor et al., 2006; Ringach & Shapley, 2004; VanRullen & Macdonald, 2012): the white-noise paradigm. This paradigm effectively allows us to by-pass the effects of the target-evoked ERP. Thus, we could estimate, for the first time, the true latency at which 26
28 ongoing EEG oscillations influence perception. Using the EEG impulse response function (VanRullen & Macdonald, 2012) to white-noise luminance sequences, we reconstructed (rather than recorded) the brain activity of subjects to new sequences, by convolving the IRF with the stimuli sequences. The reconstructed EEG allowed us to estimate the ongoing (background) oscillations before and after each presented target without the evoked response which could have biased our ability to measure the phase modulation (as shown in our simulations). We found that the reconstructed EEG is a (relatively) good model of the recorded EEG: the two signals were significantly correlated, with the highest correlation in the alpha and theta bands. The coefficients were relatively small, meaning that at most r 2 = = 3.4% (at the maximum channel in the alpha band) of the variance of the EEG signal was driven by the luminance sequence in a way that we could predict with the IRFs. On the one hand, it might seem that this is a very small amount of variance explained. For example, using a similar approach, Kayser and colleagues (2015) predicted the stimulus-driven response of neurons to auditory stimulation (Kayser, Wilson, Safaai, Sakata, & Panzeri, 2015). They constructed various models of spike production based on linear spatio-temporal response filters, but also added various non-linear factors on the prediction (Kayser et al., 2015). The best model, which included phase dependent variations in the sensory gain and the background firing of cells, could explain up to 30% of the variance (r²) in the original signal. This increase of variance explained (relative to the present findings) can be attributed to the method used: LFP and MUA recordings are less subject to noise than scalp measurements like EEG. In fact, Lalor (2009), who also evaluated correlation strength between reconstructed and recorded EEG using the VESPA as a model for brain activity, found correlation values similar to ours: he reported a mean correlation coefficient of over channel Oz (Lalor, 2009). Moreover, using a non-linear (quadratic) model for the VEP only marginally improved the amount of signal explained by the model (mean r across subjects of 0.097; Lalor, 2009). 27
29 On the other hand, it is important to remember, that EEG is a noisy method of recording, especially when looking at single-trial data (Picton et al., 2000). The small amount of signal variability explained in the present and Lalor s experiments (Lalor, 2009) might thus be due to the inherently noisy nature of EEG recordings. The rest of the EEG signal variance could reflect other cognitive functions (such as endogenous attention or arousal levels) or noise in the system, in the EEG recording or in the EEG reconstruction procedure. Of more interest is the fact that the IRF-based models reported here are on par with ERP-based models, explaining just as much variability in the signal, if not more. ERPs are however routinely used in experiments and considered a meaningful measure of brain activity. Finally, despite the apparently small percentage of variance of the original EEG signal explained in our study, it could well be that this small portion of the signal is the only oscillatory activity whose phase actually modulates visual perception. In other words, we may only be able to predict a small portion of the recorded EEG signal, but our prediction was sufficiently accurate to capture most of the existing relation between EEG oscillatory phase and perception (see Figure 6C, about 12% modulation in our case, compared with 16% modulation in the study by Busch et al, 2009). Using the reconstructed EEG, we found that the phase of theta (~6Hz) oscillations was related to the detection of near-perceptual threshold targets, as suggested before by Busch and colleagues (Busch et al., 2009). But crucially, the phase between detected and missed targets was significantly different from 50 ms to 150 ms after stimulus presentation, with a peak at 75 ms over fronto-occipital channels. This new approach thus allowed us to uncover the true latency at which ongoing EEG oscillatory phase influences visual target detection. This could not be done before, as the presence of the ERP usually biases the detection of phase effects towards pre-stimulus time-windows, as demonstrated in the first section. This, however, is not a problem within the present approach because only the ongoing oscillations are modeled, not the ERP. 28
30 This paradigm allowed us to explore the true latency of the effect of oscillatory phase, unbiased by evoked responses, but it also opens up a wide range of avenues of investigation. For example, it would be possible to investigate the effect of stimulus-driven ongoing oscillation amplitude on perception. In particular, this could help us untangle the contributions from stimuli driven versus top-down driven oscillations in different tasks. Indeed in our paradigm, only the ongoing oscillations directly driven by the stimuli are modeled, and thus we could evaluate their influence on performance, and compare this to the performance modulation of actually recorded EEG activity, in which top-down effects are also present. Interestingly, this paradigm can also provide a bridge between EEG findings and other findings linking spiking activity to ongoing oscillations at the level of local neuronal populations. If the oscillations reflect the excitatory state of the population, the phase that should matter is the one expressed in the cortex at the exact moment when the stimulus information is processed. In fact, our results support this hypothesis. Further, our study lends support to the hypothesis that perception is rhythmic, and that ongoing oscillatory phase marks the underlying sampling mechanism of the environment. Here the phase of the reconstructed EEG influences perception in a causal manner: it shapes our visual world as soon as the target enters the brain. 29
31 References Ahumada, A. J. (2002). Classification image weights and internal noise level estimation. Journal of Vision, 2(1), Brainard, D. H. (1997). The Psychophysics Toolbox. Spatial Vision, 10, Busch, N. A., Dubois, J., & VanRullen, R. (2009). The phase of ongoing EEG oscillations predicts visual perception. The Journal of Neuroscience, 29(24), Busch, N. A., & VanRullen, R. (2010). Spontaneous EEG oscillations reveal periodic sampling of visual attention. Proceedings of the National Academy of Sciences, 107(37), Callaway, E., & Yeager, C. L. (1960). Relationship between Reaction Time and Electroencephalographic Alpha Phase. Science, 132, Chakravarthi, R., & VanRullen, R. (2012). Conscious updating is a rhythmic process. Proceedings of the National Academy of Sciences, 109(26), Delorme, A., & Makeig, S. (2004). EEGLAB : an open source toolbox for analysis of singletrial EEG dynamics including independent component analysis. Journal of Neuroscience Methods, 134, Drewes, J., & VanRullen, R. (2011). This Is the Rhythm of Your Eyes: The Phase of Ongoing Electroencephalogram Oscillations Modulates Saccadic Reaction Time. Journal of Neuroscience, 31(12),
32 Dugué, L., Marque, P., & VanRullen, R. (2011). The Phase of Ongoing Oscillations Mediates the Causal Relation between Brain Excitation and Visual Perception. The Journal of Neuroscience, 31(33), Fries, P. (2005). A mechanism for cognitive dynamics: neuronal communication through neuronal coherence. Trends in Cognitive Sciences, 9(10), Fries, P., Schröder, J.-H., Roelfsema, P. R., Singer, W., & Engel, A. K. (2002). Oscillatory neuronal synchronization in primary visual cortex as a correlate of stimulus selection. The Journal of Neuroscience, 22(9), Haegens, S., Barczak, A., Musacchia, G., Lipton, M. L., Mehta, A. D., Lakatos, P., & Schroeder, C. E. (2015). Laminar Profile and Physiology of the alpha Rhythm in Primary Visual, Auditory, and Somatosensory Regions of Neocortex. The Journal of Neuroscience, 35(42), Haegens, S., Nácher, V., Luna, R., Romo, R., & Jensen, O. (2011). α - Oscillations in the monkey sensorimotor network influence discrimination performance by rhythmical inhibition of neuronal spiking. Proceedings of the National Academy of Sciences, 108(48), Hanslmayr, S., Volberg, G., Wimber, M., Dalal, S. S., & Greenlee, M. W. (2013). Prestimulus oscillatory phase at 7 Hz gates cortical information flow and visual perception. Current Biology, 23(22), Jacobs, J., Kahana, M. J., Ekstrom, A. D., & Fried, I. (2007). Brain Oscillations Control Timing of Single-Neuron Activity in Humans. Journal of Neuroscience, 27(14),
33 Kayser, C., Wilson, C., Safaai, H., Sakata, S., & Panzeri, S. (2015). Rhythmic Auditory Cortex Activity at Multiple Timescales Shapes Stimulus-Response Gain and Background Firing. Journal of Neuroscience, 35(20), Lachaux, J., Rodriguez, E., Martinerie, J., & Varela, F. J. (1999). Measuring Phase Synchrony in Brain Signals. Human Brain Mapping, 8(4), Lakatos, P., Karmos, G., Mehta, A. D., Ulbert, I., & Schroeder, C. E. (2008). Entrainment of neuronal oscillations as a mechanism of attentional selection. Science, 320(5872), Lakatos, P., Shah, A. S., Knuth, K. H., Ulbert, I., Karmos, G., & Schroeder, C. E. (2005). An Oscillatory Hierarchy Controlling Neuronal Excitability and Stimulus Processing in the Auditory Cortex. Journal of Neurophysiology, 94, Lalor, E. C. (2009). Modeling the human visual system using the white-noise approach. In Proceeding of the 4th International IEEE/EMBS Conference on Neural Engineering (pp ). Lalor, E. C., Pearlmutter, B. A., Reilly, R. B., McDarby, G., & Foxe, J. J. (2006). The VESPA: a method for the rapid estimation of a visual evoked potential. NeuroImage, 32(4), Marmarelis, P.., & Marmarelis, V. Z. (1978). The White Noise Method of System Identification. In Analysis of physiological systems: the white-noise approach. New York: Plenum Press. 32
34 Mathewson, K. E., Gratton, G., Fabiani, M., Beck, D. M., & Ro, T. (2009). To See or Not to See: Prestimulus Alpha Phase Predicts Visual Awareness. The Journal of Neuroscience, 29(9), McGill, R., Tukey, J. W., & Larsen, W. A. (1978). Variations of Box Plots. The American Statistician, 32(1), McLelland, D., Lavergne, L., & VanRullen, R. (2016). The phase of ongoing EEG oscillations predicts the amplitude of peri-saccadic mislocalization. Scientific Reports, 6, Nunn, C. M., & Osselton, J. W. (1974). The influence of the EEG alpha rhythm on the perception of visual stimuli. Psychophysiology, 11(3), Picton, T. W., Bentin, S., Berg, P., Donchin, E., Hillyard, S. A., Johnson, R., Taylor, M. J. (2000). Guidelines for using human event-related potentials to study cognition: Recording standards and publication criteria. Psychophysiology, 37(2), Ringach, D., & Shapley, R. (2004). Reverse correlation in neurophysiology. Cognitive Science, 28(2), Tallon-Baudry, C., & Bertrand, O. (1999). Oscillatory gamma activity in humans and its role in object representation. Trends in Cognitive Sciences, 3(4), Tallon-Baudry, C., Bertrand, O., Delpuech, C., & Pernier, J. (1996). Stimulus Specificity of Phase-Locked and Non-Phase-Locked 40 Hz Visual Responses in Human, 16(13),
35 VanRullen, R. (2011). Four common conceptual fallacies in mapping the time course of recognition. Frontiers in Psychology, 2, VanRullen, R. (2016a). How to evaluate phase differences between trial groups in ongoing electrophysiological signals. Frontiers in Neuroscience, 10, VanRullen, R. (2016b). Perceptual Cycles. Trends in Cognitive Sciences, 20(10), VanRullen, R., & Koch, C. (2003). Is perception discrete or continuous? Trends in Cognitive Sciences, 7(5), VanRullen, R., & Macdonald, J. S. P. (2012). Perceptual echoes at 10 Hz in the human brain. Current Biology, 22(11), Watson, A. B., & Pelli, D. G. (1983). QUEST: a Bayesian adaptive psychometric method. Perception & Psychophysics, 33(2), Figure Legends Figure 1 Illustration of artificial datasets creation for the simulation. The artificial signal was initialized using white-noise drawn from a Gaussian distribution with mu 0 and sigma 10 arbitrary units. This random data was then band-pass filtered at the frequency of interest plus or minus 1 Hz, and a Hilbert transform was applied to extract the phase at 40 ms after time 0, the time of target presentation. The phase angle at this time was then used to separate the trials between outcome A and B, with a given probability following a cosine function. Finally, an outcome independent ERP waveform (with slight random variations between trials) was added to each trial s signal to create the final artificial dataset. 34
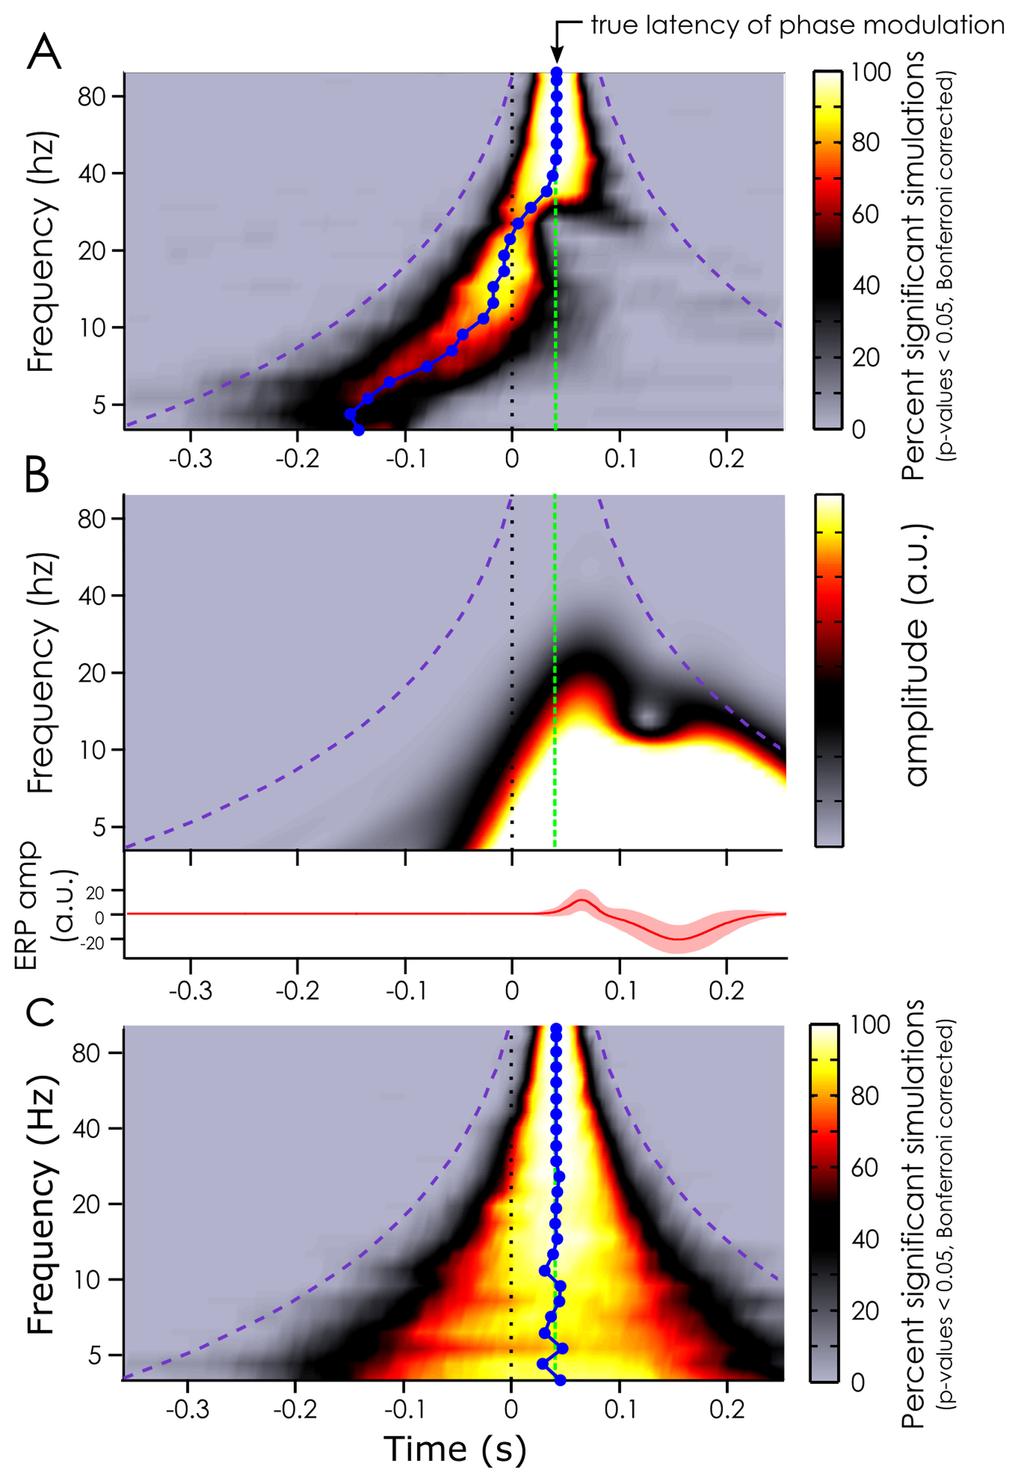
36 Figure 2 Simulation results. A. Median latency (blue line) at which phase modulation effects can be measured depending on the frequency of the phase modulation introduced at 40 milliseconds (true latency represented by the green dashed line) when the ERP is included in the artificial datasets. The color bar indexes the percentage of significant datasets at each time point after Bonferroni correction. The purple dashed line represents the outer edge of the window function (Morlet wavelets). B. Representation of the evoked response (lower panel) included in the artificial data in panel A, and its timefrequency content (upper panel). The color bar represents the oscillatory amplitude (arbitrary unit) at each frequency and time point. C. Same analysis as in panel A but without ERP included in the artificial datasets. Note the absence of temporal latency distortion in this case. Note also that the temporal smearing created by the window function is slightly shorter than the window duration (i.e., it does not reach the purple line) as Morlet wavelets have Gaussian tapers on either end. Figure 3 White Noise paradigm. The impulse response function (IRF) to white-noise sequences can be extracted by cross-correlating the stimuli sequence with the recorded EEG. Here, an example IRF is shown from one subject on electrode POz. This is what we did in the first session of our experiment. This IRF can, in turn, be used to reconstruct the brain activity (reconstructed EEG) to any new white-noise sequence by convolution. This was done in the second session of the experiment. The stimulus fluctuations around the target were removed in the second session to avoid any target masking by the luminance (see Figure 5). Figure 4 Correlation between reconstructed and recorded EEG. Two models of brain EEG activity were tested: one based on the ERP to targets (left) and the other based on the IRF to white noise sequences (right). In both cases, we systematically correlated the prediction of the model with the single trial recorded EEG. For the ERP models, the isolated targets coefficients are based on the dataset presented in Busch et al. (2009), while the targets in white-noise are from our own dataset, with the ERP extracted relative to the targets embedded in white noise (see figure 5B for an example). For the IRF models, we used the IRF to model the brain response to the white noise sequences, and the correlated reconstructed and recorded EEG data using the raw signals, as well as signals filtered in different frequency bands (delta: 2-4Hz; theta: 4-8Hz; alpha: 7-14 Hz; beta: 14-28Hz; gamma: 30-60Hz). The gray dots represent the mean coefficient for each subject (1 dot per subject) across cross-validation runs at the maximum electrode (red dot on the topographies); the error bars represent the 95% confidence interval of the mean (black dot) coefficient across subjects. The topographies represent the mean correlation coefficients across subjects and cross-validation runs. Shaded areas represent channels not significant after fdr correction. Note the difference of color scales for the beta and gamma correlation coefficients relative to the other topographies. 35
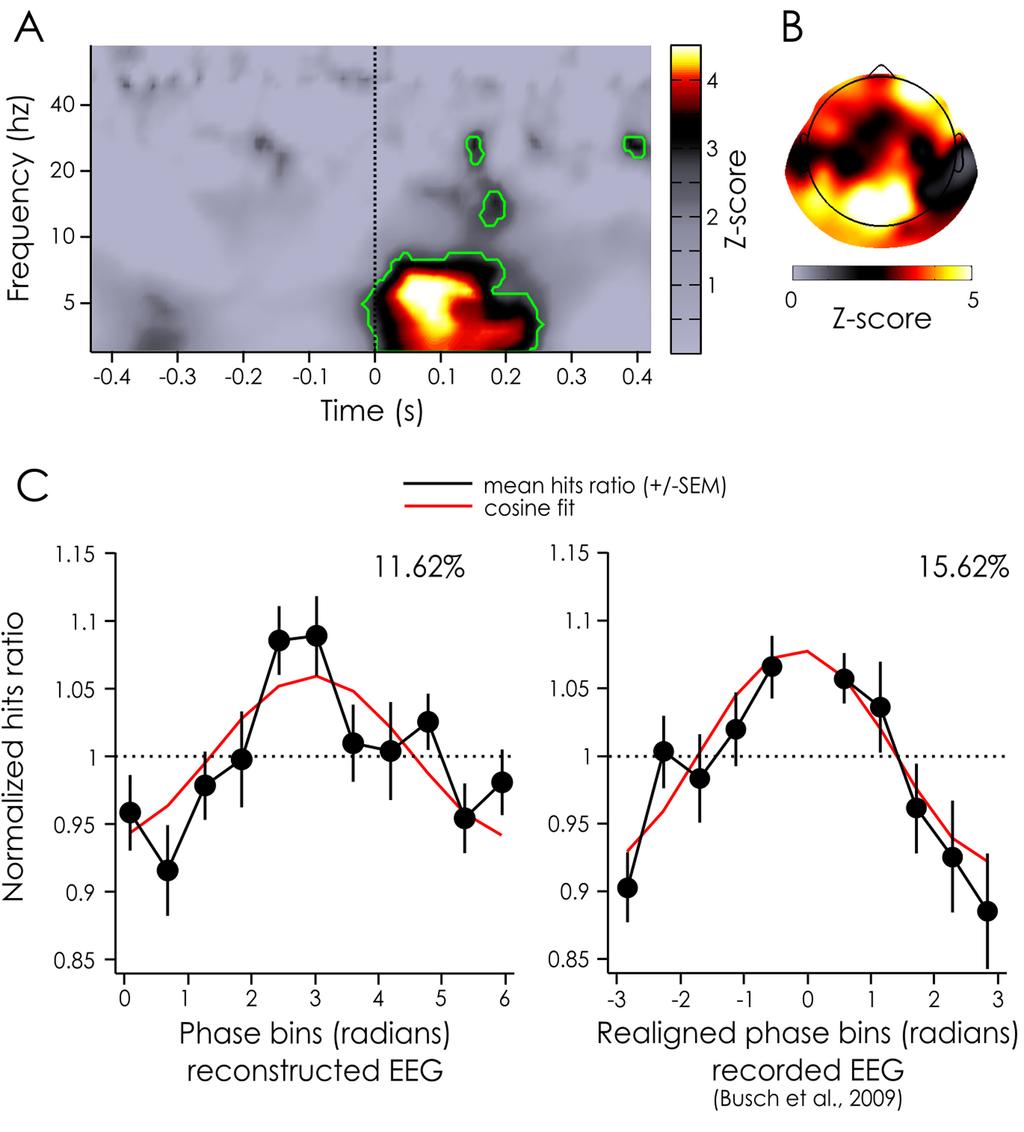
37 Figure 5 Classification Image and Evoked Response. A. Example stimuli sequences for session 1, when the EEG was recorded, and session 2, when only the behavioral response was recorded. The sequences are centered on the embedded target presentation (at t = 0 ms). B. Classification image of the luminance values around the target (at t = 0 ms) for detected (orange) and missed (blue) targets. Darker colors represent the mean across subjects and trials. The lighter shades represent the standard error of the mean across subjects. The dotted line represents target presentation. Note that the same sequences were shown to all subjects in session 2. C. ERP evoked by the detected (orange) and missed (blue) targets embedded within the white-noise sequences. These are computed separately for the recorded EEG for session 1 (top) and the reconstructed EEG for session 1 (middle) and 2 (bottom). Note the absence of visible target-evoked ERP in reconstructed signals for session 2 (bottom). While there seems to be a very strong phase opposition between hits and misses in the reconstructed EEG to session 1, this is likely to be an artifact of the strong relationship between luminance value and behavioral outcome illustrated in panel B, rather than a direct relationship between phase and perception. Darker colors represent the mean across trials and the lighter shades represent the standard error of the mean across subjects. The dotted line represents target presentation. Figure 6 Z-score of POS for the reconstructed EEG and phase dependent performance. A. Z-scores of the POS values aggregated across electrodes and subjects for the reconstructed EEG for each time and frequency point. Significant time points after a FDR correction (alpha = 0.05) are outlined in green. B. Z-scores of the POS values aggregated across subjects for the reconstructed EEG at the frequencies and time points inside the largest significant cluster (from 3 to 8.17 Hz and from ms to 250 ms, see -panel A). C. Normalized hits ratio depending on the phase bin for the reconstructed EEG at the peak significance (left-hand side: 6.1Hz, +75 ms). For comparison, previously published results linking detection performance and pre-stimulus phase of actually recorded (rather than reconstructed) EEG signals are replotted on the right hand-side (7 Hz, ms; taken from Busch et al. 2009). Both phase dependence curves are measured on the same fronto-central channel (Fz). Note that in our experiment the phase bins were not realigned between subjects, but that they were realigned (to produce peak performance at 0 for all subjects) for the experiment by Busch et al. (2009). The black line represents the mean across subjects (left hand side: 20 subjects, right hand side: 14 subjects), the bars represents the SEM, the red line represents a cosine fit, whose modulation amplitude (in %) is noted above the curve. 36
38
39
40
41
42
43
44
45
46
47
Supporting Information
 Supporting Information ten Oever and Sack 10.1073/pnas.1517519112 SI Materials and Methods Experiment 1. Participants. A total of 20 participants (9 male; age range 18 32 y; mean age 25 y) participated
The triple-flash illusion reveals a driving role of alpha-band reverberations in visual perception
 This Accepted Manuscript has not been copyedited and formatted. The final version may differ from this version. Research Articles: Behavioral/Cognitive The triple-flash illusion reveals a driving role
Entrainment of neuronal oscillations as a mechanism of attentional selection: intracranial human recordings
 Entrainment of neuronal oscillations as a mechanism of attentional selection: intracranial human recordings J. Besle, P. Lakatos, C.A. Schevon, R.R. Goodman, G.M. McKhann, A. Mehta, R.G. Emerson, C.E.
From Single-trial EEG to Brain Area Dynamics
 From Single-trial EEG to Brain Area Dynamics a Delorme A., a Makeig, S., b Fabre-Thorpe, M., a Sejnowski, T. a The Salk Institute for Biological Studies, 10010 N. Torey Pines Road, La Jolla, CA92109, USA
EEG-Rhythm Dynamics during a 2-back Working Memory Task and Performance
 EEG-Rhythm Dynamics during a 2-back Working Memory Task and Performance Tsvetomira Tsoneva, Davide Baldo, Victor Lema and Gary Garcia-Molina Abstract Working memory is an essential component of human cognition
Rhythmic influence of top-down perceptual priors in the phase of pre-stimulus occipital alpha oscillations
 Rhythmic influence of top-down perceptual priors in the phase of pre-stimulus occipital alpha oscillations Article (Accepted Version) Sherman, Maxine T, Kanai, Ryota, Seth, Anil K and VanRullen, Rufin
Beyond Blind Averaging: Analyzing Event-Related Brain Dynamics. Scott Makeig. sccn.ucsd.edu
 Beyond Blind Averaging: Analyzing Event-Related Brain Dynamics Scott Makeig Institute for Neural Computation University of California San Diego La Jolla CA sccn.ucsd.edu Talk given at the EEG/MEG course
From single-trial EEG to brain area dynamics
 Neurocomputing 44 46 (2002) 1057 1064 www.elsevier.com/locate/neucom From single-trial EEG to brain area dynamics A. Delorme a;, S. Makeig a, M. Fabre-Thorpe b, T. Sejnowski a a The Salk Institute for
Supplementary materials for: Executive control processes underlying multi- item working memory
 Supplementary materials for: Executive control processes underlying multi- item working memory Antonio H. Lara & Jonathan D. Wallis Supplementary Figure 1 Supplementary Figure 1. Behavioral measures of
EEG Analysis on Brain.fm (Focus)
") EEG Analysis on Brain.fm (Focus) Introduction 17 subjects were tested to measure effects of a Brain.fm focus session on cognition. With 4 additional subjects, we recorded EEG data during baseline and while
EEG Analysis on Brain.fm (Focus) Introduction 17 subjects were tested to measure effects of a Brain.fm focus session on cognition. With 4 additional subjects, we recorded EEG data during baseline and while
ABSTRACT 1. INTRODUCTION 2. ARTIFACT REJECTION ON RAW DATA
 AUTOMATIC ARTIFACT REJECTION FOR EEG DATA USING HIGH-ORDER STATISTICS AND INDEPENDENT COMPONENT ANALYSIS A. Delorme, S. Makeig, T. Sejnowski CNL, Salk Institute 11 N. Torrey Pines Road La Jolla, CA 917,
The effects of subthreshold synchrony on the perception of simultaneity. Ludwig-Maximilians-Universität Leopoldstr 13 D München/Munich, Germany
 The effects of subthreshold synchrony on the perception of simultaneity 1,2 Mark A. Elliott, 2 Zhuanghua Shi & 2,3 Fatma Sürer 1 Department of Psychology National University of Ireland Galway, Ireland.
Rhythmic Influence of Top Down Perceptual Priors in the Phase of Prestimulus Occipital Alpha Oscillations
 Rhythmic Influence of Top Down Perceptual Priors in the Phase of Prestimulus Occipital Alpha Oscillations Maxine T. Sherman 1, Ryota Kanai 1, Anil K. Seth 1, and Rufin VanRullen 2,3 Abstract Prior expectations
Visual Perceptual Echo Reflects Learning of Regularities in Rapid Luminance Sequences
 This Accepted Manuscript has not been copyedited and formatted. The final version may differ from this version. Research Articles: Behavioral/Cognitive Visual Perceptual Echo Reflects Learning of Regularities
Sum of Neurally Distinct Stimulus- and Task-Related Components.
 SUPPLEMENTARY MATERIAL for Cardoso et al. 22 The Neuroimaging Signal is a Linear Sum of Neurally Distinct Stimulus- and Task-Related Components. : Appendix: Homogeneous Linear ( Null ) and Modified Linear
Spontaneous neural oscillations bias perception by modulating baseline excitability
 This Accepted Manuscript has not been copyedited and formatted. The final version may differ from this version. Research Articles: Behavioral/Cognitive Spontaneous neural oscillations bias perception by
Supporting Information
 1 2 3 4 5 6 7 8 9 10 11 12 13 14 15 16 17 18 19 20 21 22 23 24 25 26 27 28 29 30 31 32 33 34 35 36 37 38 39 40 Supporting Information Variances and biases of absolute distributions were larger in the 2-line
Outline of Talk. Introduction to EEG and Event Related Potentials. Key points. My path to EEG
 Outline of Talk Introduction to EEG and Event Related Potentials Shafali Spurling Jeste Assistant Professor in Psychiatry and Neurology UCLA Center for Autism Research and Treatment Basic definitions and
Direct Control of Visual Perception with Phase-specific Modulation of Posterior Parietal Cortex
 Direct Control of Visual Perception with Phase-specific Modulation of Posterior Parietal Cortex Andrew Jaegle 1 * and Tony Ro 1,2 Abstract We examined the causal relationship between the phase of alpha
DATA MANAGEMENT & TYPES OF ANALYSES OFTEN USED. Dennis L. Molfese University of Nebraska - Lincoln
 DATA MANAGEMENT & TYPES OF ANALYSES OFTEN USED Dennis L. Molfese University of Nebraska - Lincoln 1 DATA MANAGEMENT Backups Storage Identification Analyses 2 Data Analysis Pre-processing Statistical Analysis
Changing expectations about speed alters perceived motion direction
 Current Biology, in press Supplemental Information: Changing expectations about speed alters perceived motion direction Grigorios Sotiropoulos, Aaron R. Seitz, and Peggy Seriès Supplemental Data Detailed
The role of amplitude, phase, and rhythmicity of neural oscillations in top-down control of cognition
 The role of amplitude, phase, and rhythmicity of neural oscillations in top-down control of cognition Chair: Jason Samaha, University of Wisconsin-Madison Co-Chair: Ali Mazaheri, University of Birmingham
Pre-stimulus EEG power predicts conscious awareness but not objective visual performance
 This Accepted Manuscript has not been copyedited and formatted. The final version may differ from this version. Research Article: New Research Sensory and Motor Systems Pre-stimulus EEG power predicts
Neuron, Volume 63 Spatial attention decorrelates intrinsic activity fluctuations in Macaque area V4.
 Neuron, Volume 63 Spatial attention decorrelates intrinsic activity fluctuations in Macaque area V4. Jude F. Mitchell, Kristy A. Sundberg, and John H. Reynolds Systems Neurobiology Lab, The Salk Institute,
NeuroSky s esense Meters and Detection of Mental State
 NeuroSky s esense Meters and Detection of Mental State The Attention and Meditation esense meters output by NeuroSky s MindSet are comprised of a complex combination of artifact rejection and data classification
Supporting Information
 Supporting Information Forsyth et al. 10.1073/pnas.1509262112 SI Methods Inclusion Criteria. Participants were eligible for the study if they were between 18 and 30 y of age; were comfortable reading in
Neural Strategies for Selective Attention Distinguish Fast-Action Video Game Players
 Neural Strategies for Selective Attention Distinguish Fast-Action Video Game Players - Online First - Springer 7/6/1 1:4 PM Neural Strategies for Selective Attention Distinguish Fast-Action Video Game
Classification of EEG signals in an Object Recognition task
 Classification of EEG signals in an Object Recognition task Iacob D. Rus, Paul Marc, Mihaela Dinsoreanu, Rodica Potolea Technical University of Cluj-Napoca Cluj-Napoca, Romania 1 rus_iacob23@yahoo.com,
Theta sequences are essential for internally generated hippocampal firing fields.
 Theta sequences are essential for internally generated hippocampal firing fields. Yingxue Wang, Sandro Romani, Brian Lustig, Anthony Leonardo, Eva Pastalkova Supplementary Materials Supplementary Modeling
The Nonhuman Primate as Model System for Mechanistic Studies of Glutamate System Function and Dysfunction
 The Nonhuman Primate as Model System for Mechanistic Studies of Glutamate System Function and Dysfunction FORUM ON NEUROSCIENCE AND NERVOUS SYSTEM DISORDERS Board on Health Sciences Policy Glutamate-related
Birkbeck eprints: an open access repository of the research output of Birkbeck College.
 Birkbeck eprints: an open access repository of the research output of Birkbeck College http://eprints.bbk.ac.uk Kaufman, J.; Csibra G.; and Johnson, M. (2005). Oscillatory activity in the infant brain
Neurophysiologically Driven Image Triage: A Pilot Study
 Neurophysiologically Driven Image Triage: A Pilot Study Santosh Mathan Honeywell Laboratories 3660 Technology Dr Minneapolis, MN 55418 USA santosh.mathan@honeywell.com Stephen Whitlow Honeywell Laboratories
Description of the Spectro-temporal unfolding of temporal orienting of attention.
 Description of the Spectro-temporal unfolding of temporal orienting of attention. All behaviors unfold over time; therefore, our ability to perceive and adapt our behavior according to the temporal constraints
Supplementary Information on TMS/hd-EEG recordings: acquisition and preprocessing
 Supplementary Information on TMS/hd-EEG recordings: acquisition and preprocessing Stability of the coil position was assured by using a software aiming device allowing the stimulation only when the deviation
CHAPTER 6 INTERFERENCE CANCELLATION IN EEG SIGNAL
 116 CHAPTER 6 INTERFERENCE CANCELLATION IN EEG SIGNAL 6.1 INTRODUCTION Electrical impulses generated by nerve firings in the brain pass through the head and represent the electroencephalogram (EEG). Electrical
Novel single trial movement classification based on temporal dynamics of EEG
 Novel single trial movement classification based on temporal dynamics of EEG Conference or Workshop Item Accepted Version Wairagkar, M., Daly, I., Hayashi, Y. and Nasuto, S. (2014) Novel single trial movement
Power-Based Connectivity. JL Sanguinetti
 Power-Based Connectivity JL Sanguinetti Power-based connectivity Correlating time-frequency power between two electrodes across time or over trials Gives you flexibility for analysis: Test specific hypotheses
The Time Course of Negative Priming
 The Time Course of Negative Priming Hendrik Degering Bernstein Center for Computational Neuroscience Göttingen University of Göttingen, Institute for Nonlinear Dynamics 11.12.2009, Disputation Aging Effects
Brain wave synchronization and entrainment to periodic acoustic stimuli
 Neuroscience Letters 424 (2007) 55 60 Brain wave synchronization and entrainment to periodic acoustic stimuli Udo Will, Eric Berg School of Music, Cognitive Ethnomusicology, Ohio State University, 110
A Multimodal Paradigm for Investigating the Perisaccadic Temporal Inversion Effect in Vision
 A Multimodal Paradigm for Investigating the Perisaccadic Temporal Inversion Effect in Vision Leo G. Trottier (leo@cogsci.ucsd.edu) Virginia R. de Sa (desa@cogsci.ucsd.edu) Department of Cognitive Science,
Supplementary Material for
 Supplementary Material for Selective neuronal lapses precede human cognitive lapses following sleep deprivation Supplementary Table 1. Data acquisition details Session Patient Brain regions monitored Time
The neurolinguistic toolbox Jonathan R. Brennan. Introduction to Neurolinguistics, LSA2017 1
 The neurolinguistic toolbox Jonathan R. Brennan Introduction to Neurolinguistics, LSA2017 1 Psycholinguistics / Neurolinguistics Happy Hour!!! Tuesdays 7/11, 7/18, 7/25 5:30-6:30 PM @ the Boone Center
A Brain Computer Interface System For Auto Piloting Wheelchair
 A Brain Computer Interface System For Auto Piloting Wheelchair Reshmi G, N. Kumaravel & M. Sasikala Centre for Medical Electronics, Dept. of Electronics and Communication Engineering, College of Engineering,
Consciousness as representation formation from a neural Darwinian perspective *
 Consciousness as representation formation from a neural Darwinian perspective * Anna Kocsis, mag.phil. Institute of Philosophy Zagreb, Croatia Vjeran Kerić, mag.phil. Department of Psychology and Cognitive
Oscillations: From Neuron to MEG
 Oscillations: From Neuron to MEG Educational Symposium, MEG UK 2014, Nottingham, Jan 8th 2014 Krish Singh CUBRIC, School of Psychology Cardiff University What are we trying to achieve? Bridge the gap from
Event Related Potentials: Significant Lobe Areas and Wave Forms for Picture Visual Stimulus
 Available Online at www.ijcsmc.com International Journal of Computer Science and Mobile Computing A Monthly Journal of Computer Science and Information Technology ISSN 2320 088X IMPACT FACTOR: 6.017 IJCSMC,
Abnormal late visual responses and alpha oscillations in neurofibromatosis type 1: a link to visual and attention deficits
 Ribeiro et al. Journal of Neurodevelopmental Disorders, : RESEARCH Open Access Abnormal late visual responses and alpha oscillations in neurofibromatosis type : a link to visual and attention deficits
Processed by HBI: Russia/Switzerland/USA
 1 CONTENTS I Personal and clinical data II Conclusion. III Recommendations for therapy IV Report. 1. Procedures of EEG recording and analysis 2. Search for paroxysms 3. Eyes Open background EEG rhythms
Transcranial direct current stimulation modulates shifts in global/local attention
 University of New Mexico UNM Digital Repository Psychology ETDs Electronic Theses and Dissertations 2-9-2010 Transcranial direct current stimulation modulates shifts in global/local attention David B.
Supplemental Information. Gamma and the Coordination of Spiking. Activity in Early Visual Cortex. Supplemental Information Inventory:
 Neuron, Volume 77 Supplemental Information Gamma and the Coordination of Spiking Activity in Early Visual Cortex Xiaoxuan Jia, Seiji Tanabe, and Adam Kohn Supplemental Information Inventory: Supplementary
Nature Neuroscience: doi: /nn Supplementary Figure 1
 Supplementary Figure 1 Hippocampal recordings. a. (top) Post-operative MRI (left, depicting a depth electrode implanted along the longitudinal hippocampal axis) and co-registered preoperative MRI (right)
This article appeared in a journal published by Elsevier. The attached copy is furnished to the author for internal non-commercial research and
 This article appeared in a journal published by Elsevier. The attached copy is furnished to the author for internal non-commercial research and education use, including for instruction at the authors institution
Tracking the Development of Automaticity in Memory Search with Human Electrophysiology
 Tracking the Development of Automaticity in Memory Search with Human Electrophysiology Rui Cao (caorui.beilia@gmail.com) Thomas A. Busey (busey@indiana.edu) Robert M. Nosofsky (nosofsky@indiana.edu) Richard
Reading Assignments: Lecture 18: Visual Pre-Processing. Chapters TMB Brain Theory and Artificial Intelligence
 Brain Theory and Artificial Intelligence Lecture 18: Visual Pre-Processing. Reading Assignments: Chapters TMB2 3.3. 1 Low-Level Processing Remember: Vision as a change in representation. At the low-level,
Practicalities of EEG Measurement and Experiment Design YATING LIU
 Practicalities of EEG Measurement and Experiment Design YATING LIU 2014.02.04 Content Designing Experiments: Discuss & Pilot Event Markers Intra- and Intertrial Timing How Many Trials You Will Need How
Avalanche dynamics and the human connectome
 Avalanche dynamics and the human connectome J. Matias Palva Neuroscience Center, University of Helsinki http://www.helsinki.fi/neurosci/groups/palva.html matias.palva@helsinki.fi Three tiers of systems
Supplementary Online Content
 Supplementary Online Content Miocinovic S, de Hemptinne C, Qasim S, Ostrem JL, Starr PA. Patterns of cortical synchronization in isolated dystonia compared with Parkinson disease. JAMA Neurol. Published
2 INSERM U280, Lyon, France
 Natural movies evoke responses in the primary visual cortex of anesthetized cat that are not well modeled by Poisson processes Jonathan L. Baker 1, Shih-Cheng Yen 1, Jean-Philippe Lachaux 2, Charles M.
How Long Depends on How Fast Perceived Flicker Dilates Subjective Duration
 How Long Depends on How Fast Perceived Flicker Dilates Subjective Duration Sophie K. Herbst 1,2 *, Amir Homayoun Javadi 3, Elke van der Meer 1,2, Niko A. Busch 1,4 1 Berlin School of Mind and Brain, Berlin,
 Provided by the author(s) and NUI Galway in accordance with publisher policies. Please cite the published version when available. Title Prefrontal cortex and the generation of oscillatory visual persistence
A contrast paradox in stereopsis, motion detection and vernier acuity
 A contrast paradox in stereopsis, motion detection and vernier acuity S. B. Stevenson *, L. K. Cormack Vision Research 40, 2881-2884. (2000) * University of Houston College of Optometry, Houston TX 77204
Nature Neuroscience: doi: /nn Supplementary Figure 1. Trial structure for go/no-go behavior
 Supplementary Figure 1 Trial structure for go/no-go behavior a, Overall timeline of experiments. Day 1: A1 mapping, injection of AAV1-SYN-GCAMP6s, cranial window and headpost implantation. Water restriction
Brain Computer Interface. Mina Mikhail
 Brain Computer Interface Mina Mikhail minamohebn@gmail.com Introduction Ways for controlling computers Keyboard Mouse Voice Gestures Ways for communicating with people Talking Writing Gestures Problem
The role of selective attention in visual awareness of stimulus features: Electrophysiological studies
 Cognitive, Affective, & Behavioral Neuroscience 2008, 8 (2), 195-210 doi: 10.3758/CABN.8.2.195 The role of selective attention in visual awareness of stimulus features: Electrophysiological studies MIKA
Title of Thesis. Study on Audiovisual Integration in Young and Elderly Adults by Event-Related Potential
 Title of Thesis Study on Audiovisual Integration in Young and Elderly Adults by Event-Related Potential 2014 September Yang Weiping The Graduate School of Natural Science and Technology (Doctor s Course)
International Journal of Innovative Research in Advanced Engineering (IJIRAE) Volume 1 Issue 10 (November 2014)
 Volume 1 Issue 10 (November 2014)") Technique for Suppression Random and Physiological Noise Components in Functional Magnetic Resonance Imaging Data Mawia Ahmed Hassan* Biomedical Engineering Department, Sudan University of Science & Technology,
Technique for Suppression Random and Physiological Noise Components in Functional Magnetic Resonance Imaging Data Mawia Ahmed Hassan* Biomedical Engineering Department, Sudan University of Science & Technology,
EEG reveals divergent paths for speech envelopes during selective attention
 EEG reveals divergent paths for speech envelopes during selective attention Cort Horton a, Michael D Zmura a, and Ramesh Srinivasan a,b a Dept. of Cognitive Sciences, University of California, Irvine,
Unit 1 Exploring and Understanding Data
 Unit 1 Exploring and Understanding Data Area Principle Bar Chart Boxplot Conditional Distribution Dotplot Empirical Rule Five Number Summary Frequency Distribution Frequency Polygon Histogram Interquartile
Does scene context always facilitate retrieval of visual object representations?
 Psychon Bull Rev (2011) 18:309 315 DOI 10.3758/s13423-010-0045-x Does scene context always facilitate retrieval of visual object representations? Ryoichi Nakashima & Kazuhiko Yokosawa Published online:
The impact of numeration on visual attention during a psychophysical task; An ERP study
 The impact of numeration on visual attention during a psychophysical task; An ERP study Armita Faghani Jadidi, Raheleh Davoodi, Mohammad Hassan Moradi Department of Biomedical Engineering Amirkabir University
Prestimulus Alpha as a Precursor to Errors in a UAV Target Orientation Detection Task
 Prestimulus Alpha as a Precursor to Errors in a UAV Target Orientation Detection Task Carryl Baldwin 1, Joseph T. Coyne 2, Daniel M. Roberts 1, Jane H. Barrow 1, Anna Cole 3, Ciara Sibley 3, Brian Taylor
Physiological and Physical Basis of Functional Brain Imaging 6. EEG/MEG. Kâmil Uludağ, 20. November 2007
 Physiological and Physical Basis of Functional Brain Imaging 6. EEG/MEG Kâmil Uludağ, 20. November 2007 Course schedule 1. Overview 2. fmri (Spin dynamics, Image formation) 3. fmri (physiology) 4. fmri
Event-Related Potentials Recorded during Human-Computer Interaction
 Proceedings of the First International Conference on Complex Medical Engineering (CME2005) May 15-18, 2005, Takamatsu, Japan (Organized Session No. 20). Paper No. 150, pp. 715-719. Event-Related Potentials
Attention Response Functions: Characterizing Brain Areas Using fmri Activation during Parametric Variations of Attentional Load
 Attention Response Functions: Characterizing Brain Areas Using fmri Activation during Parametric Variations of Attentional Load Intro Examine attention response functions Compare an attention-demanding
WAVELET ENERGY DISTRIBUTIONS OF P300 EVENT-RELATED POTENTIALS FOR WORKING MEMORY PERFORMANCE IN CHILDREN
 WAVELET ENERGY DISTRIBUTIONS OF P300 EVENT-RELATED POTENTIALS FOR WORKING MEMORY PERFORMANCE IN CHILDREN Siti Zubaidah Mohd Tumari and Rubita Sudirman Department of Electronic and Computer Engineering,
HST 583 fmri DATA ANALYSIS AND ACQUISITION
 HST 583 fmri DATA ANALYSIS AND ACQUISITION Neural Signal Processing for Functional Neuroimaging Neuroscience Statistics Research Laboratory Massachusetts General Hospital Harvard Medical School/MIT Division
Strength of Gamma Rhythm Depends on Normalization
 Strength of Gamma Rhythm Depends on Normalization The Harvard community has made this article openly available. Please share how this access benefits you. Your story matters Citation Ray, Supratim, Amy
Human Brain Institute Russia-Switzerland-USA
 1 Human Brain Institute Russia-Switzerland-USA CONTENTS I Personal and clinical data II Conclusion. III Recommendations for therapy IV Report. 1. Procedures of EEG recording and analysis 2. Search for
BRAIN RESEARCH 1104 (2006) available at
 available at") available at www.sciencedirect.com www.elsevier.com/locate/brainres Research Report Comparative analysis of event-related potentials during Go/NoGo and CPT: Decomposition of electrophysiological markers
available at www.sciencedirect.com www.elsevier.com/locate/brainres Research Report Comparative analysis of event-related potentials during Go/NoGo and CPT: Decomposition of electrophysiological markers
Nature Methods: doi: /nmeth Supplementary Figure 1. Activity in turtle dorsal cortex is sparse.
 Supplementary Figure 1 Activity in turtle dorsal cortex is sparse. a. Probability distribution of firing rates across the population (notice log scale) in our data. The range of firing rates is wide but
Differences in temporal frequency tuning between the two binocular mechanisms for seeing motion in depth
 1574 J. Opt. Soc. Am. A/ Vol. 25, No. 7/ July 2008 Shioiri et al. Differences in temporal frequency tuning between the two binocular mechanisms for seeing motion in depth Satoshi Shioiri, 1, * Tomohiko
Seizure onset can be difficult to asses in scalp EEG. However, some tools can be used to increase the seizure onset activity over the EEG background:
 This presentation was given during the Dianalund Summer School on EEG and Epilepsy, July 24, 2012. The main purpose of this introductory talk is to show the possibilities of improved seizure onset analysis
Early Learning vs Early Variability 1.5 r = p = Early Learning r = p = e 005. Early Learning 0.
 The temporal structure of motor variability is dynamically regulated and predicts individual differences in motor learning ability Howard Wu *, Yohsuke Miyamoto *, Luis Nicolas Gonzales-Castro, Bence P.
Over-representation of speech in older adults originates from early response in higher order auditory cortex
 Over-representation of speech in older adults originates from early response in higher order auditory cortex Christian Brodbeck, Alessandro Presacco, Samira Anderson & Jonathan Z. Simon Overview 2 Puzzle
Experimental Design. Outline. Outline. A very simple experiment. Activation for movement versus rest
 Experimental Design Kate Watkins Department of Experimental Psychology University of Oxford With thanks to: Heidi Johansen-Berg Joe Devlin Outline Choices for experimental paradigm Subtraction / hierarchical
University of Bristol - Explore Bristol Research
 Milton, A. M. C., & Pleydell-Pearce, C. W. (2016). The phase of prestimulus alpha oscillations influences the visual perception of stimulus timing. NeuroImage, 133, 53-61. DOI: 10.1016/j.neuroimage.2016.02.065
On the Use of Brainprints as Passwords
 9/24/2015 2015 Global Identity Summit (GIS) 1 On the Use of Brainprints as Passwords Zhanpeng Jin Department of Electrical and Computer Engineering Department of Biomedical Engineering Binghamton University,
Lecturer: Rob van der Willigen 11/9/08
 Auditory Perception - Detection versus Discrimination - Localization versus Discrimination - - Electrophysiological Measurements Psychophysical Measurements Three Approaches to Researching Audition physiology
UvA-DARE (Digital Academic Repository) Voluntary direction of attention through alpha oscillations van Diepen, R.M. Link to publication
 Voluntary direction of attention through alpha oscillations van Diepen, R.M. Link to publication") UvA-DARE (Digital Academic Repository) Voluntary direction of attention through alpha oscillations van Diepen, R.M. Link to publication Citation for published version (APA): van Diepen, R. M. (2018). Voluntary
UvA-DARE (Digital Academic Repository) Voluntary direction of attention through alpha oscillations van Diepen, R.M. Link to publication Citation for published version (APA): van Diepen, R. M. (2018). Voluntary
Support Vector Machine Classification and Psychophysiological Evaluation of Mental Workload and Engagement of Intuition- and Analysis-Inducing Tasks
 Support Vector Machine Classification and Psychophysiological Evaluation of Mental Workload and Engagement of Intuition- and Analysis-Inducing Tasks Presenter: Joseph Nuamah Department of Industrial and
Neurophysiologically Driven Image Triage: A Pilot Study
 Neurophysiologically Driven Image Triage: A Pilot Study Santosh Mathan 3660 Technology Dr Minneapolis, MN 55418 USA santosh.mathan@honeywell.com Stephen Whitlow 3660 Technology Dr Minneapolis, MN 55418
Lecturer: Rob van der Willigen 11/9/08
 Auditory Perception - Detection versus Discrimination - Localization versus Discrimination - Electrophysiological Measurements - Psychophysical Measurements 1 Three Approaches to Researching Audition physiology
Rhythmic Fluctuations in Evidence Accumulation during Decision Making in the Human Brain
 Article Rhythmic Fluctuations in Evidence Accumulation during Decision Making in the Human Brain Valentin Wyart, 1,2, * Vincent de Gardelle, 1 Jacqueline Scholl, 1 and Christopher Summerfield 1 1 Department
Supplementary material
 Supplementary material S1. Event-related potentials Event-related potentials (ERPs) were calculated for stimuli for each visual field (mean of low, medium and high spatial frequency stimuli). For each
ERP Correlates of Identity Negative Priming
 ERP Correlates of Identity Negative Priming Jörg Behrendt 1,3 Henning Gibbons 4 Hecke Schrobsdorff 1,2 Matthias Ihrke 1,3 J. Michael Herrmann 1,2 Marcus Hasselhorn 1,3 1 Bernstein Center for Computational
Attention protects the fidelity of visual memory: Behavioral and electrophysiological evidence
 Attention protects the fidelity of visual memory: Behavioral and electrophysiological evidence Jie Huang & Robert Sekuler Volen Center for Complex Systems and Department of Psychology Brandeis University,
A Precluding But Not Ensuring Role of Entrained Low-Frequency Oscillations for Auditory Perception
 12268 The Journal of Neuroscience, August 29, 2012 32(35):12268 12276 Behavioral/Systems/Cognitive A Precluding But Not Ensuring Role of Entrained Low-Frequency Oscillations for Auditory Perception Benedict
Sound Texture Classification Using Statistics from an Auditory Model
 Sound Texture Classification Using Statistics from an Auditory Model Gabriele Carotti-Sha Evan Penn Daniel Villamizar Electrical Engineering Email: gcarotti@stanford.edu Mangement Science & Engineering
Exclusion criteria and outlier detection
 1 Exclusion criteria and outlier detection 1 2 Supplementary Fig. 1 31 subjects complied with the inclusion criteria as tested during the familiarization session. The upper part of the figure (ovals) indicates