Section 4.3 Using Studies Wisely. Honors Statistics. Aug 23-8:26 PM. Daily Agenda. 1. Check homework C4# Group Quiz on
|
|
|
- Jasper Moody
- 5 years ago
- Views:
Transcription


1 Section 4.3 Using Studies Wisely Honors Statistics Aug 23-8:26 PM Daily Agenda 1. Check homework C4#10 2. Group Quiz on concepts 5. Discuss homework C4#11 Aug 23-8:31 PM 1


2 pg : 76, 79, 81, 86 Apr 6-9:53 AM C B B D C D B B Nov 9-7:57 PM 2
 normal diet with unrestricted salt; (2) vegetarian with unrestricted salt; (3) normal with restricted salt; and (4) vegetarian")
 two factors, normal/vegetarian diet and unrestricted/restricted salt. > (d) three factors, men, high blood pressure, and type of diet. > (e) four factors, the four diets being compared.")
3 C4#10 pg : Multiple Choice #87 to #94 Can changing diet reduce high blood pressure? Vegetarian diets and low-salt diets are both promising. Men with high blood pressure are assigned at random to four diets: (1) normal diet with unrestricted salt; (2) vegetarian with unrestricted salt; (3) normal with restricted salt; and (4) vegetarian with restricted salt. This experiment has > (a) one factor, the type of diet. > (b) two factors, high blood pressure and type of diet. > (c) two factors, normal/vegetarian diet and unrestricted/restricted salt. > (d) three factors, men, high blood pressure, and type of diet. > (e) four factors, the four diets being compared. C Factor 1 2 levels Vegetarian diet / normal diet Factor 2 2 levels restricted salt / unrestricted salt Nov 9-2:12 PM In the experiment of the previous exercise, the subjects were randomly assigned to the different treatments. What is the most important reason for this random assignment? > (a) Random assignment eliminates the effects of other variables such as stress and body weight. > (b) Random assignment is a good way to create groups of subjects that are roughly equivalent at the beginning of the experiment. > (c) Random assignment makes it possible to make a conclusion about all men. > (d) Random assignment reduces the amount of variation in blood pressure. > (e) Random assignment prevents the placebo effect from ruining the results of the study. B Random assignment reduces bias by creating groups of subjects that are roughly equivalent at the beginning of the experiment. Distribute all other possible "confounding" variables between the treatment groups. Nov 9-2:43 PM 3

 This is an observational study. (b) This is an experiment with blocking. (c) This is a completely randomized experiment. (d) This is a stratified random sample. (e) This is a cluster sample.")
4 To investigate whether standing up while studying affects performance in an algebra class, a teacher assigns half of the 30 students in his class to stand up while studying and assigns the other half to not stand up while studying. To determine who receives which treatment, the teacher identifies the two students who did best on the last exam and randomly assigns one to stand and one to not stand. The teacher does the same for the next two highest-scoring students and continues in this manner until each student is assigned a treatment. Which of the following best describes this plan? (a) This is an observational study. (b) This is an experiment with blocking. (c) This is a completely randomized experiment. (d) This is a stratified random sample. (e) This is a cluster sample. B There is random assignment but the teacher is first creating BLOCKS of students by separating them by exam scores. Nov 9-2:46 PM A gardener wants to try different combinations of fertilizer (none, 1 cup, 2 cups) and mulch (none, wood chips, pine needles, plastic) to determine which combination produces the highest yield for a variety of green beans. He has 60 green-bean plants to use in the experiment. If he wants an equal number of plants to be assigned to each treatment, how many plants will be assigned to each treatment? (a) 1 (b) 3 (c) 4 (d) 5 (e) 12 D 60/12 = 5 plants per treatment Mulch Type Fertilizer amount None wood chips pine needles plastic none cup cups Nov 9-2:49 PM 4
 Yes, because 140 bushels per acre is greater than 110 bushels per acre.")
 No, because there was no use of a placebo in the experiment. (e) No, because the experiment wasn t double-blind. C Too many confounding variable between years... name some.")
5 Corn variety 1 yielded 140 bushels per acre last year at a research farm. This year, corn variety 2, planted in the same location, yielded only 110 bushels per acre. Based on these results, is it reasonable to conclude that corn variety 1 is more productive than corn variety 2? (a) Yes, because 140 bushels per acre is greater than 110 bushels per acre. (b) Yes, because the study was done at a research farm. (c) No, because there may be other differences between the two years besides the corn variety. (d) No, because there was no use of a placebo in the experiment. (e) No, because the experiment wasn t double-blind. C Too many confounding variable between years... name some... Nov 9-2:58 PM A report in a medical journal notes that the risk of developing Alzheimer s disease among subjects who regularly opted to take the drug ibuprofen was about half the risk among those who did not. Is this good evidence that ibuprofen is effective in preventing Alzheimer s disease? > (a) Yes, because the study was a randomized, comparative experiment. > (b) No, because the effect of ibuprofen is confounded with the placebo effect. > (c) Yes, because the results were published in a reputable professional journal. > (d) No, because this is an observational study. An experiment would be needed to confirm (or not confirm) the observed effect. > (e) Yes, because a 50% reduction can t happen just by chance. D There was no assigned treatment Nov 9-3:00 PM 5
6 A farmer is conducting an experiment to determine which variety of apple tree, Fuji or Gala, will produce more fruit in his orchard. The orchard is divided into 20 equally sized square plots. He has 10 trees of each variety and randomly assigns each tree to a separate plot in the orchard. What are the experimental unit(s) in this study? > (a) The trees > (b) The plots > (c) The apples > (d) The farmer > (e) The orchard B The farmer is experimenting with his farmland plots not "doing things to the trees". Nov 9-3:00 PM Two essential features of all statistically designed experiments are > (a) compare several treatments; use the double-blind method. > (b) compare several treatments; use chance to assign subjects to treatments. > (c) always have a placebo group; use the double-blind method. > (d) use a block design; use chance to assign subjects to treatments. > (e) use enough subjects; always have a control group. COMPARE, RANDOMIZE, CONTROL, REPLICATE B Compare and randomization and E? Nov 9-3:05 PM 6

7 Comparing cancer treatments The progress of a type of cancer differs in women and men. Researchers want to design an experiment to compare three therapies for this cancer. They recruit 500 male and 300 female patients who are willing to serve as subjects. Which are the blocks in this experiment: the cancer therapies or the two sexes? Why? The blocks will be male and female. They are the variable that causes a person to be male or female. What are the advantages of a randomized block design over a completely randomized design using these 800 subjects? The advantage is that the results should have less variability between the men's and women's treatment groups. This will allow results to show significance if the is a true difference between how women and men react to the three therapies. If only a completely randomized design is used, gender difference will cause mo variation in the results and confound the experiment hiding a possible working treatment for men and/or women. Suppose the researchers had 800 male and no female subjects available for the study. What advantage would this offer? What disadvantage? If only male subjects were available a completely randomized design would be acceptable for the study. This would have the advantage of stronger replication for the treatment groups and less variability in the The disadvantage is that the study results and conclusions would only then apply to males. The results should not be applied to the female population Nov 4-8:01 PM A nutrition experimenter intends to compare the weight gain of newly weaned rats. She has available 10 rats from one litter and 10 rats from a second litter. Rats in the If the 10 rats from Litter 1 were fed Diet A, the effects of genetics and diet would be confounded, and the experiment would be biased. Explain this statement carefully. Because the rats from litter 1 are healthier (have better genetics) this fact alone may be the reason that they gain weight more easily than the other rats. The weight gain would have nothing to do with the treatment. We would make conclusions based on the wrong explanatory variable (health vs. treatment diet A). Describe a better design for this experiment. we should block on litter because we have NO control over the genetics of the litters. before experiment Randomize by labeling all rats from litter 1 with single digits 1 to 0 where 0 = 10. Use the random digit table to select 5 different single digits from 1 to 0. These rats will be fed diet A. The remaining 5 rats will be fed diet B. Repeat this process for litter 2 to randomly distribute the rats to the treatment groups. Nov 4-8:03 PM 7


8 Look, Ma, no hands! Does talking on a hands-free cell phone distract drivers? Researchers recruit 40 student subjects for an experiment to investigate this question. They have a driving simulator equipped with a hands-free phone for use in the study. Each subject will complete two sessions in the simulator: one while talking on the hands-free phone and the other while just driving. The order of the two sessions for each subject will be determined at random. The route, driving conditions, and traffic flow will be the same in both sessions. What type of design did the researchers use in their study? The researchers used a matched pairs design. Explain why the researchers chose this design instead of a completely randomized design. There are many confounding factors when trying to compare people and driving habits. By using each subject compared to themselves the researchers do not have to try and match people and then randomly assig them to treatment groups. Using matched pairs reduces variability and reduces confounding variables. Why is it important to randomly assign the order of the treatments? The first time through the experiment subjects will have a "learning curve" the next time the subjects repeat the experiment this "learning curve" will the treatments. Without this randomization we would have treatment order confounded iwht "learning from ones' mistakes" Explain how and why researchers controlled for other variables in this experiment. The other methods of control were... All subjects were students, all subjects completed the task on a driving simulator, all used the same hands free device. The route, driving conditions, and traffic flow were the same in both sessions. This reduces possible confounding variables and thus reduces variability in the experiment results. Nov 4-8:04 PM Close shave: Which of two brands (X or Y) of electric razor shaves closer? Researchers want to design and carry out an experiment to answer this question using 50 adult male volunteers. Here s one idea: Have all 50 subjects shave the left sides of their faces with the Brand X razor and shave the right sides of their faces with the Brand Y razor. Then have each man decide which razor gave the closer shave and compile the results. (a) Identify any flaws you see in the proposed design for this experiment. Confounding variable of Left and Right shaves will exist in this design. Perhaps men (who are mostly right handed) can more skillfully shave one side of their face. This would cause bias in the results. (b) Describe how you would design the experiment. Explain how your design addresses each of the problems you identified in part (a). Use a matched pairs design still but randomly determine which razor brand shaves which face side. See the flow chart below. Randomization: label the men 1 to 50. Using technology randomly generate 25 different numbers between 1 and 50. (Use RANDINT(1,50,1)). The men corresponding to these first 25 selected number receive treatment 1, the rest of the men receive treatment 2. Nov 4-8:04 PM 8

9 Nov 9-3:20 PM Nov 9-3:20 PM 9
 a cause and effect relationship Causation. Nov 9-3:27 PM 10")
10 Show cause and effect generalize results to the population Nov 9-3:21 PM Random sampling versus random assignment Explain the difference between the types of inference that can be made as a result of random sampling and random assignment. Random sampling - Generalize results to the population of interest. Random assignment - Show (prove) a cause and effect relationship Causation. Nov 9-3:27 PM 10
 a cause and effect relationship Causation.")
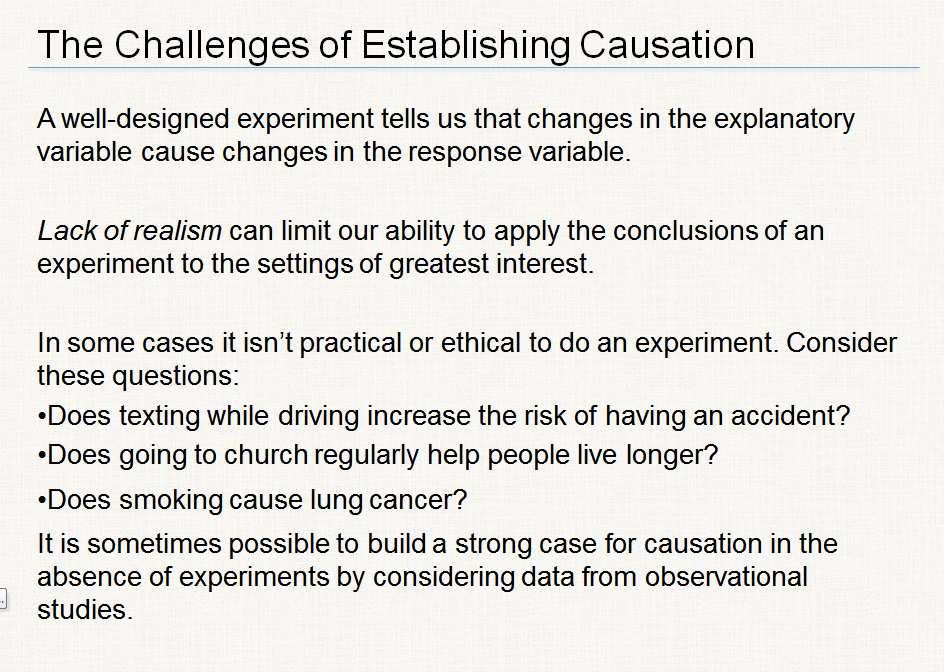
11 Observation versus experimentation Explain the difference between the types of inference than can usually be made from an observational study and an experiment. Observational Study Show that an association exists Experiment Study Show (prove) a cause and effect relationship Causation. Nov 9-3:28 PM Daytime running lights Canada and the European Union require that cars be equipped with daytime running lights, headlights that automatically come on at a low level when the car is started. Many manufacturers are now equipping cars sold in the United States with running lights. Will running lights reduce accidents by making cars more visible? An experiment conducted in a driving simulator suggests that the answer may be Yes. What concerns would you have about generalizing the results of such an experiment? A driving simulator may lack realism and may help the driver to pay closer attention. Like a contest... Perhaps the next slides will help... Once everyone has them it may not be so exceptional to see. Nov 9-3:41 PM 11


12 Nov 9-3:22 PM Nov 9-3:21 PM 12


13 Nov 9-3:21 PM Nov 9-3:25 PM 13


14 Nov 9-3:21 PM 4.10 Design flowchart and random technique are needed... Apr 6-9:53 AM 14
Daily Agenda. Honors Statistics. 1. Check homework C4#9. 4. Discuss 4.3 concepts. Finish 4.2 concepts. March 28, 2017
 Honors Statistics Aug 23-8:26 PM Daily Agenda 1. Check homework C4#9 Finish 4.2 concepts 4. Discuss 4.3 concepts Aug 23-8:31 PM 1 Apr 6-9:53 AM Nov 11-12:33 PM 2 Lack of BLINDING... The same person "experimenter"
More Designs. Section 4.2B
 More Designs Section 4.2B Block A group of experimental units or subjects that are known before the experiment to be similar in some way that is expected to systematically affect the response to the treatments.
Observational study is a poor way to gauge the effect of an intervention. When looking for cause effect relationships you MUST have an experiment.
 Chapter 5 Producing data Observational study Observes individuals and measures variables of interest but does not attempt to influence the responses. Experiment Deliberately imposes some treatment on individuals
Experimental Design There is no recovery from poorly collected data!
 Experimental Design There is no recovery from poorly collected data! Vocabulary List n Look over the list of words. n Count how many you feel you know. n Place a dot on the number line above that number.
4.2: Experiments. SAT Survey vs. SAT. Experiment. Confounding Variables. Section 4.2 Experiments. Observational Study vs.
 4.2: s SAT Survey vs. SAT Describe a survey and an experiment that can be used to determine the relationship between SAT scores and hours studied? Section 4.2 s After this section, you should be able to
CHAPTER 4 Designing Studies
 CHAPTER 4 Designing Studies 4.2 Experiments The Practice of Statistics, 5th Edition Starnes, Tabor, Yates, Moore Bedford Freeman Worth Publishers Experiments Learning Objectives After this section, you
Chapter 13. Experiments and Observational Studies. Copyright 2012, 2008, 2005 Pearson Education, Inc.
 Chapter 13 Experiments and Observational Studies Copyright 2012, 2008, 2005 Pearson Education, Inc. Observational Studies In an observational study, researchers don t assign choices; they simply observe
CHAPTER 5: PRODUCING DATA
 CHAPTER 5: PRODUCING DATA 5.1: Designing Samples Exploratory data analysis seeks to what data say by using: These conclusions apply only to the we examine. To answer questions about some of individuals
Chapter 5: Producing Data
 Chapter 5: Producing Data Key Vocabulary: observational study vs. experiment confounded variables population vs. sample sampling vs. census sample design voluntary response sampling convenience sampling
AP Statistics Unit 4.2 Day 3 Notes: Experimental Design. Expt1:
 AP Statistics Unit 4.2 Day 3 Notes: Experimental Design OBSERVATION -observe outcomes without imposing any treatment EXPERIMENT -actively impose some treatment in order to observe the response I ve developed
Chapter 3. Producing Data
 Chapter 3 Producing Data Types of data collected Anecdotal data data collected haphazardly (not representative!!) Available data existing data (examples: internet, library, census bureau,.) Gather own
Chapter 13 Summary Experiments and Observational Studies
 Chapter 13 Summary Experiments and Observational Studies What have we learned? We can recognize sample surveys, observational studies, and randomized comparative experiments. o These methods collect data
Summer AP Statistic. Chapter 4 : Sampling and Surveys: Read What s the difference between a population and a sample?
 Chapter 4 : Sampling and Surveys: Read 207-208 Summer AP Statistic What s the difference between a population and a sample? Alternate Example: Identify the population and sample in each of the following
Chapter 4 Review. Name: Class: Date: Multiple Choice Identify the choice that best completes the statement or answers the question.
 Name: Class: Date: Chapter 4 Review Multiple Choice Identify the choice that best completes the statement or answers the question. 1. Use Scenario 4-1. The newspaper asks you to comment on their survey
Experiments in the Real World
 Experiments in the Real World Goal of a randomized comparative experiment: Subjects should be treated the same in all ways except for the treatments we are trying to compare. Example: Rats in cages given
Quiz 4.1C AP Statistics Name:
 Quiz 4.1C AP Statistics Name: 1. The school s newspaper has asked you to contact 100 of the approximately 1100 students at the school to gather information about student opinions regarding food at your
Lecture 4: Chapter 3, Section 4 Designing Studies (Focus on Experiments)
") ecture 4: Chapter 3, Section 4 Designing Studies (Focus on Experiments) Definitions Randomization Control Blind Experiment Pitfalls Specific Experimental Designs Cengage earning Elementary Statistics:
ecture 4: Chapter 3, Section 4 Designing Studies (Focus on Experiments) Definitions Randomization Control Blind Experiment Pitfalls Specific Experimental Designs Cengage earning Elementary Statistics:
Chapter 1: Exploring Data
 Chapter 1: Exploring Data Key Vocabulary:! individual! variable! frequency table! relative frequency table! distribution! pie chart! bar graph! two-way table! marginal distributions! conditional distributions!
AP Statistics Chapter 5 Multiple Choice
 AP Statistics Chapter 5 Multiple Choice 1. A nutritionist wants to study the effect of storage time (6, 12, and 18 months) on the amount of vitamin C present in freeze dried fruit when stored for these
Lecture 4: Chapter 3, Section 4. (Focus on Experiments) Designing Studies. Looking Back: Review. Definitions
 Designing Studies. Looking Back: Review. Definitions") ecture 4: Chapter 3, Section 4 Designing Studies (Focus on Experiments)!Definitions!Randomization!Control!Blind Experiment!Pitfalls!Specific Experimental Designs Cengage earning Elementary Statistics:
ecture 4: Chapter 3, Section 4 Designing Studies (Focus on Experiments)!Definitions!Randomization!Control!Blind Experiment!Pitfalls!Specific Experimental Designs Cengage earning Elementary Statistics:
Introduction to PSYCHOLOGY
 Introduction to PSYCHOLOGY PSYCHOLOGY The scientific study of behavior and the mental process. What are the characteristics of an excellent Psychologist? How do psychologists think? I feel myself a naturalist
aps/stone U0 d14 review d2 teacher notes 9/14/17 obj: review Opener: I have- who has
 aps/stone U0 d14 review d2 teacher notes 9/14/17 obj: review Opener: I have- who has 4: You should be able to explain/discuss each of the following words/concepts below... Observational Study/Sampling
Variable Data univariate data set bivariate data set multivariate data set categorical qualitative numerical quantitative
 The Data Analysis Process and Collecting Data Sensibly Important Terms Variable A variable is any characteristic whose value may change from one individual to another Examples: Brand of television Height
Chapter 13. Experiments and Observational Studies
 Chapter 13 Experiments and Observational Studies 1 /36 Homework Read Chpt 13 Do p312 1, 7, 9, 11, 17, 20, 25, 27, 29, 33, 40, 41 2 /36 Observational Studies In an observational study, researchers do not
Chapter 2. The Data Analysis Process and Collecting Data Sensibly. Copyright 2005 Brooks/Cole, a division of Thomson Learning, Inc.
 Chapter 2 The Data Analysis Process and Collecting Data Sensibly Important Terms Variable A variable is any characteristic whose value may change from one individual to another Examples: Brand of television
Designed Experiments have developed their own terminology. The individuals in an experiment are often called subjects.
 When we wish to show a causal relationship between our explanatory variable and the response variable, a well designed experiment provides the best option. Here, we will discuss a few basic concepts and
Section Experiments
 Section 4.2 - Experiments There are two different ways to produce/gather data in order to answer specific questions: 1. Observational Studies Observes individuals and measures variables of interest but
Unit 3: Collecting Data. Observational Study Experimental Study Sampling Bias Types of Sampling
 Unit 3: Collecting Data Observational Study Experimental Study Sampling Bias Types of Sampling Feb 7 10:12 AM The step of data collection is critical to obtain reliable information for your study. 2 Types
Statistics Success Stories and Cautionary Tales
 Course Goals STATISTICS 8 Professor Jessica Utts http://www.ics.uci.edu/~jutts/8 Help you understand and appreciate how statistics affects your daily life. Teach you tools for understanding statistics
2.75: 84% 2.5: 80% 2.25: 78% 2: 74% 1.75: 70% 1.5: 66% 1.25: 64% 1.0: 60% 0.5: 50% 0.25: 25% 0: 0%
 Capstone Test (will consist of FOUR quizzes and the FINAL test grade will be an average of the four quizzes). Capstone #1: Review of Chapters 1-3 Capstone #2: Review of Chapter 4 Capstone #3: Review of
Chapter 8 Statistical Principles of Design. Fall 2010
 Chapter 8 Statistical Principles of Design Fall 2010 Experimental Design Many interesting questions in biology involve relationships between response variables and one or more explanatory variables. Biology
Lecture 2B: Chapter 3, Section 4 Designing Studies (Focus on Experiments)
") ooking Back: Review ecture 2B: Chapter 3, Section 4 Designing Studies (Focus on Experiments)! Definitions! Randomization! Control! Blind Experiment! Pitfalls! 2 Types of Study Design " Observational study:
ooking Back: Review ecture 2B: Chapter 3, Section 4 Designing Studies (Focus on Experiments)! Definitions! Randomization! Control! Blind Experiment! Pitfalls! 2 Types of Study Design " Observational study:
AP Statistics Exam Review: Strand 2: Sampling and Experimentation Date:
 AP Statistics NAME: Exam Review: Strand 2: Sampling and Experimentation Date: Block: II. Sampling and Experimentation: Planning and conducting a study (10%-15%) Data must be collected according to a well-developed
The Practice of Statistics 1 Week 2: Relationships and Data Collection
 The Practice of Statistics 1 Week 2: Relationships and Data Collection Video 12: Data Collection - Experiments Experiments are the gold standard since they allow us to make causal conclusions. example,
Section 6.1 Sampling. Population each element (or person) from the set of observations that can be made (entire group)
 from the set of observations that can be made (entire group)") Section 6.1 Sampling Population each element (or person) from the set of observations that can be made (entire group) Sample a subset of the population Census systematically getting information about an
Section 6.1 Sampling Population each element (or person) from the set of observations that can be made (entire group) Sample a subset of the population Census systematically getting information about an
Name: Experimental Design
 Name: Experimental Design Period: 2001 Number 4 1. Students are designing an experiment to compare the productivity of two varieties of dwarf fruit trees. The site for the experiment is a field that is
Moore, IPS 6e Chapter 03
 Page 1 of 7 Moore, IPS 6e Chapter 03 Quizzes prepared by Dr. Patricia Humphrey, Georgia Southern University Researchers are studying the absorption of two drugs into the bloodstream. Each drug is to be
Mathacle. PSet Stats, Concepts In Statistics Level Number Name: Date:
 II. DESIGN OF STUDIES Observational studies and experiments are two types of studies that aim to describe or explain the variation of responses under the hypothesized factors, without or with manipulation.
RESEARCH IN PSYCHOLOGY
 RESEARCH IN PSYCHOLOGY BASIC VS. APPLIED Basic Seeking knowledge for the sake of knowledge itself pure research Applied Studying psychological issues in order to apply the findings to help solve problems
STATISTICS 8 CHAPTERS 1 TO 6, SAMPLE MULTIPLE CHOICE QUESTIONS
 STATISTICS 8 CHAPTERS 1 TO 6, SAMPLE MULTIPLE CHOICE QUESTIONS Circle the best answer. This scenario applies to Questions 1 and 2: A study was done to compare the lung capacity of coal miners to the lung
Name Class Date. Even when random sampling is used for a survey, the survey s results can have errors. Some of the sources of errors are:
 Name Class Date 8-3 Surveys, Experiments, and Observational Studies Going Deeper Essential question: What kinds of statistical research are there, and which ones can establish cause-and-effect relationships
Gathering. Useful Data. Chapter 3. Copyright 2004 Brooks/Cole, a division of Thomson Learning, Inc.
 Gathering Chapter 3 Useful Data Copyright 2004 Brooks/Cole, a division of Thomson Learning, Inc. Principal Idea: The knowledge of how the data were generated is one of the key ingredients for translating
Name: Class: Date: 1. Use Scenario 4-6. Explain why this is an experiment and not an observational study.
 Name: Class: Date: Chapter 4 Review Short Answer Scenario 4-6 Read the following brief article about aspirin and alcohol. Aspirin may enhance impairment by alcohol Aspirin, a long time antidote for the
Psychology Research Process
 Psychology Research Process Logical Processes Induction Observation/Association/Using Correlation Trying to assess, through observation of a large group/sample, what is associated with what? Examples:
Experimental and survey design
 Friday, October 12, 2001 Page: 1 Experimental and survey design 1. There is a positive association between the number of drownings and ice cream sales. This is an example of an association likely caused
Chapter 5: Producing Data Review Sheet
 Review Sheet 1. In order to assess the effects of exercise on reducing cholesterol, a researcher sampled 50 people from a local gym who exercised regularly and 50 people from the surrounding community
Theory. = an explanation using an integrated set of principles that organizes observations and predicts behaviors or events.
 Definition Slides Hindsight Bias = the tendency to believe, after learning an outcome, that one would have foreseen it. Also known as the I knew it all along phenomenon. Critical Thinking = thinking that
Topic 5 Day 3. Today's Agenda:
 Today's Agenda: Topic 5 Day 3 1. Correct and collect Activities 5 9 & 5 11 2. Finish Activity 5 5 from yesterday 3. "The Onion" article 4. Activity 5 5. Derren Brown video clips. Activity 5 25 7. Activity
Examining Relationships Least-squares regression. Sections 2.3
 Examining Relationships Least-squares regression Sections 2.3 The regression line A regression line describes a one-way linear relationship between variables. An explanatory variable, x, explains variability
Topic 5 Day 2. Homework #2: Saint John's Wort
 Today's Agenda: 1. Hand back and go over Topic 4 Quizzes 2. Hand back and go over exit slips 3. Correct and collect Activities 5 7, 5 17 & 5 23 4. Activity 5 4 5. Activity 5 8. Activity 5 7. Topic 5 Preliminaries
Stats: Modeling the World. Chapter 12: Experimental Design
 Stats: Modeling the World Chapter 12: Experimental Design Warm - Up The Women s Health Study randomly assigned nearly 40,000 women over the age of 45 to receive either asprin or a placebo for over 10 years
Beware of Confounding Variables
 Beware of Confounding Variables If I wanted to prove that smoking causes heart issues, what are some confounding variables? The object of an experiment is to prove that A causes B. A confounding variable
CHAPTER 8 EXPERIMENTAL DESIGN
 CHAPTER 8 1 EXPERIMENTAL DESIGN LEARNING OBJECTIVES 2 Define confounding variable, and describe how confounding variables are related to internal validity Describe the posttest-only design and the pretestposttest
Villarreal Rm. 170 Handout (4.3)/(4.4) - 1 Designing Experiments I
/(4.4) - 1 Designing Experiments I") Statistics and Probability B Ch. 4 Sample Surveys and Experiments Villarreal Rm. 170 Handout (4.3)/(4.4) - 1 Designing Experiments I Suppose we wanted to investigate if caffeine truly affects ones pulse
Statistics and Probability B Ch. 4 Sample Surveys and Experiments Villarreal Rm. 170 Handout (4.3)/(4.4) - 1 Designing Experiments I Suppose we wanted to investigate if caffeine truly affects ones pulse
Experiments. 22S:30/105 Statistical Methods and Computing. Recall: What is the critical difference between an experiment and an observational
 22S:30/105 Statistical Methods and Computing Designing Experiments Lecture 8 February 13, 2015 Kate Cowles 374 SH, 335-0727 kate-cowles@uiowa.edu 1 2 Experiments Recall: What is the critical difference
SETTING THE STAGE. News in Review November 2012 Teacher Resource Guide E. COLI HEALTH HAZARD
 News in Review November 2012 Teacher Resource Guide E. COLI HEALTH HAZARD SETTING THE STAGE In September 2012, the Canadian Food Inspection Agency (CFIA) issued a notice informing Canadians not to eat
Chapter 11: Experiments and Observational Studies p 318
 Chapter 11: Experiments and Observational Studies p 318 Observation vs Experiment An observational study observes individuals and measures variables of interest but does not attempt to influence the response.
Design of Experiments & Introduction to Research
 Design of Experiments & Introduction to Research 1 Design of Experiments Introduction to Research Definition and Purpose Scientific Method Research Project Paradigm Structure of a Research Project Types
Biostatistics and Design of Experiments Prof. Mukesh Doble Department of Biotechnology Indian Institute of Technology, Madras
 Biostatistics and Design of Experiments Prof Mukesh Doble Department of Biotechnology Indian Institute of Technology, Madras Lecture 02 Experimental Design Strategy Welcome back to the course on Biostatistics
Scientific Method in Biology
 Scientific Method in Biology Observations Observations are a critical component of science, because they can. Example: Alexander Fleming s observations on a bacterial culture contaminated with mold. Discuss
Unit 1 Exploring and Understanding Data
 Unit 1 Exploring and Understanding Data Area Principle Bar Chart Boxplot Conditional Distribution Dotplot Empirical Rule Five Number Summary Frequency Distribution Frequency Polygon Histogram Interquartile
Stanford Youth Diabetes Coaches Program Instructor Guide Class #1: What is Diabetes? What is a Diabetes Coach? Sample
 Note to Instructors: YOU SHOULD HAVE ENOUGH COPIES OF THE QUIZ AND THE HOMEWORK TO PASS OUT TO EACH STUDENT. Be sure to use the NOTES view in Powerpoint for what to cover during class. It is important
Handout 1: Introduction to the Research Process and Study Design STAT 335 Fall 2016
 DESIGNING OBSERVATIONAL STUDIES As we have discussed, for the purpose of establishing cause-and-effect relationships, observational studies have a distinct disadvantage in comparison to randomized comparative
Sampling Reminders about content and communications:
 Sampling A free response question dealing with sampling or experimental design has appeared on every AP Statistics exam. The question is designed to assess your understanding of fundamental concepts such
Chapter 1: Collecting Data, Bias and Experimental Design
 Chapter 1: Collecting Data, Bias and Experimental Design Vocabulary Data: Information in all forms. Population: The collection of all people or objects to be studied. Census: Collecting data from everyone
Math 140 Introductory Statistics
 Math 140 Introductory Statistics Professor Silvia Fernández Sample surveys and experiments Most of what we ve done so far is data exploration ways to uncover, display, and describe patterns in data. Unfortunately,
OBSERVATION METHODS: EXPERIMENTS
 OBSERVATION METHODS: EXPERIMENTS Sociological Research Methods Experiments Independent variable is manipulated, and the dependent variable respond to the manipulation. e.g. Eating a chocolate bar prior
Name Date Period. MULTIPLE CHOICE. Choose the one alternative that best completes the statement or answers the question.
 Chapter 13 Review Name Date Period Write complete answers, using complete sentences where necessary. Show your work when possible. SHORT ANSWER. Write the word or phrase that best completes each statement
Population. population. parameter. Census versus Sample. Statistic. sample. statistic. Parameter. Population. Example: Census.
 Population Population the complete collection of ALL individuals (scores, people, measurements, etc.) to be studied the population is usually too big to be studied directly, then statistics is used Parameter
Test 1 Version A STAT 3090 Spring 2018
 Multiple Choice: (Questions 1 20) Answer the following questions on the scantron provided using a #2 pencil. Bubble the response that best answers the question. Each multiple choice correct response is
P. 266 #9, 11. p. 289 # 4, 6 11, 14, 17
 P. 266 #9, 11 9. Election. a) Answers will vary. A component is one voter voting. An outcome is a vote for our candidate. Using two random digits, 00-99, let 01-55 represent a vote for your candidate,
*Karle Laska s Sections: There is NO class Thursday or Friday! Have a great Valentine s Day weekend!
 STATISTICS 100 EXAM 1 Spring 2016 PRINT NAME (Last name) (First name) NETID: CIRCLE SECTION: L1 (Laska MWF 12pm) L2 (Laska Tues/Thurs 11am) Write answers in appropriate blanks. When no blanks are provided
Module 4 Introduction
 Module 4 Introduction Recall the Big Picture: We begin a statistical investigation with a research question. The investigation proceeds with the following steps: Produce Data: Determine what to measure,
Designing an experiment 7 TH /8 TH GRADE SCIENCE
 Designing an experiment 7 TH /8 TH GRADE SCIENCE Scientific inquiry 1. Make an observation 2. Ask a question 3. Create a hypothesis 4. Design an experiment 5. Gather and analyze data 6. Draw conclusions
Understandable Statistics
 Understandable Statistics correlated to the Advanced Placement Program Course Description for Statistics Prepared for Alabama CC2 6/2003 2003 Understandable Statistics 2003 correlated to the Advanced Placement
3. For a $5 lunch with a 55 cent ($0.55) tip, what is the value of the residual?
 tip, what is the value of the residual?") STATISTICS 216, SPRING 2006 Name: EXAM 1; February 21, 2006; 100 points. Instructions: Closed book. Closed notes. Calculator allowed. Double-sided exam. NO CELL PHONES. Multiple Choice (3pts each). Circle
STATISTICS 216, SPRING 2006 Name: EXAM 1; February 21, 2006; 100 points. Instructions: Closed book. Closed notes. Calculator allowed. Double-sided exam. NO CELL PHONES. Multiple Choice (3pts each). Circle
Comparing Different Studies
 32 LESSON Comparing Different Studies Types of Studies UNDERSTAND By studying a small group within a larger group, you can make inferences about the larger group. The larger group, called the population,
Design an Experiment. Like a Real Scientist!!
 Design an Experiment Like a Real Scientist!! Let s review what science is This should do it. 8 min. And that elusive definition of a THEORY http://www.youtube.com/watch?v=9re8qxkz dm0 7:30 And a LAW is
1. What is the difference between positive and negative correlations?
 1. What is the difference between positive and negative correlations? 2. Can correlations make predictions? 3. Can correlations prove causation? 4. What are illusory correlations? We can take data from
Chapter 1: Collecting Data, Bias and Experimental Design
 Chapter 1: Collecting Data, Bias and Experimental Design Vocabulary Data: Information in all forms. Population: The collection of all people or objects to be studied. Census: Collecting data from everyone
66 Questions, 5 pages - 1 of 5 Bio301D Exam 3
 A = True, B = False unless stated otherwise name (required) You must turn in both this hard copy (with your name on it) and your scantron to receive credit for this exam. One answer and only one answer
Chapter 3. Producing Data
 Chapter 3. Producing Data Introduction Mostly data are collected for a specific purpose of answering certain questions. For example, Is smoking related to lung cancer? Is use of hand-held cell phones associated
Principles of Experimental Design
 Principles of Experimental Design Bret Hanlon and Bret Larget Department of Statistics University of Wisconsin Madison November 15, 2011 Designing Experiments 1 / 31 Experimental Design Many interesting
Principles of Experimental Design
 Principles of Experimental Design Bret Hanlon and Bret Larget Department of Statistics University of Wisconsin Madison November 15, 2011 Designing Experiments 1 / 31 Experimental Design Many interesting
I. Introduction and Data Collection B. Sampling. 1. Bias. In this section Bias Random Sampling Sampling Error
 I. Introduction and Data Collection B. Sampling In this section Bias Random Sampling Sampling Error 1. Bias Bias a prejudice in one direction (this occurs when the sample is selected in such a way that
Observational Studies and Experiments. Observational Studies
 Section 1 3: Observational Studies and Experiments Data is the basis for everything we do in statistics. Every method we use in this course starts with the collection of data. Observational Studies and
New Food Label Pages Diabetes Self-Management Program Leader s Manual
 New Food Label Pages The FDA has released a new food label, so we have adjusted Session 4 and provided a handout of the new label. Participants use the handout instead of looking at the label in the book
UNIT I SAMPLING AND EXPERIMENTATION: PLANNING AND CONDUCTING A STUDY (Chapter 4)
") UNIT I SAMPLING AND EXPERIMENTATION: PLANNING AND CONDUCTING A STUDY (Chapter 4) A DATA COLLECTION (Overview) When researchers want to make conclusions/inferences about an entire population, they often
UNIT I SAMPLING AND EXPERIMENTATION: PLANNING AND CONDUCTING A STUDY (Chapter 4) A DATA COLLECTION (Overview) When researchers want to make conclusions/inferences about an entire population, they often
9/24/2014 UNIT 2: RESEARCH METHODS AND STATISTICS RESEARCH METHODS RESEARCH METHODS RESEARCH METHODS
 RESEARCH METHODS UNIT 2: RESEARCH METHODS AND STATISTICS 8-10% of AP Exam Case Studies A case study is an in-depth study of one person. In a case study, nearly every aspect of the subject's life and history
Human intuition is remarkably accurate and free from error.
 Human intuition is remarkably accurate and free from error. 3 Most people seem to lack confidence in the accuracy of their beliefs. 4 Case studies are particularly useful because of the similarities we
Designing Psychology Experiments: Data Analysis and Presentation
 Data Analysis and Presentation Review of Chapter 4: Designing Experiments Develop Hypothesis (or Hypotheses) from Theory Independent Variable(s) and Dependent Variable(s) Operational Definitions of each
Chapter 5 Review. Name: Class: Date: Multiple Choice Identify the choice that best completes the statement or answers the question.
 Class: Date: Chapter 5 Review Multiple Choice Identify the choice that best completes the statement or answers the question. 1. The Women s Health Study randomly assigned nearly 40,000 women over the age
Study Guide for the Final Exam
 Study Guide for the Final Exam When studying, remember that the computational portion of the exam will only involve new material (covered after the second midterm), that material from Exam 1 will make
Psychology Research Process
 Psychology Research Process Logical Processes Induction Observation/Association/Using Correlation Trying to assess, through observation of a large group/sample, what is associated with what? Examples:
Probability and Statistics Chapter 1 Notes
 Probability and Statistics Chapter 1 Notes I Section 1-1 A is the science of collecting, organizing, analyzing, and interpreting data in order to make decisions 1 is information coming from observations,
Chapter 1 Data Collection
 Chapter 1 Data Collection OUTLINE 1.1 Introduction to the Practice of Statistics 1.2 Observational Studies versus Designed Experiments 1.3 Simple Random Sampling 1.4 Other Effective Sampling Methods 1.5
CHAPTER 9: Producing Data: Experiments
 CHAPTER 9: Producing Data: Experiments The Basic Practice of Statistics 6 th Edition Moore / Notz / Fligner Lecture PowerPoint Slides Chapter 9 Concepts 2 Observation vs. Experiment Subjects, Factors,
I can explain how under coverage, nonresponse, and question wording can lead to bias in a sample survey. Strive p. 67; Textbook p.
 1 AP Statistics Unit 2 Concepts (Chapter 4) Baseline Topics: (must show mastery in order to receive a 3 or above I can distinguish between a census and a sample I can identify a systematic sample. Textbook
MAT 155. Chapter 1 Introduction to Statistics. Key Concept. Basics of Collecting Data. August 20, S1.5_3 Collecting Sample Data
 MAT 155 Dr. Claude Moore Cape Fear Community College Chapter 1 Introduction to Statistics 1 1 Review and Preview 1 2 Statistical Thinking 1 3 Types of Data 1 4 Critical Thinking 1 5 Collecting Sample Data
AP Psychology -- Chapter 02 Review Research Methods in Psychology
 AP Psychology -- Chapter 02 Review Research Methods in Psychology 1. In the opening vignette, to what was Alicia's condition linked? The death of her parents and only brother 2. What did Pennebaker s study