Chapter 13. Experiments and Observational Studies
|
|
|
- Eileen York
- 6 years ago
- Views:
Transcription


1 Chapter 13 Experiments and Observational Studies 1 /36
2 Homework Read Chpt 13 Do p312 1, 7, 9, 11, 17, 20, 25, 27, 29, 33, 40, 41 2 /36
3 Observational Studies In an observational study, researchers do not assign choices; they simply observe data as it is found. The text s example looked at the relationship between music education and grades. The researchers did not assign students to music education and simply observed students in the wild, thus it was an observational study. 3 /36
4 Observational Studies Because researchers in the text example first identified subjects who studied music and then collected data on their past grades, this was a retrospective study. Had the researchers identified subjects in advance and collected data as events unfolded, the study would have been a prospective study. 4 /36
5 Observational Studies Observational studies are useful for seeing trends and possible relationships. Keep in mind, it is not possible for observational studies, whether prospective or retrospective, to suggest a causal relationship. When discussing observational studies be very careful not to use causal language such as; because, since, due to, as a result, etc. That does not suggest there is no causal relationship. It simply means that we cannot confirm a causal relationship. 5 /36
6 Randomized, Comparative Experiments An experiment is a study design that does allow us to suggest a causeand-effect relationship. In an experiment, the experimenter must identify at least one Independent (explanatory, predictor) variable, called a factor, to manipulate; and at least one Dependent (response) variable to measure. An experiment: Manipulates factor levels to create treatments. Randomly assigns subjects to these treatment levels. Compares the responses of the subject groups across treatment levels. 6 /36
7 Randomized, Comparative Experiments In general, the individuals on whom or which we experiment are called experimental units. When humans are involved, they are commonly called subjects or participants. A factor is a variable that has an effect on the response variable. The specific values that the experimenter chooses for a factor are called the levels of the factor. A treatment is a combination of specific levels from all the factors that an experimental unit receives. 7 /36
8 Four Principles of Experimental Design 1. Control: We control sources of variation other than the factors we are testing by making conditions as similar as possible for all treatment groups. The experimenter manipulates the independent variable by controlling the assignment of different levels of the variable for the subjects. Another goal of control is to minimize the effects of factors that are not part of the study. 8 /36
9 Four Principles of Experimental Design 2. Randomize: Randomization allows us to equalize the effects of unknown or uncontrollable sources of variation (reduces variation due to factors other than those we are examining). Randomization does not eliminate the effects of these sources, but it spreads them out (hopefully, evenly) across the treatment levels so that their effects are equalized within the factors of the independent variable. Without randomization, you do not have a valid experiment and cannot use the methods of statistics to draw conclusions from your study. 9 /36
10 Four Principles of Experimental Design 3. Replicate: Repeat the experiment by applying the treatments to a number of subjects. The more data collected, the more reliable the results. The outcome of an experiment on a single subject is an anecdote, not a study. When the experimental group is not a representative sample of the population, we might want to replicate an entire experiment for different groups. 10/36
11 Four Principles of Experimental Design 4. Block: Sometimes, attributes of the experimental units that are of no interest to our study, but that we cannot control or eliminate may have an effect on the outcomes of an experiment. If we group together (block) individuals based on some similar characteristic and then randomize within each of these blocks, we can reduce much of the variability due to the difference between the blocks. Note: Blocking is an important compromise between randomization and control, but is not necessary in an experimental design. 11/36
12 Diagrams of Experiments It s often helpful to diagram the procedure of an experiment. (And AP wants to see it.) The following diagram emphasizes the randomization of subjects to treatment groups, the separate treatments applied to these groups, and the comparison of results: Experimental Units Random Assignment Group 1 Group 2 Treatment 1 Treatment 2 Compare Results 12/36
13 Significance In an experiment (or observational study) we are looking at how different levels of the independent variable (treatments) result in different measures of the dependent variable. That begs the question, How large do the differences need to be to say that there truly is a difference in the treatments? Differences that are larger than we would get just from chance (the randomization alone) are called: statistically significant For now, the important point is that a difference is statistically significant if we do not believe that it s likely to have occurred only by chance. 13/36
14 Experiments and Samples Both experiments and sampling use randomization to get unbiased data, but they do so differently and for different goals: Sampling is an attempt to estimate population parameters, so the sample needs to be as representative of the population as possible. To effect that representation, random sampling is critical. Experiments try to assess the effects of treatments. Experimental units are not always drawn randomly from a population, but they are always randomly assigned to treatment levels to make the levels as similar as possible except for the treatment. 14/36
15 Control Treatments Often, we want to compare a condition involving a specific treatment to the a no treatment (status quo) condition. A baseline ( SOP ) measurement is called a control treatment, and the experimental units to whom the baseline is applied is called the control group. 15/36
16 Blinding When an experimenter knows what treatment was assigned, that knowledge may very well, unintentionally or intentionally, influence the assessment of the response. In order to avoid the bias that might result from knowing what treatment was assigned, we use blinding. 16/36
17 Blinding There are two main classes of individuals who can affect the outcome of the experiment: 1. Those participants who could influence the results. The subjects themselves and anyone administering the treatments. In other words, those actually participating in the study in some way. 2. Those who evaluate the results (statisticians, research doctors, etc.) When all individuals in either one of these classes are blinded, an experiment is said to be single-blind. When everyone in both classes is blinded, the experiment is called double-blind. 17/36
18 Placebos Often simply applying any treatment can induce an improvement. To separate out the effects of treatment, we use a control treatment that appears, for all intents and purposes, just exactly like the actual treatment. This fake treatment that looks just exactly like the treatment being tested is called a placebo. Placebos are the best way to keep participants (subjects and experimenters) from knowing whether or not subjects are receiving the actual experimental treatment. 18/36
19 Placebos The placebo effect occurs when taking the faux treatment actually results in a change in the response variable being measured. Placebo controls are so effective they have become cliche and researchers use them as a necessary tool for blinding whenever possible. 19/36
20 Randomized, Comparative Experiments To summarize; we have a good, valid, randomized, comparative experiment when the study is: randomized. comparative. placebo-controlled. double-blind. 20/36
21 Blocking When groups of experimental units are similar, it s a good idea to gather them together into blocks. Blocking is for experiments what stratifying is for sampling. Both methods group together subjects that are similar and randomize within those groups as a way to reduce unwanted variation. The study of statistics is the study of variation. Probably the most important purpose of control in any study is the attempt to reduce variation resulting from any variable other than that variable of interest and being observed. All the methods we have discussed are attempts to reduce that unwelcome variability. 21/36
22 Blocking Blocking isolates the variability due to the differences between the blocks to highlight the differences due to the treatments. We use blocks to reduce variability so we can see the effects of the factors by separating the effects of the blocks themselves. The research randomly assigns subjects within the blocks, and we call the design a randomized block design. For example; if we were concerned about the effect of grade level on our experiment, we could block by grade level, then randomly assign subjects within each grade level to the various treatment levels. 22/36
23 Blocking Suppose we are interested in the effect of SAT Prep classes on SAT scores. Further, suppose we wonder if the year the student takes the course affects the SAT results. We might block our subjects by Junior and Senior to control the variability due to year. Our experimental units are students at CHHS. Our treatments are SAT prep course and no SAT prep course. Factors affecting SAT scores are myriad; IQ, motivation, courses taken in high school, study habits throughout high school, and so on. To control all those factors we will randomly assign students to the two treatments. The response variable will be SAT test scores. 23/36
24 Blocking Here is a diagram of a blocked experiment: 15 No 60 CHHS Students Block by Random Selection 30 Seniors 30 Juniors Random Random Assignment Assignment SAT Prep 15 SAT Prep 15 No SAT Prep 15 SAT Prep Compare Results Compare Results 24/36
25 Matching In a retrospective or prospective study, subjects are sometimes paired because they are similar in ways not under study. Twin studies are a good example. Matched pairs design creates blocks by matching pairs of similar experimental units. Chance (random assignment) decides which member of a pair gets the first treatment. The other subject in that pair gets the other treatment. 25/36
26 Matching Probably the most common type of matching is the before and after (pretest/posttest). Each pair in the matched pairs design is actually one subject that gets both treatments one following the other. In that case, each participant serves as its own control. The order of the treatments may influence the response variable, so we must randomize the order of the treatments for each subject. I am sure everyone is familiar with the alcohol and driving studies. Drive to set a baseline, drink and drive again to find the effect of the alcohol on driving ability. 26/36
27 Make it More Complicated It is often important to include multiple factors in the same experiment in order to examine what happens when the factor levels are applied in different combinations. For example, the following diagram shows a study of the effects of different fertilizer/water combinations on the quality of tomatoes: In this example from your text combinations of watering and fertilizing are compared for effect on the juiciness and tastiness. Since tomatoes do not taste good, I cannot imagine how the tastiness is determined. 27/36
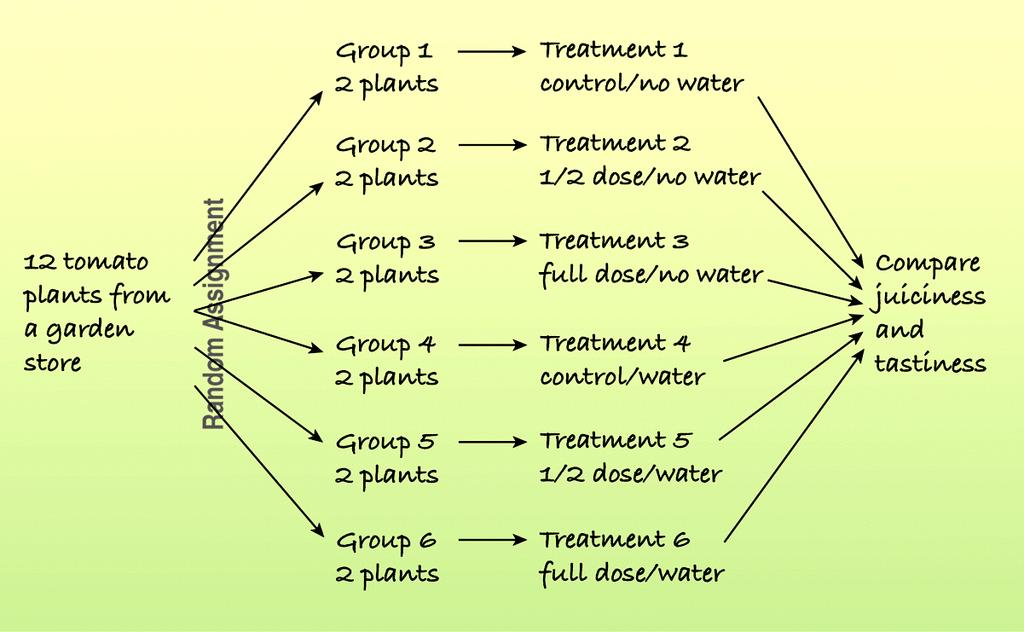
28 28/36
29 Lurking or Confounding When the changes in the levels of one factor are associated with changes in the levels of another factor, we say that these two factors are confounded. When we have confounded factors, we cannot separate out the effects of one factor from the effects of the other factor. A lurking variable creates an association between two other variables that leads us to believe that one may affect the other because we are unaware of the effect of the lurking variable. A lurking variable is usually thought of as a prior cause of both y and x that makes it appear that x may be causing y. 29/36
30 Lurking or Confounding Confounding can arise in experiments when some other variables associated with a factor has an effect on the response variable. Since the experimenter assigns subjects (at random) to treatments (not simply observing the treatments) and cannot separate out the associated confounding variable, the confounding variable has nothing to do with the assignment. Because of the confounding, we cannot determine whether the results found are caused by our factor or by the confounding factor (or some combination of both working together). 30/36
31 Lurking or Confounding I try to keep the difference between lurking and confounding like this: Confounding is what happens when two variables are working together to affect changes. We may know about the connection between the two variables but we cannot separate them. Lurking variables are usually unknown to the researcher. Thus the effects observed may not be due the the variable the researcher believes, but unknowingly due to the variable hidden behind the experimental factors. 31/36
32 Summary Terms with which you should be familiar going forward Experimental Units (humans = subjects) Factors Treatment Independent Variable Explanatory Variable Predictor Variable Dependent Variable Response Variable 32/36
33 Summary Observational Study Retrospective Prospective Completely Randomized Experiment Randomized Block Experiment Matched Pairs Experiment Blinding Placebo 33/36
34 Example Newsweek - Of all pre-college curricula, the highest level of mathematics one studies in secondary school has the strongest continuing influence on bachelor's degree completion. Finishing a course beyond the level of Algebra 2 (for example, trigonometry or pre-calculus) more than doubles the odds that a student who enters postsecondary education will complete a bachelor's degree. Anything wrong with this statement? How might we design a study to test this theory? What problems do you foresee? 34/36

35 Experiment Question: Do people better remember what they see or what they hear? Materials: 2 number cards (1 each A & B), 1 stopwatch, 1 coin (Working in pairs) 1. Collect your materials, but DO NOT look at the numbers on the index cards unless and until you are instructed to do so. 2. Flip the coin to decide who will be student A and who will be student B, and each of you take the appropriate card. (still DO NOT look at the other side!) 3. Flip the coin again to decide who will go first. 3a. Student A: (1) Look at the numbers on your card while Student B times you for 30 seconds, then give the card to Student B. (2) Next recite the alphabet aloud to Student B. (3) Finally, recite all of the numbers you remember on the card. Student B will record the number correctly recalled. 3b. Student B: (1) Student A will read the numbers on your index card to you three times. (2) Student B will then recite the alphabet aloud to Student A. (3) Finally, recite all of the numbers you remember being read to you. Student A will record the number correctly recalled. 35/36
36 Experiment Consider the experiment just completed. What might be confounding factors? How might we block this experiment? How might we run this experiment as a matched pair? 36/36
Chapter 13 Summary Experiments and Observational Studies
 Chapter 13 Summary Experiments and Observational Studies What have we learned? We can recognize sample surveys, observational studies, and randomized comparative experiments. o These methods collect data
Chapter 13. Experiments and Observational Studies. Copyright 2012, 2008, 2005 Pearson Education, Inc.
 Chapter 13 Experiments and Observational Studies Copyright 2012, 2008, 2005 Pearson Education, Inc. Observational Studies In an observational study, researchers don t assign choices; they simply observe
REVIEW FOR THE PREVIOUS LECTURE
 Slide 2-1 Calculator: The same calculator policies as for the ACT hold for STT 315: http://www.actstudent.org/faq/answers/calculator.html. It is highly recommended that you have a TI-84, as this is the
Chapter 11: Experiments and Observational Studies p 318
 Chapter 11: Experiments and Observational Studies p 318 Observation vs Experiment An observational study observes individuals and measures variables of interest but does not attempt to influence the response.
Vocabulary. Bias. Blinding. Block. Cluster sample
 Bias Blinding Block Census Cluster sample Confounding Control group Convenience sample Designs Experiment Experimental units Factor Level Any systematic failure of a sampling method to represent its population
Designed Experiments have developed their own terminology. The individuals in an experiment are often called subjects.
 When we wish to show a causal relationship between our explanatory variable and the response variable, a well designed experiment provides the best option. Here, we will discuss a few basic concepts and
Villarreal Rm. 170 Handout (4.3)/(4.4) - 1 Designing Experiments I
/(4.4) - 1 Designing Experiments I") Statistics and Probability B Ch. 4 Sample Surveys and Experiments Villarreal Rm. 170 Handout (4.3)/(4.4) - 1 Designing Experiments I Suppose we wanted to investigate if caffeine truly affects ones pulse
Statistics and Probability B Ch. 4 Sample Surveys and Experiments Villarreal Rm. 170 Handout (4.3)/(4.4) - 1 Designing Experiments I Suppose we wanted to investigate if caffeine truly affects ones pulse
CHAPTER 8 EXPERIMENTAL DESIGN
 CHAPTER 8 1 EXPERIMENTAL DESIGN LEARNING OBJECTIVES 2 Define confounding variable, and describe how confounding variables are related to internal validity Describe the posttest-only design and the pretestposttest
Module 4 Introduction
 Module 4 Introduction Recall the Big Picture: We begin a statistical investigation with a research question. The investigation proceeds with the following steps: Produce Data: Determine what to measure,
STATS8: Introduction to Biostatistics. Overview. Babak Shahbaba Department of Statistics, UCI
 STATS8: Introduction to Biostatistics Overview Babak Shahbaba Department of Statistics, UCI The role of statistical analysis in science This course discusses some biostatistical methods, which involve
Chapter 5: Producing Data
 Chapter 5: Producing Data Key Vocabulary: observational study vs. experiment confounded variables population vs. sample sampling vs. census sample design voluntary response sampling convenience sampling
MATH& 146 Lesson 6. Section 1.5 Experiments
 MATH& 146 Lesson 6 Section 1.5 Experiments 1 Experiments Studies where the researchers assign treatments to cases are called experiments. When this assignment includes randomization (such as coin flips)
Mathacle. PSet Stats, Concepts In Statistics Level Number Name: Date:
 II. DESIGN OF STUDIES Observational studies and experiments are two types of studies that aim to describe or explain the variation of responses under the hypothesized factors, without or with manipulation.
Chapter 1 Data Collection
 Chapter 1 Data Collection OUTLINE 1.1 Introduction to the Practice of Statistics 1.2 Observational Studies versus Designed Experiments 1.3 Simple Random Sampling 1.4 Other Effective Sampling Methods 1.5
Collecting Data Example: Does aspirin prevent heart attacks?
 Collecting Data In an experiment, the researcher controls or manipulates the environment of the individuals. The intent of most experiments is to study the effect of changes in the explanatory variable
Observational study is a poor way to gauge the effect of an intervention. When looking for cause effect relationships you MUST have an experiment.
 Chapter 5 Producing data Observational study Observes individuals and measures variables of interest but does not attempt to influence the responses. Experiment Deliberately imposes some treatment on individuals
Topic 5 Day 2. Homework #2: Saint John's Wort
 Today's Agenda: 1. Hand back and go over Topic 4 Quizzes 2. Hand back and go over exit slips 3. Correct and collect Activities 5 7, 5 17 & 5 23 4. Activity 5 4 5. Activity 5 8. Activity 5 7. Topic 5 Preliminaries
UNIT I SAMPLING AND EXPERIMENTATION: PLANNING AND CONDUCTING A STUDY (Chapter 4)
") UNIT I SAMPLING AND EXPERIMENTATION: PLANNING AND CONDUCTING A STUDY (Chapter 4) A DATA COLLECTION (Overview) When researchers want to make conclusions/inferences about an entire population, they often
UNIT I SAMPLING AND EXPERIMENTATION: PLANNING AND CONDUCTING A STUDY (Chapter 4) A DATA COLLECTION (Overview) When researchers want to make conclusions/inferences about an entire population, they often
Section Experiments
 Section 4.2 - Experiments There are two different ways to produce/gather data in order to answer specific questions: 1. Observational Studies Observes individuals and measures variables of interest but
CHAPTER 5: PRODUCING DATA
 CHAPTER 5: PRODUCING DATA 5.1: Designing Samples Exploratory data analysis seeks to what data say by using: These conclusions apply only to the we examine. To answer questions about some of individuals
Gathering. Useful Data. Chapter 3. Copyright 2004 Brooks/Cole, a division of Thomson Learning, Inc.
 Gathering Chapter 3 Useful Data Copyright 2004 Brooks/Cole, a division of Thomson Learning, Inc. Principal Idea: The knowledge of how the data were generated is one of the key ingredients for translating
STA Module 1 Introduction to Statistics and Data
 STA 2023 Module 1 Introduction to Statistics and Data 1 Learning Objectives Upon completing this module, you should be able to: 1. Classify a statistical study as either descriptive or inferential. 2.
AP Stats Review for Midterm
 AP Stats Review for Midterm NAME: Format: 10% of final grade. There will be 20 multiple-choice questions and 3 free response questions. The multiple-choice questions will be worth 2 points each and the
The Practice of Statistics 1 Week 2: Relationships and Data Collection
 The Practice of Statistics 1 Week 2: Relationships and Data Collection Video 12: Data Collection - Experiments Experiments are the gold standard since they allow us to make causal conclusions. example,
CHAPTER 4 Designing Studies
 CHAPTER 4 Designing Studies 4.2 Experiments The Practice of Statistics, 5th Edition Starnes, Tabor, Yates, Moore Bedford Freeman Worth Publishers Experiments Learning Objectives After this section, you
aps/stone U0 d14 review d2 teacher notes 9/14/17 obj: review Opener: I have- who has
 aps/stone U0 d14 review d2 teacher notes 9/14/17 obj: review Opener: I have- who has 4: You should be able to explain/discuss each of the following words/concepts below... Observational Study/Sampling
Clever Hans the horse could do simple math and spell out the answers to simple questions. He wasn t always correct, but he was most of the time.
 Clever Hans the horse could do simple math and spell out the answers to simple questions. He wasn t always correct, but he was most of the time. While a team of scientists, veterinarians, zoologists and
Overview of the Logic and Language of Psychology Research
 CHAPTER W1 Overview of the Logic and Language of Psychology Research Chapter Outline The Traditionally Ideal Research Approach Equivalence of Participants in Experimental and Control Groups Equivalence
Chapter 1: Exploring Data
 Chapter 1: Exploring Data Key Vocabulary:! individual! variable! frequency table! relative frequency table! distribution! pie chart! bar graph! two-way table! marginal distributions! conditional distributions!
AP Statistics Exam Review: Strand 2: Sampling and Experimentation Date:
 AP Statistics NAME: Exam Review: Strand 2: Sampling and Experimentation Date: Block: II. Sampling and Experimentation: Planning and conducting a study (10%-15%) Data must be collected according to a well-developed
Chapter Three Research Methodology
 Chapter Three Research Methodology Research Methods is a systematic and principled way of obtaining evidence (data, information) for solving health care problems. 1 Dr. Mohammed ALnaif METHODS AND KNOWLEDGE
Variable Data univariate data set bivariate data set multivariate data set categorical qualitative numerical quantitative
 The Data Analysis Process and Collecting Data Sensibly Important Terms Variable A variable is any characteristic whose value may change from one individual to another Examples: Brand of television Height
Experimental and survey design
 Friday, October 12, 2001 Page: 1 Experimental and survey design 1. There is a positive association between the number of drownings and ice cream sales. This is an example of an association likely caused
AP STATISTICS 2008 SCORING GUIDELINES (Form B)
") AP STATISTICS 2008 SCORING GUIDELINES (Form B) Question 4 Intent of Question The primary goals of this question were to assess a student s ability to (1) design an experiment to compare two treatments
AP STATISTICS 2008 SCORING GUIDELINES (Form B) Question 4 Intent of Question The primary goals of this question were to assess a student s ability to (1) design an experiment to compare two treatments
AP Psychology -- Chapter 02 Review Research Methods in Psychology
 AP Psychology -- Chapter 02 Review Research Methods in Psychology 1. In the opening vignette, to what was Alicia's condition linked? The death of her parents and only brother 2. What did Pennebaker s study
Why do Psychologists Perform Research?
 PSY 102 1 PSY 102 Understanding and Thinking Critically About Psychological Research Thinking critically about research means knowing the right questions to ask to assess the validity or accuracy of a
Chapter 1: Data Collection Pearson Prentice Hall. All rights reserved
 Chapter 1: Data Collection 2010 Pearson Prentice Hall. All rights reserved 1-1 Statistics is the science of collecting, organizing, summarizing, and analyzing information to draw conclusions or answer
UNIT 3 & 4 PSYCHOLOGY RESEARCH METHODS TOOLKIT
 UNIT 3 & 4 PSYCHOLOGY RESEARCH METHODS TOOLKIT Prepared by Lucie Young, Carey Baptist Grammar School lucie.young@carey.com.au Credit to Kristy Kendall VCE Psychology research methods workbook for some
Handout 1: Introduction to the Research Process and Study Design STAT 335 Fall 2016
 DESIGNING OBSERVATIONAL STUDIES As we have discussed, for the purpose of establishing cause-and-effect relationships, observational studies have a distinct disadvantage in comparison to randomized comparative
Research Methods in Psychology UNIT 3 PSYCHOLOGY 2013
 + Research Methods in Psychology UNIT 3 PSYCHOLOGY 2013 + Chapter 1 Summary 2 Experimental research: construction of research hypotheses; identification of operational independent and dependent variables
One-Way ANOVAs t-test two statistically significant Type I error alpha null hypothesis dependant variable Independent variable three levels;
 1 One-Way ANOVAs We have already discussed the t-test. The t-test is used for comparing the means of two groups to determine if there is a statistically significant difference between them. The t-test
First Problem Set: Answers, Discussion and Background
 First Problem Set: Answers, Discussion and Background Part I. Intuition Concerning Probability Do these problems individually Answer the following questions based upon your intuitive understanding about
GLOSSARY OF GENERAL TERMS
 GLOSSARY OF GENERAL TERMS Absolute risk reduction Absolute risk reduction (ARR) is the difference between the event rate in the control group (CER) and the event rate in the treated group (EER). ARR =
Quiz 4.1C AP Statistics Name:
 Quiz 4.1C AP Statistics Name: 1. The school s newspaper has asked you to contact 100 of the approximately 1100 students at the school to gather information about student opinions regarding food at your
Chapter 2. The Data Analysis Process and Collecting Data Sensibly. Copyright 2005 Brooks/Cole, a division of Thomson Learning, Inc.
 Chapter 2 The Data Analysis Process and Collecting Data Sensibly Important Terms Variable A variable is any characteristic whose value may change from one individual to another Examples: Brand of television
MAT Mathematics in Today's World
 MAT 1000 Mathematics in Today's World Last Time 1. What does a sample tell us about the population? 2. Practical problems in sample surveys. Last Time Parameter: Number that describes a population Statistic:
AP Statistics Chapter 5 Multiple Choice
 AP Statistics Chapter 5 Multiple Choice 1. A nutritionist wants to study the effect of storage time (6, 12, and 18 months) on the amount of vitamin C present in freeze dried fruit when stored for these
Design of Experiments & Introduction to Research
 Design of Experiments & Introduction to Research 1 Design of Experiments Introduction to Research Definition and Purpose Scientific Method Research Project Paradigm Structure of a Research Project Types
Handout 16: Opinion Polls, Sampling, and Margin of Error
 Opinion polls involve conducting a survey to gauge public opinion on a particular issue (or issues). In this handout, we will discuss some ideas that should be considered both when conducting a poll and
Research Process. the Research Loop. Now might be a good time to review the decisions made when conducting any research project.
 Research Process Choices & Combinations of research attributes Research Loop and its Applications Research Process and what portions of the process give us what aspects of validity Data Integrity Experimenter
CHAPTER 6. Experiments in the Real World
 CHAPTER 6 Experiments in the Real World EQUAL TREATMENT FOR ALL SUBJECTS The underlying assumption of randomized comparative experiments is that all subjects are handled equally in every respect except
Chapter 3. Producing Data
 Chapter 3. Producing Data Introduction Mostly data are collected for a specific purpose of answering certain questions. For example, Is smoking related to lung cancer? Is use of hand-held cell phones associated
Overview of Study Designs
 Overview of Study Designs Kyoungmi Kim, Ph.D. July 13 & 20, 2016 This seminar is jointly supported by the following NIH-funded centers: We are video recording this seminar so please hold questions until
Example The median earnings of the 28 male students is the average of the 14th and 15th, or 3+3
 Lecture 3 Nancy Pfenning Stats 1000 We learned last time how to construct a stemplot to display a single quantitative variable. A back-to-back stemplot is a useful display tool when we are interested in
Chapter 1 - Sampling and Experimental Design
 Chapter 1 - Sampling and Experimental Design Read sections 1.3-1.5 Sampling (1.3.3 and 1.4.2) Sampling Plans: methods of selecting individuals from a population. We are interested in sampling plans such
CH 13 Experiments and observational Studies
 CH 13 Experiments and observational Studies Key Terms Observational Study Retrospective Study Prospective Study Experiment Random Assignment Factor Response Experimental Units Level Treatment Principles
5.2 ap stats filled10.notebook. August 31, Experimental Studies Experiments intervention. Observational Studies no intervention.
 Observational Studies no intervention Experimental Studies Experiments intervention Surveys 1 Experiments vs. Samples sampling purpose: estimate parameter how: measure a representative subset of the population,
Methodology for Non-Randomized Clinical Trials: Propensity Score Analysis Dan Conroy, Ph.D., inventiv Health, Burlington, MA
 PharmaSUG 2014 - Paper SP08 Methodology for Non-Randomized Clinical Trials: Propensity Score Analysis Dan Conroy, Ph.D., inventiv Health, Burlington, MA ABSTRACT Randomized clinical trials serve as the
Chapter 1 Chapter 1. Chapter 1 Chapter 1. Chapter 1 Chapter 1. Chapter 1 Chapter 1. Chapter 1 Chapter 1
 psychology theory pure research applied research introspection structuralism functionalism behaviorism reinforcement Gestalt psychology a formulation of relationships underlying observed events the science
4.2: Experiments. SAT Survey vs. SAT. Experiment. Confounding Variables. Section 4.2 Experiments. Observational Study vs.
 4.2: s SAT Survey vs. SAT Describe a survey and an experiment that can be used to determine the relationship between SAT scores and hours studied? Section 4.2 s After this section, you should be able to
CHAPTER 9: Producing Data: Experiments
 CHAPTER 9: Producing Data: Experiments The Basic Practice of Statistics 6 th Edition Moore / Notz / Fligner Lecture PowerPoint Slides Chapter 9 Concepts 2 Observation vs. Experiment Subjects, Factors,
Introduction to Research Methods
 Introduction to Research Methods Updated August 08, 2016 1 The Three Types of Psychology Research Psychology research can usually be classified as one of three major types: 1. Causal Research When most
Chapter 3. Producing Data
 Chapter 3 Producing Data Types of data collected Anecdotal data data collected haphazardly (not representative!!) Available data existing data (examples: internet, library, census bureau,.) Gather own
Assignment #6. Chapter 10: 14, 15 Chapter 11: 14, 18. Due tomorrow Nov. 6 th by 2pm in your TA s homework box
 Assignment #6 Chapter 10: 14, 15 Chapter 11: 14, 18 Due tomorrow Nov. 6 th by 2pm in your TA s homework box Assignment #7 Chapter 12: 18, 24 Chapter 13: 28 Due next Friday Nov. 13 th by 2pm in your TA
Section 4.3 Using Studies Wisely. Honors Statistics. Aug 23-8:26 PM. Daily Agenda. 1. Check homework C4# Group Quiz on
 Section 4.3 Using Studies Wisely Honors Statistics Aug 23-8:26 PM Daily Agenda 1. Check homework C4#10 2. Group Quiz on 4.2 4.3 concepts 5. Discuss homework C4#11 Aug 23-8:31 PM 1 pg 262-264: 76, 79, 81,
Chapter 8 Statistical Principles of Design. Fall 2010
 Chapter 8 Statistical Principles of Design Fall 2010 Experimental Design Many interesting questions in biology involve relationships between response variables and one or more explanatory variables. Biology
Checking the counterarguments confirms that publication bias contaminated studies relating social class and unethical behavior
 1 Checking the counterarguments confirms that publication bias contaminated studies relating social class and unethical behavior Gregory Francis Department of Psychological Sciences Purdue University gfrancis@purdue.edu
CHAPTER 19: CONTROLS. One reprieve from the correlation-does-notimply-causation
 INTERPRETATION AND CONCLUSIONS CHAPTER 19: CONTROLS One reprieve from the correlation-does-notimply-causation difficulty is to seek out data that avoid certain problems with interpretation. Controls are
Research. how we figure stuff out. Methods
 Research how we figure stuff out Methods Penny in the Glass Activity Let s Make A Deal! One volunteer is needed for a chance to win $1,334,499! Let s Make A Deal Shows Us That: Human Intuition is highly
Lecture Slides. Elementary Statistics Eleventh Edition. by Mario F. Triola. and the Triola Statistics Series 1.1-1
 Lecture Slides Elementary Statistics Eleventh Edition and the Triola Statistics Series by Mario F. Triola 1.1-1 Chapter 1 Introduction to Statistics 1-1 Review and Preview 1-2 Statistical Thinking 1-3
Creative Commons Attribution-NonCommercial-Share Alike License
 Author: Brenda Gunderson, Ph.D., 2015 License: Unless otherwise noted, this material is made available under the terms of the Creative Commons Attribution- NonCommercial-Share Alike 3.0 Unported License:
In this chapter we discuss validity issues for quantitative research and for qualitative research.
 Chapter 8 Validity of Research Results (Reminder: Don t forget to utilize the concept maps and study questions as you study this and the other chapters.) In this chapter we discuss validity issues for
Chapter 11: Designing experiments
 Chapter 11: Designing experiments Objective (1) Learn to distinguish between different kinds of statistical studies. (2) Learn key concepts involved in designing experiments. Concept briefs: Again there
04/12/2014. Research Methods in Psychology. Chapter 6: Independent Groups Designs. What is your ideas? Testing
 Research Methods in Psychology Chapter 6: Independent Groups Designs 1 Why Psychologists Conduct Experiments? What is your ideas? 2 Why Psychologists Conduct Experiments? Testing Hypotheses derived from
Examining Relationships Least-squares regression. Sections 2.3
 Examining Relationships Least-squares regression Sections 2.3 The regression line A regression line describes a one-way linear relationship between variables. An explanatory variable, x, explains variability
ANATOMY OF A RESEARCH ARTICLE
 ANATOMY OF A RESEARCH ARTICLE by Joseph E. Muscolino D.C. Introduction As massage therapy enters its place among the professions of complimentary alternative medicine (CAM), the need for research becomes
More Designs. Section 4.2B
 More Designs Section 4.2B Block A group of experimental units or subjects that are known before the experiment to be similar in some way that is expected to systematically affect the response to the treatments.
Conduct an Experiment to Investigate a Situation
 Level 3 AS91583 4 Credits Internal Conduct an Experiment to Investigate a Situation Written by J Wills MathsNZ jwills@mathsnz.com Achievement Achievement with Merit Achievement with Excellence Conduct
Unit 1 Exploring and Understanding Data
 Unit 1 Exploring and Understanding Data Area Principle Bar Chart Boxplot Conditional Distribution Dotplot Empirical Rule Five Number Summary Frequency Distribution Frequency Polygon Histogram Interquartile
Chapter 9. Producing Data: Experiments. BPS - 5th Ed. Chapter 9 1
 Chapter 9 Producing Data: Experiments BPS - 5th Ed. Chapter 9 1 Experiment versus Observational Study Both typically have the goal of detecting a relationship between the explanatory and response variables.
STAT 100 Exam 2 Solutions (75 points) Spring 2016
 Spring 2016") STAT 100 Exam 2 Solutions (75 points) Spring 2016 1. In the 1970s, the U.S. government sued a particular school district on the grounds that the district had discriminated against black persons in its
STAT 100 Exam 2 Solutions (75 points) Spring 2016 1. In the 1970s, the U.S. government sued a particular school district on the grounds that the district had discriminated against black persons in its
Psych 1Chapter 2 Overview
 Psych 1Chapter 2 Overview After studying this chapter, you should be able to answer the following questions: 1) What are five characteristics of an ideal scientist? 2) What are the defining elements of
observational studies Descriptive studies
 form one stage within this broader sequence, which begins with laboratory studies using animal models, thence to human testing: Phase I: The new drug or treatment is tested in a small group of people for
GATHERING DATA. Chapter 4
 GATHERING DATA Chapter 4 4.3 What are Good and Poor Ways to Experiment? Elements of an Experiment Experimental units: Subjects Treatment: Conditions imposed on subjects Explanatory variable: Defines groups
Section 4.3 Using Studies Wisely. Read pages 266 and 267 below then discuss the table on page 267. Page 1 of 10
 Read pages 266 and 267 below then discuss the table on page 267. Page 1 of 10 1. Many students insist that they study better when listening to music. Mr. Bowman doubts this claim and suspects that listening
9/24/2014 UNIT 2: RESEARCH METHODS AND STATISTICS RESEARCH METHODS RESEARCH METHODS RESEARCH METHODS
 RESEARCH METHODS UNIT 2: RESEARCH METHODS AND STATISTICS 8-10% of AP Exam Case Studies A case study is an in-depth study of one person. In a case study, nearly every aspect of the subject's life and history
Lecture 4: Chapter 3, Section 4 Designing Studies (Focus on Experiments)
") ecture 4: Chapter 3, Section 4 Designing Studies (Focus on Experiments) Definitions Randomization Control Blind Experiment Pitfalls Specific Experimental Designs Cengage earning Elementary Statistics:
ecture 4: Chapter 3, Section 4 Designing Studies (Focus on Experiments) Definitions Randomization Control Blind Experiment Pitfalls Specific Experimental Designs Cengage earning Elementary Statistics:
Chapter 11. Experimental Design: One-Way Independent Samples Design
 11-1 Chapter 11. Experimental Design: One-Way Independent Samples Design Advantages and Limitations Comparing Two Groups Comparing t Test to ANOVA Independent Samples t Test Independent Samples ANOVA Comparing
I. Introduction and Data Collection B. Sampling. 1. Bias. In this section Bias Random Sampling Sampling Error
 I. Introduction and Data Collection B. Sampling In this section Bias Random Sampling Sampling Error 1. Bias Bias a prejudice in one direction (this occurs when the sample is selected in such a way that
Lecture 4: Chapter 3, Section 4. (Focus on Experiments) Designing Studies. Looking Back: Review. Definitions
 Designing Studies. Looking Back: Review. Definitions") ecture 4: Chapter 3, Section 4 Designing Studies (Focus on Experiments)!Definitions!Randomization!Control!Blind Experiment!Pitfalls!Specific Experimental Designs Cengage earning Elementary Statistics:
ecture 4: Chapter 3, Section 4 Designing Studies (Focus on Experiments)!Definitions!Randomization!Control!Blind Experiment!Pitfalls!Specific Experimental Designs Cengage earning Elementary Statistics:
Chapter 9. Producing Data: Experiments. BPS - 5th Ed. Chapter 9 1
 Chapter 9 Producing Data: Experiments BPS - 5th Ed. Chapter 9 1 How Data are Obtained Observational Study Observes individuals and measures variables of interest but does not attempt to influence the responses
20. Experiments. November 7,
 20. Experiments November 7, 2015 1 Experiments are motivated by our desire to know causation combined with the fact that we typically only have correlations. The cause of a correlation may be the two variables
Chapter 3: Examining Relationships
 Name Date Per Key Vocabulary: response variable explanatory variable independent variable dependent variable scatterplot positive association negative association linear correlation r-value regression
The degree to which a measure is free from error. (See page 65) Accuracy
 Accuracy") Accuracy The degree to which a measure is free from error. (See page 65) Case studies A descriptive research method that involves the intensive examination of unusual people or organizations. (See page
Accuracy The degree to which a measure is free from error. (See page 65) Case studies A descriptive research method that involves the intensive examination of unusual people or organizations. (See page
ISC- GRADE XI HUMANITIES ( ) PSYCHOLOGY. Chapter 2- Methods of Psychology
 PSYCHOLOGY. Chapter 2- Methods of Psychology") ISC- GRADE XI HUMANITIES (2018-19) PSYCHOLOGY Chapter 2- Methods of Psychology OUTLINE OF THE CHAPTER (i) Scientific Methods in Psychology -observation, case study, surveys, psychological tests, experimentation
ISC- GRADE XI HUMANITIES (2018-19) PSYCHOLOGY Chapter 2- Methods of Psychology OUTLINE OF THE CHAPTER (i) Scientific Methods in Psychology -observation, case study, surveys, psychological tests, experimentation
P. 266 #9, 11. p. 289 # 4, 6 11, 14, 17
 P. 266 #9, 11 9. Election. a) Answers will vary. A component is one voter voting. An outcome is a vote for our candidate. Using two random digits, 00-99, let 01-55 represent a vote for your candidate,
Experimental Research. Types of Group Comparison Research. Types of Group Comparison Research. Stephen E. Brock, Ph.D.
 Experimental Research Stephen E. Brock, Ph.D., NCSP California State University, Sacramento 1 Types of Group Comparison Research Review Causal-comparative AKA Ex Post Facto (Latin for after the fact).
Aim: Intro Chp. 4 Designing Studies
 RECALL: Aim: Intro Chp. 4 Designing Studies The distinction between population and sample is basic to statistics. To make sense of any sample result, you must know what population the sample represents
A) I only B) II only C) III only D) II and III only E) I, II, and III
 I only B) II only C) III only D) II and III only E) I, II, and III") AP Statistics Review Chapters 13, 3, 4 Your Name: Per: MULTIPLE CHOICE. Write the letter corresponding to the best answer. 1.* The Physicians Health Study, a large medical experiment involving 22,000 male
AP Statistics Review Chapters 13, 3, 4 Your Name: Per: MULTIPLE CHOICE. Write the letter corresponding to the best answer. 1.* The Physicians Health Study, a large medical experiment involving 22,000 male
AP Statistics Unit 4.2 Day 3 Notes: Experimental Design. Expt1:
 AP Statistics Unit 4.2 Day 3 Notes: Experimental Design OBSERVATION -observe outcomes without imposing any treatment EXPERIMENT -actively impose some treatment in order to observe the response I ve developed