Lesson 11.1: The Alpha Value
|
|
|
- Oliver Boyd
- 5 years ago
- Views:
Transcription

1 Hypothesis Testing
2 Lesson 11.1: The Alpha Value

3 The alpha value is the degree of risk we are willing to take when making a decision. The alpha value, often abbreviated using the Greek letter α, is sometimes called the "level of significance".
4 Suppose we are interested in determining if the average final exam score for the students in our Management class is significantly different from the average score of other Management students throughout the university. In order to determine this, we would have to test the following null hypothesis:
5 There is no significant difference in exam scores between our Management students and other Management students throughout the university.
6 Now, let's imagine we have computed an average score of 92 for our students and found the population average to be 80. Because the difference between these mean scores are fairly large, it appears we should reject our null hypothesis (i.e., there appears to be a significant difference be between the two groups).
7 How do we know when the sample mean and the population mean are different due to chance and when they are significantly different from one another?

8 Since we are dealing with a sample of data, we are never 100% sire if the differences are due to chance or represent a significant difference.
9 By using our alpha value we can control the risk of making the wrong decision.
10 By using our alpha value we can control the risk of making the wrong decision.
11 Four Things Alpha Value Can Do
12 We can use it to indicate the percentage of time we are willing to make an incorrect decision based on the sample data we have collected.
, although it is generally set at.05 or 5% for the types of studies we are most likely to undertake.")
13 We can control the level of risk we are willing to take by using different alpha values (e.g.,.10 and.01), although it is generally set at.05 or 5% for the types of studies we are most likely to undertake.

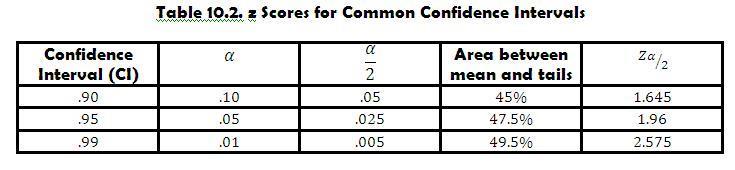
14 The alpha value can help us create a range called a "confidence level".
15 The alpha value can help us test a hypothesis about the population using data drawn from a sample.
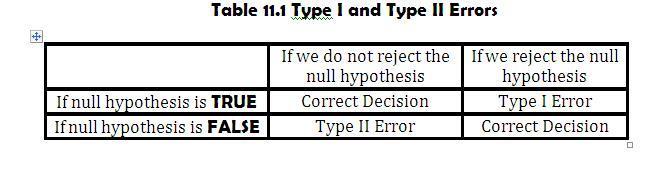
16 Lesson 11.2: The Type I Error and the Type II Error
17 It is also refer to as the alpha. This is also the probability of making a Type I Error.
18 This error happens if we reject a null hypothesis when we should not have (i.e., due to chance). We can control for Type I Error using our alpha value.
19 It is also refer to as the beta. This is also the probability of making a Type II Error.
20 This error occurs when, because of sampling error, we fail to reject a null hypothesis when we actually should reject it (i.e., we say the values are not significantly different when they really are).
21 Suppose we have a research hypothesis that reads: The defendant is guilty. The null hypothesis would read: The defendant is not guilty.
22 What will happen to the defendant if you will commit a Type I Error?
23 In this case, a Type I Error would mean that an innocent person would be sentenced to jail because you would be supporting the research hypothesis.

24 What will happen to the defendant if you will commit a Type II Error?

25 Failing to reject the null and not supporting the research hypothesis due to sampling error would mean a criminal would be found not guilty and be allowed to go free.
26
27 Lesson 11.3: The Confidence Interval
28 In this section, we are only going to look at making estimations where one sample taken from a population. In doing so, we will learn to estimate a population parameter (e.g., a population mean) based on a sample statistics (e.g., a sample mean).
29 Let's go back to our example using the students in the Management class. This time we want to use a sample statistic to predict a population parameter. In this case, we are going to use our class average to estimate the average for all of the other Management students.
30 The confidence interval is a range of numbers around a sample statistic within which the true value of the population is likely to fall. Here, we can build a range around the sample statistic, called the confidence interval, within which we predict the population parameter will fall.
31 The confidence interval is a range of numbers around a sample statistic within which the true value of the population is likely to fall. Here, we can build a range around the sample statistic, called the confidence interval, within which we predict the population parameter will fall.
32 To compute the confidence interval you need two things: 1. a sample from the population; and 2. an alpha value.
33 Let's say the Sample size of the Management class we randomly selected is 50. For this Management class, the average test score is 92. We are going to set an alpha value of.05 this means we are going to have 95% confidence interval. In this case, we will use a population standard deviation of 5.

34
35 Why do you think in our formula for finding the confidence interval the z score for alpha value is divided by 2?
36 Many beginning statisticians think a 95% confidence interval means we are 95% sure the confidence interval contains the population parameter of interest. This isn't true. The confidence interval you compute around the sample statistic either contains the population parameter or it doesn't.
37 Let's say the sample size of the Management class we randomly selected is 100. For this Management class, the average test score is 70. We are going to set an alpha value of this means we are going to have 95% confidence interval. In this case, we will use a population standard deviation of 10. (Solution on the Board)
38 How can we determine the z values for.01 alpha value and for.10 alpha value? Unfortunately, it is not quite so easy to determine the z scores for the other common alpha values.

39 Compute for the z values of.01 alpha value and.10 alpha value on the board.

40 Using Example 1, determine the confidence interval using.10 alpha value.
41 What can you observe to the confidence interval we have using.05 alpha value? Compare it to.10 alpha value confidence interval.

42 Using Example 1 determine the confidence interval using.01 alpha value.
43

44 Suppose you are hired as a school psychologist and are interested in finding the average IQ in your school. You do not have time to test all 500 students in your school and you want to work with a representative sample of 30. Let's assume that you have a sample size of 30 with a mean IQ of 110; assume further you have a population standard deviation of 15. Now, determine the confidence intervals using the common alpha values.
45 The size of your alpha value is inversely related to the width of your confidence interval; larger alpha values lead to smaller confidence intervals and vice versa. Of course, this creates havoc when you're trying to estimate a population parameter. Do you try to "cast as large a net" as possible with a small alpha value, or do you try to be as accurate as possible with q large alpha value? Unfortunately, this is the dilemma that statisticians face when dealing with uncertainty. How do we strike a happy medium? Easy set alpha equal to.05.
46 Direction: In the table below you are supplied with the sample mean, the alpha value, the number of values in the sample, and the population standard deviations. Use these values to compute the lower and upper limits of the confidence interval. Kindly show your solution and final answers on yellow paper.
Chapter 12. The One- Sample
 Chapter 12 The One- Sample z-test Objective We are going to learn to make decisions about a population parameter based on sample information. Lesson 12.1. Testing a Two- Tailed Hypothesis Example 1: Let's
One-Way ANOVAs t-test two statistically significant Type I error alpha null hypothesis dependant variable Independent variable three levels;
 1 One-Way ANOVAs We have already discussed the t-test. The t-test is used for comparing the means of two groups to determine if there is a statistically significant difference between them. The t-test
Slide 1 - Introduction to Statistics Tutorial: An Overview Slide notes
 Slide 1 - Introduction to Statistics Tutorial: An Overview Introduction to Statistics Tutorial: An Overview. This tutorial is the first in a series of several tutorials that introduce probability and statistics.
Chapter 11. Experimental Design: One-Way Independent Samples Design
 11-1 Chapter 11. Experimental Design: One-Way Independent Samples Design Advantages and Limitations Comparing Two Groups Comparing t Test to ANOVA Independent Samples t Test Independent Samples ANOVA Comparing
Chapter 12: Introduction to Analysis of Variance
 Chapter 12: Introduction to Analysis of Variance of Variance Chapter 12 presents the general logic and basic formulas for the hypothesis testing procedure known as analysis of variance (ANOVA). The purpose
Biostatistics 3. Developed by Pfizer. March 2018
 BROUGHT TO YOU BY Biostatistics 3 Developed by Pfizer March 2018 This learning module is intended for UK healthcare professionals only. Job bag: PP-GEP-GBR-0986 Date of preparation March 2018. Agenda I.
STAT 113: PAIRED SAMPLES (MEAN OF DIFFERENCES)
") STAT 113: PAIRED SAMPLES (MEAN OF DIFFERENCES) In baseball after a player gets a hit, they need to decide whether to stop at first base, or try to stretch their hit from a single to a double. Does the
STAT 113: PAIRED SAMPLES (MEAN OF DIFFERENCES) In baseball after a player gets a hit, they need to decide whether to stop at first base, or try to stretch their hit from a single to a double. Does the
Something to think about. What happens, however, when we have a sample with less than 30 items?
 One-Sample t-test Remember In the last chapter, we learned to use a statistic from a large sample of data to test a hypothesis about a population parameter. In our case, using a z-test, we tested a hypothesis
Applied Statistical Analysis EDUC 6050 Week 4
 Applied Statistical Analysis EDUC 6050 Week 4 Finding clarity using data Today 1. Hypothesis Testing with Z Scores (continued) 2. Chapters 6 and 7 in Book 2 Review! = $ & '! = $ & ' * ) 1. Which formula
Objectives. Quantifying the quality of hypothesis tests. Type I and II errors. Power of a test. Cautions about significance tests
 Objectives Quantifying the quality of hypothesis tests Type I and II errors Power of a test Cautions about significance tests Designing Experiments based on power Evaluating a testing procedure The testing
Sheila Barron Statistics Outreach Center 2/8/2011
 Sheila Barron Statistics Outreach Center 2/8/2011 What is Power? When conducting a research study using a statistical hypothesis test, power is the probability of getting statistical significance when
Statistics for Psychology
 Statistics for Psychology SIXTH EDITION CHAPTER 3 Some Key Ingredients for Inferential Statistics Some Key Ingredients for Inferential Statistics Psychologists conduct research to test a theoretical principle
Making Inferences from Experiments
 11.6 Making Inferences from Experiments Essential Question How can you test a hypothesis about an experiment? Resampling Data Yield (kilograms) Control Group Treatment Group 1. 1.1 1.2 1. 1.5 1.4.9 1.2
Instructions for doing two-sample t-test in Excel
 Instructions for doing two-sample t-test in Excel (1) If you do not see Data Analysis in the menu, this means you need to use Add-ins and make sure that the box in front of Analysis ToolPak is checked.
EXERCISE: HOW TO DO POWER CALCULATIONS IN OPTIMAL DESIGN SOFTWARE
 ...... EXERCISE: HOW TO DO POWER CALCULATIONS IN OPTIMAL DESIGN SOFTWARE TABLE OF CONTENTS 73TKey Vocabulary37T... 1 73TIntroduction37T... 73TUsing the Optimal Design Software37T... 73TEstimating Sample
Statistics: Interpreting Data and Making Predictions. Interpreting Data 1/50
 Statistics: Interpreting Data and Making Predictions Interpreting Data 1/50 Last Time Last time we discussed central tendency; that is, notions of the middle of data. More specifically we discussed the
SAMPLING AND SAMPLE SIZE
 SAMPLING AND SAMPLE SIZE Andrew Zeitlin Georgetown University and IGC Rwanda With slides from Ben Olken and the World Bank s Development Impact Evaluation Initiative 2 Review We want to learn how a program
MITOCW conditional_probability
 MITOCW conditional_probability You've tested positive for a rare and deadly cancer that afflicts 1 out of 1000 people, based on a test that is 99% accurate. What are the chances that you actually have
The t-test: Answers the question: is the difference between the two conditions in my experiment "real" or due to chance?
 The t-test: Answers the question: is the difference between the two conditions in my experiment "real" or due to chance? Two versions: (a) Dependent-means t-test: ( Matched-pairs" or "one-sample" t-test).
Inferential Statistics
 Inferential Statistics and t - tests ScWk 242 Session 9 Slides Inferential Statistics Ø Inferential statistics are used to test hypotheses about the relationship between the independent and the dependent
SAMPLE SIZE AND POWER
 SAMPLE SIZE AND POWER Craig JACKSON, Fang Gao SMITH Clinical trials often involve the comparison of a new treatment with an established treatment (or a placebo) in a sample of patients, and the differences
Research Questions, Variables, and Hypotheses: Part 2. Review. Hypotheses RCS /7/04. What are research questions? What are variables?
 Research Questions, Variables, and Hypotheses: Part 2 RCS 6740 6/7/04 1 Review What are research questions? What are variables? Definition Function Measurement Scale 2 Hypotheses OK, now that we know how
Research Methods 1 Handouts, Graham Hole,COGS - version 1.0, September 2000: Page 1:
 Research Methods 1 Handouts, Graham Hole,COGS - version 10, September 000: Page 1: T-TESTS: When to use a t-test: The simplest experimental design is to have two conditions: an "experimental" condition
Exploring the Psychological Hardiness of Entrepreneurs
 Exploring the Psychological Hardiness of Entrepreneurs Reginald A. Bruce Robert F. Sinclair University of Louisville Presented at the Babson Entrepreneurship Research Conference, June 5, 2009. Objectives
Statistical Techniques. Masoud Mansoury and Anas Abulfaraj
 Statistical Techniques Masoud Mansoury and Anas Abulfaraj What is Statistics? https://www.youtube.com/watch?v=lmmzj7599pw The definition of Statistics The practice or science of collecting and analyzing
Introduction to statistics Dr Alvin Vista, ACER Bangkok, 14-18, Sept. 2015
 Analysing and Understanding Learning Assessment for Evidence-based Policy Making Introduction to statistics Dr Alvin Vista, ACER Bangkok, 14-18, Sept. 2015 Australian Council for Educational Research Structure
Power of a Clinical Study
 Power of a Clinical Study M.Yusuf Celik 1, Editor-in-Chief 1 Prof.Dr. Biruni University, Medical Faculty, Dept of Biostatistics, Topkapi, Istanbul. Abstract The probability of not committing a Type II
Lecture 18: Controlled experiments. April 14
 Lecture 18: Controlled experiments April 14 1 Kindle vs. ipad 2 Typical steps to carry out controlled experiments in HCI Design State a lucid, testable hypothesis Identify independent and dependent variables
Power & Sample Size. Dr. Andrea Benedetti
 Power & Sample Size Dr. Andrea Benedetti Plan Review of hypothesis testing Power and sample size Basic concepts Formulae for common study designs Using the software When should you think about power &
3 CONCEPTUAL FOUNDATIONS OF STATISTICS
 3 CONCEPTUAL FOUNDATIONS OF STATISTICS In this chapter, we examine the conceptual foundations of statistics. The goal is to give you an appreciation and conceptual understanding of some basic statistical
Psy201 Module 3 Study and Assignment Guide. Using Excel to Calculate Descriptive and Inferential Statistics
 Psy201 Module 3 Study and Assignment Guide Using Excel to Calculate Descriptive and Inferential Statistics What is Excel? Excel is a spreadsheet program that allows one to enter numerical values or data
Reliability, validity, and all that jazz
 Reliability, validity, and all that jazz Dylan Wiliam King s College London Introduction No measuring instrument is perfect. The most obvious problems relate to reliability. If we use a thermometer to
Character and Life Skills: Self-Control Lesson Title: Red Light, Green Light Grade Level: 3-5
 Lesson Title: Red Light, Green Light Project and Purpose Students discuss various strategies to show self-control and use a red light, yellow light, green light model to represent how they choose to show
t-test for r Copyright 2000 Tom Malloy. All rights reserved
 t-test for r Copyright 2000 Tom Malloy. All rights reserved This is the text of the in-class lecture which accompanied the Authorware visual graphics on this topic. You may print this text out and use
STAT 200. Guided Exercise 4
 STAT 200 Guided Exercise 4 1. Let s Revisit this Problem. Fill in the table again. Diagnostic tests are not infallible. We often express a fale positive and a false negative with any test. There are further
2/14/18. Richard Wiseman examined thousands of people trying to attain their goals Finish a project Get a job Stop smoking Lose weight
 Richard Wiseman examined thousands of people trying to attain their goals Finish a project Get a job Stop smoking Lose weight Examined which strategies worked best Tested many scientific and lay theories
USING STATCRUNCH TO CONSTRUCT CONFIDENCE INTERVALS and CALCULATE SAMPLE SIZE
 USING STATCRUNCH TO CONSTRUCT CONFIDENCE INTERVALS and CALCULATE SAMPLE SIZE Using StatCrunch for confidence intervals (CI s) is super easy. As you can see in the assignments, I cover 9.2 before 9.1 because
CHAPTER THIRTEEN. Data Analysis and Interpretation: Part II.Tests of Statistical Significance and the Analysis Story CHAPTER OUTLINE
 CHAPTER THIRTEEN Data Analysis and Interpretation: Part II.Tests of Statistical Significance and the Analysis Story CHAPTER OUTLINE OVERVIEW NULL HYPOTHESIS SIGNIFICANCE TESTING (NHST) EXPERIMENTAL SENSITIVITY
Psychology Research Process
 Psychology Research Process Logical Processes Induction Observation/Association/Using Correlation Trying to assess, through observation of a large group/sample, what is associated with what? Examples:
appstats26.notebook April 17, 2015
 Chapter 26 Comparing Counts Objective: Students will interpret chi square as a test of goodness of fit, homogeneity, and independence. Goodness of Fit A test of whether the distribution of counts in one
CHAPTER ONE CORRELATION
 CHAPTER ONE CORRELATION 1.0 Introduction The first chapter focuses on the nature of statistical data of correlation. The aim of the series of exercises is to ensure the students are able to use SPSS to
20. Experiments. November 7,
 20. Experiments November 7, 2015 1 Experiments are motivated by our desire to know causation combined with the fact that we typically only have correlations. The cause of a correlation may be the two variables
Building Friendships: Avoid Discounting
 Module 3 Part 2 Building Friendships: Avoid Discounting Objectives: 1. Explore the relationship between stress and discounting. 2. Understand what discounting is and how it relates to stress in relationships.
Critical Thinking and Reading Lecture 15
 Critical Thinking and Reading Lecture 5 Critical thinking is the ability and willingness to assess claims and make objective judgments on the basis of well-supported reasons. (Wade and Tavris, pp.4-5)
Section 3.2 Least-Squares Regression
 Section 3.2 Least-Squares Regression Linear relationships between two quantitative variables are pretty common and easy to understand. Correlation measures the direction and strength of these relationships.
Karl Popper is probably the most influential philosopher
 S T A T I S T I C S W I T H O U T T E A R S Hypothesis testing, type I and type II errors Amitav Banerjee, U. B. Chitnis, S. L. Jadhav, J. S. Bhawalkar, S. Chaudhury 1 Department of Community Medicine,
Chapter 8: Estimating with Confidence
 Chapter 8: Estimating with Confidence Section 8.1 The Practice of Statistics, 4 th edition For AP* STARNES, YATES, MOORE Introduction Our goal in many statistical settings is to use a sample statistic
Sampling for Impact Evaluation. Maria Jones 24 June 2015 ieconnect Impact Evaluation Workshop Rio de Janeiro, Brazil June 22-25, 2015
 Sampling for Impact Evaluation Maria Jones 24 June 2015 ieconnect Impact Evaluation Workshop Rio de Janeiro, Brazil June 22-25, 2015 How many hours do you expect to sleep tonight? A. 2 or less B. 3 C.
15.301/310, Managerial Psychology Prof. Dan Ariely Recitation 8: T test and ANOVA
 15.301/310, Managerial Psychology Prof. Dan Ariely Recitation 8: T test and ANOVA Statistics does all kinds of stuff to describe data Talk about baseball, other useful stuff We can calculate the probability.
After Soft Tissue Sarcoma Treatment
 After Soft Tissue Sarcoma Treatment Living as a Cancer Survivor For many people, cancer treatment often raises questions about next steps as a survivor. What Happens After Treatment for Soft Tissue Sarcomas?
e.com/watch?v=hz1f yhvojr4 e.com/watch?v=kmy xd6qeass
 What you need to know before talking to your statistician about sample size Sharon D. Yeatts, Ph.D. Associate Professor of Biostatistics Data Coordination Unit Department of Public Health Sciences Medical
H O W T O S T A R T G E T T I N G Y O U R A D H D C H I L D T O C O O P E R A T E! B
 5 Keys to Discipline your ADHD child HOW TO START GETTING YOUR ADHD CHILD TO COOPERATE! By Lydia Herrera Speaker, Author and ADHD Parenting Coach This is one of the most daunting parts for parents of ADHD
Sleeping Beauty is told the following:
 Sleeping beauty Sleeping Beauty is told the following: You are going to sleep for three days, during which time you will be woken up either once Now suppose that you are sleeping beauty, and you are woken
Sample Size Considerations. Todd Alonzo, PhD
 Sample Size Considerations Todd Alonzo, PhD 1 Thanks to Nancy Obuchowski for the original version of this presentation. 2 Why do Sample Size Calculations? 1. To minimize the risk of making the wrong conclusion
Psychology Research Process
 Psychology Research Process Logical Processes Induction Observation/Association/Using Correlation Trying to assess, through observation of a large group/sample, what is associated with what? Examples:
Objectives. 6.3, 6.4 Quantifying the quality of hypothesis tests. Type I and II errors. Power of a test. Cautions about significance tests
 Objectives 6.3, 6.4 Quantifying the quality of hyothesis tests Tye I and II errors Power of a test Cautions about significance tests Further reading: htt://onlinestatbook.com/2/ower/contents.html Toics:
Why Coaching Clients Give Up
 Coaching for Leadership, Volume II Why Coaching Clients Give Up And How Effective Goal Setting Can Make a Positive Difference by Marshall Goldsmith and Kelly Goldsmith A review of research on goal-setting
Statistical Essentials in Interpreting Clinical Trials Stuart J. Pocock, PhD
 Statistical Essentials in Interpreting Clinical Trials Stuart J. Pocock, PhD June 03, 2016 www.medscape.com I'm Stuart Pocock, professor of medical statistics at London University. I am going to take you
Statistical Sampling: An Overview for Criminal Justice Researchers April 28, 2016
 Good afternoon everyone. My name is Stan Orchowsky, I'm the research director for the Justice Research and Statistics Association. It's my pleasure to welcome you this afternoon to the next in our Training
Measuring Self-Esteem of Adolescents Based on Academic Performance. Grambling State University
 Measuring Self-Esteem 1 Running head: MEASURING SELF-ESTEEM INADOLESCENTS Measuring Self-Esteem of Adolescents Based on Academic Performance Grambling State University Measuring Self-Esteem 2 Problem Studied
Two-Way Independent ANOVA
 Two-Way Independent ANOVA Analysis of Variance (ANOVA) a common and robust statistical test that you can use to compare the mean scores collected from different conditions or groups in an experiment. There
What to do if you are unhappy with the service you have received from the Tenancy Deposit Scheme
 Who should read this? How To (Post-Tenancy) Tenants Agents Landlords What to do if you are unhappy with the service you have received from the Tenancy Deposit Scheme The Tenancy Deposit Scheme (TDS) is
Understanding and Building Emotional Resilience
 Understanding and Building Emotional Resilience @howtothrive Agenda Introduction to resilience Consider from a personal/parent perspective Discussion and practice Introduction to the Penn Resilience Programme
Breast Cancer Screening: Improved Readings With Computers
 Transcript Details This is a transcript of an educational program accessible on the ReachMD network. Details about the program and additional media formats for the program are accessible by visiting: https://reachmd.com/programs/advances-in-medical-imaging/breast-cancer-screening-improvedreadings-with-computers/4023/
Personal Growth Strategies
 Personal Growth Strategies The Three Cs of Success Introduction Accept that all of us can be hurt; that all of us can and surely will at times fail. I think we should follow a simple rule: If we can take
BIOSTATISTICAL METHODS
 BIOSTATISTICAL METHODS FOR TRANSLATIONAL & CLINICAL RESEARCH Designs on Micro Scale: DESIGNING CLINICAL RESEARCH THE ANATOMY & PHYSIOLOGY OF CLINICAL RESEARCH We form or evaluate a research or research
THIS PROBLEM HAS BEEN SOLVED BY USING THE CALCULATOR. A 90% CONFIDENCE INTERVAL IS ALSO SHOWN. ALL QUESTIONS ARE LISTED BELOW THE RESULTS.
 Math 117 Confidence Intervals and Hypothesis Testing Interpreting Results SOLUTIONS The results are given. Interpret the results and write the conclusion within context. Clearly indicate what leads to
Lesson 9: Two Factor ANOVAS
 Published on Agron 513 (https://courses.agron.iastate.edu/agron513) Home > Lesson 9 Lesson 9: Two Factor ANOVAS Developed by: Ron Mowers, Marin Harbur, and Ken Moore Completion Time: 1 week Introduction
Common Statistical Issues in Biomedical Research
 Common Statistical Issues in Biomedical Research Howard Cabral, Ph.D., M.P.H. Boston University CTSI Boston University School of Public Health Department of Biostatistics May 15, 2013 1 Overview of Basic
Section 9.2b Tests about a Population Proportion
 Two-Tailed Tests The basketball player problem and the potato problem were both examples of a single sided or one tailed test of significance. The next problem is a situation that involves a two-sided
After Adrenal Cancer Treatment
 After Adrenal Cancer Treatment Living as a Cancer Survivor For many people, cancer treatment often raises questions about next steps as a survivor. Lifestyle Changes After Treatment for Adrenal Cancer
Chapter 23. Inference About Means. Copyright 2010 Pearson Education, Inc.
 Chapter 23 Inference About Means Copyright 2010 Pearson Education, Inc. Getting Started Now that we know how to create confidence intervals and test hypotheses about proportions, it d be nice to be able
Felden-WHAT? By Lawrence Wm. Goldfarb , All Rights Reserved
 Felden-WHAT? By Lawrence Wm. Goldfarb 1993-94, All Rights Reserved It was about to happen; that moment, that dreaded moment. I was at my friend Marcello's birthday party, enjoying the Brazilian music when
The Science of Psychology
 The Science of Psychology Module 2 Psychology s Scientific Method Module Objectives Why is Psychology a Science? What is the scientific method? Why should I believe what researchers say? How do Psychologist
Unit 1 Exploring and Understanding Data
 Unit 1 Exploring and Understanding Data Area Principle Bar Chart Boxplot Conditional Distribution Dotplot Empirical Rule Five Number Summary Frequency Distribution Frequency Polygon Histogram Interquartile
UNEQUAL CELL SIZES DO MATTER
 1 of 7 1/12/2010 11:26 AM UNEQUAL CELL SIZES DO MATTER David C. Howell Most textbooks dealing with factorial analysis of variance will tell you that unequal cell sizes alter the analysis in some way. I
Study Guide for the Final Exam
 Study Guide for the Final Exam When studying, remember that the computational portion of the exam will only involve new material (covered after the second midterm), that material from Exam 1 will make
HEPATITIS C LESSONS PART 4
 PURPOSE To help group members understand who they should tell and who they may want to tell about their condition. Also includes strategies for telling people. FACTS ABOUT TELLING PEOPLE YOU HAVE HEPATITIS
Classic Evidence: Raine, Buchsbaum and LaCasse, 1997 Brain Abnormalities in Murderers indicated by PET (pg 16-19)
") Classic Evidence: Raine, Buchsbaum and LaCasse, 1997 Brain Abnormalities in Murderers indicated by PET (pg 16-19) Patrick has just been arrested for murder. He confesses to the crime of killing his next
Classic Evidence: Raine, Buchsbaum and LaCasse, 1997 Brain Abnormalities in Murderers indicated by PET (pg 16-19) Patrick has just been arrested for murder. He confesses to the crime of killing his next
Lecture Notes Module 2
 Lecture Notes Module 2 Two-group Experimental Designs The goal of most research is to assess a possible causal relation between the response variable and another variable called the independent variable.
Do I Have a Drinking Problem?
 People drink for all sorts of reason. Some reasons are to socialize, celebrate and relax. Other times people use alcohol as a form of self-medication to help them manage stress, anxiety or to use it to
Views of autistic adults on assessment in the early years
 Views of autistic adults on what should be assessed and how assessment should be conducted on children with autism in the early years Summary of autistic adults views on assessment 1. Avoid drawing negative
Variability. After reading this chapter, you should be able to do the following:
 LEARIG OBJECTIVES C H A P T E R 3 Variability After reading this chapter, you should be able to do the following: Explain what the standard deviation measures Compute the variance and the standard deviation
Module 28 - Estimating a Population Mean (1 of 3)
") Module 28 - Estimating a Population Mean (1 of 3) In "Estimating a Population Mean," we focus on how to use a sample mean to estimate a population mean. This is the type of thinking we did in Modules 7
Module 28 - Estimating a Population Mean (1 of 3) In "Estimating a Population Mean," we focus on how to use a sample mean to estimate a population mean. This is the type of thinking we did in Modules 7
Viewpoints on Setting Clinical Trial Futility Criteria
 Viewpoints on Setting Clinical Trial Futility Criteria Vivian H. Shih, AstraZeneca LP Paul Gallo, Novartis Pharmaceuticals BASS XXI November 3, 2014 Reference Based on: Gallo P, Mao L, Shih VH (2014).
Checking the counterarguments confirms that publication bias contaminated studies relating social class and unethical behavior
 1 Checking the counterarguments confirms that publication bias contaminated studies relating social class and unethical behavior Gregory Francis Department of Psychological Sciences Purdue University gfrancis@purdue.edu
A report about. Anxiety. Easy Read summary
 A report about Anxiety Easy Read summary Mental Health Awareness Week 2014 This is an Easy Read summary of the Living with Anxiety report (2014). This report was written by the Mental Health Foundation.
CHAPTER OBJECTIVES - STUDENTS SHOULD BE ABLE TO:
 3 Chapter 8 Introducing Inferential Statistics CHAPTER OBJECTIVES - STUDENTS SHOULD BE ABLE TO: Explain the difference between descriptive and inferential statistics. Define the central limit theorem and
Get Unstuck How to Identify
 1 the Gaps That Are Keeping You from Get Unstuck How to Identify What You Want Skill #1: Identify where you re stuck. Skill #2: Unbundle with CPR. Content: A single instance of a problem. Pattern: A pattern
Hypothesis Testing. Richard S. Balkin, Ph.D., LPC-S, NCC
 Hypothesis Testing Richard S. Balkin, Ph.D., LPC-S, NCC Overview When we have questions about the effect of a treatment or intervention or wish to compare groups, we use hypothesis testing Parametric statistics
Missy Wittenzellner Big Brother Big Sister Project
 Missy Wittenzellner Big Brother Big Sister Project Evaluation of Normality: Before the analysis, we need to make sure that the data is normally distributed Based on the histogram, our match length data
Independent Variable. The Scientific Method and Variables. Dependent Variable. Snappy Practice:
 The Scientific Method and Variables In every experiment, a scientist is trying to explore a problem or answer a question. To do this, you are testing the relationship between two different things called
Reliability, validity, and all that jazz
 Reliability, validity, and all that jazz Dylan Wiliam King s College London Published in Education 3-13, 29 (3) pp. 17-21 (2001) Introduction No measuring instrument is perfect. If we use a thermometer
The Psychotherapy File
 The Psychotherapy File An Aid to Understanding Ourselves Better Published April 2000 V.04.00 Association for Cognitive Analytic Therapy 3rd Floor, South Wing, Division of Academic Psychiatry enquiries@acat.org.uk
Patrick Breheny. January 28
 Confidence intervals Patrick Breheny January 28 Patrick Breheny Introduction to Biostatistics (171:161) 1/19 Recap Introduction In our last lecture, we discussed at some length the Public Health Service
Sanjay P. Zodpey Clinical Epidemiology Unit, Department of Preventive and Social Medicine, Government Medical College, Nagpur, Maharashtra, India.
 Research Methodology Sample size and power analysis in medical research Sanjay P. Zodpey Clinical Epidemiology Unit, Department of Preventive and Social Medicine, Government Medical College, Nagpur, Maharashtra,
Data and Statistics 101: Key Concepts in the Collection, Analysis, and Application of Child Welfare Data
 TECHNICAL REPORT Data and Statistics 101: Key Concepts in the Collection, Analysis, and Application of Child Welfare Data CONTENTS Executive Summary...1 Introduction...2 Overview of Data Analysis Concepts...2
I. Introduction and Data Collection B. Sampling. 1. Bias. In this section Bias Random Sampling Sampling Error
 I. Introduction and Data Collection B. Sampling In this section Bias Random Sampling Sampling Error 1. Bias Bias a prejudice in one direction (this occurs when the sample is selected in such a way that
Why do Psychologists Perform Research?
 PSY 102 1 PSY 102 Understanding and Thinking Critically About Psychological Research Thinking critically about research means knowing the right questions to ask to assess the validity or accuracy of a
Table S1: Perceived Devaluation Discrimination Scale: Item Wording, Frequency Distributions, Item and Scale Statistics 1. Strongly Agree (3) % (N) (7)
 % (N) (7)") Table S1: Perceived Devaluation Discrimination Scale: Wording, Frequency Distributions, and Scale Statistics 1 Scale: Perceived Devaluation Discrimination Scale Mean 1.4, Scale Deviation., 4 Alpha.7 Mean
Table S1: Perceived Devaluation Discrimination Scale: Wording, Frequency Distributions, and Scale Statistics 1 Scale: Perceived Devaluation Discrimination Scale Mean 1.4, Scale Deviation., 4 Alpha.7 Mean