The AB of Random Effects Models
|
|
|
- Isaac Owen
- 5 years ago
- Views:
Transcription

1 The AB of Random Effects Models Rick Chappell, Ph.D. Professor, Department of Biostatistics and Medical Informatics University of Wisconsin Madison ADC Meetings, Baltimore, 10/2016
2 Outline A. Linear Models for longitudinal models B. Why can t we stick with Fixed Effects models? C. Salvation via Random Effects models D. Three useful answers 2
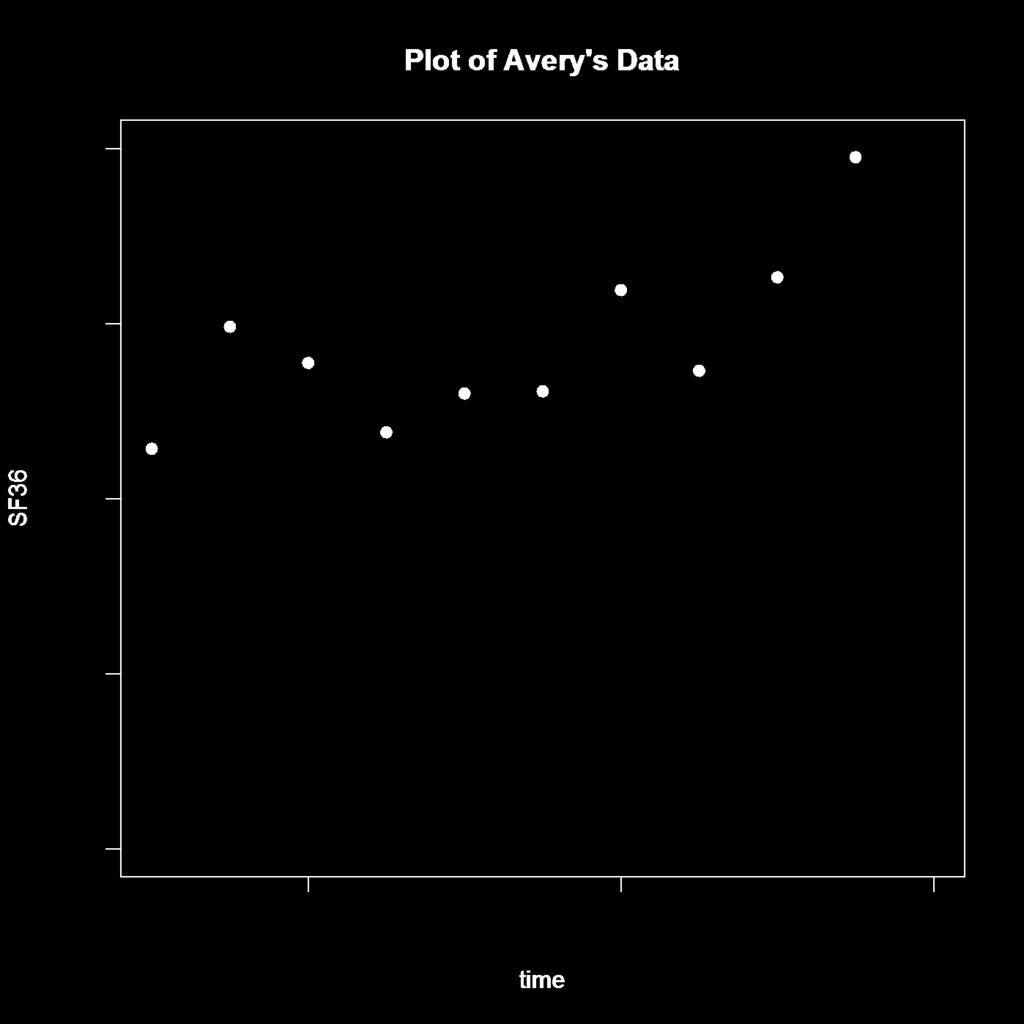
3 A. Linear Regression: Consider a collection of Avery s Cognitive Disability Index (CDI) over time (red dots). Time could be age, date, time since treatment, or other relevant scale. For observational studies time often means age. 3
4 CDI 4
5 Linear Regression: Consider a collection of Avery s CDI over time (red dots). The simplest model is a linear one, where at each time Avery s CDI is: CDI = constant + β time time + error 5
6 } error There are different errors (not shown) for the other 10 points. 6
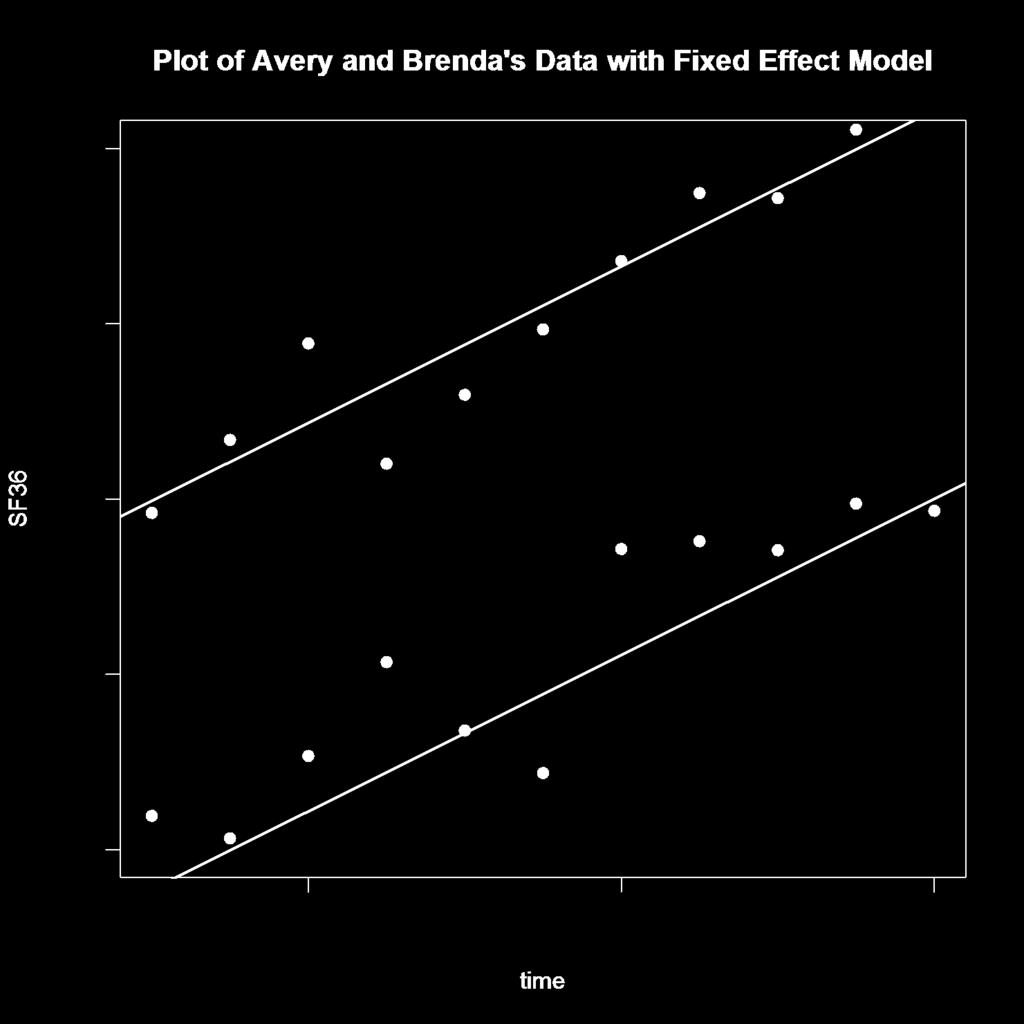
7 Linear Regression: But what if you now have Brenda s CDI measures (green dots)? Even if they parallel Avery s changes over time, they still may be higher or lower than his on average: 7
8 } error CDI } error 8
9 Linear Regression with a simple Fixed Effect: Even if they parallel Avery s changes over time, they still may be higher or lower than his on average: CDI = constant + β B vs. A Ind(Brenda) + β time time + error, Where Ind(Brenda) = 1 for Brenda s data 0 for Avery s data 9
10 CDI 10
11 B. Why can t we stick with Fixed Effects models? We need to include a lot more than two subjects. We could have a fixed effects model with, say 500 parameters for 500 patients. Alas: 1) This induces severe statistical problems. 2) It also doesn t answer the questions we ask. 11
12 1) Severe statistical problems: Tabulating and interpreting 500 estimates? The usual good properties of regression estimates require a small number of parameters. 12
13 1) Severe statistical problems: Tabulating and interpreting 500 estimates? The usual good properties of regression estimates require a small number of parameters. We can assess these properties by performing computer simulations of artificial datasets. 13
14 1) Severe statistical problems: Tabulating and interpreting 500 estimates? The usual good properties of regression estimates require a small number of parameters. We can assess these properties by performing computer simulations of artificial datasets. Oh Joy. 14
15 2) [A fixed effects model] also doesn t answer the questions we ask. Do we want to be able to describe Avery, etc., or do we want to characterize humans in general? 15
16 C. Random Effects models: We now have two error terms: CDI = constant + β time time + within-subject error + between-subject error within-subject error is the same as plain error above 16
17 We now have two error terms: CDI = constant + β time time + within-subject error + between-subject error Between-subject error is new; It allows for subjects to express individual variation as well as the usual ups and downs over time. It is constant for each subject; Here, it has one value for Avery and another for Brenda. 17

18 } Betw.-subj error A CDI }Betw.-subj error B There are also 22 within-subject errors (not shown) 18
19 D. Three useful answers 1. The example above showed only the case where the subject s regressions lines shifted up or down - the Random Intercept model. Is there also a Random Slope model, analogous to fitting interaction terms for the fixed-effects model; where both the slope and intercept vary between subjects? 19
20 D. Three useful answers 1. The example above showed only the case where the subject s regressions lines shifted up or down - the Random Intercept model. Is there also a Random Slope model, analogous to fitting interaction terms for the fixed-effects model; where both the slope and intercept vary between subjects? YES. 20
21 2. What do you call a model with Random Effects for subjects and Fixed Effects for age, sex, markers etc.? 21
22 2. What do you call a model with Random Effects for subjects and Fixed Effects for age, sex, markers etc.? A Mixed Effects model. This is very common. 22
23 3. When can you use derived variables ; when can you estimate the slope and intercept (or other summaries) for each subject and then do simple analyses of these? E.g., can t we just do a t-test of the difference between the slopes of marker + vs. marker - subjects? 23
24 3. When can you use derived variables ; that is, suppose you estimate the slope and intercept for each subject and then do simple analyses of these. E.g., can t we just do a t-test of a difference between the slopes of marker + vs. marker - subjects? This is appropriate when the study is balanced; that is, when every subject has measurements at a common set of ages with no missing values. Much more often true in the lab than the clinic. 24
Comments on the Controversy over Response-Adaptive Randomization
 Comments on the Controversy over Response-Adaptive Randomization Rick Chappell, Ph.D. Professor, Department of Biostatistics and Medical Informatics The Paul P. Carbone Comprehensive Cancer Center University
Multiple Regression. James H. Steiger. Department of Psychology and Human Development Vanderbilt University
 Multiple Regression James H. Steiger Department of Psychology and Human Development Vanderbilt University James H. Steiger (Vanderbilt University) Multiple Regression 1 / 19 Multiple Regression 1 The Multiple
Treatment effect estimates adjusted for small-study effects via a limit meta-analysis
 Treatment effect estimates adjusted for small-study effects via a limit meta-analysis Gerta Rücker 1, James Carpenter 12, Guido Schwarzer 1 1 Institute of Medical Biometry and Medical Informatics, University
NORTH SOUTH UNIVERSITY TUTORIAL 2
 NORTH SOUTH UNIVERSITY TUTORIAL 2 AHMED HOSSAIN,PhD Data Management and Analysis AHMED HOSSAIN,PhD - Data Management and Analysis 1 Correlation Analysis INTRODUCTION In correlation analysis, we estimate
First of two parts Joseph Hogan Brown University and AMPATH
 First of two parts Joseph Hogan Brown University and AMPATH Overview What is regression? Does regression have to be linear? Case study: Modeling the relationship between weight and CD4 count Exploratory
Lab 4 (M13) Objective: This lab will give you more practice exploring the shape of data, and in particular in breaking the data into two groups.
 Objective: This lab will give you more practice exploring the shape of data, and in particular in breaking the data into two groups.") Lab 4 (M13) Objective: This lab will give you more practice exploring the shape of data, and in particular in breaking the data into two groups. Activity 1 Examining Data From Class Background Download
Lab 4 (M13) Objective: This lab will give you more practice exploring the shape of data, and in particular in breaking the data into two groups. Activity 1 Examining Data From Class Background Download
Chapter 3 CORRELATION AND REGRESSION
 CORRELATION AND REGRESSION TOPIC SLIDE Linear Regression Defined 2 Regression Equation 3 The Slope or b 4 The Y-Intercept or a 5 What Value of the Y-Variable Should be Predicted When r = 0? 7 The Regression
5 To Invest or not to Invest? That is the Question.
 5 To Invest or not to Invest? That is the Question. Before starting this lab, you should be familiar with these terms: response y (or dependent) and explanatory x (or independent) variables; slope and
Outline of Part III. SISCR 2016, Module 7, Part III. SISCR Module 7 Part III: Comparing Two Risk Models
 SISCR Module 7 Part III: Comparing Two Risk Models Kathleen Kerr, Ph.D. Associate Professor Department of Biostatistics University of Washington Outline of Part III 1. How to compare two risk models 2.
Regression CHAPTER SIXTEEN NOTE TO INSTRUCTORS OUTLINE OF RESOURCES
 CHAPTER SIXTEEN Regression NOTE TO INSTRUCTORS This chapter includes a number of complex concepts that may seem intimidating to students. Encourage students to focus on the big picture through some of
Simple Linear Regression
 Simple Linear Regression Assoc. Prof Dr Sarimah Abdullah Unit of Biostatistics & Research Methodology School of Medical Sciences, Health Campus Universiti Sains Malaysia Regression Regression analysis
Stat 13, Lab 11-12, Correlation and Regression Analysis
 Stat 13, Lab 11-12, Correlation and Regression Analysis Part I: Before Class Objective: This lab will give you practice exploring the relationship between two variables by using correlation, linear regression
Chapter 11 Multiple Regression
 Chapter 11 Multiple Regression PSY 295 Oswald Outline The problem An example Compensatory and Noncompensatory Models More examples Multiple correlation Chapter 11 Multiple Regression 2 Cont. Outline--cont.
Test Code : RZI/RZII (Short Answer type) Junior Research Fellowship in Psychology
 Junior Research Fellowship in Psychology") Test Code : RZI/RZII (Short Answer type) 2008 Junior Research Fellowship in Psychology The candidates for Junior Research Fellowship in Psychology are required to take short answer type tests Research
Test Code : RZI/RZII (Short Answer type) 2008 Junior Research Fellowship in Psychology The candidates for Junior Research Fellowship in Psychology are required to take short answer type tests Research
Conditional Distributions and the Bivariate Normal Distribution. James H. Steiger
 Conditional Distributions and the Bivariate Normal Distribution James H. Steiger Overview In this module, we have several goals: Introduce several technical terms Bivariate frequency distribution Marginal
Correlation and regression
 PG Dip in High Intensity Psychological Interventions Correlation and regression Martin Bland Professor of Health Statistics University of York http://martinbland.co.uk/ Correlation Example: Muscle strength
REPEATED MEASURES DESIGNS
 Repeated Measures Designs The SAGE Encyclopedia of Educational Research, Measurement and Evaluation Markus Brauer (University of Wisconsin-Madison) Target word count: 1000 - Actual word count: 1071 REPEATED
Midterm STAT-UB.0003 Regression and Forecasting Models. I will not lie, cheat or steal to gain an academic advantage, or tolerate those who do.
 Midterm STAT-UB.0003 Regression and Forecasting Models The exam is closed book and notes, with the following exception: you are allowed to bring one letter-sized page of notes into the exam (front and
BAYESIAN JOINT LONGITUDINAL-DISCRETE TIME SURVIVAL MODELS: EVALUATING BIOPSY PROTOCOLS IN ACTIVE-SURVEILLANCE STUDIES
 BAYESIAN JOINT LONGITUDINAL-DISCRETE TIME SURVIVAL MODELS: EVALUATING BIOPSY PROTOCOLS IN ACTIVE-SURVEILLANCE STUDIES Lurdes Y. T. Inoue, PhD Professor Department of Biostatistics University of Washington
Ordinary Least Squares Regression
 Ordinary Least Squares Regression March 2013 Nancy Burns (nburns@isr.umich.edu) - University of Michigan From description to cause Group Sample Size Mean Health Status Standard Error Hospital 7,774 3.21.014
BadgerCare Plus. Healthcheck Requirements With Periodicity
 BadgerCare Plus Healthcheck Requirements With Periodicity Program The HealthCheck Programam The Healthcheck Program The Healthcheck Program is a required service under Wisconsin s BadgerCare Plus program
Test Code: SCA/SCB (Short Answer type) Junior Research Fellowship in Psychology
 Junior Research Fellowship in Psychology") Test Code: SCA/SCB (Short Answer type) 2013 Junior Research Fellowship in Psychology The candidates for Junior Research Fellowship in Psychology are required to take short answer type tests Research methodology
Test Code: SCA/SCB (Short Answer type) 2013 Junior Research Fellowship in Psychology The candidates for Junior Research Fellowship in Psychology are required to take short answer type tests Research methodology
Find the coordinates of the labeled points. 1) 1) Identify the quadrant with the given condition. 4) The first coordinate is positive.
 1) Identify the quadrant with the given condition. 4) The first coordinate is positive.") M115 (Beginning Algebra) Chapter 3 Practice Test Name: SHORT ANSWER. Write the word or phrase that best completes each statement or answers the question. Find the coordinates of the labeled points. 1)
M115 (Beginning Algebra) Chapter 3 Practice Test Name: SHORT ANSWER. Write the word or phrase that best completes each statement or answers the question. Find the coordinates of the labeled points. 1)
Generalized Estimating Equations for Depression Dose Regimes
 Generalized Estimating Equations for Depression Dose Regimes Karen Walker, Walker Consulting LLC, Menifee CA Generalized Estimating Equations on the average produce consistent estimates of the regression
Analysis of Categorical Data from the Ashe Center Student Wellness Survey
 Lab 6 Analysis of Categorical Data from the Ashe Center Student Wellness Survey Before starting this lab, you should be familiar with: the difference between categorical and quantitative variables, and
Measurement. Reliability vs. Validity. Reliability vs. Validity
 MEASUREMENT Outline 1. Measurement - Reliability vs. Validity - Validity - Threats to Internal Validity - Construct Validity (measurement validity) - Face validity - Content validity - Predictive validity
m 11 m.1 > m 12 m.2 risk for smokers risk for nonsmokers
 SOCY5061 RELATIVE RISKS, RELATIVE ODDS, LOGISTIC REGRESSION RELATIVE RISKS: Suppose we are interested in the association between lung cancer and smoking. Consider the following table for the whole population:
Simple Linear Regression the model, estimation and testing
 Simple Linear Regression the model, estimation and testing Lecture No. 05 Example 1 A production manager has compared the dexterity test scores of five assembly-line employees with their hourly productivity.
Lecture 14: Adjusting for between- and within-cluster covariates in the analysis of clustered data May 14, 2009
 Measurement, Design, and Analytic Techniques in Mental Health and Behavioral Sciences p. 1/3 Measurement, Design, and Analytic Techniques in Mental Health and Behavioral Sciences Lecture 14: Adjusting
Selected Topics in Biostatistics Seminar Series. Missing Data. Sponsored by: Center For Clinical Investigation and Cleveland CTSC
 Selected Topics in Biostatistics Seminar Series Missing Data Sponsored by: Center For Clinical Investigation and Cleveland CTSC Brian Schmotzer, MS Biostatistician, CCI Statistical Sciences Core brian.schmotzer@case.edu
1.4 - Linear Regression and MS Excel
 1.4 - Linear Regression and MS Excel Regression is an analytic technique for determining the relationship between a dependent variable and an independent variable. When the two variables have a linear
Clinical Pharmacology. Clinical Pharmacology = Disease Progress + Drug Action. Outline. Disease Progress and Drug Action
 1 Clinical Pharmacology Disease Progress and Drug Action Nick Holford Dept Pharmacology and Clinical Pharmacology University of Auckland 2 Clinical Pharmacology = Disease Progress + Drug Action Clinical
 "Homegrown" Exercises around M&M Chapter 6-1- Help a journalist to be "statistically correct" age-related prevalence, and conflicting evidence exists in favor of the mortality hypothesis. We compared mortality
SISCR Module 4 Part III: Comparing Two Risk Models. Kathleen Kerr, Ph.D. Associate Professor Department of Biostatistics University of Washington
 SISCR Module 4 Part III: Comparing Two Risk Models Kathleen Kerr, Ph.D. Associate Professor Department of Biostatistics University of Washington Outline of Part III 1. How to compare two risk models 2.
Benchmark Dose Modeling Cancer Models. Allen Davis, MSPH Jeff Gift, Ph.D. Jay Zhao, Ph.D. National Center for Environmental Assessment, U.S.
 Benchmark Dose Modeling Cancer Models Allen Davis, MSPH Jeff Gift, Ph.D. Jay Zhao, Ph.D. National Center for Environmental Assessment, U.S. EPA Disclaimer The views expressed in this presentation are those
Analyzing diastolic and systolic blood pressure individually or jointly?
 Analyzing diastolic and systolic blood pressure individually or jointly? Chenglin Ye a, Gary Foster a, Lisa Dolovich b, Lehana Thabane a,c a. Department of Clinical Epidemiology and Biostatistics, McMaster
Economics 471 Lecture 1. Regression to Mediocrity: Galton s Study of the Inheritance of Height
 University of Illinois Spring 2006 Department of Economics Roger Koenker Economics 471 Lecture 1 Regression to Mediocrity: Galton s Study of the Inheritance of Height Arguably, the most important statistical
SISCR Module 7 Part I: Introduction Basic Concepts for Binary Biomarkers (Classifiers) and Continuous Biomarkers
 and Continuous Biomarkers") SISCR Module 7 Part I: Introduction Basic Concepts for Binary Biomarkers (Classifiers) and Continuous Biomarkers Kathleen Kerr, Ph.D. Associate Professor Department of Biostatistics University of Washington
SISCR Module 7 Part I: Introduction Basic Concepts for Binary Biomarkers (Classifiers) and Continuous Biomarkers Kathleen Kerr, Ph.D. Associate Professor Department of Biostatistics University of Washington
Module Overview. What is a Marker? Part 1 Overview
 SISCR Module 7 Part I: Introduction Basic Concepts for Binary Classification Tools and Continuous Biomarkers Kathleen Kerr, Ph.D. Associate Professor Department of Biostatistics University of Washington
MEASURES OF ASSOCIATION AND REGRESSION
 DEPARTMENT OF POLITICAL SCIENCE AND INTERNATIONAL RELATIONS Posc/Uapp 816 MEASURES OF ASSOCIATION AND REGRESSION I. AGENDA: A. Measures of association B. Two variable regression C. Reading: 1. Start Agresti
bivariate analysis: The statistical analysis of the relationship between two variables.
 bivariate analysis: The statistical analysis of the relationship between two variables. cell frequency: The number of cases in a cell of a cross-tabulation (contingency table). chi-square (χ 2 ) test for
Sweet Talk. Text Messaging Support for Young People with Diabetes. Victoria Franklin Ninewells Hospital, Dundee, Scotland
 Sweet Talk Text Messaging Support for Young People with Diabetes Victoria Franklin Ninewells Hospital, Dundee, Scotland 1 NICE Guidelines on the Management of Type 1 Diabetes Intensive Diabetes Management
The Impact of Melamine Spiking on the Gel Strength and Viscosity of Gelatin
 The Impact of Melamine Spiking on the and of atin Introduction The primary purpose of this research was to assess the impact of melamine spiking on the gel strength and viscosity of gelatin. A secondary
George B. Ploubidis. The role of sensitivity analysis in the estimation of causal pathways from observational data. Improving health worldwide
 George B. Ploubidis The role of sensitivity analysis in the estimation of causal pathways from observational data Improving health worldwide www.lshtm.ac.uk Outline Sensitivity analysis Causal Mediation
WDHS Curriculum Map Probability and Statistics. What is Statistics and how does it relate to you?
 WDHS Curriculum Map Probability and Statistics Time Interval/ Unit 1: Introduction to Statistics 1.1-1.3 2 weeks S-IC-1: Understand statistics as a process for making inferences about population parameters
Homework #3. SHORT ANSWER. Write the word or phrase that best completes each statement or answers the question.
 Homework #3 Name Due Due on on February Tuesday, Due on February 17th, Sept Friday 28th 17th, Friday SHORT ANSWER. Write the word or phrase that best completes each statement or answers the question. Fill
Simple Linear Regression: Prediction. Instructor: G. William Schwert
 APS 425 Fall 2015 Simple Linear Regression: Prediction Instructor: G. William Schwert 585-275-2470 schwert@schwert.ssb.rochester.edu Ciba-Geigy Ritalin Experiment Ritalin is tested to see if it helps with
Differential Item Functioning
 Differential Item Functioning Lecture #11 ICPSR Item Response Theory Workshop Lecture #11: 1of 62 Lecture Overview Detection of Differential Item Functioning (DIF) Distinguish Bias from DIF Test vs. Item
Analytic Strategies for the OAI Data
 Analytic Strategies for the OAI Data Charles E. McCulloch, Division of Biostatistics, Dept of Epidemiology and Biostatistics, UCSF ACR October 2008 Outline 1. Introduction and examples. 2. General analysis
Cleveland State University Department of Electrical and Computer Engineering Control Systems Laboratory. Experiment #3
 Cleveland State University Department of Electrical and Computer Engineering Control Systems Laboratory Experiment #3 Closed Loop Steady State Error and Transient Performance INTRODUCTION The two primary
Final Exam Version A
 Final Exam Version A Open Book and Notes your 4-digit code: Staple the question sheets to your answers Write your name only once on the back of this sheet. Problem 1: (10 points) A popular method to isolate
end-stage renal disease
 Case study: AIDS and end-stage renal disease Robert Smith? Department of Mathematics and Faculty of Medicine The University of Ottawa AIDS and end-stage renal disease ODEs Curve fitting AIDS End-stage
BOOTSTRAPPING CONFIDENCE LEVELS FOR HYPOTHESES ABOUT QUADRATIC (U-SHAPED) REGRESSION MODELS
 REGRESSION MODELS") BOOTSTRAPPING CONFIDENCE LEVELS FOR HYPOTHESES ABOUT QUADRATIC (U-SHAPED) REGRESSION MODELS 12 June 2012 Michael Wood University of Portsmouth Business School SBS Department, Richmond Building Portland
BOOTSTRAPPING CONFIDENCE LEVELS FOR HYPOTHESES ABOUT QUADRATIC (U-SHAPED) REGRESSION MODELS 12 June 2012 Michael Wood University of Portsmouth Business School SBS Department, Richmond Building Portland
MS&E 226: Small Data
 MS&E 226: Small Data Lecture 10: Introduction to inference (v2) Ramesh Johari ramesh.johari@stanford.edu 1 / 17 What is inference? 2 / 17 Where did our data come from? Recall our sample is: Y, the vector
Lecture 6B: more Chapter 5, Section 3 Relationships between Two Quantitative Variables; Regression
 Lecture 6B: more Chapter 5, Section 3 Relationships between Two Quantitative Variables; Regression! Equation of Regression Line; Residuals! Effect of Explanatory/Response Roles! Unusual Observations! Sample
Women in Science and Engineering: What the Research Really Says. A panel discussion co-sponsored by WISELI and the Science Alliance.
 Women in Science and Engineering: What the Research Really Says A panel discussion co-sponsored by WISELI and the Science Alliance. Thursday April 14, 2005 Biotechnology Center Auditorium, University of
Studying the effect of change on change : a different viewpoint
 Studying the effect of change on change : a different viewpoint Eyal Shahar Professor, Division of Epidemiology and Biostatistics, Mel and Enid Zuckerman College of Public Health, University of Arizona
Lecture 12: more Chapter 5, Section 3 Relationships between Two Quantitative Variables; Regression
 Lecture 12: more Chapter 5, Section 3 Relationships between Two Quantitative Variables; Regression Equation of Regression Line; Residuals Effect of Explanatory/Response Roles Unusual Observations Sample
Clincial Biostatistics. Regression
 Regression analyses Clincial Biostatistics Regression Regression is the rather strange name given to a set of methods for predicting one variable from another. The data shown in Table 1 and come from a
AP Stats Chap 27 Inferences for Regression
 AP Stats Chap 27 Inferences for Regression Finally, we re interested in examining how slopes of regression lines vary from sample to sample. Each sample will have it s own slope, b 1. These are all estimates
12/30/2017. PSY 5102: Advanced Statistics for Psychological and Behavioral Research 2
 PSY 5102: Advanced Statistics for Psychological and Behavioral Research 2 Selecting a statistical test Relationships among major statistical methods General Linear Model and multiple regression Special
Healthy Communities Conference Ana Diez Roux 1. Okay, good afternoon. It s a pleasure to be here. I guess by, I
 1 Okay, good afternoon. It s a pleasure to be here. I guess by, I don t know, things happen in life. I ve become an academic somehow, although I started out as a pediatrician a long time ago. And it s
Biostatistics for Med Students. Lecture 1
 Biostatistics for Med Students Lecture 1 John J. Chen, Ph.D. Professor & Director of Biostatistics Core UH JABSOM JABSOM MD7 February 14, 2018 Lecture note: http://biostat.jabsom.hawaii.edu/education/training.html
Longitudinal data monitoring for Child Health Indicators
 Longitudinal data monitoring for Child Health Indicators Vincent Were Statistician, Senior Data Manager and Health Economist Kenya Medical Research institute [KEMRI] Presentation at Kenya Paediatric Association
Statistics and Probability
 Statistics and a single count or measurement variable. S.ID.1: Represent data with plots on the real number line (dot plots, histograms, and box plots). S.ID.2: Use statistics appropriate to the shape
1 Version SP.A Investigate patterns of association in bivariate data
 Claim 1: Concepts and Procedures Students can explain and apply mathematical concepts and carry out mathematical procedures with precision and fluency. Content Domain: Statistics and Probability Target
Non-parametric methods for linkage analysis
 BIOSTT516 Statistical Methods in Genetic Epidemiology utumn 005 Non-parametric methods for linkage analysis To this point, we have discussed model-based linkage analyses. These require one to specify a
Longitudinal and Hierarchical Analytic Strategies for OAI Data
 Longitudinal and Hierarchical Analytic Strategies for OAI Data Charles E. McCulloch, Division of Biostatistics, Dept of Epidemiology and Biostatistics, UCSF OARSI Montreal September 10, 2009 Outline 1.
BOOTSTRAPPING CONFIDENCE LEVELS FOR HYPOTHESES ABOUT REGRESSION MODELS
 BOOTSTRAPPING CONFIDENCE LEVELS FOR HYPOTHESES ABOUT REGRESSION MODELS 17 December 2009 Michael Wood University of Portsmouth Business School SBS Department, Richmond Building Portland Street, Portsmouth
Lecture Outline. Biost 517 Applied Biostatistics I. Purpose of Descriptive Statistics. Purpose of Descriptive Statistics
 Biost 517 Applied Biostatistics I Scott S. Emerson, M.D., Ph.D. Professor of Biostatistics University of Washington Lecture 3: Overview of Descriptive Statistics October 3, 2005 Lecture Outline Purpose
Module 14: Missing Data Concepts
 Module 14: Missing Data Concepts Jonathan Bartlett & James Carpenter London School of Hygiene & Tropical Medicine Supported by ESRC grant RES 189-25-0103 and MRC grant G0900724 Pre-requisites Module 3
HUMAN-COMPUTER INTERACTION EXPERIMENTAL DESIGN
 HUMAN-COMPUTER INTERACTION EXPERIMENTAL DESIGN Professor Bilge Mutlu Computer Sciences, Psychology, & Industrial and Systems Engineering University of Wisconsin Madison CS/Psych-770 Human-Computer Interaction
On Regression Analysis Using Bivariate Extreme Ranked Set Sampling
 On Regression Analysis Using Bivariate Extreme Ranked Set Sampling Atsu S. S. Dorvlo atsu@squ.edu.om Walid Abu-Dayyeh walidan@squ.edu.om Obaid Alsaidy obaidalsaidy@gmail.com Abstract- Many forms of ranked
Statistical Techniques. Meta-Stat provides a wealth of statistical tools to help you examine your data. Overview
 7 Applying Statistical Techniques Meta-Stat provides a wealth of statistical tools to help you examine your data. Overview... 137 Common Functions... 141 Selecting Variables to be Analyzed... 141 Deselecting
IAPT: Regression. Regression analyses
 Regression analyses IAPT: Regression Regression is the rather strange name given to a set of methods for predicting one variable from another. The data shown in Table 1 and come from a student project
Use the above variables and any you might need to construct to specify the MODEL A/C comparisons you would use to ask the following questions.
 Fall, 2002 Grad Stats Final Exam There are four questions on this exam, A through D, and each question has multiple sub-questions. Unless otherwise indicated, each sub-question is worth 3 points. Question
2.75: 84% 2.5: 80% 2.25: 78% 2: 74% 1.75: 70% 1.5: 66% 1.25: 64% 1.0: 60% 0.5: 50% 0.25: 25% 0: 0%
 Capstone Test (will consist of FOUR quizzes and the FINAL test grade will be an average of the four quizzes). Capstone #1: Review of Chapters 1-3 Capstone #2: Review of Chapter 4 Capstone #3: Review of
An informal analysis of multilevel variance
 APPENDIX 11A An informal analysis of multilevel Imagine we are studying the blood pressure of a number of individuals (level 1) from different neighbourhoods (level 2) in the same city. We start by doing
Constructing a mixed model using the AIC
 Constructing a mixed model using the AIC The Data: The Citalopram study (PI Dr. Zisook) Does Citalopram reduce the depression in schizophrenic patients with subsyndromal depression Two Groups: Citalopram
RISK PREDICTION MODEL: PENALIZED REGRESSIONS
 RISK PREDICTION MODEL: PENALIZED REGRESSIONS Inspired from: How to develop a more accurate risk prediction model when there are few events Menelaos Pavlou, Gareth Ambler, Shaun R Seaman, Oliver Guttmann,
Class 7 Everything is Related
 Class 7 Everything is Related Correlational Designs l 1 Topics Types of Correlational Designs Understanding Correlation Reporting Correlational Statistics Quantitative Designs l 2 Types of Correlational
Design and Analysis of QT/QTc Studies Conceptional and Methodical Considerations Based on Experience
 Design and Analysis of QT/QTc Studies Conceptional and Methodical Considerations Based on Experience Dr. Manfred Wargenau, Institute, Düsseldorf OVERVIEW Clinical background The ICH E14 guideline / review
Instrumental Variables Estimation: An Introduction
 Instrumental Variables Estimation: An Introduction Susan L. Ettner, Ph.D. Professor Division of General Internal Medicine and Health Services Research, UCLA The Problem The Problem Suppose you wish to
merlin: Mixed effects regression for linear, non-linear and user-defined models
 merlin: Mixed effects regression for linear, non-linear and user-defined models Stata UK Meeting London, 7th September 2018 Michael J. Crowther Biostatistics Research Group, Department of Health Sciences,
POL 242Y Final Test (Take Home) Name
 Name") POL 242Y Final Test (Take Home) Name_ Due August 6, 2008 The take-home final test should be returned in the classroom (FE 36) by the end of the class on August 6. Students who fail to submit the final
POL 242Y Final Test (Take Home) Name_ Due August 6, 2008 The take-home final test should be returned in the classroom (FE 36) by the end of the class on August 6. Students who fail to submit the final
Introduction to Gene Sets Analysis
 Introduction to Svitlana Tyekucheva Dana-Farber Cancer Institute May 15, 2012 Introduction Various measurements: gene expression, copy number variation, methylation status, mutation profile, etc. Main
AP Statistics Practice Test Ch. 3 and Previous
 AP Statistics Practice Test Ch. 3 and Previous Name Date Use the following to answer questions 1 and 2: A researcher measures the height (in feet) and volume of usable lumber (in cubic feet) of 32 cherry
How to analyze correlated and longitudinal data?
 How to analyze correlated and longitudinal data? Niloofar Ramezani, University of Northern Colorado, Greeley, Colorado ABSTRACT Longitudinal and correlated data are extensively used across disciplines
Penn State MPH Program Competencies 2013
 Core Competencies Five Core Areas of Public Health: Biostatistics 1. Explain the fundamental concepts of biostatistics. 2. Utilize common statistical methods (i.e., calculate, analyze, interpret, report)
A Novel Iterative Linear Regression Perceptron Classifier for Breast Cancer Prediction
 A Novel Iterative Linear Regression Perceptron Classifier for Breast Cancer Prediction Samuel Giftson Durai Research Scholar, Dept. of CS Bishop Heber College Trichy-17, India S. Hari Ganesh, PhD Assistant
17th Annual Meeting of the Organization for Human Brain Mapping (HBM) Effect of Family Income on Hippocampus Growth: Longitudinal Study
 Effect of Family Income on Hippocampus Growth: Longitudinal Study") 17th Annual Meeting of the Organization for Human Brain Mapping (HBM) Effect of Family Income on Hippocampus Growth: Longitudinal Study Abstract No: 2697 Authors: Moo K. Chung 1,2, Jamie L. Hanson 1, Richard
17th Annual Meeting of the Organization for Human Brain Mapping (HBM) Effect of Family Income on Hippocampus Growth: Longitudinal Study Abstract No: 2697 Authors: Moo K. Chung 1,2, Jamie L. Hanson 1, Richard
Hans Hockey & Kristian Brock Biometrics Matters Ltd, Hamilton, NZ & Cancer Research UK Clinical Trials Unit, Birmingham, UK
 HOCKEY STICKS AND BROKEN STICKS A DESIGN FOR A SINGLE-TREATMENT, PLACEBO-CONTROLLED, DOUBLE-BLIND, RANDOMIZED CLINICAL TRIAL SUITABLE FOR CHRONIC DISEASES Hans Hockey & Kristian Brock Biometrics Matters
8/24/2011. Study Goal. Study Design. Patient Attributes Influencing Pain and Pain Management in Postoperative Total Knee Arthroplasty Patients
 Patient Attributes Influencing Pain and Pain Management in Postoperative Total Knee Arthroplasty Patients Concurrent Session 1F Deborah L. Gentile, PhD, RN-BC Research Scientist Aurora Health Care Milwaukee,
Method Comparison for Interrater Reliability of an Image Processing Technique in Epilepsy Subjects
 22nd International Congress on Modelling and Simulation, Hobart, Tasmania, Australia, 3 to 8 December 2017 mssanz.org.au/modsim2017 Method Comparison for Interrater Reliability of an Image Processing Technique
WORKING P A P E R. Analysis of Case-Mix Strategies and Recommendations for Medicare Fee-for-Service CAHPS. Case-Mix Adjustment Report: 2004
 WORKING P A P E R Analysis of Case-Mix Strategies and Recommendations for Medicare Fee-for-Service CAHPS Case-Mix Adjustment Report: 2004 MARC N. ELLIOTT, KATRIN HAMBARSOOMIANS, AND CAROL A. EDWARDS WR-332-CMS
Accuracy and Precision Performance of the Accu-Chek Mobile System. Introduction. Method
 Accuracy and Precision Performance of the Accu-Chek Mobile System I. ACCURACY The accuracy of the system was assessed according to ISO 15197. Introduction The purpose of this study was to determine the
Case Study: Lead Exposure in Children
 Case Study: Lead Exposure in Children Instructions for Lab # 3 Statistics 111 - Probability and Statistical Inference DUE DATE: Upload on Sakai on July 22 Lab Objective The purpose of the lab is to help
5.2 ESTIMATING PROBABILITIES
 5.2 ESTIMATING PROBABILITIES It seems clear that the five-step approach of estimating expected values in Chapter 4 should also work here in Chapter 5 for estimating probabilities. Consider the following