Statistics: A Brief Overview Part I. Katherine Shaver, M.S. Biostatistician Carilion Clinic
|
|
|
- Shon Flowers
- 5 years ago
- Views:
Transcription

1 Statistics: A Brief Overview Part I Katherine Shaver, M.S. Biostatistician Carilion Clinic
2 Statistics: A Brief Overview Course Objectives Upon completion of the course, you will be able to: Distinguish among several statistical applications Select a statistical application suitable for a research question/hypothesis/estimation Identify basic database structure / organization requirements necessary for statistical testing and interpretation
3 What Can Statistics Do For You? Make your research results credible Help you get your work published Make you an informed consumer of others research
4 Categories of Statistics Descriptive Statistics Inferential Statistics
5 Descriptive Statistics Used to Summarize a Set of Data N (size of sample) Mean, Median, Mode (central tendency) Standard deviation, 25 th and 75 th percentiles (variability) Minimum, Maximum (range of data) Frequencies (counts, percentages)
6 Example of a Summary Table of Descriptive Statistics Summary Statistics for LDL Cholesterol Lab Parameter N Mean Std. Dev. Min Q1 Median Q3 Max LDL Cholesterol (mg/dl)
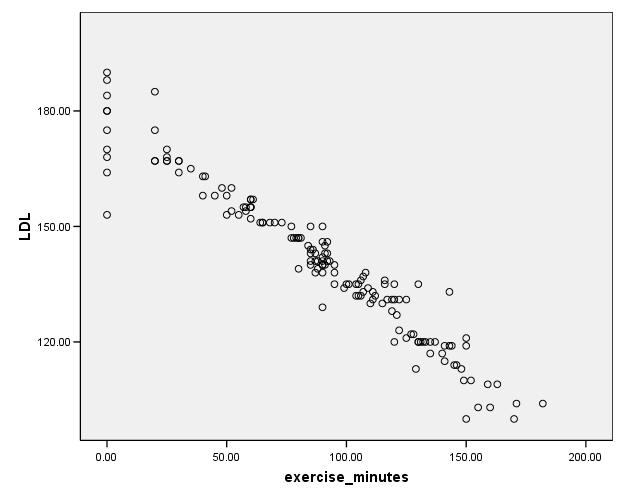
7 Scatterplot
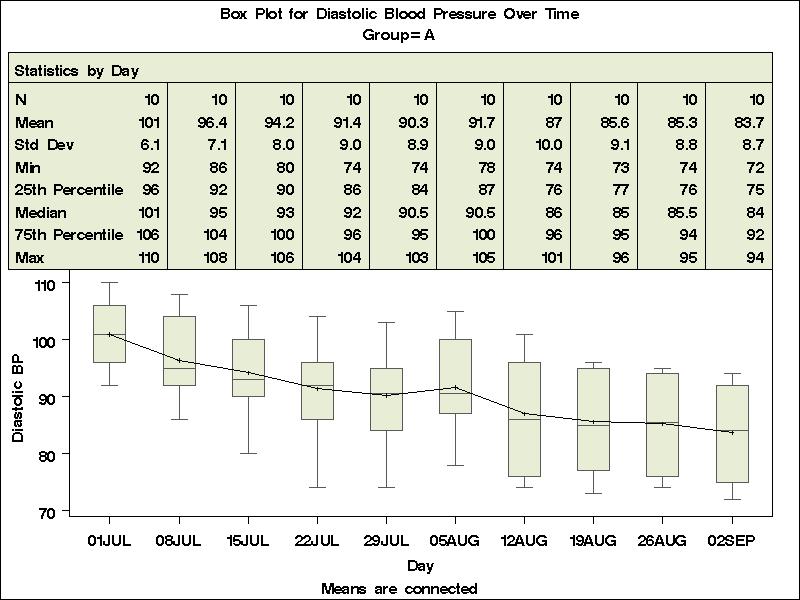
8 Box-and-Whisker Plot
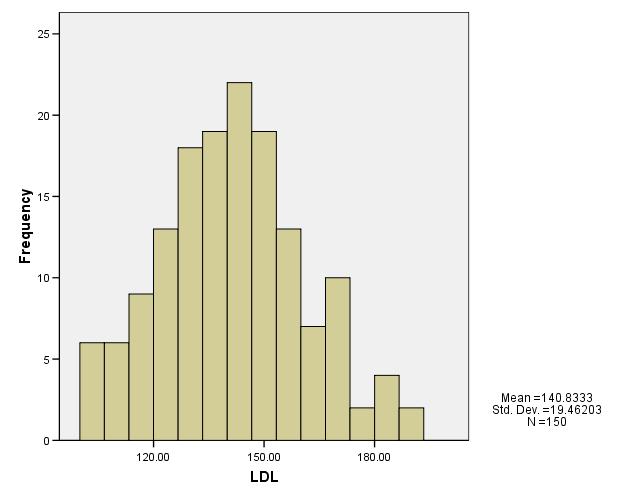
9 Histogram
10 Length of Hospital Stay A Skewed Distribution P e r c e n t Length of Hospital Stay (Days)
11 Inferential Statistics Data from a random sample used to draw conclusions about a larger, unmeasured population Two Types Estimation Hypothesis Testing
12 Types of Inferential Analyses Estimation calculate an approximation of a result and the precision of the approximation [associated with confidence interval] Hypothesis Testing determine if two or more groups are statistically significantly different from one another [associated with p-value]
13 Types of Data The type of data you have will influence your choice of statistical methods
14 Types of Data Categorical: Data that are labels rather than numbers Nominal order of the categories is arbitrary (e.g., gender) Ordinal natural ordering of the data. (e.g., severity of pain rated as: None, Mild, Moderate, Severe, Very Severe)
15 Types of Data (cont d) Discrete: Measurement scale consisting of a number of separate values where intermediate values are not permissible (e.g., the number of trauma patients admitted to the hospital in a given day) Continuous: Data with a potentially infinite number of possible values (e.g., weight, blood pressure)
16 Dependent vs. Independent Variable Dependent Variable: variable you believe may be influenced / modified by treatment or exposure. May represent variable you are trying to predict. Sometimes referred to as response or outcome variable.
17 Dependent vs. Independent Variable Independent Variable: variable you believe may influence outcome measure. Often referred to as predictor or explanatory variable.
18 Selection of Appropriate Statistical Method for Hypothesis Testing Predictor (Independent) Variable Categorical Continuous Outcome (Dependent) Variable Categorical Continuous Chi-square, Fisher s Exact Test t-test, ANOVA Logistic Regression Correlation, Linear Regression
19 Sample Questions, Example Datasets The following slides contain examples of research questions that are answered using hypothesis testing. Each question is matched with an appropriate statistical method. (Today s presentation will only cover t-tests and the rest will be covered in Part II of this course.) For each question/method combination, there is also a snapshot of what the dataset would look like.
20 One-sample Student s t-test A one-sample Student s t-test is useful for comparing the mean value of an experimental group with the mean value of a known norm. Example: The statewide mean ISS score for patients involved in a motorcycle accident and admitted to a hospital is 10. Does the ISS score of CRMH motorcycle patients differ from the statewide average?
21 Data Layout for a One-sample Student s t-test Patient_ID CRMH_ISS
22 One-sample Student s t-test Test Statistic t x S n The test statistic is calculated. If the probability of getting the resulting test statistic by chance is <0.05 then the CRMH ISS is considered to be statistically significantly different than the VA statewide ISS. Note: Failure to achieve statistical significance does not imply that there is no difference. It should be interpreted that there is not enough evidence to detect a statistically significant difference.
23 Two-Sample Student s t-test for Independent Samples A 2-Sample Student s t-test for independent samples is used to compare the means of two different groups. Example: Is there a difference in the time to therapeutic threshold of a drug in lower weight patients compared to higher weight patients?
24 Data Layout for 2-Sample t-test for Independent Samples Group Time_in_Hours < 100 kg 5.5 < 100 kg 12 < 100 kg 6 < 100 kg 22 < 100 kg 38 >= 100 kg 18 >= 100 kg 42 >= 100 kg 36 >= 100 kg 20 >= 100 kg 14
25 2-Sample t-test for Independent Group 1: < 100 kg Group 2: >= 100 kg Samples Test Statistic t S p x 1 n x n 2 The test statistic is calculated. If the probability of getting the resulting value by chance is <0.05 then the means of the two groups are considered to be statistically significantly different from one another.
26 Paired t-test For comparing pre and post data from the same subject Patient_ID Pre_Score Post_Score
27 Paired t-test Calculate the mean and standard deviation of the difference Test statistic t S d D n The test statistic is calculated and if the probability of getting the resulting value by chance is <0.05 then there is a statistically significant change from pre to post.
28 Part II Part II of this course will cover analysis of variance (ANOVA), correlation, regression, and analysis of categorical data / proportions. We will also discuss power analysis.
29 A Biostatistician Can Help You With: Study design Choosing outcome variables and how they are measured Choosing appropriate statistical methodology Power and sample size calculation Helping to choose data sources Helping to design data collection forms Data cleaning, derivations, and analysis Interpretation of results Helping to write method and results sections of a document
30 Feel free to contact us! Mattie Tenzer, Director (x55192) Katherine Shaver, Biostatistician (x55197)
Biostatistics for Med Students. Lecture 1
 Biostatistics for Med Students Lecture 1 John J. Chen, Ph.D. Professor & Director of Biostatistics Core UH JABSOM JABSOM MD7 February 14, 2018 Lecture note: http://biostat.jabsom.hawaii.edu/education/training.html
What you should know before you collect data. BAE 815 (Fall 2017) Dr. Zifei Liu
 Dr. Zifei Liu") What you should know before you collect data BAE 815 (Fall 2017) Dr. Zifei Liu Zifeiliu@ksu.edu Types and levels of study Descriptive statistics Inferential statistics How to choose a statistical test
What you should know before you collect data BAE 815 (Fall 2017) Dr. Zifei Liu Zifeiliu@ksu.edu Types and levels of study Descriptive statistics Inferential statistics How to choose a statistical test
HOW STATISTICS IMPACT PHARMACY PRACTICE?
 HOW STATISTICS IMPACT PHARMACY PRACTICE? CPPD at NCCR 13 th June, 2013 Mohamed Izham M.I., PhD Professor in Social & Administrative Pharmacy Learning objective.. At the end of the presentation pharmacists
Research Designs and Potential Interpretation of Data: Introduction to Statistics. Let s Take it Step by Step... Confused by Statistics?
 Research Designs and Potential Interpretation of Data: Introduction to Statistics Karen H. Hagglund, M.S. Medical Education St. John Hospital & Medical Center Karen.Hagglund@ascension.org Let s Take it
Understandable Statistics
 Understandable Statistics correlated to the Advanced Placement Program Course Description for Statistics Prepared for Alabama CC2 6/2003 2003 Understandable Statistics 2003 correlated to the Advanced Placement
MTH 225: Introductory Statistics
 Marshall University College of Science Mathematics Department MTH 225: Introductory Statistics Course catalog description Basic probability, descriptive statistics, fundamental statistical inference procedures
Table of Contents. Plots. Essential Statistics for Nursing Research 1/12/2017
 Essential Statistics for Nursing Research Kristen Carlin, MPH Seattle Nursing Research Workshop January 30, 2017 Table of Contents Plots Descriptive statistics Sample size/power Correlations Hypothesis
Statistical questions for statistical methods
 Statistical questions for statistical methods Unpaired (two-sample) t-test DECIDE: Does the numerical outcome have a relationship with the categorical explanatory variable? Is the mean of the outcome the
Statistics as a Tool. A set of tools for collecting, organizing, presenting and analyzing numerical facts or observations.
 Statistics as a Tool A set of tools for collecting, organizing, presenting and analyzing numerical facts or observations. Descriptive Statistics Numerical facts or observations that are organized describe
On the purpose of testing:
 Why Evaluation & Assessment is Important Feedback to students Feedback to teachers Information to parents Information for selection and certification Information for accountability Incentives to increase
Basic Biostatistics. Chapter 1. Content
 Chapter 1 Basic Biostatistics Jamalludin Ab Rahman MD MPH Department of Community Medicine Kulliyyah of Medicine Content 2 Basic premises variables, level of measurements, probability distribution Descriptive
bivariate analysis: The statistical analysis of the relationship between two variables.
 bivariate analysis: The statistical analysis of the relationship between two variables. cell frequency: The number of cases in a cell of a cross-tabulation (contingency table). chi-square (χ 2 ) test for
SPRING GROVE AREA SCHOOL DISTRICT. Course Description. Instructional Strategies, Learning Practices, Activities, and Experiences.
 SPRING GROVE AREA SCHOOL DISTRICT PLANNED COURSE OVERVIEW Course Title: Basic Introductory Statistics Grade Level(s): 11-12 Units of Credit: 1 Classification: Elective Length of Course: 30 cycles Periods
STATISTICS AND RESEARCH DESIGN
 Statistics 1 STATISTICS AND RESEARCH DESIGN These are subjects that are frequently confused. Both subjects often evoke student anxiety and avoidance. To further complicate matters, both areas appear have
PRINCIPLES OF STATISTICS
 PRINCIPLES OF STATISTICS STA-201-TE This TECEP is an introduction to descriptive and inferential statistics. Topics include: measures of central tendency, variability, correlation, regression, hypothesis
Statistics. Nur Hidayanto PSP English Education Dept. SStatistics/Nur Hidayanto PSP/PBI
 Statistics Nur Hidayanto PSP English Education Dept. RESEARCH STATISTICS WHAT S THE RELATIONSHIP? RESEARCH RESEARCH positivistic Prepositivistic Postpositivistic Data Initial Observation (research Question)
STATISTICS & PROBABILITY
 STATISTICS & PROBABILITY LAWRENCE HIGH SCHOOL STATISTICS & PROBABILITY CURRICULUM MAP 2015-2016 Quarter 1 Unit 1 Collecting Data and Drawing Conclusions Unit 2 Summarizing Data Quarter 2 Unit 3 Randomness
NORTH SOUTH UNIVERSITY TUTORIAL 1
 NORTH SOUTH UNIVERSITY TUTORIAL 1 REVIEW FROM BIOSTATISTICS I AHMED HOSSAIN,PhD Data Management and Analysis AHMED HOSSAIN,PhD - Data Management and Analysis 1 DATA TYPES/ MEASUREMENT SCALES Categorical:
Business Statistics Probability
 Business Statistics The following was provided by Dr. Suzanne Delaney, and is a comprehensive review of Business Statistics. The workshop instructor will provide relevant examples during the Skills Assessment
9 research designs likely for PSYC 2100
 9 research designs likely for PSYC 2100 1) 1 factor, 2 levels, 1 group (one group gets both treatment levels) related samples t-test (compare means of 2 levels only) 2) 1 factor, 2 levels, 2 groups (one
Slide 1 - Introduction to Statistics Tutorial: An Overview Slide notes
 Slide 1 - Introduction to Statistics Tutorial: An Overview Introduction to Statistics Tutorial: An Overview. This tutorial is the first in a series of several tutorials that introduce probability and statistics.
How to interpret scientific & statistical graphs
 How to interpret scientific & statistical graphs Theresa A Scott, MS Department of Biostatistics theresa.scott@vanderbilt.edu http://biostat.mc.vanderbilt.edu/theresascott 1 A brief introduction Graphics:
Choosing the Correct Statistical Test
 Choosing the Correct Statistical Test T racie O. Afifi, PhD Departments of Community Health Sciences & Psychiatry University of Manitoba Department of Community Health Sciences COLLEGE OF MEDICINE, FACULTY
Unit 1 Exploring and Understanding Data
 Unit 1 Exploring and Understanding Data Area Principle Bar Chart Boxplot Conditional Distribution Dotplot Empirical Rule Five Number Summary Frequency Distribution Frequency Polygon Histogram Interquartile
WDHS Curriculum Map Probability and Statistics. What is Statistics and how does it relate to you?
 WDHS Curriculum Map Probability and Statistics Time Interval/ Unit 1: Introduction to Statistics 1.1-1.3 2 weeks S-IC-1: Understand statistics as a process for making inferences about population parameters
Dr. Kelly Bradley Final Exam Summer {2 points} Name
 {2 points} Name You MUST work alone no tutors; no help from classmates. Email me or see me with questions. You will receive a score of 0 if this rule is violated. This exam is being scored out of 00 points.
Statistical Techniques. Masoud Mansoury and Anas Abulfaraj
 Statistical Techniques Masoud Mansoury and Anas Abulfaraj What is Statistics? https://www.youtube.com/watch?v=lmmzj7599pw The definition of Statistics The practice or science of collecting and analyzing
Business Research Methods. Introduction to Data Analysis
 Business Research Methods Introduction to Data Analysis Data Analysis Process STAGES OF DATA ANALYSIS EDITING CODING DATA ENTRY ERROR CHECKING AND VERIFICATION DATA ANALYSIS Introduction Preparation of
Lecture Outline. Biost 517 Applied Biostatistics I. Purpose of Descriptive Statistics. Purpose of Descriptive Statistics
 Biost 517 Applied Biostatistics I Scott S. Emerson, M.D., Ph.D. Professor of Biostatistics University of Washington Lecture 3: Overview of Descriptive Statistics October 3, 2005 Lecture Outline Purpose
5/20/ Administration & Analysis of Surveys
 5/20/2015-1 Administration & Analysis of Surveys Goals Considerations when Administering Surveys Statistical Analysis of Surveys Examples of Reporting Survey Data 5/20/2015-2 Accuracy of Survey Data is
Types of Statistics. Censored data. Files for today (June 27) Lecture and Homework INTRODUCTION TO BIOSTATISTICS. Today s Outline
 Lecture and Homework INTRODUCTION TO BIOSTATISTICS. Today s Outline") INTRODUCTION TO BIOSTATISTICS FOR GRADUATE AND MEDICAL STUDENTS Files for today (June 27) Lecture and Homework Descriptive Statistics and Graphically Visualizing Data Lecture #2 (1 file) PPT presentation
INTRODUCTION TO BIOSTATISTICS FOR GRADUATE AND MEDICAL STUDENTS Files for today (June 27) Lecture and Homework Descriptive Statistics and Graphically Visualizing Data Lecture #2 (1 file) PPT presentation
11/18/2013. Correlational Research. Correlational Designs. Why Use a Correlational Design? CORRELATIONAL RESEARCH STUDIES
 Correlational Research Correlational Designs Correlational research is used to describe the relationship between two or more naturally occurring variables. Is age related to political conservativism? Are
A Brief (very brief) Overview of Biostatistics. Jody Kreiman, PhD Bureau of Glottal Affairs
 Overview of Biostatistics. Jody Kreiman, PhD Bureau of Glottal Affairs") A Brief (very brief) Overview of Biostatistics Jody Kreiman, PhD Bureau of Glottal Affairs What We ll Cover Fundamentals of measurement Parametric versus nonparametric tests Descriptive versus inferential
A Brief (very brief) Overview of Biostatistics Jody Kreiman, PhD Bureau of Glottal Affairs What We ll Cover Fundamentals of measurement Parametric versus nonparametric tests Descriptive versus inferential
Analysis and Interpretation of Data Part 1
 Analysis and Interpretation of Data Part 1 DATA ANALYSIS: PRELIMINARY STEPS 1. Editing Field Edit Completeness Legibility Comprehensibility Consistency Uniformity Central Office Edit 2. Coding Specifying
AP Statistics. Semester One Review Part 1 Chapters 1-5
 AP Statistics Semester One Review Part 1 Chapters 1-5 AP Statistics Topics Describing Data Producing Data Probability Statistical Inference Describing Data Ch 1: Describing Data: Graphically and Numerically
Methodological skills
 Methodological skills rma linguistics, week 3 Tamás Biró ACLC University of Amsterdam t.s.biro@uva.nl Tamás Biró, UvA 1 Topics today Parameter of the population. Statistic of the sample. Re: descriptive
Psychology Research Process
 Psychology Research Process Logical Processes Induction Observation/Association/Using Correlation Trying to assess, through observation of a large group/sample, what is associated with what? Examples:
Chapter 1: Exploring Data
 Chapter 1: Exploring Data Key Vocabulary:! individual! variable! frequency table! relative frequency table! distribution! pie chart! bar graph! two-way table! marginal distributions! conditional distributions!
Chapter 1: Introduction to Statistics
 Chapter 1: Introduction to Statistics Statistics, Science, and Observations Definition: The term statistics refers to a set of mathematical procedures for organizing, summarizing, and interpreting information.
Data Analysis with SPSS
 Data Analysis with SPSS A First Course in Applied Statistics Fourth Edition Stephen Sweet Ithaca College Karen Grace-Martin The Analysis Factor Allyn & Bacon Boston Columbus Indianapolis New York San Francisco
Introduction to Statistics
 Introduction to Statistics Variables Measurement scales Prof. Giuseppe Verlato Unit of Epidemiology & Medical Statistics Department of Diagnostics & Public Health University of Verona Statistics Discipline,
Lecture Outline. Biost 590: Statistical Consulting. Stages of Scientific Studies. Scientific Method
 Biost 590: Statistical Consulting Statistical Classification of Scientific Studies; Approach to Consulting Lecture Outline Statistical Classification of Scientific Studies Statistical Tasks Approach to
Lecture Outline Biost 517 Applied Biostatistics I. Statistical Goals of Studies Role of Statistical Inference
 Lecture Outline Biost 517 Applied Biostatistics I Scott S. Emerson, M.D., Ph.D. Professor of Biostatistics University of Washington Statistical Inference Role of Statistical Inference Hierarchy of Experimental
Describe what is meant by a placebo Contrast the double-blind procedure with the single-blind procedure Review the structure for organizing a memo
 Please note the page numbers listed for the Lind book may vary by a page or two depending on which version of the textbook you have. Readings: Lind 1 11 (with emphasis on chapters 10, 11) Please note chapter
Results & Statistics: Description and Correlation. I. Scales of Measurement A Review
 Results & Statistics: Description and Correlation The description and presentation of results involves a number of topics. These include scales of measurement, descriptive statistics used to summarize
Before we get started:
 Before we get started: http://arievaluation.org/projects-3/ AEA 2018 R-Commander 1 Antonio Olmos Kai Schramm Priyalathta Govindasamy Antonio.Olmos@du.edu AntonioOlmos@aumhc.org AEA 2018 R-Commander 2 Plan
Chapter 1: Introduction to Statistics
 Chapter 1: Introduction o to Statistics Statistics, ti ti Science, and Observations Definition: The term statistics refers to a set of mathematical procedures for organizing, summarizing, and interpreting
Medical Statistics 1. Basic Concepts Farhad Pishgar. Defining the data. Alive after 6 months?
 Medical Statistics 1 Basic Concepts Farhad Pishgar Defining the data Population and samples Except when a full census is taken, we collect data on a sample from a much larger group called the population.
Statistics is the science of collecting, organizing, presenting, analyzing, and interpreting data to assist in making effective decisions
 Readings: OpenStax Textbook - Chapters 1 5 (online) Appendix D & E (online) Plous - Chapters 1, 5, 6, 13 (online) Introductory comments Describe how familiarity with statistical methods can - be associated
Statistics: Making Sense of the Numbers
 Statistics: Making Sense of the Numbers Chapter 9 This multimedia product and its contents are protected under copyright law. The following are prohibited by law: any public performance or display, including
2.75: 84% 2.5: 80% 2.25: 78% 2: 74% 1.75: 70% 1.5: 66% 1.25: 64% 1.0: 60% 0.5: 50% 0.25: 25% 0: 0%
 Capstone Test (will consist of FOUR quizzes and the FINAL test grade will be an average of the four quizzes). Capstone #1: Review of Chapters 1-3 Capstone #2: Review of Chapter 4 Capstone #3: Review of
Describe what is meant by a placebo Contrast the double-blind procedure with the single-blind procedure Review the structure for organizing a memo
 Business Statistics The following was provided by Dr. Suzanne Delaney, and is a comprehensive review of Business Statistics. The workshop instructor will provide relevant examples during the Skills Assessment
Statistical reports Regression, 2010
 Statistical reports Regression, 2010 Niels Richard Hansen June 10, 2010 This document gives some guidelines on how to write a report on a statistical analysis. The document is organized into sections that
Chapter 1: Introduction to Statistics
 Chapter 1: Introduction to Statistics Variables A variable is a characteristic or condition that can change or take on different values. Most research begins with a general question about the relationship
Still important ideas
 Readings: OpenStax - Chapters 1 13 & Appendix D & E (online) Plous Chapters 17 & 18 - Chapter 17: Social Influences - Chapter 18: Group Judgments and Decisions Still important ideas Contrast the measurement
1. Introduction a. Meaning and Role of Statistics b. Descriptive and inferential Statistics c. Variable and Measurement Scales
 N. Setyaningsih 1. Introduction a. Meaning and Role of Statistics b. Descriptive and inferential Statistics c. Variable and Measurement Scales 2. Organizing Data for Meaningful Representations a. Frequency
Data and Statistics 101: Key Concepts in the Collection, Analysis, and Application of Child Welfare Data
 TECHNICAL REPORT Data and Statistics 101: Key Concepts in the Collection, Analysis, and Application of Child Welfare Data CONTENTS Executive Summary...1 Introduction...2 Overview of Data Analysis Concepts...2
POST GRADUATE DIPLOMA IN BIOETHICS (PGDBE) Term-End Examination June, 2016 MHS-014 : RESEARCH METHODOLOGY
 Term-End Examination June, 2016 MHS-014 : RESEARCH METHODOLOGY") No. of Printed Pages : 12 MHS-014 POST GRADUATE DIPLOMA IN BIOETHICS (PGDBE) Term-End Examination June, 2016 MHS-014 : RESEARCH METHODOLOGY Time : 2 hours Maximum Marks : 70 PART A Attempt all questions.
No. of Printed Pages : 12 MHS-014 POST GRADUATE DIPLOMA IN BIOETHICS (PGDBE) Term-End Examination June, 2016 MHS-014 : RESEARCH METHODOLOGY Time : 2 hours Maximum Marks : 70 PART A Attempt all questions.
11/24/2017. Do not imply a cause-and-effect relationship
 Correlational research is used to describe the relationship between two or more naturally occurring variables. Is age related to political conservativism? Are highly extraverted people less afraid of rejection
Readings: Textbook readings: OpenStax - Chapters 1 13 (emphasis on Chapter 12) Online readings: Appendix D, E & F
 Online readings: Appendix D, E & F") Readings: Textbook readings: OpenStax - Chapters 1 13 (emphasis on Chapter 12) Online readings: Appendix D, E & F Plous Chapters 17 & 18 Chapter 17: Social Influences Chapter 18: Group Judgments and Decisions
Readings: Textbook readings: OpenStax - Chapters 1 13 (emphasis on Chapter 12) Online readings: Appendix D, E & F Plous Chapters 17 & 18 Chapter 17: Social Influences Chapter 18: Group Judgments and Decisions
Psychology Research Process
 Psychology Research Process Logical Processes Induction Observation/Association/Using Correlation Trying to assess, through observation of a large group/sample, what is associated with what? Examples:
Still important ideas
 Readings: OpenStax - Chapters 1 11 + 13 & Appendix D & E (online) Plous - Chapters 2, 3, and 4 Chapter 2: Cognitive Dissonance, Chapter 3: Memory and Hindsight Bias, Chapter 4: Context Dependence Still
UNIT V: Analysis of Non-numerical and Numerical Data SWK 330 Kimberly Baker-Abrams. In qualitative research: Grounded Theory
 UNIT V: Analysis of Non-numerical and Numerical Data SWK 330 Kimberly Baker-Abrams In qualitative research: analysis is on going (occurs as data is gathered) must be careful not to draw conclusions before
Statistical analysis DIANA SAPLACAN 2017 * SLIDES ADAPTED BASED ON LECTURE NOTES BY ALMA LEORA CULEN
 Statistical analysis DIANA SAPLACAN 2017 * SLIDES ADAPTED BASED ON LECTURE NOTES BY ALMA LEORA CULEN Vs. 2 Background 3 There are different types of research methods to study behaviour: Descriptive: observations,
Introduction to SPSS. Katie Handwerger Why n How February 19, 2009
 Introduction to SPSS Katie Handwerger Why n How February 19, 2009 Overview Setting up a data file Frequencies/Descriptives One-sample T-test Paired-samples T-test Independent-samples T-test One-way ANOVA
INTRODUCTION TO MEDICAL RESEARCH: ESSENTIAL SKILLS
 INTRODUCTION TO MEDICAL RESEARCH: ESSENTIAL SKILLS SCALES OF MEASUREMENT AND WAYS OF SUMMARIZING DATA Alecsandra IRIMIE-ANA 1 1. Psychiatry Hospital Prof. Dr. Alexandru Obregia ABSTRACT Regardless the
Introduction to statistics Dr Alvin Vista, ACER Bangkok, 14-18, Sept. 2015
 Analysing and Understanding Learning Assessment for Evidence-based Policy Making Introduction to statistics Dr Alvin Vista, ACER Bangkok, 14-18, Sept. 2015 Australian Council for Educational Research Structure
Undertaking statistical analysis of
 Descriptive statistics: Simply telling a story Laura Delaney introduces the principles of descriptive statistical analysis and presents an overview of the various ways in which data can be presented by
Survey research (Lecture 1) Summary & Conclusion. Lecture 10 Survey Research & Design in Psychology James Neill, 2015 Creative Commons Attribution 4.
 Summary & Conclusion. Lecture 10 Survey Research & Design in Psychology James Neill, 2015 Creative Commons Attribution 4.") Summary & Conclusion Lecture 10 Survey Research & Design in Psychology James Neill, 2015 Creative Commons Attribution 4.0 Overview 1. Survey research 2. Survey design 3. Descriptives & graphing 4. Correlation
Summary & Conclusion Lecture 10 Survey Research & Design in Psychology James Neill, 2015 Creative Commons Attribution 4.0 Overview 1. Survey research 2. Survey design 3. Descriptives & graphing 4. Correlation
Survey research (Lecture 1)
") Summary & Conclusion Lecture 10 Survey Research & Design in Psychology James Neill, 2015 Creative Commons Attribution 4.0 Overview 1. Survey research 2. Survey design 3. Descriptives & graphing 4. Correlation
Summary & Conclusion Lecture 10 Survey Research & Design in Psychology James Neill, 2015 Creative Commons Attribution 4.0 Overview 1. Survey research 2. Survey design 3. Descriptives & graphing 4. Correlation
Theory. = an explanation using an integrated set of principles that organizes observations and predicts behaviors or events.
 Definition Slides Hindsight Bias = the tendency to believe, after learning an outcome, that one would have foreseen it. Also known as the I knew it all along phenomenon. Critical Thinking = thinking that
PRINTABLE VERSION. Quiz 1. True or False: The amount of rainfall in your state last month is an example of continuous data.
 Question 1 PRINTABLE VERSION Quiz 1 True or False: The amount of rainfall in your state last month is an example of continuous data. a) True b) False Question 2 True or False: The standard deviation is
Readings: Textbook readings: OpenStax - Chapters 1 11 Online readings: Appendix D, E & F Plous Chapters 10, 11, 12 and 14
 Readings: Textbook readings: OpenStax - Chapters 1 11 Online readings: Appendix D, E & F Plous Chapters 10, 11, 12 and 14 Still important ideas Contrast the measurement of observable actions (and/or characteristics)
MULTIPLE LINEAR REGRESSION 24.1 INTRODUCTION AND OBJECTIVES OBJECTIVES
 24 MULTIPLE LINEAR REGRESSION 24.1 INTRODUCTION AND OBJECTIVES In the previous chapter, simple linear regression was used when you have one independent variable and one dependent variable. This chapter
AP Psych - Stat 1 Name Period Date. MULTIPLE CHOICE. Choose the one alternative that best completes the statement or answers the question.
 AP Psych - Stat 1 Name Period Date MULTIPLE CHOICE. Choose the one alternative that best completes the statement or answers the question. 1) In a set of incomes in which most people are in the $15,000
AP Psych - Stat 2 Name Period Date. MULTIPLE CHOICE. Choose the one alternative that best completes the statement or answers the question.
 AP Psych - Stat 2 Name Period Date MULTIPLE CHOICE. Choose the one alternative that best completes the statement or answers the question. 1) In a set of incomes in which most people are in the $15,000
Chapter 2--Norms and Basic Statistics for Testing
 Chapter 2--Norms and Basic Statistics for Testing Student: 1. Statistical procedures that summarize and describe a series of observations are called A. inferential statistics. B. descriptive statistics.
CHAPTER 3 DATA ANALYSIS: DESCRIBING DATA
 Data Analysis: Describing Data CHAPTER 3 DATA ANALYSIS: DESCRIBING DATA In the analysis process, the researcher tries to evaluate the data collected both from written documents and from other sources such
Learning Objectives 9/9/2013. Hypothesis Testing. Conflicts of Interest. Descriptive statistics: Numerical methods Measures of Central Tendency
 Conflicts of Interest I have no conflict of interest to disclose Biostatistics Kevin M. Sowinski, Pharm.D., FCCP Last-Chance Ambulatory Care Webinar Thursday, September 5, 2013 Learning Objectives For
Samples, Sample Size And Sample Error. Research Methodology. How Big Is Big? Estimating Sample Size. Variables. Variables 2/25/2018
 Research Methodology Samples, Sample Size And Sample Error Sampling error = difference between sample and population characteristics Reducing sampling error is the goal of any sampling technique As sample
Math 261 Exam I Spring Name:
 Math 261 Exam I Spring 2008 Name: Instructions: Write your answers clearly on the exam paper. Show work to receive partial credit. Use the back of the page if you need more space but please note that you
9/4/2013. Decision Errors. Hypothesis Testing. Conflicts of Interest. Descriptive statistics: Numerical methods Measures of Central Tendency
 Conflicts of Interest I have no conflict of interest to disclose Biostatistics Kevin M. Sowinski, Pharm.D., FCCP Pharmacotherapy Webinar Review Course Tuesday, September 3, 2013 Descriptive statistics:
VU Biostatistics and Experimental Design PLA.216
 VU Biostatistics and Experimental Design PLA.216 Julia Feichtinger Postdoctoral Researcher Institute of Computational Biotechnology Graz University of Technology Outline for Today About this course Background
MMI 409 Spring 2009 Final Examination Gordon Bleil. 1. Is there a difference in depression as a function of group and drug?
 MMI 409 Spring 2009 Final Examination Gordon Bleil Table of Contents Research Scenario and General Assumptions Questions for Dataset (Questions are hyperlinked to detailed answers) 1. Is there a difference
Introduction to Quantitative Methods (SR8511) Project Report
 Project Report") Introduction to Quantitative Methods (SR8511) Project Report Exploring the variables related to and possibly affecting the consumption of alcohol by adults Student Registration number: 554561 Word counts
Introduction to Quantitative Methods (SR8511) Project Report Exploring the variables related to and possibly affecting the consumption of alcohol by adults Student Registration number: 554561 Word counts
Outline. Practice. Confounding Variables. Discuss. Observational Studies vs Experiments. Observational Studies vs Experiments
 1 2 Outline Finish sampling slides from Tuesday. Study design what do you do with the subjects/units once you select them? (OI Sections 1.4-1.5) Observational studies vs. experiments Descriptive statistics
Overview. Goals of Interpretation. Methodology. Reasons to Read and Evaluate
 Overview Critical Literature Evaluation and Biostatistics Ahl Ashley N. Lewis, PharmD, BCPS Clinical Specialist, Drug Information UNC Hospitals Background Review of basic statistics Statistical tests Clinical
How to describe bivariate data
 Statistics Corner How to describe bivariate data Alessandro Bertani 1, Gioacchino Di Paola 2, Emanuele Russo 1, Fabio Tuzzolino 2 1 Department for the Treatment and Study of Cardiothoracic Diseases and
Simple Linear Regression One Categorical Independent Variable with Several Categories
 Simple Linear Regression One Categorical Independent Variable with Several Categories Does ethnicity influence total GCSE score? We ve learned that variables with just two categories are called binary
Statistics and Epidemiology Practice Questions
 1. Which of the following is not considered a measure of central tendency? a. Median b. Range c. Mode d. Average 2. Given the following set of values, what is the median? 4 5 9 3 8 3 7 1 5 3 a. 3 b. 5
Simple Linear Regression
 Simple Linear Regression Assoc. Prof Dr Sarimah Abdullah Unit of Biostatistics & Research Methodology School of Medical Sciences, Health Campus Universiti Sains Malaysia Regression Regression analysis
Quantitative Methods in Computing Education Research (A brief overview tips and techniques)
") Quantitative Methods in Computing Education Research (A brief overview tips and techniques) Dr Judy Sheard Senior Lecturer Co-Director, Computing Education Research Group Monash University judy.sheard@monash.edu
Quantitative Methods in Computing Education Research (A brief overview tips and techniques) Dr Judy Sheard Senior Lecturer Co-Director, Computing Education Research Group Monash University judy.sheard@monash.edu
Elementary Statistics:
 1. How many full chapters of reading in the text were assigned for this lecture? 1. 1. 3. 3 4. 4 5. None of the above SOC497 @ CSUN w/ Ellis Godard 1 SOC497 @ CSUN w/ Ellis Godard 5 SOC497/L: SOCIOLOGY
Overview of Lecture. Survey Methods & Design in Psychology. Correlational statistics vs tests of differences between groups
 Survey Methods & Design in Psychology Lecture 10 ANOVA (2007) Lecturer: James Neill Overview of Lecture Testing mean differences ANOVA models Interactions Follow-up tests Effect sizes Parametric Tests
MAKING THE NSQIP PARTICIPANT USE DATA FILE (PUF) WORK FOR YOU
 WORK FOR YOU") MAKING THE NSQIP PARTICIPANT USE DATA FILE (PUF) WORK FOR YOU Hani Tamim, PhD Clinical Research Institute Department of Internal Medicine American University of Beirut Medical Center Beirut - Lebanon Participant
MAKING THE NSQIP PARTICIPANT USE DATA FILE (PUF) WORK FOR YOU Hani Tamim, PhD Clinical Research Institute Department of Internal Medicine American University of Beirut Medical Center Beirut - Lebanon Participant
Population. Sample. AP Statistics Notes for Chapter 1 Section 1.0 Making Sense of Data. Statistics: Data Analysis:
 Section 1.0 Making Sense of Data Statistics: Data Analysis: Individuals objects described by a set of data Variable any characteristic of an individual Categorical Variable places an individual into one
Chapter 2 Norms and Basic Statistics for Testing MULTIPLE CHOICE
 Chapter 2 Norms and Basic Statistics for Testing MULTIPLE CHOICE 1. When you assert that it is improbable that the mean intelligence test score of a particular group is 100, you are using. a. descriptive
10/4/2007 MATH 171 Name: Dr. Lunsford Test Points Possible
 Pledge: 10/4/2007 MATH 171 Name: Dr. Lunsford Test 1 100 Points Possible I. Short Answer and Multiple Choice. (36 points total) 1. Circle all of the items below that are measures of center of a distribution:
CRITICAL EVALUATION OF BIOMEDICAL LITERATURE
 Chapter 9 CRITICAL EVALUATION OF BIOMEDICAL LITERATURE M.G.Rajanandh, Department of Pharmacy Practice, SRM College of Pharmacy, SRM University. INTRODUCTION Reviewing the Biomedical Literature poses a
Observational studies; descriptive statistics
 Observational studies; descriptive statistics Patrick Breheny August 30 Patrick Breheny University of Iowa Biostatistical Methods I (BIOS 5710) 1 / 38 Observational studies Association versus causation