Use of the Quantitative-Methods Approach in Scientific Inquiry. Du Feng, Ph.D. Professor School of Nursing University of Nevada, Las Vegas
|
|
|
- Byron Snow
- 5 years ago
- Views:
Transcription
1 Use of the Quantitative-Methods Approach in Scientific Inquiry Du Feng, Ph.D. Professor School of Nursing University of Nevada, Las Vegas
2 The Scientific Approach to Knowledge Two Criteria of the Scientific Approach Logical Empirical Fundamental Basis of Social/Behavioral Sciences Theory Research Method Statistics
3 Video: Battling Bad Science by Ben Goldacre ata Good science? Bad science? - Research method makes the call
4 The Social Science Research Process The research problem - interest, idea The hypothesis - theory The research design research method, population & sampling Measurement conceptualization & operationalization Data collection - observations Data analysis - data processing, analysis Generalization & Application

5 The research journey authored by Stephanie Fleischer SAGE publications Ltd 2014
6 Anatomy of A Research Article Title Abstract Introduction Methods Results Discussion References Appendix
7 Elements of a Research Proposal Specific Aims - What do you intend to do Significance - Why is the work important? Background - Literature Review Subjects - How are you going to select your sample? Measurement (of the IV s and DV s) Data-collection methods (research design) Data analysis plan Timeline Budget
8 Asking Testable Questions The first step in conducting scientific research Not all questions are testable In order to be testable, research questions should be empirically grounded, precise, specific, and value-free Identify the independent and dependent variables DEVELOPMENT-WB-MASTER/research-question/
9 The variable language Variables: logical groupings of attributes gender; age Attributes: characteristics male, female; young, old

10 Deciding the level of numerical measurement authored by Stephanie Fleischer SAGE publications Ltd 2014
11 Criteria for Evaluating Social and Behavioral Scientific Research Internal Validity: To what extent does the research design permit us to reach causal conclusions about the effect of the IV on the DV? External Validity: To what extent can we generalize from the research sample and setting to the population and settings specified in the research hypothesis?
12 Internal Validity Threats to Internal Validity Attrition History Instrumentation Maturation Selection Statistical regression Testing effects Interaction effect
13 Maximize Internal Validity The Goal of Experiments Random assignment of individuals to treatment conditions means that confounding variables are equally distributed across conditions As such, confounding variables are unlikely to be responsible for observed differences between treatment conditions
14 External Validity Threats to External Validity Reactive effect of testing Interaction of selection and treatment Reactive effects of experimental arrangements Multiple-treatment interference Biased sample
15 Maximize External Validity - Random and Nonrandom Sampling The extent to which the results of a study generalize to the population of interest To be confident about such a generalization, the sample must be representative of the population of interest

16 Figure 7.1 Population, sample and individual cases authored by Stephanie Fleischer SAGE publications Ltd 2014
17 Two Ways to Get a Sample Probability Sampling Every element of the population has a known nonzero probability of being selected Random selection is used at some point in the process Nonprobability Sampling Something else. Bottom Line: Nonprobability sampling makes it impossible to estimate sampling errors With nonprobability sampling, judgments about external validity are rarely on firm ground.
18 Measurement Thinking about Total Variability - If X = T + E, then: var (X) = var (T) + var (E)
19 Scales (Levels) of Measurement Nominal Ordinal Interval Ratio - An example: Age measured at the nominal level: 1=young; 2=old measured at the ordinal level: 1=young; 2=middle aged; 3=old 1=infant; 2=child; 3=adolescent; 4=adult measured at the interval level: years of age
20 Quality of Measurement Reliability - the extent to which a measuring technique would yield consistent results when applied repeatedly - More technical: To what extent do observed scores reflect true scores? - Less technical: How consistent is the assessment? Validity - the extent to which a measuring technique adequately reflects the real meaning of the concept under consideration - Am I measuring what I intend to measure?
21 Reliability Coefficients Reliability coefficients reflect the proportion of true score variance to observed score variance r xx var( T) var( X ) Therefore reliabilities range from 0.0 (no true score variance) to 1.0 (all true-score variance)
22 Various Types of Reliability Internal Consistency (Content) Random error affects responses to items on an assessment Test-Retest (Time) The construct stays the same. However, random errors vary from one occasion to the next. Inter-Rater (Observer Biases)
23 Various Types of Validity Content Criterion-related Construct Concurrent Convergent Discriminant criterion-related (more data-based) construct (general evidence-gathering) content (more theory-based)
24 Research Design Experiments vs Surveys Cross-sectional vs longitudinal The ultimate goal: - To establish causality
25 Experimental Approach to Studying Causal Relations Intervention and Control Random assignment of participants to two or more conditions of an experiment The Independent variable is the variable that is manipulated or the experimental conditions (e.g., treatment or notreatment) The Dependent variable is the outcome of interest in the particular study (observed/measured)
26 Design 1: Randomized Two-Group Design Treatment Outcome (DV) Pool of Participants Control Outcome (DV)
27 Design 2: Pretest-Posttest Two-Group Design Pretest Treatment Posttest (DV: Post - Pre) Pool of Participants Pretest Control Posttest (DV: Post - Pre)
28 Design 3: Solomon Four-Group Pretest Treatment Posttest Pretest Control Posttest Treatment Posttest Control Posttest
29 Clinical Trials Explanatory trials - aim to test whether an intervention works under highly controlled and optimal situations - High internal validity Pragmatic trials - designed to evaluate the effectiveness of interventions in real-life routine practice conditions - High external validity
30 In the ideal world A representative sample obtained by random sampling A sufficiently large N RCT Valid and reliable measurement No missing or incomplete data No attrition in longitudinal studies High fidelity of intervention studies
31 Challenges Relating To Research Design Random sampling is infeasible -> sample bias -> low external validity Difficult to recruit participants Random assignment of recruited participants is in feasible - > low internal validity Hard to measure outcome variables Poor measurement quality, measurement error Missing data due to drop-outs Incomplete data due to refusal to answer certain questions Other challenges
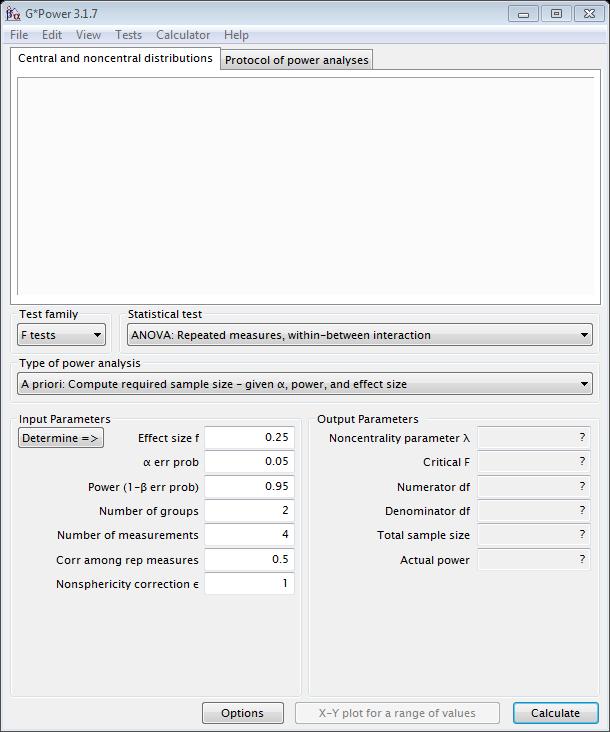
32 Prospective Power Analysis The purpose is to determine the minimum sample size required for achieving a desirable power for a specific hypothesis test, for obtaining a confidence interval with a specified width, to estimate a parameter with a maximum error of estimation for a stated probability
33 Inputs for Power Analyses The desired power Effect size (or, statistics that can be used to calculate effect size) Cohen s d, Hedges g: standardized mean or mean difference ω 2, Cohen s f, or f 2 : the variance explained regression slope, odds ratio, etc. The α level One-sided or two-sided test The number of in independent variables (and correlations between them) The number of groups based on each independent variable Distributional properties (e.g., standard deviation) of the random variables in the analytical model Standard deviation of the residuals (e.g., for linear regression) The number of occasions Bivariate correlation between repeated measurements (e.g., for repeated measure ANOVA) etc.
34 Software for Power Analysis Stand-alone power/specialized programs for power analysis only G*Power FREE Pass SPSS/Sample Power General purpose statistical packages SAS Stata SPSS faculty pack R FREE Software for multilevel modeling PINT FREE Optimal Design Software FREE MLPowsim FREE Mplus
35
36 Some learning sources Jacob Cohen (1992), "A power primer", Psychological Bulletin 112 (1): UCLA Statistical Computing Seminars: Introduction to Power Analysis: Intermediate Power Analysis: s_-_intermediate_course_for_ucla_white.pdf Advanced Power Analysis: s_-_advanced_course_for_ucla_white.pdf
37 Statistical Analysis The goal of statistical analysis is hypothesis testing Research strategies (including type of research design, sampling strategy, temporal design of measurements, measurement of expected outcomes, manipulation or measurement of the independent variables, etc.) should be guided by theory Statistical models should be consistent with theoretical reasoning and chosen research methods
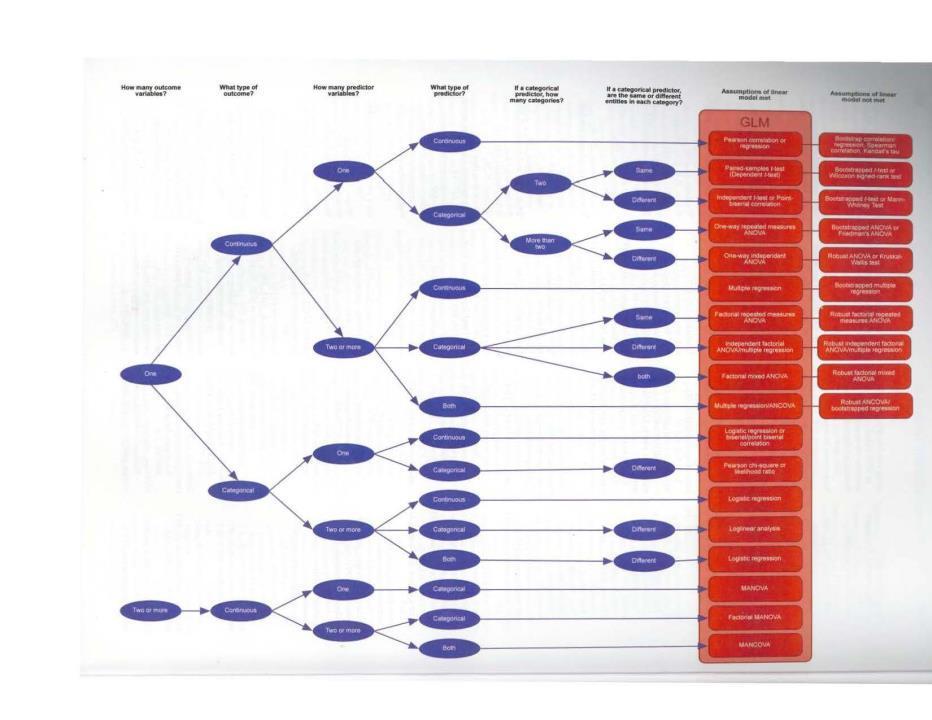
38 Choosing appropriate statistical tests Clearly stated specific, empirically grounded, and testable hypothesis Numbers of IVs and DVs Type (level of measurement) of each IV/DV Continuous variables are measured at the interval or ratio levels Discrete variables are measured at the nominal or ordinal levels A dichotomous variable is discrete, but can be treated as a continuous variable statistically

39 How to communicate with your statistician?

40 How to communicate with your statistician? ~continued
41
42 Variables How many? What type? Analysis Online text Movies Group Differences: Comparing Group Means DV -> One -> Continuous IV One IV One IV One Discrete-two independent groups Discrete-three or more independent groups Two time points (pre- and post-tests), or two dependent groups IV One Three or more time points Repeated measure ANOVA IV Two or more IV Two or more Discrete; between-subject factors only Discrete and continuous; between-subject factors only Independent t-test Statsoft StatsLecture Andy Field One-way ANOVA Statsoft StatsLecture Andy Field Paired t-test U of M Paired t-test using SPSS PowerPoint StatsLecture Andy Field Factorial ANOVA PowerPoint StatsLecture Andy Field ANCOVA Andy Field Andy Field IV Two or more Two or more time points & at least one between-subject factor ( all discrete) Mixed model ANOVA Mixed Model ANOVA/ ANCOVA Andy Field IV Two or more Two or more time points & at least one between-subject factor (discrete and continuous) Mixed model ANCOVA Mixed Model ANOVA/ ANCOVA Same as above DV-> Two or more -> Continuous IV Any number All discrete MANOVA MANOVA/ MANCOVA Andy Field IV Any number Discrete and continuous MANCOVA MANOVA/ MANCOVA Factorial MANCOVA
43 Variables How many? What type? Analysis Online text Movies Relationships Among Variables DV One Continuous IV One Continuous Pearson s r Hypothesis testing with Pearson s r IV Two or more Continuous and/or dichotomous DV Two or more Continuous IV Two or more Continuous Canonical correlation or path analysis StatsLecture Hypothesis testing with Pearson s r Multiple regression Statsoft MR_ SPSS (Brief) MR_ SPSS (more depth) Introduction Canonical Correlation DV Multiple Continuous IV None Exploratory factor analysis IV Latent variables Confirmatory factor analysis DV One Discrete IV One Discrete 2 test for contingency tables Statsoft CFA StatsLecture Andy Field CFA CFA using Amos StatsLecture IV Two or more Continuous Discriminant analysis Statsoft DFA using SPSS DFA IV Two or more Continuous, discrete, and dichotomous Logistic regression Overview Logistic regression
44 Which statistical analysis would be appropriate for the following research example? Suppose that you are interested in whether students learn better in the morning or in the afternoon. You recruited 20 students and taught them vocabulary words at 7 am one day and at 2pm another day.
45 Which statistical analysis would be appropriate for the following research example? Suppose that you have designed an intervention program to help people with addiction to alcohol stop drinking. In order to evaluate the program, you selected 30 subjects and randomly assigned 15 of them to receive the intervention, and the other 15 subjects to the control group. After the intervention, you measure the number of drinks each person has in a week, and you want to know if the two groups are different in terms of drinking.
46 Which statistical analysis would be appropriate for the following research example? Suppose you are interested in whether a training program improves nurses skills in identifying sepsis. Two groups of nurses are randomly assigned to an experimental group who receive the training (n=50), and a control group (n=50) who do not receive the training. Then, both groups are asked to evaluate a simulation case which involves sepsis. It is observed whether the nurses successfully identify sepsis with the hypothetical patient.
47 More research examples from you? Write down a clear statement of your specific research hypothesis Identify the independent variable(s) and dependent variable(s) of the hypothesis, Identify the type of each of the IV(s) and DV(s) as being either discrete (or, categorical) or continuous.
48 Can data lie?
49 Videos: When is reproducibility an ethical issue? by Keith Baggerly dayworkshops/13w5083/videos/watch/ Baggerly.mp4
50 Background of the Case
51 Data Management Entering Data Cleaning Data Scoring Processing data
52 Documentation Codebook Annotated forms A notebook of everything: proposal, description of the project, codebook, annotated forms, instrument and their scoring instructions, consent forms, data error reports and responses, all copies of communications, etc.
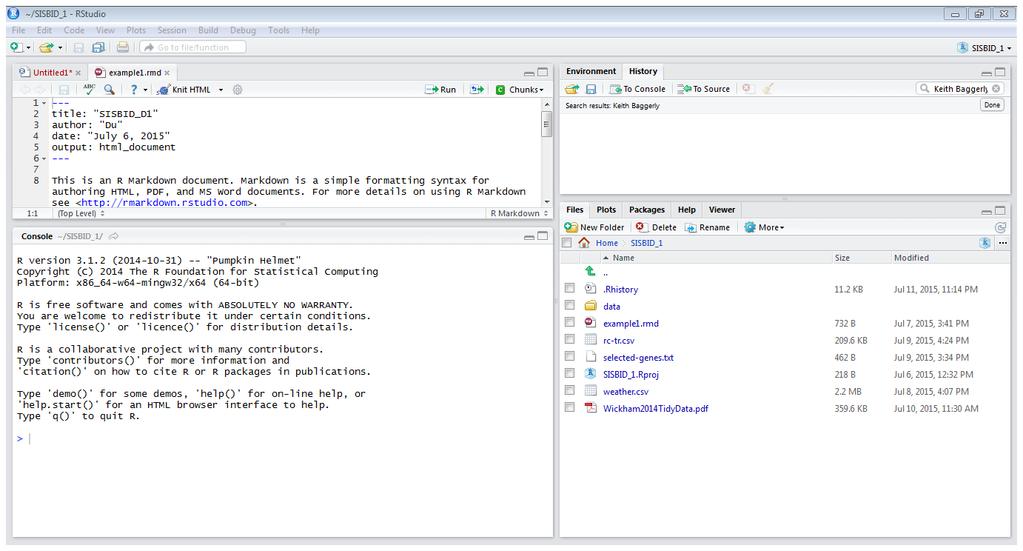
53 Software Packages R & Rstudio SAS SPSS STATA
54 R and RStudio Free R ( RStudio ( From the very basic to very sophisticated Examples of descriptive statistics and plots A Shiny Apps example
55

56

57 United States Health.Expenditure: Life.Expectancy: Region:North America Population:

58 United States Health.Expenditure: Life.Expectancy: Region:North America Population:

59
60 Questions? Thank you!
Lecture 4: Research Approaches
 Lecture 4: Research Approaches Lecture Objectives Theories in research Research design approaches ú Experimental vs. non-experimental ú Cross-sectional and longitudinal ú Descriptive approaches How to
Empirical Knowledge: based on observations. Answer questions why, whom, how, and when.
 INTRO TO RESEARCH METHODS: Empirical Knowledge: based on observations. Answer questions why, whom, how, and when. Experimental research: treatments are given for the purpose of research. Experimental group
Overview of Experimentation
 The Basics of Experimentation Overview of Experiments. IVs & DVs. Operational Definitions. Reliability. Validity. Internal vs. External Validity. Classic Threats to Internal Validity. Lab: FP Overview;
investigate. educate. inform.
 investigate. educate. inform. Research Design What drives your research design? The battle between Qualitative and Quantitative is over Think before you leap What SHOULD drive your research design. Advanced
HPS301 Exam Notes- Contents
 HPS301 Exam Notes- Contents Week 1 Research Design: What characterises different approaches 1 Experimental Design 1 Key Features 1 Criteria for establishing causality 2 Validity Internal Validity 2 Threats
The essential focus of an experiment is to show that variance can be produced in a DV by manipulation of an IV.
 EXPERIMENTAL DESIGNS I: Between-Groups Designs There are many experimental designs. We begin this week with the most basic, where there is a single IV and where participants are divided into two or more
Research Methods. for Business. A Skill'Building Approach SEVENTH EDITION. Uma Sekaran. and. Roger Bougie
 Research Methods for Business A Skill'Building Approach SEVENTH EDITION Uma Sekaran and Roger Bougie WILEY CONTENTS About the Authors Preface Acknowledgments xix xxi xxiii 1 Introduction to research 1
VARIABLES AND MEASUREMENT
 ARTHUR SYC 204 (EXERIMENTAL SYCHOLOGY) 16A LECTURE NOTES [01/29/16] VARIABLES AND MEASUREMENT AGE 1 Topic #3 VARIABLES AND MEASUREMENT VARIABLES Some definitions of variables include the following: 1.
Class 7 Everything is Related
 Class 7 Everything is Related Correlational Designs l 1 Topics Types of Correlational Designs Understanding Correlation Reporting Correlational Statistics Quantitative Designs l 2 Types of Correlational
12/30/2017. PSY 5102: Advanced Statistics for Psychological and Behavioral Research 2
 PSY 5102: Advanced Statistics for Psychological and Behavioral Research 2 Selecting a statistical test Relationships among major statistical methods General Linear Model and multiple regression Special
Research Questions and Survey Development
 Research Questions and Survey Development R. Eric Heidel, PhD Associate Professor of Biostatistics Department of Surgery University of Tennessee Graduate School of Medicine Research Questions 1 Research
One slide on research question Literature review: structured; holes you will fill in Your research design
 Topics Ahead Week 10-11: Experimental design; Running experiment Week 12: Survey Design; ANOVA Week 13: Correlation and Regression; Non Parametric Statistics Week 14: Computational Methods; Simulation;
By Hui Bian Office for Faculty Excellence
 By Hui Bian Office for Faculty Excellence 1 Email: bianh@ecu.edu Phone: 328-5428 Location: 1001 Joyner Library, room 1006 Office hours: 8:00am-5:00pm, Monday-Friday 2 Educational tests and regular surveys
Introduction to Multilevel Models for Longitudinal and Repeated Measures Data
 Introduction to Multilevel Models for Longitudinal and Repeated Measures Data Today s Class: Features of longitudinal data Features of longitudinal models What can MLM do for you? What to expect in this
26:010:557 / 26:620:557 Social Science Research Methods
 26:010:557 / 26:620:557 Social Science Research Methods Dr. Peter R. Gillett Associate Professor Department of Accounting & Information Systems Rutgers Business School Newark & New Brunswick 1 Overview
Contents. Acknowledgments
 Contents Preface Acknowledgments xiii xv 1. Introduction 1 Introduction 2 Definitions 3 Goals of Research 6 Exploration 7 Description 8 Prediction 9 Explanation 9 Action 10 Evaluation of Research 12 Who
Doctoral Dissertation Boot Camp Quantitative Methods Kamiar Kouzekanani, PhD January 27, The Scientific Method of Problem Solving
 Doctoral Dissertation Boot Camp Quantitative Methods Kamiar Kouzekanani, PhD January 27, 2018 The Scientific Method of Problem Solving The conceptual phase Reviewing the literature, stating the problem,
Epidemiologic Methods I & II Epidem 201AB Winter & Spring 2002
 DETAILED COURSE OUTLINE Epidemiologic Methods I & II Epidem 201AB Winter & Spring 2002 Hal Morgenstern, Ph.D. Department of Epidemiology UCLA School of Public Health Page 1 I. THE NATURE OF EPIDEMIOLOGIC
Research Approaches Quantitative Approach. Research Methods vs Research Design
 Research Approaches Quantitative Approach DCE3002 Research Methodology Research Methods vs Research Design Both research methods as well as research design are crucial for successful completion of any
Research Approach & Design. Awatif Alam MBBS, Msc (Toronto),ABCM Professor Community Medicine Vice Provost Girls Section
,ABCM Professor Community Medicine Vice Provost Girls Section") Research Approach & Design Awatif Alam MBBS, Msc (Toronto),ABCM Professor Community Medicine Vice Provost Girls Section Content: Introduction Definition of research design Process of designing & conducting
Research Approach & Design Awatif Alam MBBS, Msc (Toronto),ABCM Professor Community Medicine Vice Provost Girls Section Content: Introduction Definition of research design Process of designing & conducting
Choosing an Approach for a Quantitative Dissertation: Strategies for Various Variable Types
 Choosing an Approach for a Quantitative Dissertation: Strategies for Various Variable Types Kuba Glazek, Ph.D. Methodology Expert National Center for Academic and Dissertation Excellence Outline Thesis
PLS 506 Mark T. Imperial, Ph.D. Lecture Notes: Reliability & Validity
 PLS 506 Mark T. Imperial, Ph.D. Lecture Notes: Reliability & Validity Measurement & Variables - Initial step is to conceptualize and clarify the concepts embedded in a hypothesis or research question with
11/18/2013. Correlational Research. Correlational Designs. Why Use a Correlational Design? CORRELATIONAL RESEARCH STUDIES
 Correlational Research Correlational Designs Correlational research is used to describe the relationship between two or more naturally occurring variables. Is age related to political conservativism? Are
9.63 Laboratory in Cognitive Science
 9.63 Laboratory in Cognitive Science Fall 2005 Course 2b Variables, Controls Aude Oliva Ben Balas, Charles Kemp Science is: Scientific Thinking 1. Empirical Based on observations 2. Objective Observations
In this chapter we discuss validity issues for quantitative research and for qualitative research.
 Chapter 8 Validity of Research Results (Reminder: Don t forget to utilize the concept maps and study questions as you study this and the other chapters.) In this chapter we discuss validity issues for
The following are questions that students had difficulty with on the first three exams.
 The following are questions that students had difficulty with on the first three exams. Exam 1 1. A measure has construct validity if it: a) really measures what it is supposed to measure b) appears, on
Measures of Dispersion. Range. Variance. Standard deviation. Measures of Relationship. Range. Variance. Standard deviation.
 Measures of Dispersion Range Variance Standard deviation Range The numerical difference between the highest and lowest scores in a distribution It describes the overall spread between the highest and lowest
REPEATED MEASURES DESIGNS
 Repeated Measures Designs The SAGE Encyclopedia of Educational Research, Measurement and Evaluation Markus Brauer (University of Wisconsin-Madison) Target word count: 1000 - Actual word count: 1071 REPEATED
9 research designs likely for PSYC 2100
 9 research designs likely for PSYC 2100 1) 1 factor, 2 levels, 1 group (one group gets both treatment levels) related samples t-test (compare means of 2 levels only) 2) 1 factor, 2 levels, 2 groups (one
PTHP 7101 Research 1 Chapter Assignments
 PTHP 7101 Research 1 Chapter Assignments INSTRUCTIONS: Go over the questions/pointers pertaining to the chapters and turn in a hard copy of your answers at the beginning of class (on the day that it is
Georgina Salas. Topics EDCI Intro to Research Dr. A.J. Herrera
 Homework assignment topics 37-42 Georgina Salas Topics 37-42 EDCI Intro to Research 6300.62 Dr. A.J. Herrera Topic 37 1. What is the purpose of an experiment? The purpose of an experiment is to explore
Title: The Theory of Planned Behavior (TPB) and Texting While Driving Behavior in College Students MS # Manuscript ID GCPI
 and Texting While Driving Behavior in College Students MS # Manuscript ID GCPI") Title: The Theory of Planned Behavior (TPB) and Texting While Driving Behavior in College Students MS # Manuscript ID GCPI-2015-02298 Appendix 1 Role of TPB in changing other behaviors TPB has been applied
Title: The Theory of Planned Behavior (TPB) and Texting While Driving Behavior in College Students MS # Manuscript ID GCPI-2015-02298 Appendix 1 Role of TPB in changing other behaviors TPB has been applied
Chapter 1: Explaining Behavior
 Chapter 1: Explaining Behavior GOAL OF SCIENCE is to generate explanations for various puzzling natural phenomenon. - Generate general laws of behavior (psychology) RESEARCH: principle method for acquiring
Experimental Research. Types of Group Comparison Research. Types of Group Comparison Research. Stephen E. Brock, Ph.D.
 Experimental Research Stephen E. Brock, Ph.D., NCSP California State University, Sacramento 1 Types of Group Comparison Research Review Causal-comparative AKA Ex Post Facto (Latin for after the fact).
PÄIVI KARHU THE THEORY OF MEASUREMENT
 PÄIVI KARHU THE THEORY OF MEASUREMENT AGENDA 1. Quality of Measurement a) Validity Definition and Types of validity Assessment of validity Threats of Validity b) Reliability True Score Theory Definition
RESEARCH METHODS. A Process of Inquiry. tm HarperCollinsPublishers ANTHONY M. GRAZIANO MICHAEL L RAULIN
 RESEARCH METHODS A Process of Inquiry ANTHONY M. GRAZIANO MICHAEL L RAULIN STA TE UNIVERSITY OF NEW YORK A T BUFFALO tm HarperCollinsPublishers CONTENTS Instructor's Preface xv Student's Preface xix 1
Ecological Statistics
 A Primer of Ecological Statistics Second Edition Nicholas J. Gotelli University of Vermont Aaron M. Ellison Harvard Forest Sinauer Associates, Inc. Publishers Sunderland, Massachusetts U.S.A. Brief Contents
CHAPTER NINE DATA ANALYSIS / EVALUATING QUALITY (VALIDITY) OF BETWEEN GROUP EXPERIMENTS
 OF BETWEEN GROUP EXPERIMENTS") CHAPTER NINE DATA ANALYSIS / EVALUATING QUALITY (VALIDITY) OF BETWEEN GROUP EXPERIMENTS Chapter Objectives: Understand Null Hypothesis Significance Testing (NHST) Understand statistical significance and
CHAPTER NINE DATA ANALYSIS / EVALUATING QUALITY (VALIDITY) OF BETWEEN GROUP EXPERIMENTS Chapter Objectives: Understand Null Hypothesis Significance Testing (NHST) Understand statistical significance and
Validity and reliability of measurements
 Validity and reliability of measurements 2 3 Request: Intention to treat Intention to treat and per protocol dealing with cross-overs (ref Hulley 2013) For example: Patients who did not take/get the medication
OBSERVATION METHODS: EXPERIMENTS
 OBSERVATION METHODS: EXPERIMENTS Sociological Research Methods Experiments Independent variable is manipulated, and the dependent variable respond to the manipulation. e.g. Eating a chocolate bar prior
Introduction to Multilevel Models for Longitudinal and Repeated Measures Data
 Introduction to Multilevel Models for Longitudinal and Repeated Measures Data Today s Class: Features of longitudinal data Features of longitudinal models What can MLM do for you? What to expect in this
On the purpose of testing:
 Why Evaluation & Assessment is Important Feedback to students Feedback to teachers Information to parents Information for selection and certification Information for accountability Incentives to increase
Analysis A step in the research process that involves describing and then making inferences based on a set of data.
 1 Appendix 1:. Definitions of important terms. Additionality The difference between the value of an outcome after the implementation of a policy, and its value in a counterfactual scenario in which the
RESEARCH METHODS. Winfred, research methods, ; rv ; rv
 RESEARCH METHODS 1 Research Methods means of discovering truth 2 Research Methods means of discovering truth what is truth? 3 Research Methods means of discovering truth what is truth? Riveda Sandhyavandanam
Hypothesis Testing. Richard S. Balkin, Ph.D., LPC-S, NCC
 Hypothesis Testing Richard S. Balkin, Ph.D., LPC-S, NCC Overview When we have questions about the effect of a treatment or intervention or wish to compare groups, we use hypothesis testing Parametric statistics
UNIT III: Research Design. In designing a needs assessment the first thing to consider is level for the assessment
 UNIT III: Research Design SWK 330 Kimberly Baker-Abrams What is a needs assessment? Why is it helpful? an assessment to determine the existence of services, client population, client access to services,
Chapter 9 Experimental Research (Reminder: Don t forget to utilize the concept maps and study questions as you study this and the other chapters.
 Chapter 9 Experimental Research (Reminder: Don t forget to utilize the concept maps and study questions as you study this and the other chapters.) In this chapter we talk about what experiments are, we
RESEARCH METHODS. Winfred, research methods,
 RESEARCH METHODS Winfred, research methods, 04-23-10 1 Research Methods means of discovering truth Winfred, research methods, 04-23-10 2 Research Methods means of discovering truth what is truth? Winfred,
11/24/2017. Do not imply a cause-and-effect relationship
 Correlational research is used to describe the relationship between two or more naturally occurring variables. Is age related to political conservativism? Are highly extraverted people less afraid of rejection
Measurement is the process of observing and recording the observations. Two important issues:
 Farzad Eskandanian Measurement is the process of observing and recording the observations. Two important issues: 1. Understanding the fundamental ideas: Levels of measurement: nominal, ordinal, interval
From Bivariate Through Multivariate Techniques
 A p p l i e d S T A T I S T I C S From Bivariate Through Multivariate Techniques R e b e c c a M. W a r n e r University of New Hampshire DAI HOC THAI NGUYEN TRUNG TAM HOC LIEU *)SAGE Publications '55'
Analysis and Interpretation of Data Part 1
 Analysis and Interpretation of Data Part 1 DATA ANALYSIS: PRELIMINARY STEPS 1. Editing Field Edit Completeness Legibility Comprehensibility Consistency Uniformity Central Office Edit 2. Coding Specifying
The Meta on Meta-Analysis. Presented by Endia J. Lindo, Ph.D. University of North Texas
 The Meta on Meta-Analysis Presented by Endia J. Lindo, Ph.D. University of North Texas Meta-Analysis What is it? Why use it? How to do it? Challenges and benefits? Current trends? What is meta-analysis?
Review and Wrap-up! ESP 178 Applied Research Methods Calvin Thigpen 3/14/17 Adapted from presentation by Prof. Susan Handy
 Review and Wrap-up! ESP 178 Applied Research Methods Calvin Thigpen 3/14/17 Adapted from presentation by Prof. Susan Handy Final Proposals Read instructions carefully! Check Canvas for our comments on
Lecture II: Difference in Difference. Causality is difficult to Show from cross
 Review Lecture II: Regression Discontinuity and Difference in Difference From Lecture I Causality is difficult to Show from cross sectional observational studies What caused what? X caused Y, Y caused
Experimental Design Part II
 Experimental Design Part II Keith Smolkowski April 30, 2008 Where Are We Now? esearch eview esearch Design: The Plan Internal Validity Statements of Causality External Validity Statements of Generalizability
The Research Roadmap Checklist
 1/5 The Research Roadmap Checklist Version: December 1, 2007 All enquires to bwhitworth@acm.org This checklist is at http://brianwhitworth.com/researchchecklist.pdf The element details are explained at
Choosing the Correct Statistical Test
 Choosing the Correct Statistical Test T racie O. Afifi, PhD Departments of Community Health Sciences & Psychiatry University of Manitoba Department of Community Health Sciences COLLEGE OF MEDICINE, FACULTY
Research Design. Source: John W. Creswell RESEARCH DESIGN. Qualitative, Quantitative, and Mixed Methods Approaches Third Edition
 Research Design Source: John W. Creswell RESEARCH DESIGN Qualitative, Quantitative, and Mixed Methods Approaches Third Edition The Three Types of Designs Three types Qualitative research Quantitative research
Doing Quantitative Research 26E02900, 6 ECTS Lecture 6: Structural Equations Modeling. Olli-Pekka Kauppila Daria Kautto
 Doing Quantitative Research 26E02900, 6 ECTS Lecture 6: Structural Equations Modeling Olli-Pekka Kauppila Daria Kautto Session VI, September 20 2017 Learning objectives 1. Get familiar with the basic idea
Previous Example. New. Tradition
 Experimental Design Previous Example New Tradition Goal? New Tradition =? Challenges Internal validity How to guarantee what you have observed is true? External validity How to guarantee what you have
EXPERIMENTAL RESEARCH DESIGNS
 ARTHUR PSYC 204 (EXPERIMENTAL PSYCHOLOGY) 14A LECTURE NOTES [02/28/14] EXPERIMENTAL RESEARCH DESIGNS PAGE 1 Topic #5 EXPERIMENTAL RESEARCH DESIGNS As a strict technical definition, an experiment is a study
Correlational Research. Correlational Research. Stephen E. Brock, Ph.D., NCSP EDS 250. Descriptive Research 1. Correlational Research: Scatter Plots
 Correlational Research Stephen E. Brock, Ph.D., NCSP California State University, Sacramento 1 Correlational Research A quantitative methodology used to determine whether, and to what degree, a relationship
Chapter 4: Defining and Measuring Variables
 Chapter 4: Defining and Measuring Variables A. LEARNING OUTCOMES. After studying this chapter students should be able to: Distinguish between qualitative and quantitative, discrete and continuous, and
Experimental and Quasi-Experimental designs
 External Validity Internal Validity NSG 687 Experimental and Quasi-Experimental designs True experimental designs are characterized by three "criteria for causality." These are: 1) The cause (independent
Internal Validity and Experimental Design
 Internal Validity and Experimental Design February 18 1 / 24 Outline 1. Share examples from TESS 2. Talk about how to write experimental designs 3. Internal validity Why randomization works Threats to
Chapter 11 Nonexperimental Quantitative Research Steps in Nonexperimental Research
 Chapter 11 Nonexperimental Quantitative Research (Reminder: Don t forget to utilize the concept maps and study questions as you study this and the other chapters.) Nonexperimental research is needed because
Data Analysis Using Regression and Multilevel/Hierarchical Models
 Data Analysis Using Regression and Multilevel/Hierarchical Models ANDREW GELMAN Columbia University JENNIFER HILL Columbia University CAMBRIDGE UNIVERSITY PRESS Contents List of examples V a 9 e xv " Preface
Psychology 205, Revelle, Fall 2014 Research Methods in Psychology Mid-Term. Name:
 Name: 1. (2 points) What is the primary advantage of using the median instead of the mean as a measure of central tendency? It is less affected by outliers. 2. (2 points) Why is counterbalancing important
DEPARTMENT OF EPIDEMIOLOGY 2. BASIC CONCEPTS
 DEPARTMENT OF EPIDEMIOLOGY EXIT COMPETENCIES FOR MPH GRADUATES IN GENERAL EPIDEMIOLOGY 1. DEFINITION AND HISTORICAL PERSPECTIVES 1. Historical Trends in the most common causes of death in the United States.
Lunchtime Seminar. Risper Awuor, Ph.D. Department of Graduate Educational and Leadership. January 30, 2013
 Lunchtime Seminar Risper Awuor, Ph.D. Department of Graduate Educational and Leadership January 30, 2013 Scales of Measurement Nominal Ordinal Interval Ratio Scales of Measurement Nominal names assigned
CHAPTER VI RESEARCH METHODOLOGY
 CHAPTER VI RESEARCH METHODOLOGY 6.1 Research Design Research is an organized, systematic, data based, critical, objective, scientific inquiry or investigation into a specific problem, undertaken with the
CHAPTER 3 METHOD AND PROCEDURE
 CHAPTER 3 METHOD AND PROCEDURE Previous chapter namely Review of the Literature was concerned with the review of the research studies conducted in the field of teacher education, with special reference
WDHS Curriculum Map Probability and Statistics. What is Statistics and how does it relate to you?
 WDHS Curriculum Map Probability and Statistics Time Interval/ Unit 1: Introduction to Statistics 1.1-1.3 2 weeks S-IC-1: Understand statistics as a process for making inferences about population parameters
A. Indicate the best answer to each the following multiple-choice questions (20 points)
") Phil 12 Fall 2012 Directions and Sample Questions for Final Exam Part I: Correlation A. Indicate the best answer to each the following multiple-choice questions (20 points) 1. Correlations are a) useful
Phil 12 Fall 2012 Directions and Sample Questions for Final Exam Part I: Correlation A. Indicate the best answer to each the following multiple-choice questions (20 points) 1. Correlations are a) useful
Experimental Research in HCI. Alma Leora Culén University of Oslo, Department of Informatics, Design
 Experimental Research in HCI Alma Leora Culén University of Oslo, Department of Informatics, Design almira@ifi.uio.no INF2260/4060 1 Oslo, 15/09/16 Review Method Methodology Research methods are simply
Before we get started:
 Before we get started: http://arievaluation.org/projects-3/ AEA 2018 R-Commander 1 Antonio Olmos Kai Schramm Priyalathta Govindasamy Antonio.Olmos@du.edu AntonioOlmos@aumhc.org AEA 2018 R-Commander 2 Plan
Political Science 15, Winter 2014 Final Review
 Political Science 15, Winter 2014 Final Review The major topics covered in class are listed below. You should also take a look at the readings listed on the class website. Studying Politics Scientifically
Regression Discontinuity Analysis
 Regression Discontinuity Analysis A researcher wants to determine whether tutoring underachieving middle school students improves their math grades. Another wonders whether providing financial aid to low-income
Validity and Reliability. PDF Created with deskpdf PDF Writer - Trial ::
 Validity and Reliability PDF Created with deskpdf PDF Writer - Trial :: http://www.docudesk.com Validity Is the translation from concept to operationalization accurately representing the underlying concept.
Methodological Issues in Measuring the Development of Character
 Methodological Issues in Measuring the Development of Character Noel A. Card Department of Human Development and Family Studies College of Liberal Arts and Sciences Supported by a grant from the John Templeton
Unit 1 Exploring and Understanding Data
 Unit 1 Exploring and Understanding Data Area Principle Bar Chart Boxplot Conditional Distribution Dotplot Empirical Rule Five Number Summary Frequency Distribution Frequency Polygon Histogram Interquartile
HOW STATISTICS IMPACT PHARMACY PRACTICE?
 HOW STATISTICS IMPACT PHARMACY PRACTICE? CPPD at NCCR 13 th June, 2013 Mohamed Izham M.I., PhD Professor in Social & Administrative Pharmacy Learning objective.. At the end of the presentation pharmacists
Sample Exam Questions Psychology 3201 Exam 1
 Scientific Method Scientific Researcher Scientific Practitioner Authority External Explanations (Metaphysical Systems) Unreliable Senses Determinism Lawfulness Discoverability Empiricism Control Objectivity
Lecture Outline. Biost 517 Applied Biostatistics I. Purpose of Descriptive Statistics. Purpose of Descriptive Statistics
 Biost 517 Applied Biostatistics I Scott S. Emerson, M.D., Ph.D. Professor of Biostatistics University of Washington Lecture 3: Overview of Descriptive Statistics October 3, 2005 Lecture Outline Purpose
Propensity Score Analysis Shenyang Guo, Ph.D.
 Propensity Score Analysis Shenyang Guo, Ph.D. Upcoming Seminar: April 7-8, 2017, Philadelphia, Pennsylvania Propensity Score Analysis 1. Overview 1.1 Observational studies and challenges 1.2 Why and when
Summary & Conclusion. Lecture 10 Survey Research & Design in Psychology James Neill, 2016 Creative Commons Attribution 4.0
 Summary & Conclusion Lecture 10 Survey Research & Design in Psychology James Neill, 2016 Creative Commons Attribution 4.0 Overview 1. Survey research and design 1. Survey research 2. Survey design 2. Univariate
Psychometric Instrument Development
 Psychometric Instrument Development Lecture 6 Survey Research & Design in Psychology James Neill, 2012 Readings: Psychometrics 1. Bryman & Cramer (1997). Concepts and their measurement. [chapter - ereserve]
Variable Measurement, Norms & Differences
 Variable Measurement, Norms & Differences 1 Expectations Begins with hypothesis (general concept) or question Create specific, testable prediction Prediction can specify relation or group differences Different
Statistics: A Brief Overview Part I. Katherine Shaver, M.S. Biostatistician Carilion Clinic
 Statistics: A Brief Overview Part I Katherine Shaver, M.S. Biostatistician Carilion Clinic Statistics: A Brief Overview Course Objectives Upon completion of the course, you will be able to: Distinguish
Department of Epidemiology and Population Health
 401 Department of Epidemiology and Population Health Chairperson: Professors: Professor of Public Health Practice: Assistant Professors: Assistant Research Professors: Senior Lecturer: Instructor: Chaaya,
Choosing and Using Quantitative Research Methods and Tools
 Choosing and Using Quantitative Research Methods and Tools PROF CME MCCRINDLE Research problem I ve noticed. Hypothesis I think. I wonder? Research question Testing theory This is the cause This is the
Lecture 3. Previous lecture. Learning outcomes of lecture 3. Today. Trustworthiness in Fixed Design Research. Class question - Causality
 Lecture 3 Empirical Research Methods IN4304 design (fixed design) Previous lecture A research plan Consider: purpose, theory, research question, mode inquiry, sampling method Research question Descriptive/
Manuscript Presentation: Writing up APIM Results
 Manuscript Presentation: Writing up APIM Results Example Articles Distinguishable Dyads Chung, M. L., Moser, D. K., Lennie, T. A., & Rayens, M. (2009). The effects of depressive symptoms and anxiety on
Educational Research. S.Shafiee. Expert PDF Trial
 Educational Research: Experimental Studies Educational Research S.Shafiee Research... The systematic application of a family of methods employed to provide trustworthy information about problems an ongoing
PSYC3010 Advanced Statistics for Psychology
 PSYC3010 Advanced Statistics for Psychology Unit of Study Code: PSYC3010 Coordinators: REGRESSION - SECTION 1 Dr Sabina Kleitman Office: BM441 Phone: 9351 7703 E- mail: sabina.kleitman@sydney.edu.au ANOVA
3 CONCEPTUAL FOUNDATIONS OF STATISTICS
 3 CONCEPTUAL FOUNDATIONS OF STATISTICS In this chapter, we examine the conceptual foundations of statistics. The goal is to give you an appreciation and conceptual understanding of some basic statistical
The Regression-Discontinuity Design
 Page 1 of 10 Home» Design» Quasi-Experimental Design» The Regression-Discontinuity Design The regression-discontinuity design. What a terrible name! In everyday language both parts of the term have connotations