2016 COMMUNITY PROFILE FOR DELAWARE: DATA BY SUB-STATE PLANNING AREA August 2016
|
|
|
- Vivian Bradford
- 5 years ago
- Views:
Transcription

1 2016 COMMUNITY PROFILE FOR DELAWARE: DATA BY SUB-STATE PLANNING AREA August 2016 DESCRIPTION: Sub-state/Community Level Epidemiologic Profile for Substance Abuse Consumption and Consequences Data on Youth and Adults for Delaware Prepared by: The University of Delaware Center for Drug and Alcohol Studies & State Partners For The Delaware SPF-SIG Program, The Delaware Division of Substance Abuse and Mental Health, & The Delaware Drug and Alcohol Tracking Alliance Sponsored by Award SP to the Division of Substance Abuse and Mental Health, Delaware Health and Social Services, from the Center for Substance Abuse Prevention, Substance Abuse and Mental Health Services Administration 1
2 TABLE OF CONTENTS 1. Introduction Purpose of the 2013 Sub-state Epidemiological Profile 3 2. Delaware Youth Survey by Sub-State Area Self-Reported Behavior Perceptions of Family Perceptions of School Perceptions of Neighborhood Delaware Adult Survey Data by Sub-state Planning Area and Office of Highway Safety Data Department of Education (DOE) and Department of Services for Children, Youth, and Their Families (DSCYF) Data Wilmington Specific Data Full Online Sources for Data in this Profile and Additional Data Resources 84 2
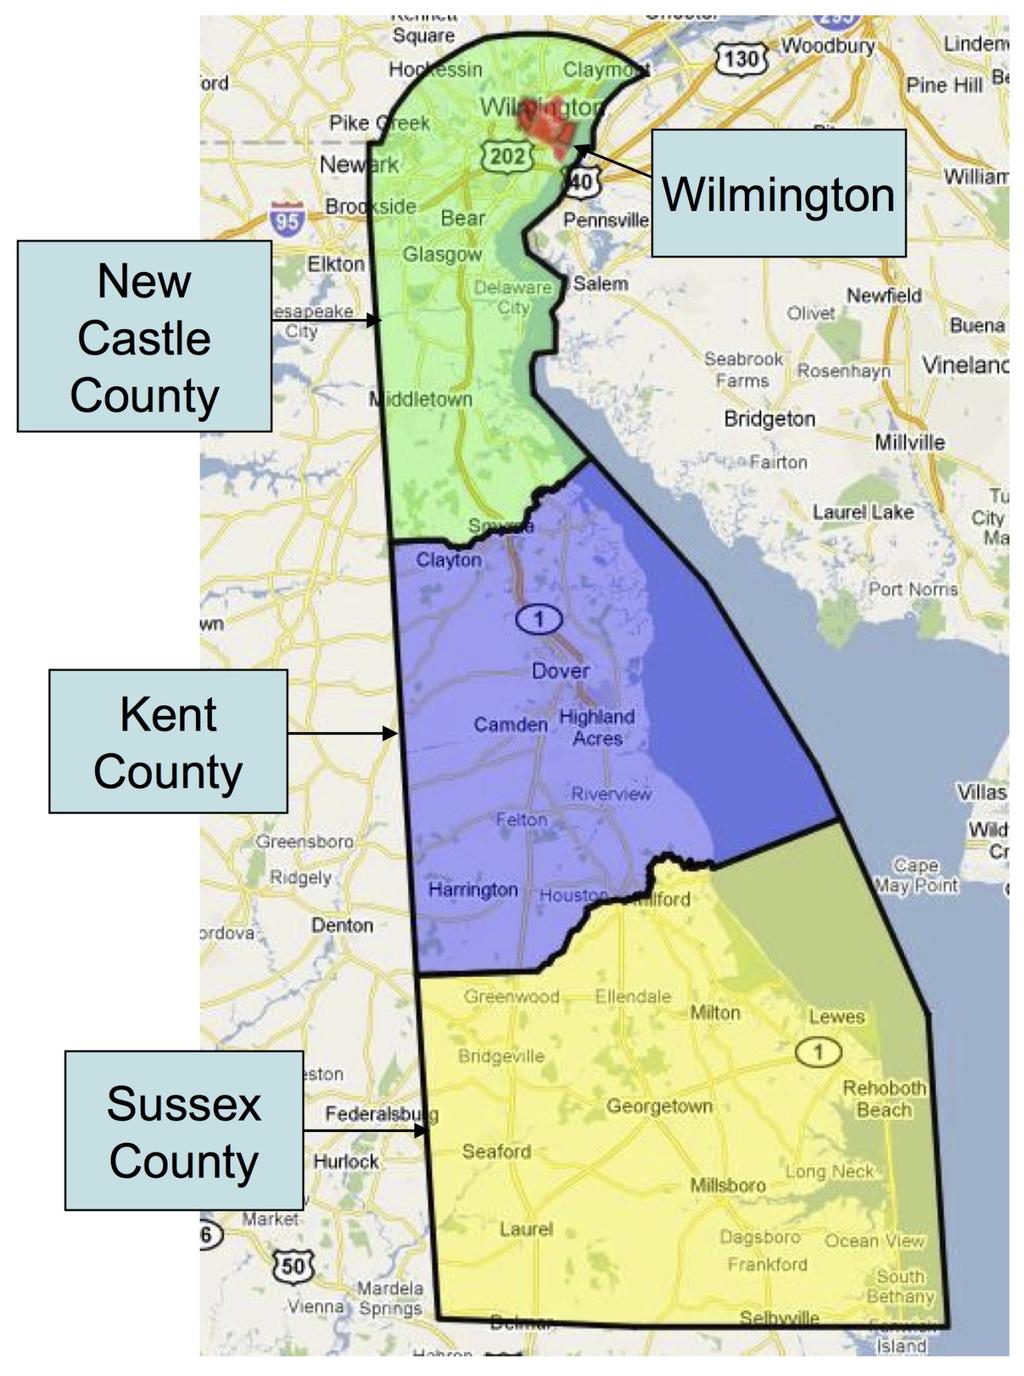
3 1. INTRODUCTION 1.1 Purpose of 2016 Delaware Sub-state Epidemiological Profile The Division of Substance Abuse and Mental Health (DSAMH), the Single State Agency (SSA) for mental health/substance use conditions in Delaware is pleased to present this report from the Statewide Epidemiological Outcomes Workgroup (SEOW). This annual Profile brings together the most recent available information related to Delaware youth, families, and adults that is relevant to understanding, planning and intervening with Delawareans at risk for substance abuse, violence, and other risk factors. More importantly, it presents data, where possible, that are available for smaller areas than the state as a whole -- by county or sub-state planning area or even by community. Federal regulations have required and Delaware has established four sub-state planning areas for the state. These are: 1. The City of Wilmington; 2. The remainder of New Castle County; 3. Kent County; and 4. Sussex County Reporting of incidence, prevalence and outcome measures for each of these sub-state planning areas and surveillance of change will become an increasing requirement of federal and state programming in the future. This report focuses on data that can be provided by sub-state areas. More extensive data for substance abuse indicators for the state as a whole are available in the annual series of State Epidemiological Profiles that are also available at the DDATA website. Because of Delaware s small size, many indicators are not reliable at a sub-state or community level and can only be reported at the state level. The 2013 Sub-state Profile has two main purposes: First, the Profile continues the series of data reports begun in 2008, as part of Delaware s mandate from the Federal Substance Abuse Mental Health Services Administration (SAMHSA), to assemble, analyze and report on the best available data for state and sub-state surveillance of substance use/abuse incidence, prevalence, and related data for Delaware. Staff of the Delaware State Epidemiology Outcomes Workgroup formerly (Delaware Drug and Alcohol Tracking Alliance), are charged with producing and updating this resource. The Workgroup s responsibilities include collecting and improving upon the sources available for National Outcomes Measures (NOMS) that will meet SAMHSA and other federal reporting requirements. In addition, the Workgroup collects, collates, makes accessible and distributes alcohol, tobacco, and other drug (ATOD) data within the state for use by other Federal agencies (e.g., Office of National Drug Control Policy), other State agencies (e.g., Division of Public Health, Division of 3
4 Prevention and Behavioral Health Services, Department of Education), Foundations (e.g., Nemours, the Casey Foundation, the Robert Wood Johnson Foundation), and for informing communities and organizations statewide. Second, the Profile is meant to serve as a reference point for establishing the need for and subsequent changes in prevention or intervention programming in Delaware sub-state planning areas. Data will also be useful to communities directly applying for awards such as the federal Safe and Drug Free Communities Support Program (DFC), the Division of Public Health Tobacco Prevention and Control Programs, and other initiatives that may be issued by federal, state and foundation sources. The first section of this Profile consists of information from Delaware youth surveys by sub-state planning area and in some cases by smaller community breakdowns (Section 2 of the Profile). These data are the most rich and most timely (mostly 2015) because they include large samples and much of it comes from Delaware sources. The next section of the Profile consists of data that are available for adults (Section 3). Here the data sources, sizes of the samples, and recency of the data are more limited. Much of it comes from national sources such as the National Household Survey of Drug Use and Health (NSDUH) and the Behavioral Risk Factor Surveillance System (BRFSS). Section 4 of the Profile provides youth institutional data from the Department of Education and the Division of Prevention and Behavioral Health Services. Section 5 provides some additional data specific to Wilmington. Finally, Section 6 of the Profile provides leads and locations of additional data from the sources used here as well as other data sources that may be helpful in addressing issues of need and evidenced-based program compatibility. 4
5 5
6 6
7 2. DELAWARE YOUTH SURVEY DATA BY SUB-STATE AREA The following section includes data from the Delaware School Survey that has been reported by sub-state planning area. The information is broken down into four categories of individual attitudes and behaviors, family data, school data, and neighborhood data. Please note that since zip code and city identifying information are not available for 5 th Grade data, there are no separate tables or charts for Wilmington 5 th graders. Wilmington-specific information is provided for 8 th and 11 th graders. More information on these surveys is available in Section 6 of this Profile. 7
8 DELAWARE YOUTH SURVEY DATA BY SUB-STATE AREA 2.1 Self-Reported Behavior The following section includes data from the Delaware School Surveys that relate to youth self-reports of their own behaviors and attitudes related to substance use, violence, and other risk and protective factors. The first pages relate to substance use and are broken down by zip code and mapped. The following charts are by sub-state planning area. Again, please note that zip code and city identifying information are not available for 5 th grade data, so there are no separate tables or charts for Wilmington 5 th graders. Wilmington-specific information is provided for 8 th and 11 th graders. 8

9 2015 DELAWARE SCHOOL SURVEY Percentage of 8 th and 11 th Public School Students Who Reported Smoking Cigarettes in the Past Month by Zip-Code 2015 Delaware School Survey. Center for Drug and Health Studies, University of Delaware. 9

10 2015 DELAWARE SCHOOL SURVEY Percentage of 8 th and 11 th Public School Students Who Reported Drinking Alcohol in the Past Month by Zip-Code 2015 Delaware School Survey. Center for Drug and Health Studies, University of Delaware. 10

11 2015 DELAWARE SCHOOL SURVEY Percentage of 8 th and 11 th Public School Students Who Reported Binge Drinking in the Past Month by Zip-Code Binge use is defined as three drinks at a time in the last two weeks 2015 Delaware School Survey. Center for Drug and Health Studies, University of Delaware. 11
12 2015 DELAWARE SCHOOL SURVEY Percentage of 8 th and 11 th Public School Students Who Reported Smoking Marijuana in the Past Month by Zip-Code 2015 Delaware School Survey. Center for Drug and Health Studies, University of Delaware. 12
13 2015 DELAWARE SCHOOL SURVEY Percentage of 8 th and 11 th Public School Students Who Reported Using Painkillers in the Past Month by Zip-Code 2015 Delaware School Survey. Center for Drug and Health Studies, University of Delaware. 13
14 Reported Past Month Substance Use by Delaware Public School Students, % 4% 3% 2% 1% 5th Grade Cigarettes Alcohol Marijuana Other Illegal Drugs DE State 1% 2% Wilmington 1% 1% New Castle 1% 2% Kent 1% 2% Sussex 1% 2% 15% 8th Grade 1 5% Cigarettes Alcohol Marijuana Other Illegal Drugs DE State 2% 1 7% 3% Wilmington 2% 11% 14% 4% New Castle 1% 9% 6% 3% Kent 2% 1 6% 2% Sussex 3% 12% 8% 5% th Grade Cigarettes Alcohol Marijuana Other Illegal Drugs DE State 7% 3 24% 3% Wilmington 5% 31% 31% 4% New Castle 6% 29% 24% 3% Kent 7% 29% 16% 3% Sussex 1 35% 3 5% 2015 Delaware School Survey. Center for Drug and Health Studies, University of Delaware. 14
15 Reported Binge Drinking a and Heavy Substance b Use by Delaware Public School Students, % 16% 14% 12% 1 8% 6% 4% 2% Binge Drinking 8th Grade Heavy Marijuana Use DE State 4% 3% Wilmington 4% 5% New Castle 4% 3% Kent 4% 2% Sussex 5% 3% 24% 22% 2 18% 16% 14% 12% 1 8% 6% 4% 2% Binge Drinking 11th Grade Notes: a Binge use is defined as three drinks at a time in the last two weeks. b Heavy Use indicates more than six times in the past month. Heavy Marijuana Use DE State 16% 12% Wilmington 17% 18% New Castle 15% 12% Kent 16% 7% Sussex 21% 14% 2015 Delaware School Survey. Center for Drug and Health Studies, University of Delaware. 15
16 Reported Past Month Drinking and Marijuana Smoking Companions Among Delaware Public School Students, th Graders Drinking Companions Sibling(s) Adult family Friends from School Friends from neighbor- hood Coworkers Boy/ Girlfriend Drank alone DE State Wilmington New Castle Kent Sussex th Graders Drinking Companions Sibling(s) Adult family Friends from School Friends from neighbor- hood Other adults Boy/ Girlfriend 2015 Delaware School Survey. Center for Drug and Health Studies, University of Delaware. Drank alone DE State Wilmington New Castle Kent Sussex
17 8 th Graders Marijuana Smoking Companions Sibling(s) Adult family Friends from School Friends from neighborhood DE State Wilmington New Castle Kent Sussex Alone 11 th Graders Past Month Marijuana Smoking Companions, Sibling(s) Adult family Friends from School Friends from neighborhood DE State Wilmington New Castle Kent Sussex Alone 2015 Delaware School Survey. Center for Drug and Health Studies, University of Delaware. 17
18 Reported Past Month Drinking Locations Among Delaware Public School Students, th Grade At home Someone' s house At a party At a sports event At school In car In public DE State Wilmington New Castle Kent Sussex th Grade At home Someone' s house At a party At a sports event At school In car In public DE State Wilmington New Castle Kent Sussex Delaware School Survey. Center for Drug and Health Studies, University of Delaware. 18
19 Reported Perceptions of Risk in Substance Use Among Delaware Public School Students, th Graders Percpetions of "A Lot of Risk" in Substance Use Smoke one ore more packs of cigarettes per day Daily use of alcohol Try marijuana once or twice DE State 52% 42% 28% New Castle 54% 43% 28% Kent 53% 46% 32% Sussex 49% 39% 27% 8th Graders' Perceptions of "Moderate" or "Great Risk" in Substance Use, Smoke one ore more packs of cigarettes per day Daily use of alcohol Try marijuana once or twice DE State 74% 74% 63% Wilmington 67% 69% 56% New Castle 76% 76% 65% Kent 75% 74% 63% Sussex 73% 61% 39% 11th Graders' Perceptions of "Moderate" or "Great Risk" in Substance Use Smoke one ore more packs of cigarettes per day Daily use of alcohol Try marijuana once or twice DE State 84% 84% 51% Wilmington 76% 76% 39% New Castle 84% 84% 5 Kent 88% 88% 6 Sussex 76% 82% Delaware School Survey. Center for Drug and Health Studies, University of Delaware. 19
20 Reported Self-Disapproval of Substance Use Among Delaware Public School Students, 2015 (Percentage of students responding with "wrong" or "very wrong") 8th Grade Tobacco Alcohol* Marijuana** DE State 82% 83% 84% Wilmington 81% 84% 76% New Castle 82% 83% 84% Kent 84% 83% 87% Sussex 8 82% 87% th Grade Tobacco Alcohol* Marijuana** DE State 68% 68% 57% Wilmington 71% 77% 56% New Castle 69% 68% 55% Kent 7 71% 64% Sussex 71% 62% 55% Note: *1-2 drinks of alcohol daily **Regular Use 2015 Delaware School Survey. Center for Drug and Health Studies, University of Delaware.. 20
21 10 Reported Group Fight Participation Among Delaware Public School Students, th Grade Past year group ]ight DE State 1 Wilmington 18% New Castle 8% Kent 9% Sussex 9% 10 11th Grade Past year group ]ight DE State 7% Wilmington 9% New Castle 6% Kent 6% Sussex 7% Source 2015 Delaware School Survey. Center for Drug and Health Studies, University of Delaware. 21
22 Reported Acts of Violence Among Delaware Public School Students, th Grade Hit someone with the intention of hurting them DE State 2 Wilmington 24% New Castle 2 Kent 23% Sussex 19% 5 11th Grade Hit someone with the intention of hurting them DE State 16% Wilmington 24% New Castle 16% Kent 12% Sussex 16% 2015 Delaware School Survey. Center for Drug and Health Studies, University of Delaware. 22
23 Reported Class Attendance Among Delaware Public School Students, th Grade Skip or miss classes without permission Get suspended or expelled from school DE State 8% 13% Wilmington 1 2 New Castle 7% 11% Kent 8% 12% Sussex 1 16% th Grade Skip or miss classes without permission Get suspended or expelled from school DE State 19% 18% Wilmington 2 2 New Castle 18% 18% Kent 16% 15% Sussex 25% 25% 2015 Delaware School Survey. Center for Drug and Health Studies, University of Delaware. 23
24 Reports of Selling Drugs Among Delaware Public School Students, % 8% 7% 6% 5% 4% 3% 2% 1% Alcohol 8th Grade Marijuana Prescription Pain Killers Other Illegal Drugs DE State 3% 5% 2% 1% Wilmington 4% 8% 2% 3% New Castle 2% 5% 1% 1% Kent 3% 3% 2% 1% Sussex 5% 5% 2% 1% 2 11th Grade 15% 1 5% Alcohol Marijuana Prescription Pain Killers Other Illegal Drugs DE State 8% 12% 3% 2% Wilmington 7% 16% 4% 4% New Castle 7% 11% 2% 2% Kent 8% 1 2% 1% Sussex 9% 15% 3% 2% 2015 Delaware School Survey. Center for Drug and Health Studies, University of Delaware. 24
25 DELAWARE YOUTH SURVEY DATA BY SUB-STATE AREA 2.2 Perceptions of Family The following section includes data from the Delaware School Surveys that relate to youth self-reports of their family composition and of attitudes and behaviors related to their families and perceived attitudes of their parents. The following charts are by sub-state planning area. Again, please note that Zip Code and City identifying information are not available for 5 th Grade data, so there are no separate tables or charts for Wilmington 5 th graders. Wilmington-specific information is provided for 8 th and 11 th graders. 25
26 Reported Family Structure Among Delaware Public School Students, 2015 No parent in home 5th Grade Single parent in home Foster parent or guardian Two parents in home DE State 6% 33% 1% 6 New Castle 6% 32% 1% 61% Kent 7% 35% 1% 58% Sussex 6% 33% 1% No parent in home 8th Grade Singe parent in home Foster parent or guardian Two parents in home DE State 6% 37% 1% 57% Wilmington 8% 39% 2% 51% New Castle 5% 32% 1% 62% Kent 7% 42% 1% 5 Sussex 6% 38% 1% 55% 11th Grade No parent in home Singe parent in home Foster parent or guardian Two parents in home DE State 6% 41% 1% 52% Wilmington 8% 56% 1% 35% New Castle 6% 37% 1% 56% Kent 6% 41% 1% 52% Sussex 7% 47% 1% 45% 2015 Delaware School Survey. Center for Drug and Health Studies, University of Delaware. 26
27 2 15% 1 5% Reported Violence or Threats at Home Among Delaware Public School Students, th Grade Seen or Heard Adults in Home Hurting Each other DE State 7% Wilmington 9% New Castle 7% Kent 7% Sussex 7% 2 8th Grade 15% 1 5% Heard Yelling Between People in Your Home (Past Month) Seen or Heard Violence Between People in Your Home (Past Month) DE State 12% 4% Wilmington 11% 6% New Castle 12% 4% Kent 12% 4% Sussex 12% 4% 11th Grade 2 15% 1 5% Heard Yelling Between People in Your Home (Past Month) Seen or Heard Violence Between People in Your Home (Past Month) DE State 11% 4% Wilmington 11% 5% New Castle 11% 4% Kent 11% 4% Sussex 12% 4% 2015 Delaware School Survey. Center for Drug and Health Studies, University of Delaware. 27
28 Reported Parental Smoking Among Delaware Public School Students, 2015 Mother/Stepmother 5th Grade Father/Stepfather DE State 15% 18% New Castle 14% 16% Kent 18% 2 Sussex 17% 22% Mother/Stepmother 8th Grade Father/Stepfather DE State 18% 21% Wilmington 21% 21% New Castle 15% 18% Kent 21% 25% Sussex 22% 25% Mother/Stepmother 11th Grade Father/Stepfather DE State 17% 19% Wilmington 17% 17% New Castle 15% 18% Kent 21% 19% Sussex 23% 26% 2015 Delaware School Survey. Center for Drug and Health Studies, University of Delaware. 28
29 10 Reported Parental Perceptions of Tobacco Use Among Delaware Public School Students, th Grade Tobacco DE State 82% Wilmington 81% New Castle 82% Kent 84% Sussex th Grade Tobacco DE State 68% Wilmington 71% New Castle 69% Kent 7 Sussex 62% 2015 Delaware School Survey. Center for Drug and Health Studies, University of Delaware. 29
30 Reported Parental Perceptions of Alcohol Use Among Delaware Public School Students, 2015 (Based on whether parents think daily use of Alcohol is wrong or very wrong ) 10 8th Grade Alcohol DE State 83% Wilmington 84% New Castle 84% Kent 83% Sussex 83% 10 11th Grade Alcohol DE State 68% Wilmington 77% New Castle 68% Kent 71% Sussex 62% 2015 Delaware School Survey. Center for Drug and Health Studies, University of Delaware. 30
31 Reported Parental Perceptions of Marijuana Use Among Delaware Public School Students, 2015 (Based on whether parents think daily use of Alcohol is wrong or very wrong ) 10 8th Grade Marijuana DE State 84% Wilmington 77% New Castle 84% Kent 87% Sussex 83% 10 11th Grade Marijuana DE State 56% Wilmington 56% New Castle 55% Kent 63% Sussex 55% 2015 Delaware School Survey. Center for Drug and Health Studies, University of Delaware. 31
32 Reports of Talking to Parents about the Risk of Drugs Among Delaware Public School Students, th Graders' Reports of Parents Telling Students not to do the Following: smoke cigarette drink alcohol use marijuana use other illegal drugs DE State 77% 67% 67% 72% New Castle 76% 66% 65% 7 Kent 77% 68% 69% 71% Sussex 81% 72% 7 76% th Graders' Reports of Talking with Students about the Risks of Drugs and Alcohol Risks of drinking alcohol Risks of using illegal drugs DE State 34% 36% Wilmington 28% 32% New Castle 35% 37% Kent 24% 25% Sussex 39% 43% 11th Graders' Reports of Talking with Students about the Risks of Drugs and Alcohol, Risks of drinking alcohol Risks of using illegal drugs DE State 28% 3 Wilmington 25% 26% New Castle 26% 29% Kent 33% 34% Sussex 34% 36% 2015 Delaware School Survey. Center for Drug and Health Studies, University of Delaware. 32
33 Reported Getting Along with Parents Among Delaware Public School Students, th Grade Get along with parents most of the time DE State 95% New Castle 96% Kent 95% Sussex 95% th Grade Most of the time/often Some of the time Not often/never DE State 86% 11% 3% Wilmington 87% 1 3% New Castle 86% 11% 3% Kent 84% 14% 2% Sussex 84% 12% 4% 11th Grade Most of the time/often Some of the time Not often/never DE State 82% 14% 4% Wilmington 76% 2 4% New Castle 82% 15% 4% Kent 84% 11% 4% Sussex 81% 13% 5% 2015 Delaware School Survey. Center for Drug and Health Studies, University of Delaware. 33
34 Reported Certainty of Punishment Among Delaware Public School Students, th Graders who "agree" or "strongly agree" that rules are strictly enforced Rules are strictly enforced DE State 28% New Castle 28% Kent 25% Sussex 27% 8th Graders Who Agree/Strongly Agree with the Statement, "Your Parents Rules For You Are Strictly Enforced Rules are strictly enforced DE State 71% Wilmington 67% New Castle 73% Kent 66% Sussex 71% th Graders Who Agree/Strongly Agree with the Statement, "Your Parents Rules For You Are Strictly Enforced" Rules are strictly enforced DE State 68% Wilmington 63% New Castle 68% Kent 7 Sussex Delaware School Survey. Center for Drug and Health Studies, University of Delaware. 34
35 Reports of Parents Knowing Where Students Are When Not in School Among Delaware Public School Students, th Grade Parents know where I am DE State 95% New Castle 96% Kent 95% Sussex 95% th Grade Most of the time/often Some of the time Not often/never DE State 91% 6% 3% Wilmington 87% 8% 5% New Castle 92% 6% 2% Kent 93% 5% 2% Sussex 92% 6% 2% th Grade Most of the time/often Some of the time Not often/never DE State 87% 1 3% Wilmington 82% 13% 5% New Castle 88% 1 3% Kent 89% 8% 3% Sussex 86% 1 4% 2015 Delaware School Survey. Center for Drug and Health Studies, University of Delaware. 35
36 DELAWARE YOUTH SURVEY DATA BY SUB-STATE AREA 2.3 Perceptions of School The following section includes data from the Delaware School Surveys that relate to youth self-reports of their attitudes and behaviors related to their school and to other kids at school. Information on perceived verbal abuse and violence as well as attitude about school rules and norms are provided. The following charts are by sub-state planning area. Again, please note that Zip Code and City identifying information are not available for 5 th Grade data, so there are no separate tables or charts for Wilmington 5 th graders. Wilmington-specific information is provided for 8 th and 11 th graders. 36
37 Reported Violence and Bullying in the past month among By Delaware Public School Students, th Grade Been Bullied at School Hit Someone DE State 18% 14% Wilmington 19% 18% New Castle 17% 13% Kent 24% 15% Sussex 19% 13% 8th Grade Been Bullied at School Hit Someone DE State 12% 9% Wilmington 1 12% New Castle 12% 9% Kent 14% 9% Sussex 12% 8% 11th Grade Been Bullied at School Hit Someone DE State 6% 5% Wilmington 12% 8% New Castle 6% 5% Kent 67% 4% Sussex 16% 6% 2015 Delaware School Survey. Center for Drug and Health Studies, University of Delaware. 37
38 Reported School Violence Among Delaware Public School Students, th Grade Fighting is a Problem at School Been in a Physical Fight at School DE State 63% 89% New Castle 67% 9 Kent 48% 87% Sussex 66% 91% th Grade Student violence is a problem at this school "some of the time" or more often I took some kind of weapon to school or a school event this year DE State 46% 2% Wilmington 54% 4% New Castle 44% 2% Kent 54% 2% Sussex 41% 1% th Grade Student violence is a problem at this school "some of the time" or more often I took some kind of weapon to school or a school event this year DE State 42% 3% Wilmington 47% 4% New Castle 45% 4% Kent 34% 2% Sussex 38% 4% 2015 Delaware School Survey. Center for Drug and Health Studies, University of Delaware. 38
39 Reported Perceptions of School Safety By Delaware Public School Students, th Grade I feel safe in my school DE State 93% New Castle 94% Kent 89% Sussex 93% 8th Grade I feel safe in my school "Most of the time" or "Often" DE State 8 Wilmington 78% New Castle 8 Kent 79% Sussex 82% 11th Grade I feel safe in my school "Most of the time" or "Often" DE State 82% Wilmington 8 New Castle 82% Kent 83% Sussex 83% 2015 Delaware School Survey. Center for Drug and Health Studies, University of Delaware. 39
40 Reported Knowing Where to Buy Drugs By Delaware Public School Students, th Grade Alcohol Marijuana Prescription Painkillers Other Illegal Drugs DE State 22% % Wilmington 21% 4 14% 17% New Castle 2 28% 1 12% Kent 2 27% 9% 11% Sussex 25% 32% 1 16% Alcohol 11th Grade Marijuana Prescription Painkillers Other Illegal Drugs DE State 48% 6 24% 25% Wilmington 4 63% 27% 25% New Castle 48% 61% 24% 25% Kent 5 55% 21% 21% Sussex 5 61% 23% 29% 2015 Delaware School Survey. Center for Drug and Health Studies, University of Delaware. 40
41 Reported Certainty of School Punishment Among Delaware Public School Students, th Graders Who Agree/Strongly Agree with the Statement, "School Rules are Strictly Enforced" The school rules are strictly enforced DE State 88% New Castle 88% Kent 88% Sussex 88% 8th Graders Reports of School Rules Being Strictly Enforced Most of the time/ Often The school rules are strictly enforced DE State 68% Wilmington 67% New Castle 68% Kent 65% Sussex th Graders Who Agree/Strongly Agree with the Statement "School Rules are Strictly Enforced" The school rules are strictly enforced DE State 6 Wilmington 57% New Castle 59% Kent 61% Sussex 64% 2015 Delaware School Survey. Center for Drug and Health Studies, University of Delaware. 41
42 Reported Perception of School Rules By Delaware Public School Students, th Graders Who Strongly Agree/Agree that the School Rules are Fair If you break the school rules, you will de]initely be punished DE State 89% New Castle 88% Kent 89% Sussex 89% 8th Graders Who Strongly Agree/Agree that the School Rules are Fair If you break your school's rules, you will be punished DE State 59% Wilmington 53% New Castle 6 Kent 57% Sussex 58% 11th Graders Who Strongly Agree/Agree that the School Rules are Fair If you break your school's rules, you will be punished DE State 47% Wilmington 38% New Castle 51% Kent 46% Sussex 49% 2015 Delaware School Survey. Center for Drug and Health Studies, University of Delaware. 42
43 DELAWARE YOUTH SURVEY DATA BY SUB-STATE AREA 2.4 Perceptions of Neighborhood The following section includes data from the Delaware School Surveys that relate to youth self-reports of their attitudes and behaviors related to their neighborhood and to other kids in their neighborhood. Information on perceived verbal abuse and violence are provided. The following charts are by sub-state planning area. Again, please note that Zip Code and City identifying information are not available for 5 th Grade data, so there are no separate tables or charts for Wilmington 5 th graders. Wilmington-specific information is provided for 8 th and 11 th graders. 43
44 Reported Violence from in their Neighborhood Among Delaware Public School Students, th Grade 15% 1 5% Feel Safe in Your Neighborhood (Not Often/ Never) Bullied in your Neighborhood (PastMmonth) Got Hit by Another Teen (Past Month) DE State 5% 2% 4% Wilmington 12% 2% 4% New Castle 4% 2% 5% Kent 4% 2% 5% Sussex 4% 2% 3% 2 11th Grade 15% 1 5% Feel Safe in your neighborhood (Not Often/ Never) Bullied in your neighborhood (Past Month) Got Hit by Another Teen (Past Month) DE State 5% 1% 2% Wilmington 17% 1% 2% New Castle 4% 1% 2% Kent 3% 1% 2% Sussex 3% 1% 3% 2015 Delaware School Survey. Center for Drug and Health Studies, University of Delaware. 44
45 3. DELAWARE ADULT SURVEY DATA BY SUB-STATE PLANNING AREA AND OFFICE OF HIGHWAY SAFETY DATA The following section includes tables and charts from the National Household Survey on Drug Use and Health and one page of tables from the Behavioral Risk Factor Surveillance System for Delaware. Each of these sources reports mostly on adults and provides limited data broken down by Sub-state Planning Area for Delaware. Additional information from these sources including all data available by sub-state planning area and all data available statewide are available online (see resources listed in Section 6 of this Profile). 45
46 Illicit Drug Use in the Past Month among Persons Aged 12 or Older, by Substate a Region: Annual Averages Based on 2010, 2011, and 2012 NSDUHs (in percentages) Persons Aged 12 or Older, by Sub-state Region: % Prediction Interval U.S b Northeast U.S South U.S Delaware Delaware Sub- state: Kent County New Castle County (Excluding Wilmington) Sussex County Wilmington Notes: a Estimates are based on a survey-weighted hierarchical Bayes estimation approach. b Difference between the estimate and the estimate is statistically significant at the 0.05 level. c Difference between the estimate and the estimate is statistically significant at the 0.10 level. National Survey on Drug Use and Health: Comparison of the and Model- Based Sub- state Estimates. National Survey on Drug Use and Health: Sub- state Comparison, Tables and Maps of Delaware
47 Illicit Drug Use, Other than Marijuana, in the Past Month among Persons Aged 12 or Older, by Sub-state Region: Annual Averages Based on 2010, 2011, and 2012 a NSDUHs (in percentages) Persons Aged 12 or Older, by Sub-state Region: % Prediction Interval U.S b Northeast U.S b South U.S b Delaware De. Sub- state Kent County New Castle County (Excluding Wilmington) Sussex County Wilmington Notes: a Estimates are based on a survey-weighted hierarchical Bayes estimation approach. b Difference between the estimate and the estimate is statistically significant at the 0.05 level. c Difference between the estimate and the estimate is statistically significant at the 0.10 level. National Survey on Drug Use and Health: Comparison of the and Model- Based Sub- state Estimates. National Survey on Drug Use and Health: Sub- state Comparison, Tables and Maps of Delaware
48 Cigarette Use in Past Month, by Age Group and State: and NSDUHs a (in percentages) Persons Aged 12 or Older, by Sub-state Region: % Prediction Interval U.S Northeast U.S South Delaware De. Sub- State: Kent County New Castle County (Excluding Wilmington) Sussex County Wilmington Notes: a Estimates are based on a survey-weighted hierarchical Bayes estimation approach. b Difference between the estimate and the estimate is statistically significant at the 0.05 level. c Difference between the estimate and the estimate is statistically significant at the 0.10 level. National Survey on Drug Use and Health: Comparison of the and Model- Based Sub- state Estimates. National Survey on Drug Use and Health: Sub- state Comparison, Tables and Maps of Delaware
49 Marijuana Use in the Past Month among Persons Aged 12 or Older, by Substate Region: Annual Averages Based on 2010, 2011, and 2012 NSDUHs a (in percentages) Persons Aged 12 or Older in Delaware, by Sub-state Region: % Prediction Interval Past Month Marijuana Drug Use U.S b Northeast U.S b South U.S Delaware De. Sub- state: Kent County New Castle County (Excluding Wilmington) Sussex County Wilmington Notes: a Estimates are based on a survey-weighted hierarchical Bayes estimation approach. b Difference between the estimate and the estimate is statistically significant at the 0.05 level. c Difference between the estimate and the estimate is statistically significant at the 0.10 level. National Survey on Drug Use and Health: Comparison of the and Model- Based Sub- state Estimates. National Survey on Drug Use and Health: Sub- state Comparison, Tables, and Maps of Delaware
50 Cocaine Use in Past Year, by Age Group and State: Annual Averages Based on 2010, 2011, and 2012 NSDUHs a (in percentages) Persons Aged 12 or Older in Delaware, by Sub-state Region: De. Sub- state: % Prediction Interval U.S b Northeast U.S b South U.S 1.52 b Delaware 1.81 b Kent County New Castle County (Excluding Wilmington) Sussex County 1.25 b Wilmington Notes: a Estimates are based on a survey-weighted hierarchical Bayes estimation approach. b Difference between the estimate and the estimate is statistically significant at the 0.05 level. c Difference between the estimate and the estimate is statistically significant at the 0.10 level. National Survey on Drug Use and Health: Comparison of the and Model- Based Sub- state Estimates. National Survey on Drug Use and Health: Sub- state Comparison, Tables and Maps of Delaware
51 Nonmedical Pain Killer Use in Past Year, by Age Group and State: Annual Averages Based on 2010, 2011, and 2012 NSDUHs a (in percentages) Persons Aged 12 or Older in Delaware, by Sub-state Region: De. Sub- state: % Prediction Interval U.S b Northeast U.S c South U.S b Delaware Kent County New Castle County (Excluding Wilmington) Sussex County Wilmington Notes: a Estimates are based on a survey-weighted hierarchical Bayes estimation approach. b Difference between the estimate and the estimate is statistically significant at the 0.05 level. c Difference between the estimate and the estimate is statistically significant at the 0.10 level. National Survey on Drug Use and Health: Comparison of the and Model- Based Sub- state Estimates. National Survey on Drug Use and Health: Sub- state Comparison, Tables and Maps of Delaware
52 Alcohol Use in the Past Month, by Age Group and State: Annual Averages Based on 2010, 2011, and 2012 NSDUHs a (in percentages) Persons Aged 12 or Older in Delaware, by Sub-state Region: De. Sub- state: % Prediction Interval U.S Northeast U.S South U.S Delaware c Kent County New Castle County (Excluding Wilmington) b Sussex County Wilmington Notes: a Estimates are based on a survey-weighted hierarchical Bayes estimation approach. b Difference between the estimate and the estimate is statistically significant at the 0.05 level. c Difference between the estimate and the estimate is statistically significant at the 0.10 level. National Survey on Drug Use and Health: Comparison of the and Model- Based Sub- state Estimates. National Survey on Drug Use and Health: Sub- state Comparison, Tables and Maps of Delaware
53 Binge Drinking in the Past Month, by Age Group and State: Annual Averages Based on 2010, 2011, and 2012 NSDUHs a (in percentages) Persons Aged 12 or Older in Delaware, by Sub-state Region: De. Sub- state: % Prediction Interval U.S b Northeast U.S South U.S Delaware b Kent County b New Castle County (Excluding Wilmington) Sussex County c Wilmington Notes: Binge Alcohol Use is defined as drinking five or more drinks on the same occasion (i.e., at the same time or within a couple of hours of each other) on at least 1 day in the past 30 days. a Estimates are based on a survey-weighted hierarchical Bayes estimation approach. b Difference between the estimate and the estimate is statistically significant at the 0.05 level. c Difference between the estimate and the estimate is statistically significant at the.10 level. National Survey on Drug Use and Health: Comparison of the and Model- Based Sub- state Estimates. National Survey on Drug Use and Health: Sub- state Comparison, Tables and Maps of Delaware
54 Alcohol Use in the Past Month, by Age Group (12-20 years old) and State: Annual Averages Based on 2010, 2011, and 2012 NSDUHs a (in percentages) Persons Aged in Delaware, by Substate Region: De. Sub- state: % Prediction Interval U.S b Northeast U.S b South U.S b Delaware b Kent County New Castle County (Excluding Wilmington) b Sussex County c Wilmington Notes: a Estimates are based on a survey-weighted hierarchical Bayes estimation approach. b Difference between the estimate and the estimate is statistically significant at the 0.05 level. c Difference between the estimate and the estimate is statistically significant at the 0.10 level. National Survey on Drug Use and Health: Comparison of the and Model- Based Sub- state Estimates. National Survey on Drug Use and Health: Sub- state Comparison, Tables and Maps of Delaware
55 Binge Drinking in the Past Month, by Age Group (12-20 years old) and State: Annual Averages Based on 2010, 2011, and 2012 NSDUHs a (in percentages) Persons Aged in Delaware, by Substate Region: De. Sub- state: % Prediction Interval U.S b Northeast U.S b South U.S b Delaware b Kent County b New Castle County (Excluding Wilmington) b Sussex County Wilmington Notes: Binge Alcohol Use is defined as drinking five or more drinks on the same occasion (i.e., at the same time or within a couple of hours of each other) on at least 1 day in the past 30 days. a Estimates are based on a survey-weighted hierarchical Bayes estimation approach. b Difference between the estimate and the estimate is statistically significant at the 0.05 level. c Difference between the estimate and the estimate is statistically significant at the 0.10 level. National Survey on Drug Use and Health: Comparison of the and Model- Based Sub- state Estimates. National Survey on Drug Use and Health: Sub- state Comparison, Tables and Maps of Delaware
56 Alcohol Dependence or Abuse in the Past Year, by Age Group and State: Annual Averages Based on 2010, 2011, and 2012 NSDUHs a (in percentages) Persons Aged 12 or Older in Delaware, by Sub-state Region: De. Sub- state: % Prediction Interval U.S b Northeast U.S South U.S b Delaware Kent County New Castle County (Excluding Wilmington) Sussex County Wilmington Notes: Dependence or abuse is based on definitions found in the 4th edition of the Diagnostic and Statistical Manual of Mental Disorders (DSM - IV). a Estimates are based on a survey-weighted hierarchical Bayes estimation approach. b Difference between the estimate and the estimate is statistically significant at the 0.05 level. c Difference between the estimate and the estimate is statistically significant at the 0.10 level. National Survey on Drug Use and Health: Comparison of the and Model- Based Sub- state Estimates. National Survey on Drug Use and Health: Sub- state Comparison, Tables and Maps of Delaware
57 Illicit Drug Dependence or Abuse in the Past Year, by Age Group and State: Annual Averages Based on 2010, 2011, and 2012 NSDUHs a (in percentages) Persons Aged 12 or Older in Delaware, by Sub-state Region: De. Sub- state: % Prediction Interval U.S c Northeast U.S b South U.S Delaware Kent County New Castle County (Excluding Wilmington) Sussex County Wilmington Notes: Dependence or abuse is based on definitions found in the 4th edition of the Diagnostic and Statistical Manual of Mental Disorders (DSM - IV). a Estimates are based on a survey-weighted hierarchical Bayes estimation approach. b Difference between the estimate and the estimate is statistically significant at the 0.05 level. c Difference between the estimate and the estimate is statistically significant at the 0.10 level. National Survey on Drug Use and Health: Comparison of the and Model- Based Sub- state Estimates. National Survey on Drug Use and Health: Sub- state Comparison, Tables and Maps of Delaware
58 Alcohol Dependence in the Past Year, by Age Group and State: Annual Averages Based on 2010, 2011, and 2012 NSDUHs a (in percentages) Persons Aged 12 or Older in Delaware, by Sub-state Region: De. Sub- state: % Prediction Interval U.S b Northeast U.S b South U.S b Delaware Kent County New Castle County (Excluding Wilmington) Sussex County Wilmington Notes: Dependence or abuse is based on definitions found in the 4th edition of the Diagnostic and Statistical Manual of Mental Disorders (DSM - IV). a Estimates are based on a survey-weighted hierarchical Bayes estimation approach. b Difference between the estimate and the estimate is statistically significant at the 0.05 level. c Difference between the estimate and the estimate is statistically significant at the 0.10 level. National Survey on Drug Use and Health: Comparison of the and Model- Based Sub- state Estimates. National Survey on Drug Use and Health: Sub- state Comparison, Tables and Maps of Delaware
59 Illicit Drug Dependence in the Past Year, by Age Group and State: Annual Averages Based on 2010, 2011, and 2012 NSDUHs a (in percentages) Persons Aged 12 or Older in Delaware, by Sub-state Region: % Prediction Interval U.S Northeast U.S South U.S Delaware De. Sub- state: Kent County New Castle County (Excluding Wilmington) Sussex County Wilmington Notes: Dependence or abuse is based on definitions found in the 4th edition of the Diagnostic and Statistical Manual of Mental Disorders (DSM - IV). a Estimates are based on a survey-weighted hierarchical Bayes estimation approach. b Difference between the estimate and the estimate is statistically significant at the 0.05 level. c Difference between the estimate and the estimate is statistically significant at the 0.10 level. National Survey on Drug Use and Health: Comparison of the and Model- Based Sub- state Estimates. National Survey on Drug Use and Health: Sub- state Comparison, Tables and Maps of Delaware
60 Needing, but not Receiving Treatment for Alcohol In the Past Year, by Age Group and State: Annual Averages Based on 2010, 2011, and 2012 NSDUHs a (in percentages) Persons Aged 12 or Older in Delaware, by Sub-state Region: De. Sub- State: % Prediction Interval U.S b Northeast U.S South U.S b Delaware Kent County New Castle County (Excluding Wilmington) Sussex County Wilmington Notes: a Estimates are based on a survey-weighted hierarchical Bayes estimation approach. b Difference between the estimate and the estimate is statistically significant at the 0.05 level. c Difference between the estimate and the estimate is statistically significant at the 0.10 level. National Survey on Drug Use and Health: Comparison of the and Model- Based Sub- state Estimates. National Survey on Drug Use and Health: Sub- state Comparison, Tables and Maps of Delaware
61 Needing, but not Receiving Treatment for Illicit Drugs In the Past Year, by Age Group and State: Annual Averages Based on 2010, 2011, and 2012 NSDUHs a (in percentages) Persons Aged 12 or Older in Delaware, by Sub-state Region: De. Sub- state % Prediction Interval U.S c Northeast U.S c South U.S Delaware Kent County New Castle County (Excluding Wilmington) Sussex County Wilmington Notes: a Estimates are based on a survey-weighted hierarchical Bayes estimation approach. b Difference between the estimate and the estimate is statistically significant at the 0.05 level. c Difference between the estimate and the estimate is statistically significant at the 0.10 level. National Survey on Drug Use and Health: Comparison of the and Model- Based Sub- state Estimates. National Survey on Drug Use and Health: Sub- state Comparison, Tables and Maps of Delaware

62 Serious Mental Illness in the Past Year, by Age Group and State: Annual Averages Based on 2010, 2011, and 2012 NSDUHs a (in percentages) Persons Aged 18 or Older in Delaware, by Sub-state Region: De. Sub- state: % Prediction Interval U.S Northeast U.S South U.S Delaware Kent County New Castle County (Excluding Wilmington) Sussex County Wilmington Notes: a Estimates are based on a survey-weighted hierarchical Bayes estimation approach. b Difference between the estimate and the estimate is statistically significant at the 0.05 level. c Difference between the estimate and the estimate is statistically significant at the 0.10 level. National Survey on Drug Use and Health: Comparison of the and Model- Based Sub- state Estimates. National Survey on Drug Use and Health: Sub- state Comparison, Tables and Maps of Delaware
63 Had at Least one Major Depressive Episode In the Past Year, by Age Group and State: Annual Averages Based on 2010, 2011, and 2012 NSDUHs a (in percentages) Persons Aged 18 or Older in Delaware, by Sub-state Region: De. Sub- State % Prediction Interval U.S Northeast U.S South U.S Delaware Kent County New Castle County (Excluding Wilmington) Sussex County Wilmington Notes: a Estimates are based on a survey-weighted hierarchical Bayes estimation approach. b Difference between the estimate and the estimate is statistically significant at the 0.05 level. c Difference between the estimate and the estimate is statistically significant at the 0.10 level. National Survey on Drug Use and Health: Comparison of the and Model- Based Sub- state Estimates. National Survey on Drug Use and Health: Sub- state Comparison, Tables and Maps of Delaware
64 Had Serious Thoughts of Suicide in the Past Year, by Age Group and State: Annual Averages Based on 2010, 2011, and 2012 NSDUHs a (in percentages) Persons Aged 18 or Older in Delaware, by Sub-state Region: De. Sub- state: % Prediction Interval U.S Northeast U.S South U.S Delaware Kent County New Castle County (Excluding Wilmington) Sussex County Wilmington Notes: a Estimates are based on a survey-weighted hierarchical Bayes estimation approach. b Difference between the estimate and the estimate is statistically significant at the 0.05 level. c Difference between the estimate and the estimate is statistically significant at the 0.10 level. National Survey on Drug Use and Health: Comparison of the and Model- Based Sub- state Estimates. National Survey on Drug Use and Health: Sub- state Comparison, Tables and Maps of Delaware
65 Statewide and Sub-state Estimates of Smoking, Binge Drinking, and HIV Risk for Delaware Adults from the 2011 Delaware Behavior Risk Factor Surveillance System Adult Smoking Prevalence Statewide Wilmington Suburban NC Kent Sussex Smoke Every Day Smoke Some Days Former Smoker 14.7% 19.4% 15.4% 19.6% 16.3% 5.2% 4.1% 5.9% 5.5% 4.7% 24.6% 22.1% 26.5% 27.2% 33.9% Acute or "Binge" Drinking [5+ (males) or 4+ (females) Drinks at One Occasion] Statewide Wilmington Suburban N.C. Kent Sussex 20.3% 23.6% 23.3% 16.2% 17.3% Respondents < Age 65 Who Have Ever Had an AIDS Test Statewide Wilmington Suburban N.C. Kent Sussex % 49.8% 43.1% Sources: Delaware Health and Social Services, Division of Public Health, Behavioral Risk Factor Surveillance System (BRFSS), County information on Respondents < Age 65 Who Have Ever Had an AIDS Test, Wilmington information on all tables,
66 FataliQes Per 1000,000 PopulaQon Traffic Fatalities for Delaware, Kent County New Castle County Sussex Count National Highway Traffic Safety Administration. Performance Measures, Delaware. 66
")

67 Center for Highway Asset Management Programs (CHAMPS) Locations of Alcohol-related Motor Vehicle Accidents,
")

68 Center for Highway Asset Management Programs (CHAMPS) Locations of Alcohol-related Motor Vehicle Accidents, 2009, Continued 68
2012 COMMUNITY PROFILE FOR DELAWARE: DATA BY SUB STATE PLANNING AREA April 2012 Revised June 2012
 2012 COMMUNITY PROFILE FOR DELAWARE: DATA BY SUB STATE PLANNING AREA April 2012 Revised June 2012 DESCRIPTION: Sub state/community Level Epidemiologic Profile for Substance Abuse Consumption and Consequences
Underage Drinking and Alcohol Abuse in Kent County, Delaware
 Underage Drinking and Alcohol Abuse in Kent County, Delaware Delaware Drug and Alcohol Tracking Alliance (DDATA) Center for Drug and Alcohol Studies University of Delaware April 2013 42% of Delaware 5
Delaware School Survey: Alcohol, Tobacco
 Delaware School Survey: Alcohol, Tobacco & Other Drug Abuse Among Delaware Students 2017 REPORT TO: The Delaware Health Fund Advisory Committee and The Division of Substance Abuse and Mental Health, Department
2012 STATE EPIDEMIOLOGICAL PROFILE FOR DELAWARE REPORTING ON CONSUMPTION AND CONSEQUENCES OF ALCOHOL, TOBACCO, AND OTHER DRUGS OF ABUSE IN DELAWARE
 22 STATE EPIDEMIOLOGICAL PROFILE FOR DELAWARE REPORTING ON CONSUMPTION AND CONSEQUENCES OF ALCOHOL, TOBACCO, AND OTHER DRUGS OF ABUSE IN DELAWARE March, 22 Prepared by: The University of Delaware Center
Delaware School Survey: Alcohol, Tobacco
 Delaware School Survey: Alcohol, Tobacco & Other Drug Abuse Among Delaware Students 2018 REPORT TO: The Delaware Health Fund Advisory Committee and The Division of Substance Abuse and Mental Health, Department
In their Eyes: An Average Child s View of their World
 In their Eyes: An Average Child s View of their World April 2014 University of Delaware Center for Drug and Health Studies Based on the 2013 Delaware School Surveys And the 2013 Delaware Youth Risk Behavior
Pacific Cascade Middle School. Highlights from the Healthy Youth Survey (March 1, 2013)
") 2012 Pacific Cascade Middle School Highlights from the Healthy Youth Survey (March 1, 2013) Student Participation 253 (93 %) of Grade 6 students 229 (89 %) of Grade 8 students Not reported: Grade 10 students
2012 Pacific Cascade Middle School Highlights from the Healthy Youth Survey (March 1, 2013) Student Participation 253 (93 %) of Grade 6 students 229 (89 %) of Grade 8 students Not reported: Grade 10 students
Alcohol Use and Related Behaviors
 Alcohol Use and Related Behaviors 1 8 6 4 2 21 23 25 27 Current Drinking 48.7 5.7 42.3 43.2 Binge Drinking First Drink of Alcohol Before Age 13 28.6 27.9 Figure 1 Trends in Alcohol Use, Grades 7 12, 21
2012 Florida Youth Substance Abuse Survey
 2012 Florida Youth Substance Abuse Survey Data Tables 2012 Florida Department of Children & Families Table 1. Major demographic characteristics of surveyed youth and youth, 2012 N % N % Sex Female 1,306
2016 Florida Youth Substance Abuse Survey
 2016 Florida Youth Substance Abuse Survey Data Tables 2016 Florida Department of Children & Families Table 1. Major demographic characteristics of surveyed and, 2016 N % N % Sex Female 779 48.4 31,515
2016 Florida Youth Substance Abuse Survey
 2016 Florida Youth Substance Abuse Survey Data Tables 2016 Florida Department of Children & Families Table 1. Major demographic characteristics of surveyed and, 2016 N % N % Sex Female 774 51.9 31,515
2014 School Trend Report Hinsdale Middle School Hinsdale
 2014 School Trend Report Hinsdale Middle School Hinsdale 2014 Trend Report for Hinsdale Middle School Page 1 of 53 Introduction Your IYS Trend Report provides information for selected IYS indicators that
2014 Florida Youth Substance Abuse Survey
 2014 Florida Youth Substance Abuse Survey Data Tables 2014 Florida Department of Children & Families Table 1. Major demographic characteristics of surveyed and, 2014 N % N % Sex Female 936 52.0 33,366
2014 District Trend Report Hinsdale CCSD 181
 2014 District Trend Report Hinsdale CCSD 181 2014 Trend Report for Hinsdale CCSD 181 Page 1 of 54 Introduction Your IYS Trend Report provides information for selected IYS indicators that reflect changes
Participating Schools
 Participating Schools Amanda -Clearcreek Local School District Berne Union Local School District Bloom - Carroll Local School District Fairfield Union Local School District Fisher Catholic High School
05/27/2011 Page 1 of 15
 Number of IYS 2010 Respondents N Total Grade 218 194 412 Age Avg N Avg How old are you? 11.9 218 13.8 193 Gender % N % N Female 5 112 5 103 Male 4 99 4 88 Race/Ethnicity N % N % N White 7 164 8 158 Black
11/02/2011 Page 1 of 16
 Survey Validity % N Invalid 10 Valid 9 201 Valid surveys are those that have 4 or more of the questions answered, report no derbisol use, and indicate that the respondent was honest at least some of the
Alcohol Use and Related Behaviors
 213 NM-YRRS Survey Results Report Alcohol Use and Related Behaviors Alcohol is the most commonly used and abused drug among youth in the United States, more so than tobacco or illicit drugs.1 Youth who
05/26/2011 Page 1 of 15
 Number of IYS 2010 Respondents N Total Grade 198 203 401 Avg Age N Avg How old are you? 11.9 198 13.9 203 Gender % N % N Female 4 96 5 115 Male 5 99 4 87 Race/Ethnicity N % N % N White 8 165 8 176 Black
05/26/2011 Page 1 of 15
 Number of IYS 2010 Respondents N Total Grade 101 102 203 Avg Age N Avg How old are you? 11.8 101 13.7 102 Gender % N % N Female 4 43 5 52 Male 5 57 4 50 Race/Ethnicity N % N % N White 9 97 9 99 Black /
Issaquah School District. Highlights from the Healthy Youth Survey (March 1, 2015)
") Highlights from the Healthy Youth Survey (March 1, 2015) 1 Student Participation Blank Space 1356 (90%) of Grade 6 students 1236 (86%) of Grade 8 students 1018 (75%) of Grade 10 students 784 (59%) of Grade
Highlights from the Healthy Youth Survey (March 1, 2015) 1 Student Participation Blank Space 1356 (90%) of Grade 6 students 1236 (86%) of Grade 8 students 1018 (75%) of Grade 10 students 784 (59%) of Grade
11/04/2011 Page 1 of 16
 Survey Validity % N Invalid 5 Valid 96% 116 Valid surveys are those that have 4 or more of the questions answered, report no derbisol use, and indicate that the respondent was honest at least some of the
11/03/2011 Page 1 of 16
 Survey Validity % N Invalid 5 Valid 9 181 Valid surveys are those that have 4 or more of the questions answered, report no derbisol use, and indicate that the respondent was honest at least some of the
MENTAL HEALTH 2011 SURVEY RESULTS REPORT. and Related Behaviors. Figure 1 n Trends in mental health indicators, Grades 9 12, New Mexico,
 2011 SURVEY RESULTS REPORT MENTAL HEALTH and Related Behaviors 50 40 30 20 Persistent sadness or hopelessness Percent (%) 10 0 2003 2005 2007 2009 2011 31.9 28.7 30.8 29.7 29.1 Seriously considered suicide
2014 FLORIDA YOUTH SUBSTANCE ABUSE SURVEY. Santa Rosa County
 2014 FLORIDA YOUTH SUBSTANCE ABUSE SURVEY Santa Rosa County Methodology Survey administration: February of 2014. Sampling strategy: schools and classrooms were selected to generate statistically representative
Tacoma School District. Highlights from the Healthy Youth Survey (March 1, 2017)
") Highlights from the Healthy Youth Survey (March 1, 2017) 1 Student Participation 1,572 (79%) of Grade 6 students 1,522 (77%) of Grade 8 students 885 (45%) of Grade 10 students 625 (33%) of Grade 12 students
Highlights from the Healthy Youth Survey (March 1, 2017) 1 Student Participation 1,572 (79%) of Grade 6 students 1,522 (77%) of Grade 8 students 885 (45%) of Grade 10 students 625 (33%) of Grade 12 students
Alcohol & Drug Abuse Prevention Team. Student Survey Report 2018
 Alcohol & Drug Abuse Prevention Team Student Survey Report 2018 2 Introduction The need for such a survey is clear. The drug problem and the context within which substance use and abuse occurs will not
ALCOHOL USE 2011 SURVEY RESULTS REPORT AND RELATED BEHAVIORS. Figure 1 n Trends in current alcohol use, Grades 9 12, New Mexico,
 2011 SURVEY RESULTS REPORT ALCOHOL USE AND RELATED BEHAVIORS 100 80 60 40 Current drinking Percent (%) 20 0 2003 2005 2007 2009 2011 50.7 42.3 43.2 40.5 36.9 First drink before age 13 35.8 30.0 30.7 29.4
Alcohol, Tobacco & Other Drug Abuse Among Delaware Students
 Alcohol, Tobacco & Other Drug Abuse Among Delaware Students 00 FINAL REPORT To: The Delaware Health Fund Advisory Committee and The Division of Substance Abuse and Mental Health, Department of Health and
Summary of Highlights Tompkins County Spring, 2017
 Communities that Care Youth Survey Summary of Highlights Tompkins County Spring, 2017 Community Coalition for Healthy Youth www.healthyyouth.org Tompkins County Youth Services Dept. www.tompkinscountyny.gov/youth
2014 FLORIDA YOUTH SUBSTANCE ABUSE SURVEY. Escambia County
 2014 FLORIDA YOUTH SUBSTANCE ABUSE SURVEY Escambia County Methodology Survey administration: February of 2014. Sampling strategy: schools and classrooms were selected to generate statistically representative
APNA. Arkansas Prevention Needs Assessment Student Survey
 2013 APNA Arkansas Prevention Needs Assessment Student Survey Jefferson County Profile Report Arkansas Department of Human Services Division of Behavioral Health Services Prevention Services Conducted
2016 FLORIDA YOUTH SUBSTANCE ABUSE SURVEY. Flagler County
 2016 FLORIDA YOUTH SUBSTANCE ABUSE SURVEY Flagler County Methodology Survey administration: February of 2016. Sampling strategy: schools and classrooms were selected to generate statistically representative
Alcohol Use among Youth in Delaware by County with addi9onal informa9on on Hispanics in Sussex County
 Alcohol Use among Youth in Delaware by County with addi9onal informa9on on Hispanics in Sussex County Prepared for La Esperanza Center for Drug and Alcohol Studies University of Delaware April, 2014 Data
Behavioral Health Barometer. Oregon, 2015
 Behavioral Health Barometer Oregon, 2015 Acknowledgments This report was prepared for the Substance Abuse and Mental Health Services Administration (SAMHSA) by RTI International under contract No. 283
2016 Union County Youth Risk Behavior Survey Results. April 20, 2016
 2016 Union County Youth Risk Behavior Survey Results April 20, 2016 Methods The Union County Youth Risk Behavior Survey (YRBS) was previously conducted in 2009,* 2010, 2012, and 2014. Information gathered
2018 School Report. Emerson Middle School Niles
 2018 School Report Emerson Middle School Niles Data collected Spring 2018 Introduction Congratulations! Based on your administration of the Illinois Youth Survey (2018), this report provides data on a
Arkansas Prevention Needs Assessment Survey
 2016 Arkansas Prevention Needs Assessment Survey Clark County Profile Report Arkansas Department of Human Services Division of Behavioral Health Services Prevention Services Conducted by International
Charlotte Mecklenburg Youth Risk Behavior Survey
 2015 Charlotte Mecklenburg Youth Risk Behavior Survey HIGH SCHOOL TREND REPORT A collaborative report from Charlotte Mecklenburg Schools and Mecklenburg County Health Department 2015 Charlotte Mecklenburg
Arkansas Prevention Needs Assessment Survey
 2016 Arkansas Prevention Needs Assessment Survey Pope County Profile Report Arkansas Department of Human Services Division of Behavioral Health Services Prevention Services Conducted by International Survey
Sevier County Profile Report
 Sevier County Profile Report . Contents 1 INTRODUCTION 6 1.1 The Risk and Protective Factor Model of Prevention........ 9 2 TOOLS FOR ASSESSMENT AND PLANNING 9 3 SCHOOL IMPROVEMENT USING SURVEY DATA 10
Conducted by International Survey Associates dba Pride Surveys
 2015 Clark County Profile Report Arkansas Department of Human Services Division of Behavioral Health Services Prevention Services Conducted by International Survey Associates dba Pride Surveys . Contents
Conducted by International Survey Associates dba Pride Surveys
 2015 Phillips County Profile Report Arkansas Department of Human Services Division of Behavioral Health Services Prevention Services Conducted by International Survey Associates dba Pride Surveys . Contents
Fairfield County Youth Behavior Survey 2016 Executive Summary
 Fairfield County Youth Behavior Survey 2016 Executive Summary Preventing teen drug and alcohol use takes a full community effort. The Fairfield County Youth Behavior Survey is one of the key elements used
Conducted by International Survey Associates dba Pride Surveys
 2015 Faulkner County Profile Report Arkansas Department of Human Services Division of Behavioral Health Services Prevention Services Conducted by International Survey Associates dba Pride Surveys . Contents
2014 FLORIDA YOUTH SUBSTANCE ABUSE SURVEY. South Florida Behavioral Health Network
 2014 FLORIDA YOUTH SUBSTANCE ABUSE SURVEY South Florida Behavioral Health Network Methodology Survey administration: February of 2014. Sampling strategy: schools and classrooms were selected to generate
Whitney Israel, Ashley Brooks-Russell, Ming Ma Community Epidemiology & Program Evaluation Group, University of Colorado, Anschutz Medical Campus
 Whitney Israel, Ashley Brooks-Russell, Ming Ma Community Epidemiology & Program Evaluation Group, University of Colorado, Anschutz Medical Campus Prepared for the Colorado Department of Public Health and
Alcohol, Tobacco & Other Drug Abuse Among Delaware Students
 Alcohol, Tobacco & Other Drug Abuse Among Delaware Students 00 FINAL REPORT To: The Delaware Health Fund Advisory Committee and The Division of Substance Abuse and Mental Health, Department of Health and
2014 FLORIDA YOUTH SUBSTANCE ABUSE SURVEY. Central Florida Behavioral Health Network
 2014 FLORIDA YOUTH SUBSTANCE ABUSE SURVEY Central Florida Behavioral Health Network Methodology Survey administration: February of 2014. Sampling strategy: schools and classrooms were selected to generate
Arkansas Prevention Needs Assessment Survey
 2017 Arkansas Prevention Needs Assessment Survey Ashley County Profile Report Arkansas Department of Human Services, Division of Aging, Adults and Behavioral Health Services And University of Arkansas
2012 FLORIDA YOUTH SUBSTANCE ABUSE SURVEY. Miami-Dade County
 2012 FLORIDA YOUTH SUBSTANCE ABUSE SURVEY Miami-Dade County Methodology Survey administration: February-March of 2012. Sampling strategy: schools and classrooms were selected to generate statistically
Arkansas Prevention Needs Assessment Survey
 2017 Arkansas Prevention Needs Assessment Survey Faulkner County Profile Report Arkansas Department of Human Services, Division of Aging, Adults and Behavioral Health Services And University of Arkansas
Arkansas Prevention Needs Assessment Survey
 2017 Arkansas Prevention Needs Assessment Survey Craighead County Profile Report Arkansas Department of Human Services, Division of Aging, Adults and Behavioral Health Services And University of Arkansas
2018 Union County Youth Risk Behavior Survey Results
 2018 Union County Youth Risk Behavior Survey Results METHODS The Union County Youth Risk Behavior Survey (YRBS) was previously conducted in 2009,* 2010, 2012, 2014, and 2016. Information gathered from
Tobacco Use Percent (%)
") Tobacco Use 1 8 6 2 23 25 27 Lifetime cigarette use 64.8 62. 59.9 Current cigarette smoker 3.2 25.7 24.2 Current cigar smoker 19.4 21.3 18.9 First cigarette before age 13 24.7 2. 18. Current spit tobacco
Tobacco Use 1 8 6 2 23 25 27 Lifetime cigarette use 64.8 62. 59.9 Current cigarette smoker 3.2 25.7 24.2 Current cigar smoker 19.4 21.3 18.9 First cigarette before age 13 24.7 2. 18. Current spit tobacco
How Well Do You Know Tompkins County Youth?
 Communities that Care Youth Survey Summary Highlights Tompkins County Spring, 2015 Community Coalition for Healthy Youth www.healthyyouth.org Tompkins County Youth Services Dept. www.tompkinscountyny.gov/youth
Washoe County Community Needs Assessment Join Together Northern Nevada Airmotive Way, Ste Reno, NV
 Washoe County Community Needs Assessment - 2008 Join Together Northern Nevada 1325 Airmotive Way, Ste 325 1 Reno, NV 89502 www.jtnn.org Table of Contents Introduction 3 Washoe County Demographics 4 Safety/Security/Violence/Suicide
Dallas County County Profile Report
 County Profile Report Contents 1 INTRODUCTION 3 1.1 The Risk and Protective Factor Model of Prevention............................ 3 2 TOOLS FOR ASSESSMENT AND PLANNING 4 3 SCHOOL IMPROVEMENT USING SURVEY
2016 FREQUENCY REPORT. State of Illinois. Weighted Sample to Represent the State of Illinois
 2016 FREQUENCY REPORT State of Illinois Weighted Sample to Represent the State of Illinois Overview of the Illinois Youth Survey The Illinois Department of Human Services (IDHS) has funded the administration
Suburban Chicago Weighted Sample to Represent Suburban Chicago Counties:
 2016 FREQUENCY REPORT Suburban Chicago Weighted Sample to Represent Suburban Chicago Counties: Cook County (excluding City of Chicago) DeKalb County DuPage County Grundy County Kane County Kendall County
2015 Cuyahoga County Youth Risk Behavior Survey: Overall Prevalence
 2015 Cuyahoga County Youth Survey: Overall Prevalence Introduction The Prevention Research Center for Healthy Neighborhoods (PRCHN) at Case Western Reserve University has administered the Youth Survey
SEOW Annual Report. Presented to SPF PFS Management. Report Timeframe: October 2015 September 2016
 SEOW Annual Report Presented to SPF PFS Management Report Timeframe: October 2015 September 2016 Alignment of DE SEOW with SAMHSA Identified Core Tasks The Delaware State Epidemiological Outcomes Workgroup
8. Attitudes and Beliefs
 8. Attitudes and Beliefs Older adolescent Kentuckians are more likely to view smoking, alcohol use, and marijuana use positively than younger adolescents. Participants were asked if they thought they would
Hamilton County Power Up YOUth Surveys 2010
 Total Surveys Returned: 118 Total Surveys by School District: Webster City 75 South Hamilton 22 Northeast Hamilton 21 Total Surveys by Grade 8 th Grade 19 10 th Grade 58 12 th Grade 40 Gender Male 58 Female
2018 FREQUENCY REPORT. State of Illinois. Weighted Sample to Represent the State of Illinois
 2018 FREQUENCY REPORT State of Illinois Weighted Sample to Represent the State of Illinois Overview of the Illinois Youth Survey The Illinois Department of Human Services (IDHS) has funded the administration
Opioid Use and Other Trends
 Opioid Use and Other Trends National Overview Across the nation communities are struggling with a devastating increase in the number of people misusing opioid drugs, leading many to identify the current
Suburban Chicago Weighted Sample to Represent Suburban Chicago Counties:
 2018 FREQUENCY REPORT Suburban Chicago Weighted Sample to Represent Suburban Chicago Counties: Cook County (excluding City of Chicago) DeKalb County DuPage County Grundy County Kane County Kendall County
11/04/2011 Page 1 of 23
 Survey Validity % N Invalid 63 Valid 9 639 Valid surveys are those that have 4 or more of the questions answered, report no derbisol use, and indicate that the respondent was honest at least some of the
College School District California Healthy Kids Survey Report
 California Healthy Kids Survey Report College School District Developing World Class Learners...Through STEAM (Science, Technology, Engineering, the Arts, and Mathematics) Fall 2015 Lorraine Waldau, Editor
11/07/2011 Page 1 of 23
 Survey Validity % N Invalid 41 Valid 9 429 Valid surveys are those that have 4 or more of the questions answered, report no derbisol use, and indicate that the respondent was honest at least some of the
05/26/2011 Page 1 of 26
 Number of IYS 2010 Respondents N Total Grade 52 53 60 165 Age Avg N Avg N Avg How old are you? 14.1 52 16.0 53 17.9 60 Gender % N % N % N Female 5 29 4 23 4 27 Male 4 21 5 29 5 33 Race/Ethnicity N % N
Illinois Youth Survey 2010 Lake County - All Students
 Schools Represented in this Report Count School Total CARL SANDBURG MIDDLE SCHOOL CARMEL CATHOLIC HIGH SCHOOL FREMONT MIDDLE SCHOOL MUNDELEIN CONS HIGH SCHOOL WEST OAK MIDDLE SCHOOL Grade level Total 182
2014 County Report. County Name: Vermilion
 2014 County Report County Name: Vermilion Data collected Spring 2014 Introduction Based on the administration of the Illinois Youth Survey (2014), this report provides county-level data on a variety of
Maryland Epidemiological Profiles on Alcohol
 Maryland Epidemiological Profiles on Alcohol Jurisdiction Rankings 15 August 2016 The Maryland Statewide Epidemiological Outcomes Workgroup Department of Pharmaceutical Health Services Research University
Alcohol Use and Related Behaviors for Alabama Students in Grade 6-12
 Alcohol Use and Related Behaviors for Alabama Students in Grade 6-12 Background During the past three school years the Alabama Department of Education has teamed up with the Department of Mental Health
2014 FREQUENCY REPORT. City of Chicago. Weighted Sample
 2014 FREQUENCY REPORT City of Chicago Weighted Sample Data collected Spring 2014 Composition of Illinois Community Type City of Chicago City of Chicago; does not include remainder of Cook County Table
A REPORT ON THE INCIDENCE AND PREVALENCE OF YOUTH TOBACCO USE IN DELAWARE
 A REPORT ON THE INCIDENCE AND PREVALENCE OF YOUTH TOBACCO USE IN DELAWARE RESULTS FROM THE ADMINISTRATION OF THE DELAWARE YOUTH TOBACCO SURVEY IN SPRING 00 Delaware Health and Social Services Division
Nebraska Young Adult Alcohol Opinion Survey State Summary Report
 2016 Nebraska Young Adult Alcohol Opinion Survey 2010-2016 State Summary Report Nebraska Young Adult Alcohol Opinion Survey 2010-2016 State Summary Report Sheri Dawson, R.N. Director, Division of Behavioral
TOBACCO USE 2011 SURVEY RESULTS REPORT AND RELATED BEHAVIORS. Figure 1 n Trends in current tobacco use, Grades 9 12, New Mexico,
 2011 SURVEY RESULTS REPORT TOBACCO USE AND RELATED BEHAVIORS 50 40 30 20 Any tobacco use 10 0 2003 2005 2007 2009 2011 34.0 30.7 30.2 30.8 25.0 Cigarette smoking Cigar smoking Spit tobacco use 30.2 25.7
Sample Logic Model Template
 Sample Logic Model Template Theory of Change Problem Statement Strategies Activities Outcomes Problem But why? Root Cause But why here? Local Condition Short Term Intermediate Long-Term [1] DATA DATA DATA
Current use of an electronic vapor product (such as an e-cigarette), state and regional comparison
, state and regional comparison") In Arlington, Middle School youth are using e-vapor products at a lower rate than at the state level. However, in High School, more youth are using in Arlington than throughout the state and region in
In Arlington, Middle School youth are using e-vapor products at a lower rate than at the state level. However, in High School, more youth are using in Arlington than throughout the state and region in
SUBSTANCE USE AND MENTAL HEALTH IN RHODE ISLAND (2013) A STATE EPIDEMIOLOGICAL PROFILE
 A STATE EPIDEMIOLOGICAL PROFILE") SUBSTANCE USE AND MENTAL HEALTH IN RHODE ISLAND (2013) A STATE EPIDEMIOLOGICAL PROFILE PREPARED BY The Rhode Island Department of Behavioral Healthcare, Developmental Disabilities and Hospitals (BHDDH)
SUBSTANCE USE AND MENTAL HEALTH IN RHODE ISLAND (2013) A STATE EPIDEMIOLOGICAL PROFILE PREPARED BY The Rhode Island Department of Behavioral Healthcare, Developmental Disabilities and Hospitals (BHDDH)
Prescription Drug Abuse and Heroin: Impact on Oregon s Youth and Young Adults
 North Coast Opioid Summit Prescription Drug Abuse and Heroin: Impact on Oregon s Youth and Young Adults April 28, 2016 The Oregon Epidemic Oregon ranks #2 in Non-Medical Use of Opioids, 5% of population
Composite Prevention Profile: City of Chicago, Illinois
 : City of Chicago, Illinois 2008 City of Chicago Prepared by Published by the Center for Prevention Research and Development, within the Institute of Government and Public Affairs at the University of
MISSOURI STUDENT SURVEY 2010
 MISSOURI STUDENT SURVEY 2010 Missouri Department of Mental Health Division of Alcohol and Drug Abuse This report was prepared for the State of Missouri by: Missouri Institute of Mental Health Division
Student Risk and Protective Factor Survey
 Allegany Risk and County Protective Schools Factor Survey Allegany Spring County 2011 Schools Allegany County Student Risk and Protective Factor Survey 2011 Prepared by: Evalumetrics Research 58 Scotland
2015 South Carolina Profile on Alcohol, Tobacco, and Other Substance Related Indicators
 21 South Carolina Profile on Alcohol, Tobacco, and Other Substance Related Indicators Prepared by South Carolina Department of Alcohol and Other Drug Abuse Services (DAODAS) State Epidemiological Outcomes
Durham Middlefield Local Wellness Coalition SUMMARY OF STUDENT SURVEY DATA, 2007 TO 2017 CHANANA CONSULTING
 Durham Middlefield Local Wellness Coalition SUMMARY OF STUDENT SURVEY DATA, 2007 TO 2017 CHANANA CONSULTING Contents BACKGROUND... 2 DEMOGRAPHICS... 2 CORE MEASURES... 3 Past 30 Day Use... 3 Past 30 Day
Substance Use Trends in the Military, Veteran and Family Population
 Substance Use Trends in the Military, Veteran and Family Population Prepared by: Shana Malone Arizona Criminal Justice Commission Statistical Analysis Center National Illicit Drug Use 1 in 10 individuals
Alcohol, Tobacco & Other Drug Abuse Among Delaware Students
 Alcohol, Tobacco & Other Drug Abuse Among Delaware Students 000 FINAL REPORT To The State Incentive Cooperative Agreement Advisory Committee And The Delaware Prevention Coalition April, 00 Prepared by
Women and Substance Abuse in Nevada. A Special Report
 Women and Substance Abuse in Nevada A Special Report Women and Substance Abuse in Nevada A Special Report Table of Contents Introduction 1 Statewide Demographics & Archival Data 2 Nevada Statewide Telephone
Facilitated by: Andy Duran, Executive Director - LEAD
 lead lake forest, il Facilitated by: Andy Duran, Executive Director - LEAD How many countries in the world allow consumer advertisement for prescription drugs? Think Differently Illicit Drug Use in the
L.M.A.C. Alcohol Tobacco & Other Drugs Survey
 L.M.A.C. Alcohol Tobacco & Other Drugs 2007-2008 Survey of the Livingston School District Grades 4-12 1 Substance abuse and its related problems are among societies most pervasive of health and social
Illinois Youth Survey 2012 Frequency Report: Suburban Chicago Metro Area* Weighted Sample
 Age Mean 11.7 145 Mean 13.7 1492 Mean 15.7 1 Mean 17. 1440 Gender Female Male 4 52 9 754 49 51 723 753 49 51 771 02 49 51 714 Race 53 13 25 0 2 1 White Black/African American Latino/Latina Asian American
Rocklin Unified School District
 Rocklin Unified School District Student Survey Report Fall 2 HIGHLIGHTS AND TRENDS SCHOOL SAFETY MEASURES % feel safe at school always or most of the time Most Rocklin students feel safe at school always
2013 New Jersey Student Health Survey DRUG USE
 2013 New Jersey Student Health Survey DRUG USE Among youth in the United States, illicit drug use is associated with heavy alcohol and tobacco use, (1) violence, delinquency, (2-5) and suicide. (6) All
Growing Up in Delaware: Contexts, Behaviors and Consequences
 Growing Up in Delaware: Contexts, Behaviors and Consequences University of Delaware Center for Drug and Alcohol Studies Presented to the Delaware Kids Caucus December13, 2011 The Delaware High School Youth