The Single Convention on Narcotic Drugs- Implementation in Six Countries: Albania, Bangladesh, India, Kyrgyzstan, Sri Lanka, Ukraine
|
|
|
- Claude Singleton
- 5 years ago
- Views:
Transcription


1 The Single Convention on Narcotic Drugs- Implementation in Six Countries: Albania, Bangladesh, India, Kyrgyzstan, Sri Lanka, Ukraine A MONOGRAPH PREPARED FOR: International Pain Policy Fellowship Training Madison, Wisconsin, USA 6-10 August 2012 University of Wisconsin Pain & Policy Studies Group Carbone Cancer Center World Health Organization Collaborating Center for Pain Policy and Palliative Care 1300 University Ave, 6152 MSC Madison, Wisconsin USA Not for further distribution. Supported by: LIVESTRONG Open Society Foundations
2 Citation: Pain & Policy Studies Group. The Single Convention on Narcotic Drugs - Implementation in Six Countries: Albania, Bangladesh, India, Kyrgyzstan, Sri Lanka, Ukraine. University of Wisconsin Pain & Policy Studies Group/WHO Collaborating Center for Pain Policy and Palliative Care; Madison, Wisconsin, USA (Monograph)
3 Table of Contents I. ABOUT THE PAIN & POLICY STUDIES GROUP... 1 II. INTRODUCTION: INTERPRETING INFORMATION IN THIS MONOGRAPH A. Why are opioid consumption statistics important?... 2 B. Governments are the source of required reports to the INCB... 3 C. Competent national authorities... 4 D. Status of adherence to conventions, receipt of statistics and estimates... 4 III. OVERVIEW OF OPIOID CONSUMPTION A. Global Consumption... 4 B. Regional Consumption... 5 C. National Consumption... 5 D. Morphine Equivalence: Global and National Trends, IV. TABLE 1. COMPETENT NATIONAL AUTHORITIES... 7 V. TABLE 2. STATUS OF ADHERENCE TO CONVENTIONS, RECEIPT OF STATISTICS, AND ESTIMATES... 8 VI. GLOBAL CONSUMPTION TRENDS, Graph 1. Morphine, oxycodone, pethidine, methadone... 9 Graph 2. Fentanyl, hydromorphone VII. GLOBAL CONSUMPTION, Graph 3 and Table 3. Morphine Graph 4 and Table 4. Fentanyl Graph 5 and Table 5. Hydromorphone Graph 6 and Table 6. Oxycodone Graph 7 and Table 7. Pethidine Graph 8 and Table 8. Methadone VIII. REGIONAL CONSUMPTION, Graphs AFRO Graphs AMRO Graphs EMRO Graphs EURO Graphs SEARO Graphs WPRO IX. NATIONAL CONSUMPTION TRENDS, Graphs Albania Graphs Bangladesh Graphs India Graphs Kyrgyzstan Graphs Sri Lanka Graphs Ukraine X. MORPHINE EQUIVALENCE: GLOBAL AND NATIONAL TRENDS, Graph 81 and Table 9. Global Graph 82 and Table 10. Albania Graph 83 and Table 11. Bangladesh Graph 84 and Table 12. India Graph 85 and Table 13. Kyrgyzstan Graph 86 and Table 14. Sri Lanka Graph 87 and Table 15. Ukraine
4 I. ABOUT THE PAIN & POLICY STUDIES GROUP The Pain & Policy Studies Group (PPSG), a global research program at the University of Wisconsin Carbone Cancer Center, is committed to promoting pain relief through effective public policy, communications, and outreach efforts. The PPSG mission is to improve global pain relief by achieving balanced access to opioids worldwide. Much of its work focuses on improving the appropriate medical use of opioid analgesics (such as morphine), which are essential for palliative care, by identifying and addressing legislative and regulatory barriers. Over the last two decades, PPSG has developed an abundance of experience, and expertise, which it uses to provide policy and research resources to colleagues around the world. The PPSG s efforts have focused historically on researching and disseminating information about global under-treatment of pain, disparities in global opioid consumption, methods to identify and address policy barriers at the national level, and providing ongoing technical assistance to colleagues to help them improve availability and access to opioids in their country. Most recently, the PPSG has developed interactive opioid consumption maps, which gives an immediate visual image of the variation in consumption of opioids across the world; and interactive graphs for exploring opioid consumption trends allowing users to explore relationships over time between opioid consumption and other country characteristics, such as Gross Domestic Product or Human Development Index. The PPSG is nationally and internationally recognized for its work and leadership to improve availability of opioid pain medicines, having been at the forefront of such efforts since its creation in
5 II. INTRODUCTION: INTERPRETING INFORMATION IN THIS MONOGRAPH A. Why are opioid consumption statistics important? In 1986, the WHO concluded that most pain due to cancer could be relieved using a simple analgesic method and that every national government should institute a cancer pain relief programme. 1 The WHO analgesic method has also been endorsed for relief of pain due to HIV/AIDS. 2 The analgesic method depends on the availability of, and patient access to, medicines that can relieve severe pain, such as morphine and other opioids. Recognizing that opioids are controlled strictly as narcotic drugs because of a potential for abuse and drug dependence, WHO recommended that governments (a) evaluate their drug control policies and practices to ensure that patients receive the opioid medications that are necessary for pain relief, and (b) encourage health care workers to report to the appropriate authorities any instance in which oral opioids are not available for cancer patients. Indeed, the fact that opioids are narcotic drugs regulated by governments is why those interested in pain relief and palliative care for HIV/AIDS and cancer must learn about the drug regulatory system and prepare to work with governments. For nearly three decades there has been clear guidance from United Nations (UN) health and regulatory agencies regarding the need for governments to address opioid availability and accessibility. These high-level bodies have repeatedly called on governments to identify and remove barriers that block patient access to opioid analgesics. At a recent meeting of the UN Commission on Narcotic Drugs in March 2010, there was a resolution adopted called Promoting adequate availability of internationally controlled licit drugs for medical and scientific purposes while preventing their diversion and abuse, 3 noting the concern that some governments need to take specific measures to ensure adequate access to opioid analgesics in line with the international drug control conventions. In September 2011, the UN General Assembly called attention to the growing international epidemic of non-communicable diseases (NCDs) (including cancer) by holding a high-level Meeting on the Prevention and Control of NCDs. The resulting Political Declaration acknowledges the importance of providing palliative care for people with NCDs, and calls for the use of affordable medicines (including generics) for palliative care. 4 Additionally, non-governmental professional and advocacy groups have made numerous declarations over the years calling on healthcare professionals and governments to improve pain and palliative care, by addressing barriers to the availability of opioids to manage pain. A notable example of such efforts is the World Cancer Declaration from 2008 in which the 1 World Health Organization. Cancer pain relief. Geneva, Switzerland: World Health Organization; World Health Organization HIV-AIDS. Palliative Care. Geneva, Switzerland: World Health Organization; United Nations Economic and Social Council. Promoting adequate availability of internationally controlled licit drugs for medical and scientific purposes while preventing their diversion and abuse; Resolution 53/4. Report on the fifty-third session of the Commission on Narcotic Drugs; 8-12 March 2010; Agenda item 9; Implementation of the international drug control treaties United Nations General Assembly. Political declaration of the High-level Meeting of the General Assembly on the Prevention and Control of Non-communicable Diseases. Draft resolution submitted by the President of the General Assembly at the sixty-sixth session; Agenda item 117; September New York, NY, United Nations. 2
6 Union for International Cancer Control called for effective pain control measures to be available universally to all cancer patients when needed. 5 Consumption statistics for opioids are one indicator of the capability of a country to treat moderate to severe pain. Opioid consumption statistics can also be used to evaluate the outcomes of efforts to improve opioid availability. Morphine is frequently used as a principal indicator because morphine is the most widely available opioid analgesic for moderate to severe pain. Fentanyl, hydromorphone, methadone and oxycodone are included in this publication because they are appropriate to treat moderate to severe pain, and they have become increasingly available globally over the last decade. Consumption trends for pethidine are included in this monograph because (1) although pethidine is no longer recommended for chronic pain, it is still widely used; and (2) since pethidine is subject to the same legal controls as other strong opioids, its consumption is an indication that, from a legal standpoint, the country should be able to obtain other opioids for severe pain, such morphine, fentanyl or oxycodone. Finally, other opioids such as tramadol and codeine are not included because they are not capable of relieving severe pain. B. Governments are the source of required reports to the INCB The International Narcotics Control Board (INCB) is the international narcotic regulatory authority for the United Nations; it monitors national governments implementation of the 1961 Single Convention on Narcotic Drugs. This treaty, to which most governments are party, governs the cultivation, movement and availability of narcotic drugs for medical purposes in the world. According to the Single Convention, narcotic drugs are indispensable for the treatment of pain and suffering, and governments should ensure their adequate availability for all medical and scientific purposes, while preventing diversion and abuse. Governments must annually provide INCB an estimate of the amounts of opioids that will be required to satisfy all medical and scientific needs in the next year. Although INCB confirms the estimate as the amount authorized to be used in the country, the estimate itself is determined and submitted by the government. The INCB does not reduce governments estimates to less than is needed. In fact, if unanticipated needs arise during the year, the INCB encourages governments to submit a supplemental request, which it can confirm in a short amount of time. Recently, in 2012, INCB and WHO published a Guide for governments on estimating requirements for controlled substances, including opioids. 6 Governments also report prior year opioid consumption statistics to the INCB which compiles them into annual statistical reports. 7 Consumption refers to the amounts distributed to the retail level in a country, i.e., to those institutions and programs that are licensed to dispense to patients. Consumption is reported by anhydrous weight of the active drug, not including the salt; 5 Union for International Cancer Control. World Cancer Declaration International Narcotics Control Board, World Health Organization. Guide on Estimating Requirements for Substances under International Control. Vienna: United Nations, International Narcotics Control Board. Narcotic Drugs: Estimated World Requirements for Statistics for New York, NY: United Nations;
7 for example, the amount reported for morphine does not include the weight of the salt (sulfate or chloride), just the morphine base. Some countries do not report consumption statistics. In addition, INCB does not publish reports of consumption less than 0.5 kilogram. However, the PPSG obtains complete annual data from the INCB and makes them available because there are many countries where small amounts are important and because any amount of morphine consumed demonstrates that the government approved its use. C. Competent national authorities Each government that is party to the Single Convention designates an office that is responsible for carrying out required functions, including making estimates and reporting consumption statistics. 8 Table 1 provides a list of the names and contact information for the National Competent Authority in the 6 Fellows countries. These offices may be located in the Ministry of Health in the pharmaceutical department or in the national food or drug control agency. They are the principal national authority for ensuring that opioid analgesics are adequately available for medical and scientific purposes and for submitting the required documents to the INCB. These offices receive reports from the INCB, including technical reports that encourage all governments to examine national policies and administrative procedures for barriers and to consult with health professionals in formulating realistic estimates. However, sometimes these offices do not have adequate personnel to administer these and other important responsibilities in the area of drug control and availability. D. Status of adherence to conventions, receipt of statistics and estimates Table 2 presents information that the INCB compiles annually in an effort to inform the public about whether national governments are adhering to their obligations under the Single Convention. Information is provided for the 6 Fellows countries. From these data, it can be seen that all 6 governments are parties to the Single Convention, 1961, and as amended in 1972, and submitted all required reports for the most recent report. III. OVERVIEW OF OPIOID CONSUMPTION A. Global Consumption Trend in kilograms Graphs 1-2 provide the global consumption trends for morphine, fentanyl, hydromorphone, oxycodone, pethidine and methadone for which presents the big picture of the consumption of opioid analgesics. Prior to 1986, the consumption of morphine throughout the world was low and stable. After 1986, the total global consumption of morphine began to increase as some national governments and health professionals adopted the WHO analgesic method and as new opioid products became available more widely. The consumption of 8 United Nations. Competent national authorities under the international drug control treaties, New York, NY: United Nations;
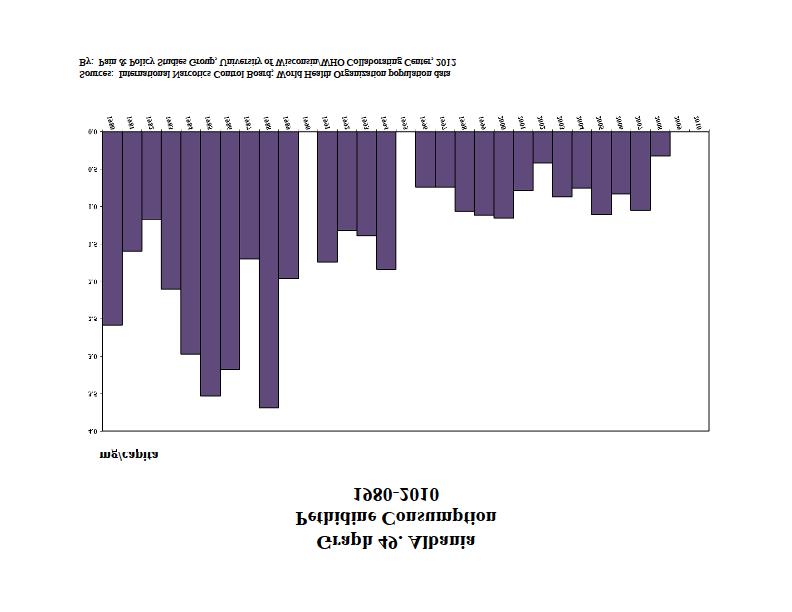
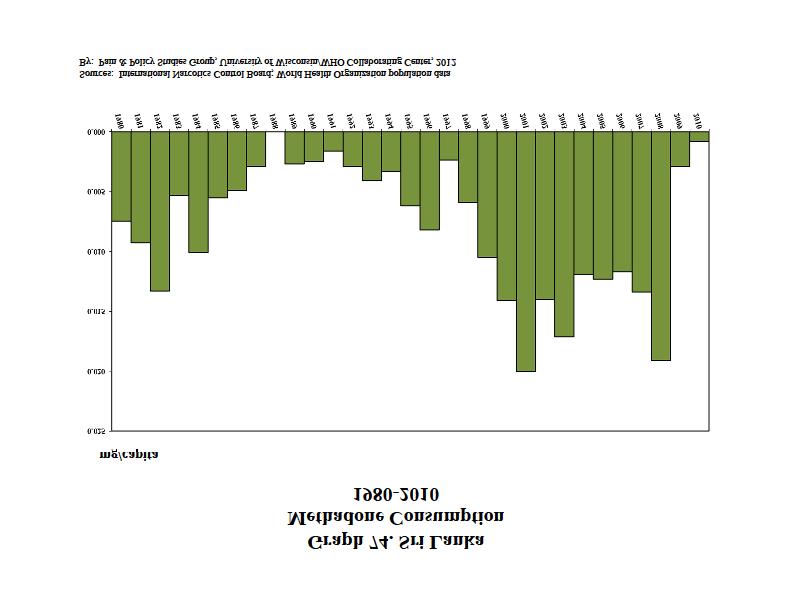
8 pethidine exceeded that of morphine, but has slowly declined as other opioids have become more widely used. Recently, there are indications that consumption of morphine is being offset in some countries by the advent of other opioid analgesics such as fentanyl, hydromorphone, methadone and oxycodone. Although some countries use morphine mainly for cancer pain, morphine may be used for other pain, including acute, post-operative, AIDS, and for chronic non-cancer conditions. In addition, some countries may use strong opioids including morphine and methadone for substitution treatment of drug dependence. 2010, in milligrams per capita Graphs and corresponding Tables 3-8 present global 2010 consumption statistics in milligrams per capita (dividing the total amount of drug consumed in kilograms, by the country population [in millions] of the country) for morphine, fentanyl, hydromorphone, oxycodone, pethidine and methadone. This provides a population-based statistic that allows for comparisons between countries and in relation to the global mean. The consumption of opioids varies greatly from country to country. Fellows countries that reported statistics are highlighted. The vast majority of morphine is consumed in industrialized countries which represent a small part of the world s population. The remaining countries of the world (a number of developed countries and all of the developing countries) consumes comparatively little for In a recent report, the INCB stated, "Global consumption of opioid analgesics for the treatment of moderate to severe pain...increased by more than two and one half times during the past decade...the global figures hide large and enduring disparities in the consumption of opioid analgesics among countries. In 2008, Australia, Canada, New Zealand, the United States and the member States of the European Union together accounted for more than 96 per cent of global consumption of fentanyl, 90 per cent of global consumption of morphine and 98 per cent of global consumption of oxycodone. Although there is sufficient supply of opiate raw materials worldwide, access to opioid analgesics is non-existent or almost non-existent in many countries and in entire regions." (p. 19) 9 B. Regional Consumption Graphs 9-44 present the WHO regional pictures of the consumption of morphine, fentanyl, hydromorphone, oxycodone, pethidine and methadone in milligrams per capita for the WHO Regional Office for Africa (AFRO), WHO Pan American Health Organization (AMRO/PAHO), WHO Regional Office for the Easter Mediterranean (EMRO), WHO Regional Office for Europe (EURO), WHO Regional Office for South-East Asia (SEARO), and WHO Western Pacific Region (WPRO) regions respectively. C. National Consumption Graphs present morphine, fentanyl, hydromorphone, oxycodone, pethidine and methadone consumption trends for the 6 Fellows countries: Albania, Bangladesh, India, Kyrgyzstan, Sri Lanka, Ukraine. These data are expressed in milligrams per capita. A value of 0 indicates that 9 International Narcotics Control Board. Report of the International Narcotics Control Board for New York, NY: United Nations;
9 no report was received by the INCB for that year. D. Morphine Equivalence: Global and National Trends, Historically, the WHO has considered a country s annual consumption of morphine to be an indicator of the extent that opioids are used to treat severe cancer pain and an index to evaluate improvements in pain management. However, over the past 20 years additional opioid analgesic medications and formulations, such as the fentanyl patch, hydromorphone, and sustained-release oxycodone, have been introduced in global and national markets and should be considered when studying opioid consumption in a country, region, and globally. Using the INCB data it receives annually, and applying conversion factors from the WHO Collaborating Center for Drugs Statistics Methodology, PPSG developed a Morphine Equivalence (ME) metric, adjusted for population, for 6 principal opioids used to treat moderate to severe pain: fentanyl, hydromorphone, methadone, morphine, oxycodone, and pethidine. The ME allows for equianalgesic comparisons between countries of the aggregate consumption of these principal opioids (total ME), thereby providing a more complete picture of a country s capability to treat moderate to severe pain than is possible by analyzing morphine consumption alone. Graph 81 presents the Global ME opioid consumption trend from in milligrams per person, with the corresponding Table 9. The ME trend graph illustrates that the ME consumption of fentanyl, oxycodone, and methadone has been higher than morphine since the early 1990s. Graphs and corresponding tables present the ME opioid consumption trend data ( ) for each of the Fellows' countries. 6
10 IV. TABLE 1. COMPETENT NATIONAL AUTHORITIES ALBANIA Ministry of Health Department of Pharmacy Tirana Albania Phone: FAX: BANGLADESH Department of Narcotics Control (DNC) Ministry of Home Affairs Wage Earners Hostel Complex (Level 8) 71-72, Old Elephant Road (Eskaton Garden), Ramna Dhaka 1000, Bangladesh Phone: Fax: dgdnc@bttb.net.bd INDIA Central Bureau of Narcotics Ministry of Finace 19, The Mall Morar Gwalior Madhya Pradesh India Phone: Phone: Phone: Fax: Fax: narcom@sancharnet.in KYRGYZSTAN State Service on Drugs Control of the Kyrgyz Republic 80 Toktogula Street Bishkek The Kyrgyz Republic Phone: Fax: Web: SRI LANKA Medical Supplies Division 357, Deans Road Colombo 10 Sri Lanka Phone: Fax: UKRAINE State Service on Drugs Contol Prospect Chervonozoryanyi Kiev Phone: Fax: info@narko.gov.ua Web: 7
11 V. TABLE 2. STATUS OF ADHERENCE TO CONVENTIONS, RECEIPT OF STATISTICS, AND ESTIMATES Adherence Consumption Statistics Estimated requirements Single Convention 1961 As amended 1961/72 for 2010 for 2012 Albania Bangladesh India Kyrgyzstan Sri Lanka Ukraine = report received 8


12 VI. GLOBAL CONSUMPTION TRENDS Graph 1. Global Consumption of Morphine, Oxycodone, Pethidine and Methadone, Kilograms Source: International Narcotics Control Board By: Pain & Policy Studies Group, University of Wisconsin/WHO Collaborating Center,
13 Graph 2. Global Consumption Fentanyl and Hydromorphone, Kilograms Source: International Narcotics Control Board By: Pain & Policy Studies Group, University of Wisconsin/WHO Collaborating Center,

14 VII. GLOBAL CONSUMPTION, 2010 Graph 3. Global Consumption of Morphine, 2010 mg/capita 152 countries **Austria s consumption includes use of morphine for substitution therapy Sources: International Narcotics Control Board; World Health Organization population data By: Pain & Policy Studies Group, University of Wisconsin/WHO Collaborating Center,
15 TABLE 3: Global Morphine Consumption, 2010: (mg/capita) Note: Countries not listed either did not report, or reported an amount of zero (0) for morphine consumption, to the INCB for Austria Cayman Islands Kenya United States of America Colombia Kuwait United Kingdom Andorra Philippines Denmark Jamaica Venezuela Canada Brunei Darussalam Montenegro Australia Trinidad and Tobago Cape Verde Switzerland Lebanon Kazakhstan Iceland Georgia Dominica France Singapore Egypt New Zealand Cuba Ecuador Slovenia Bahamas Montserrat Norway Saint Lucia United Arab Emirates Sweden Republic of Korea Madagascar Germany Cook Islands Nepal Belgium Republic of Moldova Mozambique Netherlands Thailand Algeria South Africa Macao Uzbekistan Spain Albania Syrian Arab Republic Malta Hungary Mauritius Ireland Kiribati Panama Luxembourg Malaysia Cameroon New Caledonia China Kyrgyzstan Slovakia Portugal Turkey Bulgaria Wallis and Futuna Islands Turkmenistan Poland Haiti India Mexico Bosnia and Herzegovina Azerbaijan Gibraltar Guyana Guatemala French Polynesia Ukraine Bolivia Brazil Dem. Peop. Rep. of Korea Ghana Finland Belarus Dem. Rep. of the Congo Seychelles Saudi Arabia Indonesia Czech Republic Tonga Zimbabwe Israel Oman Bangladesh Bhutan Anguilla Grenada Chile St Vincent & Grenadines Iraq Italy El Salvador Mali Costa Rica Russian Federation Chad Uruguay Viet Nam Afghanistan Estonia Nicaragua Yemen Hong Kong SAR Peru Honduras Argentina Zambia Tajikistan Namibia Serbia Togo Croatia Uganda Botswana Japan Tuvalu Benin Lithuania Armenia Eritrea Tunisia Qatar Lao Peop. Dem. Rep Mongolia Sri Lanka Myanmar Cyprus Dominican Republic Côte d'ivoire Bahrain Greece Angola Latvia Morocco Malawi Jordan United Rep of Tanzania Source: International Narcotics Control Board; World Health Organization population data Pain & Policy Studies Group University of Wisconsin Carbone Cancer Center WHO Collaborating Center 12
16 mg/capita Graph 4. Global Consumption of Fentanyl, 2010 Sri Lanka Albania Ukraine Kyrgyzstan India countries Sources: International Narcotics Control Board; World Health Organization population data By: Pain & Policy Studies Group, University of Wisconsin/WHO Collaborating Center, 2012 Bangladesh
17 TABLE 4: Global Fentanyl Consumption, 2010: (mg/capita) Note: Countries not listed either did not report, or reported an amount of zero (0) for fentanyl consumption, to the INCB for Germany Saudi Arabia Armenia Gibraltar Mauritius Kazakhstan Austria Belarus Syrian Arab Republic Canada Cyprus Trinidad and Tobago Belgium Macao Mongolia Spain Panama Kyrgyzstan Switzerland Lebanon St Vincent & Grenadines United States of America Bhutan Philippines Denmark Jordan Yemen Luxembourg Bulgaria Azerbaijan Finland Colombia India France Bahrain Indonesia Norway Venezuela Iceland Sweden Uruguay Mozambique Ireland United Arab Emirates Uzbekistan Greece Malta Tonga Netherlands Bahamas Sri Lanka United Kingdom Malaysia Grenada Australia Qatar Angola Slovenia Brunei Darussalam Botswana Hungary Tunisia Turkmenistan Czech Republic Hong Kong SAR Anguilla Cayman Islands El Salvador Zimbabwe Israel Costa Rica Côte d'ivoire Slovakia Namibia Cook Islands Italy Russian Federation Tajikistan New Caledonia Oman Mali Croatia Thailand Nepal Andorra Ecuador Togo Republic of Korea China Madagascar New Zealand Egypt Dominica Portugal Cuba Kiribati French Polynesia Mexico Iraq South Africa Peru Lao Peop. Dem. Rep Poland Albania Kenya Montenegro Georgia Saint Lucia Serbia Jamaica Guyana Lithuania Macedonia (TfYR) Bangladesh Japan Nicaragua Zambia Latvia Morocco Benin Wallis and Futuna Islands Ukraine Myanmar Republic of Palau Seychelles Chad Turkey Algeria Ghana Argentina Republic of Moldova Afghanistan Bosnia and Herzegovina Cape Verde Cameroon Estonia Honduras Haiti Chile Dominican Republic Bolivia Singapore Iran (Islamic Republic of) Dem. Rep. of the Congo Brazil Guatemala Eritrea Kuwait Viet Nam Source: International Narcotics Control Board; World Health Organization population data Pain & Policy Studies Group University of Wisconsin Carbone Cancer Center WHO Collaborating Center 14
18 Graph 5. Global Consumption of Hydromorphone, 2010 mg/capita No consumption data available for attending Fellows countries 47 countries Sources: International Narcotics Control Board; World Health Organization population data By: Pain & Policy Studies Group, University of Wisconsin/WHO Collaborating Center,
19 TABLE 5 Global Hydromorphone Consumption, 2010: (mg/capita) Note: Countries not listed either did not report, or reported an amount of zero (0) for hydromorphone consumption, to the INCB for Canada Austria United States of America Germany Denmark Switzerland Luxembourg Sweden Australia Czech Republic Belgium Slovenia Slovakia France Hungary Spain Ireland Cayman Islands Italy Serbia Kuwait New Caledonia Republic of Korea United Kingdom Iceland Finland Portugal Netherlands Norway Colombia Singapore Croatia United Arab Emirates Belarus Saudi Arabia Brazil Mexico Turkey Argentina Israel Jordan Poland Egypt China Venezuela Japan Philippines Sources: International Narcotics Control Board; World Health Organization population data Pain & Policy Studies Group University of Wisconsin Carbone Cancer Center WHO Collaborating Center 16
20 Graph 6. Global Consumption of Oxycodone, 2010 mg/capita No consumption data available for attending Fellows countries 69 countries Sources: International Narcotics Control Board; World Health Organization population data By: Pain & Policy Studies Group, University of Wisconsin/WHO Collaborating Center,
21 TABLE 6: Global Oxycodone Consumption, 2010: (mg/capita) Note: Countries not listed either did not report, or reported an amount of zero (0) for morphine consumption, to the INCB for United States of America New Caledonia Canada Bulgaria Australia Colombia Denmark Hungary Norway Singapore Sweden El Salvador Finland Argentina Germany Kuwait New Zealand Venezuela Switzerland Peru Cayman Islands Malaysia Ireland Guatemala Israel Poland United Kingdom Chile Netherlands Ecuador Iceland Costa Rica France Dominican Republic Belgium Brazil Italy Honduras Slovenia Philippines Czech Republic Jordan Austria Mexico Republic of Korea Panama Andorra China Spain Bolivia Slovakia Latvia Estonia Saudi Arabia Japan Nicaragua Cyprus French Polynesia Hong Kong SAR Qatar Gibraltar United Arab Emirates Bahamas Serbia Syrian Arab Republic Lithuania Luxembourg South Africa Croatia Source: International Narcotics Control Board; World Health Organization population data Pain & Policy Studies Group University of Wisconsin Carbone Cancer Center WHO Collaborating Center 18
22 Graph 7. Global Consumption of Pethidine, mg/capita Global mean, mg Sri Lanka Bangladesh countries Sources: International Narcotics Control Board; World Health Organization population data By: Pain & Policy Studies Group, University of Wisconsin/WHO Collaborating Center, 2012 India
23 TABLE 7: Global Pethidine Consumption, 2010 (mg/capita) Note: Countries not listed either did not report, or reported an amount of zero (0) for pethidine consumption, to the INCB for Cayman Islands Portugal Nepal Canada Brunei Darussalam Hungary Bahamas Oman Bangladesh St Vincent & Grenadines Macao Colombia Bhutan Iran (Islamic Republic of) Cuba United States of America Singapore Peru Dominica Turkey Slovenia Saint Lucia Malawi Japan Trinidad and Tobago Brazil Viet Nam Denmark Greece Tunisia Switzerland Tonga Finland New Zealand Belgium Cape Verde Jamaica El Salvador Uganda Mauritius Kiribati Togo Kuwait South Africa Latvia Bahrain Ireland Iraq Cook Islands Saudi Arabia Botswana Republic of Palau Zimbabwe Lao Peop. Dem. Rep Cyprus Kenya Indonesia Norway Qatar Philippines Czech Republic Slovakia Zambia Malta Chile France Jordan Germany French Polynesia Republic of Korea Sweden Yemen Guyana Guatemala United Republic of Tanzania Malaysia Netherlands Eritrea United Kingdom Thailand Gibraltar Israel United Arab Emirates Bosnia and Herzegovina Lebanon Tuvalu Mozambique Lithuania Iceland Costa Rica Namibia Croatia Algeria Syrian Arab Republic Andorra Bolivia Australia China India Spain Austria Ghana Grenada Argentina Honduras Poland Luxembourg Myanmar Anguilla Egypt Dem. Rep. of the Congo Montserrat Italy Chad Bulgaria Panama Angola Estonia Montenegro Cameroon Seychelles Sri Lanka Source: International Narcotics Control Board; World Health Organization population data Pain & Policy Studies Group University of Wisconsin Carbone Cancer Center WHO Collaborating Center 20
24 Graph 8. Global Consumption of Methadone, mg/capita Global mean, mg/capita Kyrgyzstan Ukraine Albania countries Sources: International Narcotics Control Board; World Health Organization population data By: Pain & Policy Studies Group, University of Wisconsin/WHO Collaborating Center, 2012 Sri Lanka
25 TABLE 8: Global Methadone Consumption, 2010: (mg/capita) Note: Countries not listed either did not report, or reported an amount of zero (0) for methadone consumption, to the INCB for Switzerland Republic of Moldova New Zealand Albania United States of America Hungary United Kingdom China Denmark Costa Rica Ireland Slovakia Canada Poland Australia Armenia Mauritius Mexico Malta Indonesia Portugal Myanmar Belgium Azerbaijan Spain Republic of Palau Netherlands Chile Luxembourg Thailand Norway Namibia Italy New Caledonia Croatia Colombia TfYR of Macedonia Brazil Israel Cayman Islands Hong Kong SAR El Salvador Malaysia Viet Nam Slovenia Saudi Arabia France French Polynesia Iran (Islamic Republic of) United Rep of Tanzania Bulgaria Saint Lucia Estonia Uruguay Germany Nepal Sweden Uzbekistan Austria Cyprus Finland Qatar Bosnia and Herzegovina Singapore Macao South Africa Montenegro Afghanistan Kyrgyzstan Venezuela Greece Guatemala Lithuania Jordan Georgia Kuwait Andorra Bahrain Serbia Japan Belarus Peru Latvia United Arab Emirates Iceland Sri Lanka Ukraine Kenya Czech Republic Morocco Sources: International Narcotics Control Board; World Health Organization population data Pain & Policy Studies Group University of Wisconsin Carbone Cancer Center WHO Collaborating Center 22

26 mg/capita VIII. Regional Consumption, 2010 Graph 9. AFRO Regional 2010 Morphine Consumption Sources: International Narcotics Control Board; World Health Organization population data By: Pain & Policy Studies Group, University of Wisconsin/WHO Collaborating Center,
27 Graph 10. AFRO Regional 2010 Fentanyl Consumption mg/capita Sources: International Narcotics Control Board; World Health Organization population data By: Pain & Policy Studies Group, University of Wisconsin/WHO Collaborating Center,
28 Graph 11. AFRO Regional 2010 Hydromorphone Consumption mg/capita Sources: International Narcotics Control Board; World Health Organization population data By: Pain & Policy Studies Group, University of Wisconsin/WHO Collaborating Center,

29 Graph 12. AFRO Regional 2010 Oxycodone Consumption mg/capita Sources: International Narcotics Control Board; World Health Organization population data By: Pain & Policy Studies Group, University of Wisconsin/WHO Collaborating Center,
30 Graph 13. AFRO Regional 2010 Pethidine Consumption mg/capita Sources: International Narcotics Control Board; World Health Organization population data By: Pain & Policy Studies Group, University of Wisconsin/WHO Collaborating Center,
31 Graph 14. AFRO Regional 2010 Methadone Consumption mg/capita Mauritius Sources: International Narcotics Control Board; World Health Organization population data By: Pain & Policy Studies Group, University of Wisconsin/WHO Collaborating Center,

32 Graph 15. AMRO Regional 2010 Morphine Consumption mg/capita Sources: International Narcotics Control Board; World Health Organization population data By: Pain & Policy Studies Group, University of Wisconsin/WHO Collaborating Center,
33 Graph 16. AMRO Regional 2010 Fentanyl Consumption mg/capita Canada USA Sources: International Narcotics Control Board; World Health Organization population data By: Pain & Policy Studies Group, University of Wisconsin/WHO Collaborating Center,


34 Graph 17. AMRO Regional 2010 Hydromorphone Consumption mg/capita Sources: International Narcotics Control Board; World Health Organization population data By: Pain & Policy Studies Group, University of Wisconsin/WHO Collaborating Center,

35 Graph 18. AMRO Regional 2010 Oxycodone Consumption mg/capita Canada Sources: International Narcotics Control Board; World Health Organization population data By: Pain & Policy Studies Group, University of Wisconsin/WHO Collaborating Center,

36 Graph 19. AMRO Regional 2010 Pethidine Consumption mg/capita Canada Sources: International Narcotics Control Board; World Health Organization population data By: Pain & Policy Studies Group, University of Wisconsin/WHO Collaborating Center,
37 Graph 20. AMRO Regional 2010 Methadone Consumption mg/capita Canada Sources: International Narcotics Control Board; World Health Organization population data By: Pain & Policy Studies Group, University of Wisconsin/WHO Collaborating Center,

38 Graph 21. EMRO Regional 2010 Morphine Consumption mg/capita Sources: International Narcotics Control Board; World Health Organization population data By: Pain & Policy Studies Group, University of Wisconsin/WHO Collaborating Center,

39 Graph 22. EMRO Regional 2010 Fentanyl Consumption mg/capita Sources: International Narcotics Control Board; World Health Organization population data By: Pain & Policy Studies Group, University of Wisconsin/WHO Collaborating Center,
40 Graph 23. EMRO Regional 2010 Hydromorphone Consumption mg/capita Sources: International Narcotics Control Board; World Health Organization population data By: Pain & Policy Studies Group, University of Wisconsin/WHO Collaborating Center,

41 Graph 24. EMRO Regional 2010 Oxycodone Consumption mg/capita Sources: International Narcotics Control Board; World Health Organization population data By: Pain & Policy Studies Group, University of Wisconsin/WHO Collaborating Center,
42 Graph 25. EMRO Regional 2010 Pethidine Consumption mg/capita Sources: International Narcotics Control Board; World Health Organization population data By: Pain & Policy Studies Group, University of Wisconsin/WHO Collaborating Center,

43 Graph 26. EMRO Regional 2010 Methadone Consumption mg/capita Iran Sources: International Narcotics Control Board; World Health Organization population data By: Pain & Policy Studies Group, University of Wisconsin/WHO Collaborating Center,

44 Graph 27. EURO Regional 2010 Morphine Consumption mg/capita **Austria includes data for substitution therapy Sources: International Narcotics Control Board; World Health Organization population data By: Pain & Policy Studies Group, University of Wisconsin/WHO Collaborating Center,
45 Graph 28. EURO Regional 2010 Fentanyl Consumption mg/capita Sources: International Narcotics Control Board; World Health Organization population data By: Pain & Policy Studies Group, University of Wisconsin/WHO Collaborating Center,

46 Graph 29. EURO Regional 2010 Hydromorphone Consumption mg/capita Sources: International Narcotics Control Board; World Health Organization population data By: Pain & Policy Studies Group, University of Wisconsin/WHO Collaborating Center,
47 Graph 30. EURO Regional 2010 Oxycodone Consumption mg/capita Sources: International Narcotics Control Board; World Health Organization population data By: Pain & Policy Studies Group, University of Wisconsin/WHO Collaborating Center,

48 Graph 31. EURO Regional 2010 Pethidine Consumption mg/capita Sources: International Narcotics Control Board; World Health Organization population data By: Pain & Policy Studies Group, University of Wisconsin/WHO Collaborating Center,

49 Graph 32. EURO Regional 2010 Methadone Consumption mg/capita Sources: International Narcotics Control Board; World Health Organization population data By: Pain & Policy Studies Group, University of Wisconsin/WHO Collaborating Center,

50 Graph 33. SEARO Regional 2010 Morphine Consumption mg/capita Sources: International Narcotics Control Board; World Health Organization population data By: Pain & Policy Studies Group, University of Wisconsin/WHO Collaborating Center,

51 Graph 34. SEARO Regional 2010 Fentanyl Consumption mg/capita Sources: International Narcotics Control Board; World Health Organization population data By: Pain & Policy Studies Group, University of Wisconsin/WHO Collaborating Center,
52 Graph 35. SEARO Regional 2010 Hydromorphone Consumption mg/capita Sources: International Narcotics Control Board; World Health Organization population data By: Pain & Policy Studies Group, University of Wisconsin/WHO Collaborating Center,
53 Graph 36. SEARO Regional 2010 Oxycodone Consumption mg/capita Sources: International Narcotics Control Board; World Health Organization population data By: Pain & Policy Studies Group, University of Wisconsin/WHO Collaborating Center,

54 Graph 37. SEARO Regional 2010 Pethidine Consumption mg/capita Sources: International Narcotics Control Board; World Health Organization population data By: Pain & Policy Studies Group, University of Wisconsin/WHO Collaborating Center,

55 Graph 38. SEARO Regional 2010 Methadone Consumption mg/capita Sources: International Narcotics Control Board; World Health Organization population data By: Pain & Policy Studies Group, University of Wisconsin/WHO Collaborating Center,


56 Graph 39. WPRO Regional 2010 Morphine Consumption mg/capita Sources: International Narcotics Control Board; World Health Organization population data By: Pain & Policy Studies Group, University of Wisconsin/WHO Collaborating Center,

57 Graph 40. WPRO Regional 2010 Fentanyl Consumption mg/capita Sources: International Narcotics Control Board; World Health Organization population data By: Pain & Policy Studies Group, University of Wisconsin/WHO Collaborating Center,
58 Graph 41. WPRO Regional 2010 Hydromorphone Consumption mg/capita Sources: International Narcotics Control Board; World Health Organization population data By: Pain & Policy Studies Group, University of Wisconsin/WHO Collaborating Center,

59 Graph 42. WPRO Regional 2010 Oxycodone Consumption mg/capita Sources: International Narcotics Control Board; World Health Organization population data By: Pain & Policy Studies Group, University of Wisconsin/WHO Collaborating Center,
60 Graph 43. WPRO Regional 2010 Pethidine Consumption mg/capita Sources: International Narcotics Control Board; World Health Organization population data By: Pain & Policy Studies Group, University of Wisconsin/WHO Collaborating Center,

61 Graph 44. WPRO Regional 2010 Methadone Consumption mg/capita New Zealand Sources: International Narcotics Control Board; World Health Organization population data By: Pain & Policy Studies Group, University of Wisconsin/WHO Collaborating Center,

62 IX. NATIONAL CONSUMPTION TRENDS,
63 60
64 61
65 62
66 63
67 64
68 65
69 66
70 67
71 68
72 69
73 70
74 71
75 72
76 73
77 74
78 75
79 76
80 X. MORPHINE EQUIVALENCE: GLOBAL AND NATIONAL TRENDS, Graph 81. Morphine Equivalence Global Consumption, (ME), Mg/person 70 Fentanyl ME 60 Hydromorphone ME Methadone ME Morphine ME 50 Oxycodone ME Pethidine ME Total ME Data sources: Consumption data - International Narcotics Control Board; Population United Nations World Population Prospects, 2010 Revision; ME conversion factors WHOCC Centre for Drug Statistics Methodology Pain & Policy Studies Group University of Wisconsin Carbone Cancer Center WHO Collaborating Center 77
81 TABLE 9: GLOBAL Opioid Consumption in Morphine Equivalence (ME), Mg per person Fentanyl ME Hydromorphone ME Methadone ME Morphine ME Oxycodone ME Pethidine ME Total ME Data sources: Consumption data International Narcotics Control Board Population United Nations World Population Prospects, 2010 Revision ME conversion factors WHOCC Centre for Drug Statistics Methodology Pain & Policy Studies Group University of Wisconsin Carbone Cancer Center WHO Collaborating Center 78
Drug Prices Report Opioids Retail and wholesale prices * and purity levels,by drug, region and country or territory (prices expressed in US$ )
") 1 / 11 Region/Subregion/ Country Africa Eastern Africa Kenya Madagascar Mauritius Uganda United Republic of Tanzania Northern Africa Algeria Egypt Libya Morocco Sudan Southern Africa Botswana Burkina Faso
1 / 11 Region/Subregion/ Country Africa Eastern Africa Kenya Madagascar Mauritius Uganda United Republic of Tanzania Northern Africa Algeria Egypt Libya Morocco Sudan Southern Africa Botswana Burkina Faso
APPENDIX II - TABLE 2.3 ANTI-TOBACCO MASS MEDIA CAMPAIGNS
 WHO REPORT ON THE GLOBAL TOBACCO EPIDEMIC, 2011 APPENDIX II - TABLE 2.3 ANTI-TOBACCO MASS MEDIA CAMPAIGNS (SEE TABLE 4.9) Africa The Americas South-East Asia Europe Eastern Mediterranean Western Pacific
מדינת ישראל. Tourist Visa Table
 Updated 23/05/2017 מדינת ישראל Tourist Visa Table Tourist visa exemption is applied to national and official passports only, and not to other travel documents. Exe = exempted Req = required Press the first
World Health organization/ International Society of Hypertension (WH0/ISH) risk prediction charts
 risk prediction charts") World Health organization/ International Society of Hypertension (WH0/ISH) risk prediction charts (charts in colour) (These charts will be updated in 2014) 2 1. Introduction 2. Instructions on how to use
World Health organization/ International Society of Hypertension (WH0/ISH) risk prediction charts (charts in colour) (These charts will be updated in 2014) 2 1. Introduction 2. Instructions on how to use
מדינת ישראל. Tourist Visa Table. Tourist visa exemption is applied to national and official passports only, and not to other travel documents.
 Updated 25/05/2015 ישראל Tourist Visa Table Tourist visa exemption is applied to national and official passports only, and not to other travel documents. (C) Bearers of official passports requiring tourist
CALLING ABROAD PRICES FOR EE SMALL BUSINESS PLANS
 CALLING ABROAD PRICES FOR EE SMALL BUSINESS PLANS More information about out-of-bundle charges for our small business customers calling internationally from the UK using a small business price plan Page
3.5 Consumption Annual Prevalence Opiates
 3.5 Consumption 3.5.1 Annual Prevalence 3.5.1.1 Opiates EUROPE Western and Central Europe OPIATES AMERICA Central America Estonia, 2004 1.5 Panama** 0.2 Luxembourg, 2000 0.9 Honduras*, 2005 0.2 Latvia,
THE CARE WE PROMISE FACTS AND FIGURES 2017
 THE CARE WE PROMISE FACTS AND FIGURES 2017 2 SOS CHILDREN S VILLAGES INTERNATIONAL WHERE WE WORK Facts and Figures 2017 205 58 79 families and transit 31 Foster homes 162 8 3 173 214 2 115 159 136 148
Main developments in past 24 hours
 ECDC DAILY UPDATE Pandemic (H1N1) 2009 Update 02 October 2009, 09:00 hours CEST Main developments in past 24 hours Weekly Influenza Surveillance Overview to be published today; Media highlights and Eurosurveillance
Current State of Global HIV Care Continua. Reuben Granich 1, Somya Gupta 1, Irene Hall 2, John Aberle-Grasse 2, Shannon Hader 2, Jonathan Mermin 2
 Current State of Global HIV Care Continua Reuben Granich 1, Somya Gupta 1, Irene Hall 2, John Aberle-Grasse 2, Shannon Hader 2, Jonathan Mermin 2 1) International Association of Providers of AIDS Care
FRAMEWORK CONVENTION ALLIANCE BUILDING SUPPORT FOR TOBACCO CONTROL. Smoke-free. International Status Report
 FRAMEWORK CONVENTION ALLIANCE BUILDING SUPPORT FOR TOBACCO CONTROL Smoke-free Environments International Status Report As December, 00 Smoke-free environments are a vital part combating the global tobacco
Eligibility List 2018
 The Global Fund s 2017-2022 strategy and allocation-based approach enables strategic investment to accelerate the end of HIV/AIDS, tuberculosis and malaria and build resilient and sustainable systems for
ADMINISTRATIVE AND FINANCIAL MATTERS. Note by the Executive Secretary * CONTENTS. Explanatory notes Tables. 1. Core budget
 UNITED NATIONS Distr. GENERAL 13 October 1997 ENGLISH ONLY SUBSIDIARY BODY FOR IMPLEMENTATION Seventh session Bonn, 20-29 October 1997 Item 9 of the provisional agenda ADMINISTRATIVE AND FINANCIAL MATTERS
Maternal Deaths Disproportionately High in Developing Countries
 EMBARGOED until Monday, 20 October, 6am GMT HQ/2003/24 20 October 2003 CF/DOC/PR/2003-82 Maternal Deaths Disproportionately High in Developing Countries African women are 175 times more likely to die in
Supplementary appendix
 Supplementary appendix This appendix formed part of the original submission and has been peer reviewed. We post it as supplied by the authors. Supplement to: Liyanage T, Ninomiya T, Jha V, et al. Worldwide
Annual prevalence estimates of cannabis use in the late 1990s
 Cocaine abuse in most east European countries, by contrast, is still far less widespread and less of a problem. A majority of countries in eastern Europe either did not report on cocaine at all, or they
Hearing loss in persons 65 years and older based on WHO global estimates on prevalence of hearing loss
 Hearing loss in persons 65 years and older based on WHO global estimates on prevalence of hearing loss Mortality and Burden of Diseases and Prevention of Blindness and Deafness WHO, 2012 In 2012, WHO released
Global EHS Resource Center
 Global EHS Resource Center Understand environmental and workplace safety requirements that affect your global operations. 800.372.1033 bna.com/gelw Global EHS Resource Center This comprehensive research
Terms and Conditions. VISA Global Customer Assistance Services
 Terms and Conditions VISA Global Customer Assistance Services Visa Global Customer Assistance Services (VGCAS) 1 The Visa Global Customer Assistance Services are co-ordinated by the Global Assistance Centre
Analysis of Immunization Financing Indicators from the WHO-UNICEF Joint Reporting Form (JRF),
,") Analysis of Immunization Financing Indicators from the WHO-UNICEF Joint Reporting Form (JRF), 2008-2010 Claudio Politi and Oumar Sagna Department of Immunization Vaccines and Biologicals, World Health
Analysis of Immunization Financing Indicators from the WHO-UNICEF Joint Reporting Form (JRF), 2008-2010 Claudio Politi and Oumar Sagna Department of Immunization Vaccines and Biologicals, World Health
WHO report highlights violence against women as a global health problem of epidemic proportions
 News release WHO/16 20 June 2013 EMBARGO: PLEASE DO NOT DISTRIBUTE OR PUBLISH BEFORE THURSDAY 20 JUNE 2013 AT 15H00 GENEVA TIME, 14H00 LONDON TIME, 13H00 GMT, AND 09H00 EST WHO report highlights violence
CND UNGASS FOLLOW UP
 CND UNGASS FOLLOW UP INCB follow-up activities on Chapter 2. Operational recommendations on ensuring the availability of and access to controlled substances exclusively for medical and scientific purposes,
Tobacco: World Markets and Trade
 United States Department of Agriculture Foreign Agricultural Service Circular Series FT -09-05 Sep. 2005 List of Tables Tobacco: World Markets and Trade Table 2 U.S. Tobacco Trade: 2004-2005 Table 3 Unmanufactured
ICM: Trade-offs in the fight against HIV/AIDS
 ICM: Trade-offs in the fight against HIV/AIDS 1 As the HIV/AIDS pandemic enters its 25 th year, both the number of infections and number of deaths due to the disease continue to rise. Despite an enormous
TOBACCO USE PREVALENCE APPENDIX II: The following definitions are used in Table 2.1 and Table 2.3:
 APPENDIX II: TOBACCO USE PREVALENCE Tables 2.1 to 2.4 show country-reported data on tobacco use prevalence among adults and youth, as well as countryreported data on smokeless tobacco use prevalence among
Copyright 2011 Joint United Nations Programme on HIV/AIDS (UNAIDS) All rights reserved
 All rights reserved") UNAIDS DATA TABLES 2011 Copyright 2011 Joint United Nations Programme on HIV/AIDS (UNAIDS) All rights reserved UNAIDS / JC2225E The designations employed and the presentation of the material in this publication
UNAIDS DATA TABLES 2011 Copyright 2011 Joint United Nations Programme on HIV/AIDS (UNAIDS) All rights reserved UNAIDS / JC2225E The designations employed and the presentation of the material in this publication
GLOBAL RepORt UNAIDS RepoRt on the global AIDS epidemic
 GLOBAL Report UNAIDS Report on the global AIDS epidemic 2012 Copyright 2012 Joint United Nations Programme on HIV/AIDS (UNAIDS) All rights reserved The designations employed and the presentation of the
ANNEX 3: Country progress indicators
 : progress indicators 541 : COUNTRY PROGRESS INDICATORS 2006 REPORT ON THE GLOBAL AIDS EPIDEMIC Annex 3 : COUNTRY PROGRESS INDICATORS As of March 2006, 115 countries had reported indicators on progress
AGaRT The Advisory Group on increasing access to Radiotherapy Technology in low and middle income countries
 AGaRT The Advisory Group on increasing access to Radiotherapy Technology in low and middle income countries Together against Cancer The Advisory Group on Increasing Access to Radiotherapy To address the
Seizures of ATS (excluding ecstasy ), 2010
, 2010") Seizures of ATS (excluding ecstasy ), 2010 (countries and territories reporting seizures* of more than 10 kg) 9 5.1 8.7 12.9 Ghana Armenia 0.7 9.9 1 2.1 Syrian Arab Republic Korea (Republic of) Iraq Islamic
Seizures of ATS (excluding ecstasy ), 2010 (countries and territories reporting seizures* of more than 10 kg) 9 5.1 8.7 12.9 Ghana Armenia 0.7 9.9 1 2.1 Syrian Arab Republic Korea (Republic of) Iraq Islamic
WELLNESS COACHING. Wellness & Personal Fitness Solution Providers
 WELLNESS COACHING Wellness & Personal Fitness Solution Providers Introducing Ourselves... We are Personal Wellness Coaches 2 We help people look and feel better by: - Educating on proper nutrition (80%)
1. Consent for Treatment This form must be completed in order to receive healthcare services in the campus clinic.
 HEALTH & WELLNESS SERVICES INSTRUCTIONS FOR COMPLETING THE REQUIRED MEDICAL FORMS FOR: U.S. CITIZENS 18 YEARS OF AGE OR OLDER AT THE TIME THE FORMS ARE COMPLETED. THIS REQUIREMENT MUST BE COMPLETED WHETHER:
Undetectable = Untransmittable. Mariah Wilberg Communications Specialist
 Undetectable = Untransmittable Mariah Wilberg Communications Specialist Undetectable=Untransmittable PLWH who get and stay undetectable have effectively no risk of transmitting HIV to their sex partners
Alcohol-related harm in Europe and the WHO policy response
 Alcohol-related harm in Europe and the WHO policy response Lars Moller Programme Manager World Health Organization Regional Office for Europe Date of presentation NCD global monitoring framework: alcohol-related
STAT/SOC/CSSS 221 Statistical Concepts and Methods for the Social Sciences. Introduction to Mulitple Regression
 STAT/SOC/CSSS 1 Statistical Concepts and Methods for the Social Sciences Introduction to Mulitple Regression Christopher Adolph Department of Political Science and Center for Statistics and the Social
World Health Organization Department of Communicable Disease Surveillance and Response
 WHO/CDS/CSR/ISR/2000.1 WHO Report on Global Surveillance of Epidemic-prone Infectious Diseases World Health Organization Department of Communicable Disease Surveillance and Response This document has been
BCG. and your baby. Immunisation. Protecting babies against TB. the safest way to protect your child
 BCG and your baby Protecting babies against TB Immunisation the safest way to protect your child This leaflet is about the BCG (Bacillus Calmette-Guerin) vaccination that is being offered to protect your
STUDENT HEALTH SERVICES NEW STUDENT QUESTIONNAIRE
 STUDENT HEALTH SERVICES NEW STUDENT QUESTIONNAIRE UC Hastings Student Health Services (SHS) is committed to providing you the best possible medical care, so we need to know about your medical history and
World Connections Committee (WCC) Report
 Report") World Connections Committee (WCC) Report 06 Co-Dependents Anonymous Service Conference Countries Where CoDA Exists This report reflects the World Connections Committee (WCC) support of the growth and development
World Connections Committee (WCC) Report 06 Co-Dependents Anonymous Service Conference Countries Where CoDA Exists This report reflects the World Connections Committee (WCC) support of the growth and development
WHO Global Status Report on Alcohol 2004
 ! Drinking patterns The consumption of alcoholic beverages can be studied from a number of viewpoints, ranging from the viewpoint of an economist to that of a cultural anthropologist. When viewed from
Annex 2 A. Regional profile: West Africa
 Annex 2 A. Regional profile: West Africa 355 million people at risk for malaria in 215 297 million at high risk A. Parasite prevalence, 215 Funding for malaria increased from US$ 233 million to US$ 262
Calls from home residential tariffs
 These price lists include call charges at the old VAT rate of 17.5%. From 1st December, all of your calls will be billed at the lower VAT rate of 15%, and we ll update these lists to the new rates as soon
The IB Diploma Programme Statistical Bulletin. November 2015 Examination Session. Education for a better world
 The IB Diploma Programme Statistical Bulletin November 2015 Examination Session Education for a better world TheIBDiplomaProgrammeStatisticalBuletin,November2015ExaminationSession. InternationalBaccalaureate
Country Length Discount Travel Period Anguilla All 20% off 08/24/11 12/15/11 Antigua All 20% off 08/24/11 12/15/11 Argentina All 20% off 08/24/11
 Country Length Discount Travel Period Anguilla All 20% off 08/24/11 12/15/11 Antigua All 20% off 08/24/11 12/15/11 Argentina All 20% off 08/24/11 12/15/11 Aruba All 20% off 08/24/11 12/15/11 Australia
Fellowships in nuclear science and technology: Applying the knowledge
 Fellowships in nuclear science and technology: Applying the knowledge Nearly 1200 scientists, engineers, and specialists receive training each year under IAEA-supported fellowships and scientific visits
ACCESS 7. TOWARDS UNIVERSAL ACCESS: THE WAY FORWARD
 ACCESS 7. TOWARDS UNIVERSAL ACCESS: THE WAY FORWARD The year 2008 witnessed sustained progress in expanding access to HIV prevention, treatment and care services in low- and middle-income countries. With
Why Invest in Nutrition?
 Why Invest in Nutrition? Meera Shekar Human Development Network World Bank 2006 Three key Issues Why reducing malnutrition is essential to poverty reduction? Is malnutrition a BIG problem? How can we improve
Articles. Funding Bill & Melinda Gates Foundation.
 Global, regional, and national burden of traumatic brain injury and spinal cord injury, : a systematic analysis for the Global Burden of Disease Study 2016 GBD 2016 Traumatic Brain Injury and Spinal Cord
ESPEN Congress Geneva 2014 FOOD: THE FACTOR RESHAPING THE SIZE OF THE PLANET
 ESPEN Congress Geneva 2014 FOOD: THE FACTOR RESHAPING THE SIZE OF THE PLANET Buy 2 and take 3: are we benefitting from cheaper food? P. Marques-Vidal (CH) Pedro Marques-Vidal Department of Internal Medicine
#1 #2 OR Immunity verified by immune titer (please attach report) * No titer needed if proof of two doses of Varicella provided
 * No titer needed if proof of two doses of Varicella provided") Student Information: Date of Birth: There are two ways to provide us with your immunization information. 1) Students can have their healthcare provider fill out and sign the form below. A healthcare provider
Student Information: Date of Birth: There are two ways to provide us with your immunization information. 1) Students can have their healthcare provider fill out and sign the form below. A healthcare provider
Tipping the dependency
 BREAKING NEWS Meeting the investment challenge Tipping the dependency balance Domestic investments exceed international investments total reaching US$ 8.6 billion. 40 countries fund more than 70% of their
WELLNESS COACHING. Wellness & Personal Fitness Solution Providers NZ & Australia
 WELLNESS COACHING Wellness & Personal Fitness Solution Providers NZ & Australia Introducing Ourselves... We are Personal Wellness Coaches 2 We help people look and feel better by: - Educating on proper
we are daisy Daisy Conferencing Max Bridge charges* International charges* International toll-free access levy
 Daisy Conferencing Max Daisy Conferencing offers three tailored solutions to meet your business requirements. Create simple audio calls on demand with Reservationless Conferencing, audio-visual web conferences
Global Measles and Rubella Update November 2018
 Global Measles and Rubella Update November 218 Measles Number of Reported Measles by WHO Regions 218 Region Member States* Suspected cases Measles cases Clin Epi Lab Jan Feb Mar Apr May Jun Jul Aug Sep
FORMS MUST BE COMPLETED PRIOR TO THE START OF YOUR FIRST SEMESTER
 HEALTH & WELLNESS SERVICES INSTRUCTIONS FOR COMPLETING THE REQUIRED MEDICAL FORMS FOR: U.S. CITIZENS WHO ARE NOT 18 YEARS OF AGE AT THE TIME THE FORMS ARE COMPLETED. THIS REQUIREMENT MUST BE COMPLETED
Copyright 2010 Joint United Nations Programme on HIV/AIDS (UNAIDS) All rights reserved
 All rights reserved") OVERVIEW: UNAIDS REPORT ON THE GLOBAL AIDS EPIDEMIC 2010 Copyright 2010 Joint United Nations Programme on HIV/AIDS (UNAIDS) All rights reserved The designations employed and the presentation of the material
OVERVIEW: UNAIDS REPORT ON THE GLOBAL AIDS EPIDEMIC 2010 Copyright 2010 Joint United Nations Programme on HIV/AIDS (UNAIDS) All rights reserved The designations employed and the presentation of the material
Stakeholders consultation on strengthened cooperation against vaccine preventable diseases
 Stakeholders consultation on strengthened cooperation against vaccine preventable diseases Fields marked with * are mandatory. General Context This questionnaire is a working document prepared by the European
Recommended composition of influenza virus vaccines for use in the 2007 influenza season
 Recommended composition of influenza virus vaccines for use in the 2007 influenza season September 2006 This recommendation relates to the composition of vaccines for the forthcoming winter in the southern
Global Measles and Rubella Update. April 2018
 Global Measles and Rubella Update April 218 Measles Number of Reported Measles by WHO Regions 218 Region Member States* Suspected cases Measles cases Clin Epi Lab Jan Feb Mar Apr May Jun Jul Aug Sep Oct
This portion to be completed by the student Return by July 1 Please use ballpoint pen
 This portion to be completed by the student Return by July 1 Please use ballpoint pen Start term: Fall Exploration Spring Summer Year: Class year: Freshman Sophomore Junior Senior Transfer Full name: Preferred:
Certificate of Immunization
 Certificate of Immunization Required of all students (Page 1 of 5) QUESTIONS? 440-775-8180 or student.health@oberlin.edu (e-mail preferred) RETURN TO: Oberlin College Student Health Services 247 W. Lorain
CIGARETTE PACKAGE HEALTH WARNINGS
 OCTOBER 2012 CIGARETTE PACKAGE HEALTH WARNINGS INTERNATIONAL STATUS REPORT THIRD EDITION LARGER, PICTURE HEALTH WARNINGS: THE GROWING WORLDWIDE TREND This report Cigarette Package Health Warnings: International
Appendix F. The Test-Curriculum Matching Analysis Science TIMSS 2011 INTERNATIONAL RESULTS IN SCIENCE APPENDIX F 479
 Appendix F The Test-Curriculum Matching Analysis Science TIMSS 2011 INTERNATIONAL RESULTS IN SCIENCE APPENDIX F 479 TIMSS went to great lengths to ensure that comparisons of student achievement across
WORLD COUNCIL OF CREDIT UNIONS 2017 STATISTICAL REPORT
 WORLD COUNCIL OF CREDIT UNIONS 2017 STATISTICAL REPORT THE GLOBAL NET WORK OF CREDIT UNIONS AND FINANCIAL COOPERATIVES MEMBERSHIP AT A GLANCE World Council builds, champions, defends and grows a global
Country-wise and Item-wise Exports of Animal By Products Value Rs. Lakh Quantity in '000 Unit: Kgs Source: MoC Export Import Data Bank
 Country-wise and Item-wise Exports of Animal By Products Value Rs. Lakh Quantity in '000 Unit: Kgs Source: MoC Export Import Data Bank Country CAPEXIL Description HS Code Value 2010-2011 Quantity 2010-2011
Outcomes of the Global Consultation Interim diagnostic algorithms and Operational considerations
 Outcomes of the Global Consultation Interim diagnostic algorithms and Operational considerations Briefing on Xpert MTB/RIF. Geneva, 21 February, 2011 Fuad Mirzayev TB Laboratory Strengthening and Diagnostics
B. Availability of opioid analgesics
 Chapter II. Narcotic drugs 11 and opiate raw materials will also continue to rise. Figure 4 presents the global level of consumption of opiates and synthetic opioids, including buprenorphine and pentazocine,
REQUIRED COLLEGIATE START. (High school students/ early entry only not for undergraduates) IMMUNIZATION FORM THIS IS REQUIRED INFORMATION
 IMMUNIZATION FORM THIS IS REQUIRED INFORMATION") REQUIRED COLLEGIATE START (High school students/ early entry only not for undergraduates) IMMUNIZATION FORM THIS IS REQUIRED INFORMATION Complete this form and return by July 1 st to: STUDENT HEALTH SERVICES
REQUIRED COLLEGIATE START (High school students/ early entry only not for undergraduates) IMMUNIZATION FORM THIS IS REQUIRED INFORMATION Complete this form and return by July 1 st to: STUDENT HEALTH SERVICES
Epidemiological Estimates for Haemoglobin Disorders: WHO South East Asian Region by Country
 Epidemiological Estimates for Haemoglobin Disorders: WHO South East Asian Region by Comprising the following charts and tables: Chart 1: Population Chart 2: Annual births Chart 3: Crude birth rate and
PROMOTION AND PROTECTION OF ALL HUMAN RIGHTS, CIVIL, POLITICAL, ECONOMIC, SOCIAL AND CULTURAL RIGHTS, INCLUDING THE RIGHT TO DEVELOPMENT
 UNITED NATIONS A General Assembly Distr. LIMITED A/HRC/11/L.16 16 June 2009 Original: ENGLISH HUMAN RIGHTS COUNCIL Eleventh session Agenda item 3 PROMOTION AND PROTECTION OF ALL HUMAN RIGHTS, CIVIL, POLITICAL,
The worldwide societal costs of dementia: Estimates for 2009
 Alzheimer s & Dementia 6 (2010) 98 103 The worldwide societal costs of dementia: Estimates for 2009 Anders Wimo a, *, Bengt Winblad a, Linus Jönsson b a KI-Alzheimer s Disease Research Center, Department
UNAIDS 2017 REFERENCE UNAIDS DATA 2017
 UNAIDS 2017 REFERENCE UNAIDS DATA 2017 Copyright: 2017 Joint United Nations Programme on HIV/AIDS (UNAIDS) All rights reserved. The designations employed and the presentation of the material in this publication
UNAIDS 2017 REFERENCE UNAIDS DATA 2017
 UNAIDS 2017 REFERENCE UNAIDS DATA 2017 Copyright: 2017 Joint United Nations Programme on HIV/AIDS (UNAIDS) All rights reserved. The designations employed and the presentation of the material in this publication
CIGARETTE PACKAGE HEALTH WARNINGS
 SEPTEMBER 2014 CIGARETTE PACKAGE HEALTH WARNINGS INTERNATIONAL STATUS REPORT FOURTH EDITION LARGER, PICTURE HEALTH WARNINGS: THE GROWING WORLDWIDE TREND This report Cigarette Package Health Warnings: International
Social Capital Achievement: 2009 Country Rankings
 Social Capital Achievement: 2009 Country Rankings By Stephen B. Young and Josiah Lindstrom The Caux Round Table recognizes that economic development does not occur independently from social, cultural and
UNAIDS 2017 REFERENCE UNAIDS DATA 2017
 UNAIDS 2017 REFERENCE UNAIDS DATA 2017 Copyright: 2017 Joint United Nations Programme on HIV/AIDS (UNAIDS) All rights reserved. The designations employed and the presentation of the material in this publication
FACTS AND FIGURES 2015 OUR VILLAGE
 FACTS AND FIGURES 2015 OUR VILLAGE FOREWORD WHAT WE DO OUR WORK IN 2015 SOS Children s Villages communities provide a range of services in care, education, health and emergency response, depending on local
Challenges and Opportunities to Optimizing the HIV Care Continuum Can We Test and Treat Enough People to Make a Seismic Difference by 2030?
 Challenges and Opportunities to Optimizing the HIV Care Continuum Can We Test and Treat Enough People to Make a Seismic Difference by 2030? Reuben Granich, MD, MPH Strategic and Scientific Advisor International
European status report on alcohol and health Leadership, awareness and commitment
 European status report on alcohol and health 2014 Leadership, awareness and commitment Leadership, awareness and commitment Background Strong leadership from national and local governments is essential
UNDERGRADUATE STUDENT HEALTH PACKET
 UNDERGRADUATE STUDENT HEALTH PACKET Deadlines: Fall: July 15 th Spring: December 1st Enclosed Forms/Documents: Type of Students Required For: Comments: Undergraduate Vaccine Form Physical Examination Form
Global and regional burden of first-ever ischaemic and haemorrhagic stroke during : findings from the Global Burden of Disease Study 2010
 Global and regional burden of first-ever ischaemic and haemorrhagic stroke during 1990 2010: findings from the Global Burden of Disease Study 2010 Rita V Krishnamurthi, Valery L Feigin, Mohammad H Forouzanfar,
NON-STANDARD PRICE GUIDE FOR EE SMALL BUSINESS More information about out-of-bundle charges for our small business customers
 NON-STANDARD PRICE GUIDE FOR EE SMALL BUSINESS More information about out-of-bundle charges for our small business customers B2BLegal1204 Non-Standard Price Guide for EE Small Business EXT Document v2.8
Student Health Center Mandatory Immunization Information
 2009-2010 Mandatory Immunization Information The District of Columbia Immunization Law requires that all students, under age 26 (except for students who meet statutory requirements for exemption based
European Status report on Alcohol and Health
 European Status report on Alcohol and Health Dr Lars Moller Regional Advisor a.i. WHO Regional Office for Europe Main killers in the WHO European Region Source: Preventing chronic diseases. A vital investment.
The Test-Curriculum Matching Analysis: Science
 Appendix C The Test-Curriculum Matching Analysis: Science TIMSS went to great lengths to ensure that comparisons of student achievement across countries would be as fair and equitable as possible. The
Recommended composition of influenza virus vaccines for use in the 2009 southern hemisphere influenza season
 Recommended composition of influenza virus vaccines for use in the 2009 southern hemisphere influenza season The World Health Organization (WHO) convenes technical meetings 1 in February and September
Donor Support for Contraceptives and Condoms for STI/HIV Prevention
 Donor Support for Contraceptives and Condoms for STI/HIV Prevention 2001 Donor Support for Contraceptives and Condoms for STI/HIV Prevention 2001 Table of Contents List of Abbreviations and Acronyms List
I. THE TRANSITION TO LOW FERTILITY AND ITS IMPLICATIONS FOR THE FUTURE
 I. THE TRANSITION TO LOW FERTILITY AND ITS IMPLICATIONS FOR THE FUTURE The 2000 Revision takes account of the fact that the fertility transition, the long-term decline of fertility from a high average
Epidemiological Estimates for Haemoglobin Disorders: The World by WHO Region
 Epidemiological Estimates for Haemoglobin Disorders: The World by WHO Comprising the following charts and tables: Chart 1: Population Chart 2: Annual births Chart 3: Crude birth rate and infant mortality
Pharmaceutical, Medical and Health-related Government and Regulatory bodies around the world.
 1 International International Conference on Harmonization (ICH) World Health Organization (WHO) 2 Argentina National Administration of Drugs, Food and medical Technology. Australia s Department of health
Prices. Peru, potential cocaine production (mt), 1994 to Peru, monthly farm-gate prices of sun-dried coca leaf and coca paste (US$/kg)
, 1994 to Peru, monthly farm-gate prices of sun-dried coca leaf and coca paste (US$/kg)") World Drug Report 2009 Metric tons Peru, potential cocaine production (mt), 1994 to 2008 Sources: US Dept. of State (1994-1999), National monitoring system supported by UNODC (since 2000) based on conversion
World Drug Report 2009 Metric tons Peru, potential cocaine production (mt), 1994 to 2008 Sources: US Dept. of State (1994-1999), National monitoring system supported by UNODC (since 2000) based on conversion
SUBMITTING THE MANDATORY IMMUNIZATION FORM
 2018-2019 Mandatory Immunization Information Please read these instructions carefully. District of Columbia immunization requirements differ from other states and countries. Even though you may have met
Malnutrition prevalences by country and year, from survey data and interpolated for reference years (1990, 1995, 2000)
") Recent trends in malnutrition in developing regions 109 Annex 1 Malnutrition prevalences by country and year, from survey data and interpolated for reference years (1990, 1995, ) The tables in this Annex
Recent trends in malnutrition in developing regions 109 Annex 1 Malnutrition prevalences by country and year, from survey data and interpolated for reference years (1990, 1995, ) The tables in this Annex
Country Profiles for Population and Reproductive Health: Policy Developments and Indicators 2003
 Country Profiles for Population and Reproductive Health: Policy Developments and Indicators 2003 Copyright United Nations Population Fund and Population Reference Bureau, 2003. Acknowledgements This publication