Supplemental figures
|
|
|
- Carmel Joan Fields
- 6 years ago
- Views:
Transcription
1 Supplemental figures Supplemental Figure 1. Impact of immunogenic-llc tumors (LLC-OVA) on peripheral OVA-specific CD8 T cells. Tetramer analysis showing percent OVA-specific CD8 T cells in peripheral blood (out of total CD8 T cells) on day 10 from mice receiving LLC-OVA s.c or naïve mice as indicated. Each point represents a single mouse. Student s t test was performed to compare tetramer positive CD8 T cells between naive mice and those receiving LLC-OVA tumors.
 and AP1 (bottom) in LLC-MiG, LLC-IKK, or LLC-MiG cells treated with TNF.")
2 h 2h MiG IKK TNF heterodimers homodimers AP1 Supplemental Figure 2. Activation of NF- B in non-immunogenic LLC cells. EMSA showing nuclear levels of NF- B (top) and AP1 (bottom) in LLC-MiG, LLC-IKK, or LLC-MiG cells treated with TNF. Results are representative of at least two independent experiments.

 showing a high percentage of")

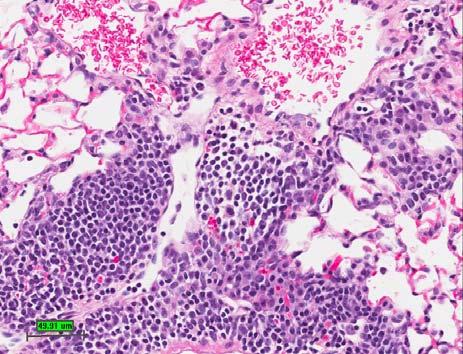
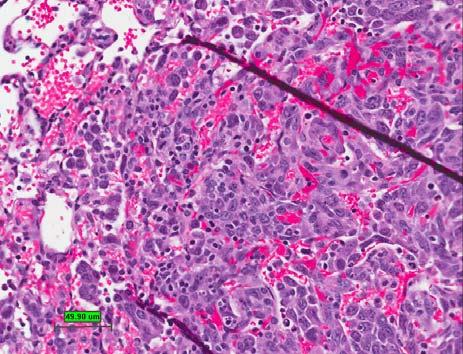
 showing neoplasm and")
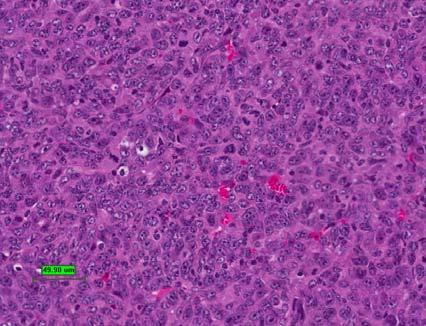
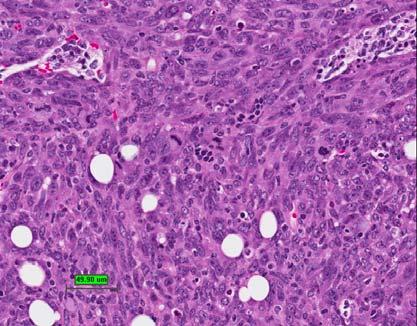
3 LLC-OVA-MiG 50 M L F LLC-OVA-IKK 50 M Supplemental Figure 3. (top panel) Two different LLC-OVA-MiG tumors (Day 9) showing a high percentage of neoplastic cells and intra-tumoral infiltrating lymphocytes. (Bottom Panel) Two different LLC-OVA-IKK tumors (Day 10) showing neoplasm and extensive intratumoral lymphocytic infiltration (L) and fibrosis (F).

.")
4 LKR Parental MiG IκBα IKK heterodimers homodimers AP1 Supplemental Figure 4. NF- B and AP1 activity as determined by EMSA in parental LKR-13, LKR-13 transduced with the control MiG retrovirus (MiG), I B SR retrovirus (I B ) and CA-IKK retrovirus (IKK ). Mobility of different complexes is indicated with arrows.
5 Supplemental Figure 5. Presence of HER2-specific CD8 T cells after TriVax administration. Tetramer analysis of peripheral blood on day 10 from naïve mice or mice receiving TUBO-MiG or TUBO-IKK with or without TriVax vaccination. Vaccination given on day 5. Each point represents data from a single mouse. Results are representative of two independent experiments. Student s T test was performed to compare tetramer positive CD8 T cells between TriVax treated mice receiving TUBO-MiG and those receiving TUBO-IKK tumors.
6 Supplemental Figure 6. Impact of IKK expression on chemokine expression in LLC-OVA determined by RNA microarray analysis on an Affymetrix platform. Affymetrix probe set intensity fold increase in indicated chemokine expression in LLC-OVA-IKK compared to LLC- OVA-MiG. Genes identified in two separate microarray experiments are shown, and reported as mean +/- SEM.

7 a b c d RelA p-rela -actin p-erk ERK -actin Lanes 1 LLC-OVA-MiG (CE) 2 LLC-OVA-IKK (CE) 3 LLC-OVA-MiG (NE) 4 LLC-OVA-IKK (NE) RelB -actin p100 p52 p105 p50 crel -actin Supplemental Figure 7. (a) Western blot showing RelA and S536 p-rela in cytoplasmic extracts (CE; lanes 1,2) and nuclear extracts (NE; lanes 3,4) in LLC- OVA-MiG (lanes 1 and 3) and LLC-OVA-IKK (lanes 2 and 4). (b) Western blot of RelB shown as in a. Western blot of p100/p52, p105/p50 and crel shown as in a. (d) p-erk and total Erk shown as in a.


 RelB expression in LLC-OVA-IKK (lane 1), cells infected")
.")

8 a IKK IKK-cont IKK-cRel-shRNA IKK-RelA-shRNA b IKK-cont IKK-RelA-shRNA IKK-cRel-shRNA c RelB RelA crel -actin heterodimers homoodimers β-actin d e Supplemental Figure 8. (a) Western blot showing RelA and crel levels in whole cell lysates after expression of control, RelA or crel shrna. (b) EMSA showing nuclear levels of NF- B heterodimer and homodimer binding in LLC-OVA-IKK following expression of control, RelA or crel shrna. (c) RelB expression in LLC-OVA-IKK (lane 1), cells infected with control plko (lane 2) or different RelB specific shrna (lanes 3-6). (d) CCL2 and CCL5 expression determined by RT-PCR after RelA shrna expression in LLC-OVA IKK cells. (e) LLC-OVA-IKK cells expressing RelB shrna in lane 4 of c. RT-PCR expression of CCL2 and CCL5 is shown. Results are representative of at least two independent experiments.
9 Supplemental Figure 9. LLC-OVA-MiG and LLC-OVA-IKK supernatants were collected 24h after plating and the amount of secreted CCL2 was determined by ELISA.
10 a b c Supplemental Figure 10. Impact of CCL2 knock-down (KD) on tumor growth and anti-tumor immune response. (a) ELISA showing knock-down of CCL2 by lentiviral shrna transduction in LLC-OVA-IKK cells relative to parental un-transduced LLC-OVA-IKK cells or control lentivurs infected cells. Samples were run in triplicate and reported as mean +/- SEM. shrna 70 was used in studies described here. (b) Tetramer analysis of peripheral blood on day 10 from naïve mice or mice receiving LLC-OVA-IKK alone, transduced with lentiviral control, or CCL2 shrna s.c. Each point represents a single mouse. Student s T test was performed to compare tetramer positive CD8 T cells between mice receiving LLC-OVA-IKK-lenti control and those receiving LLC- OVA-IKK-CCL2 KD tumors.(c) C57Bl/6 mice received s.c.llc-ova-ikk-lenti control or LLC- OVA-IKK-CCL2 KD and tumor growth was monitored. Relative fold increase in tumor volume in mice at D21 post-inoculation compared to D4 post-inoculation. Combined results from 2 independent experiments are shown. Each point represents tumor growth from a single mouse. The difference in tumor numbers showing growth in the two groups was significant, p value=0.007, Fisher s Exact Test.


11 TNFAIP3 BIRC3 CCL2 CCL5 Supplemental Figure 11. Determination of mrna expression of indicated NF- B target genes in low NF- B signature (H322, H1395, H1437, H522) and high NF- B signature (H1299, H650, H157, H226) cells. Relative expression is shown after normalizing to 18s rrna levels. Samples were run in triplicate and reported as average +/- SEM.
12 CXCL1 CXCL2 CXCL3 IL8 Supplemental Figure 11. Determination of mrna expression of indicated NF- B target genes in low NF- B signature (H322, H1395, H1437, H522) and high NF- B signature (H1299, H650, H157, H226) cells. Relative expression is shown after normalizing to 18s rrna levels. Samples were run in triplicate and reported as average +/- SEM.
13 Supplemental Figure 12. Correlation of expression between genes in human lung adenocarcinoma. Correlation r-values of expression of different NF- B activating cytokine genes (y-axis) with expression of different genes (x-axis). Gene name and Affymetrix probe set numbers for genes with 2 probe sets are shown.
 of the NF- B")
14 Supplemental Figure 13. The first 3 Principal Components (PC1-3) of the NF- B signature are shown in the CMCLA dataset.
15 r=0.7 r=0.77 r= _i_at:CCL5 1405_i_at:CCL5 NF-κB_159:PC _x_at:GBP _x_at:GBP1 NF-κB_159:PC _S_at:TAP _S_at:TAP1 NF-κB_159:PC1 r=-0.05 r=-0.1 r=-0.1 NF-κB_159:PC2 NF-κB_159:PC2 NF-κB_159:PC2 Supplemental Figure 14. Correlation of expression between NF-κB driver genes (y-axis) and PC1 (top panel) and PC2 (bottom panel) of the NF-κB signature 159 probesets (xaxis) in the CMCLA dataset. Correlation r-values, gene names and Affymetrix probe set ID are shown.
16 r=0.74 r=0.72 r= _at:IRF _at:IRF1 NF-κB_159:PC _at:TNFAIP _at:TNFAIP3 NF-κB_159:PC1 r=-0.09 r=0 r= _at:SH2B _at:SH2B3 NF-κB_159:PC1 NF-κB_159:PC2 NF-κB_159:PC2 NF-κB_159:PC2 Supplemental Figure 14. Correlation of expression between NF-κB driver genes (y-axis) and PC1 (top panel) and PC2 (bottom panel) of the NF-κB signature 159 probesets (xaxis) in the CMCLA dataset. Correlation r-values, gene names and Affymetrix probe set ID are shown.
17 r=0.67 r=0.65 r= _s_at:IL _s_at:IL32 NF-κB_159:PC _at:NFκBE _at:NFκBE NF-κB_159:PC1 r=-0.11 r=-0.17 r= _at:PSMB _at:PSMB9 NF-κB_159:PC1 NF-κB_159:PC2 NF-κB_159:PC2 NF-κB_159:PC2 Supplemental Figure 14. Correlation of expression between NF-κB driver genes (y-axis) and PC1 (top panel) and PC2 (bottom panel) of the NF-κB signature 159 probesets (xaxis) in the CMCLA dataset. Correlation r-values, gene names and Affymetrix probe set ID are shown.
18 r= _s_at:PSMB _s_at:PSMB8 NF-κB_159:PC1 r=0.11 NF-κB_159:PC2 Supplemental Figure 14. Correlation of expression between NF-κB driver genes (y-axis) and PC1 (top panel) and PC2 (bottom panel) of the NF-κB signature 159 probesets (xaxis) in the CMCLA dataset. Correlation r-values, gene names and Affymetrix probe set ID are shown.
19 PC1 PC2 PC3 Supplemental Figure 15. The first 3 Principal Components (PC1-3) of the T cell receptor genes (TRAC and TRBC1) are shown in the CMCLA dataset.
 of the 10- gene")
20 Supplemental Figure 16. The first 3 Principal Components (PC1-3) of the 10- gene NF- B are shown in the CMCLA dataset.
21 r=0.8 r=-0.16 T_CELL_PC1 MR_PC1 NF-κB_10_PC1 NF-κB_10_PC1 Supplemental Figure 17. Correlation of expression between the 10-gene NF- B signature with T cell presence and the MR signature in the the GSE14814 dataset (n=133). Correlation r-values are shown.
22 r=0.77 r=0.83 CD4;203547_at CD4;203547_at PC1: T_CELL r=0.59 CD8A;205758_at CD8A;205758_at PC1: T_CELL r=0.73 PC1: NF-κB_10 PC1: NF-κB_10 Supplemental Figure 18. Correlation between T cell presence and CD4 and CD8A expression (top panel). Correlation in expression between the 10-gene NF- B signature and CD4 and CD8A expression (bottom panel). Data from the the CMCLA dataset is shown. Correlation r-values, gene names and Affymetrix probe set ID are shown.

 CD8 and FoxP3 in mononuclear cells. The percentage of CD8+FoxP3+ T cells is indicated.")
23 a b Supplemental Figure 19. Lymphocyte infiltration in LLC-OVA-IKK tumors. Mononuclear cells isolated from tumors 9 days post inoculation were analyzed for expression of CD8 (a). The percentage of CD8+ T cells is indicated. (b) CD8 and FoxP3 in mononuclear cells. The percentage of CD8+FoxP3+ T cells is indicated. Each graph represents an independent tumor.


 The percentage of CD8+FoxP3+ T cells after gating on CD8+ T")
24 c d e Supplemental Figure 19. Lymphocyte infiltration in LLC-OVA-IKK tumors. Mononuclear cells isolated from spleens of tumor bearing mice 9 days post inoculation were analyzed for expression of CD8, CD4 and FoxP3. (c) The percentage of CD8+FoxP3+ T cells after gating on CD8+ T cells. (e) The percentage of CD4+FoxP3+ T cells after gating on CD4+ T cells. Each graph represents an independent spleen.

25 a c Tumor Volume (mm 3 ) LLC 2 LLC-IKK high 3 LLC-IKK * 200 * Days post-tumor inoculation LLC-IKK LLC-IKK high Relative Amount b LLC-IKK CCL2 LLC -IKK high Relative Amount LLC-IKK CCL5 LLC-IK K high Supplemental Figure 20. Impact of IKK -induced NF- B on tumor growth. (a) Electrophoretic mobility shift assay (EMSA) showing NF- B nuclear levels in LLC, LLC-IKK and LLC-IKKhigh. (b) RT-PCR showing CCL2 and CCL5 expression in LLC-IKK and LLC-IKK-high. Samples were run in triplicate and reported as average +/- SEM. (c) C57Bl/6 mice received s.c. LLC-IKK (n=3) and LLC-IKK-high (n=3) and tumor growth was monitored. Error bars represent SD. Significant difference in growth were observed at early time points (Day 10, p=0.0003, t test) but not at later time points (Day 17, p=0.6449, t test).


26 a c LLC-IKK 4mM LLC-IKK High 4mM L 49.9 M b L 49.9 M L
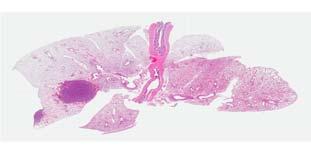
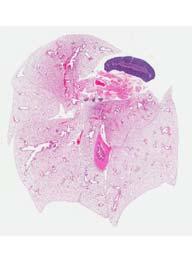
27 Supplemental Figure 21. Impact of IKK -induced NF- B on tumor growth in a metastatic model of lung cancer. (a) H&E staining of lungs from mice 24 days after receiving i.v. LLC-IKK or LLC- IKK-high as indicated. (b) Larger LLC-IKK-high tumors showed lymphocytic infiltrates peripherally and within tumors (left) while smaller foci showed numerous lymphocytes with few remaining tumor cells (right). (c) LLC-IKK tumors showing presence of small numbers of lymphocytes (L).
28 Supplemental Materials Microarray studies Mouse LLC microarray: For microarray analysis the mrna in 100 ng of total RNA was specifically converted to cdna and then amplified and labeled with biotin using the Ambion Message Amp Premier RNA Amplification Kit (Life Technologies, Grand Island, NY) following the manufacturer s protocol. Affymetrix Mouse Genome Arrays were used in these studies. Hybridization with the biotin-labeled RNA, staining, and scanning of the arrays following the prescribed procedure outlined in the Affymetrix technical manual. Results were analyzed using the MAS 5.0 algorithm. Genes were considered changed if they were identified as changed in the MAS 5.0 comparison analysis and there was a 2-fold difference in signal compared to the control condition. Human NF- B signature: Microarray analysis was initiated with 100 ng of total cellular RNA from each cell line. RNA was converted to cdna and then amplified and labeled with biotin using the Ambion Message Amp Premier RNA Amplification Kit (Life Technologies, Grand Island, NY) following the manufacturer s protocol. The labeled RNA was hybridized to Affymetrix U133 Plus 2.0 microarrays and the staining, and scanning of the chips followed the prescribed procedure outlined in the Affymetrix technical manual. Results were analyzed using the MAS 5.0 algorithm with all treated samples compared to the corresponding control samples. In the preliminary analysis, genes were considered to be changed if they were identified as changed in the MAS 5 comparison analysis (p value 0.05) and there was a 1.4-fold difference in signal compared to the control. The initial lists were then considered together to identify genes that both activated in activating conditions and inhibited in inhibitory conditions across all 5 cell
29 lines. Genes meeting these criteria in at least 6 of the 10 experimental conditions were considered to be NF- B responsive genes. NF- B cell-line classifier The microarray data was obtained from GEO at NCBI and Array Express at EBI. It consists of 408 Affymetrix CEL files of 126 different lung cell lines. The scores were calculated based on this set of samples so the high and low are in reference to other cell lines within this group. The probesets that were used to classify the samples were the 240 probes originally identified in the 5 cell lines (i.e. NF- B signature). The classifier was built and implemented as described (classifier H in supplemental materials and methods) (1). The decision thresholds were made based on the array of measures in the 408 lung CEL file data. The weighted voting classification of each sample scores each gene (probeset) based on where the signal value falls among all the samples in the group. If the probeset was positively correlated with the NF-KB signature (in the original 5 cell lines) then values in the lower third receive a score of -1, values in the middle third receive a 0, and values in the upper third receive a value of 1. If a gene was negatively correlated the values were reversed. The scores for all probesets were summed to provide the final classification score. The data sets used are listed below: E-MTAB- 37 Array Express GSE10021 GSE10843 GSE13309 GSE14315 GSE14883 GSE15240 GSE16194 GSE17347 GSE18454 GSE21612 GSE4824 GEO GEO GEO GEO GEO GEO GEO GEO GEO GEO GEO
30 GSE5816 GSE6013 GSE7562 GSE8332 GEO GEO GEO GEO ELISA Supernatant was collected from LLC-OVA-MiG cells and LLC-OVA-IKK cells after 24h of culture. Anti-CCL2 ELISA (Ready-SET-Go kit from ebioscience (San Diego, CA) was performed to measure CCL2 production and secretion in cells and to confirm CCL2 knockdown according to the manufacturer s instructions. Western blotting, electrophoretic mobility shift assays (EMSA) and shrna knockdown Protein lysates were prepared from whole cell or cytoplasmic and nuclear extracts and Western blots were performed as described (2). Antibodies were p-erk/erk (Cell Signaling, Danvers, MA), RelB sc-226x, p-rela sc-33020, RelA sc-372x, p105/p50 sc-7178, crel sc-70 were all from Santa Cruz Biotechnology (Santa Cruz, CA). p100 antibody was kindly provided by Dr. Nancy Rice (NIH), EMSA was performed as previously described (2). Mouse-specific RelA and crel shrna vectors were obtained from Addgene and have been previously described (3). RelB shrna vectors were obtained from Open Biosystems. Analysis of tumor infiltrating T cells Spleens and tumors were obtained from mice on D9 post tumor inoculation and mechanically digested through cell strainers (40micron). The tumors were incubated with Collagenase D Buffer (Roche) (2mg/mL final solution) for 30min at 37 C. All samples were resuspended in PBS and an equal volume of LSM (MSbio) was underlayed. Cells were centrifuged for 30min at
31 400Xg and the mononuclear interface was isolated. Cells were washed 2X in FACS Buffer, Fc blocked for 5min at RT, then cell surface staining was performed for 30min at 4 C. Cells were next stained for intracellular FoxP3 as per ebioscience kit protocol. Briefly, cells were washed 2X in FACS Buffer, and then fixed for 30min at 4 C. Next, cells were washed 2X in Perm Buffer and FoxP3 staining was performed for 30min at 4 C. Cells were then washed once in Perm Buffer, and then resuspended in FACS Buffer. Data was collected on the LSRII (BD) and analyzed with FlowJo Supplemental Table 1. Microarray analysis of LLC-OVA-MiG compared to LLC-OVA-IKK cells. Genes shown were increased or decreased over 2-fold in LLC-OVA-IKK cells compared to LLC- OVA-MiG cells by Microarray. Genes are listed in order of decreasing fold-induction. Genes identified by multiple probesets are listed for each probeset and probesets lacking gene names are not included. The up-regulated, down-regulated and chemokines genes are shown. Supplemental Table 2. NF- B signature probeset list with indicated up-regulated and downregulated probesets. Also shown are gene symbols (when known) and Genebank ID. Supplemental Table 3. NF- B signature score was determined using a classifier (S. Methods) in human lung cancer cell line data. Cell lines used are highlighted (H226, H157, H1299, H650, H322, H1395, H522, H1437), many of which were sampled multiple times. Supplemental Table 4. NF- B signature 159 probesets and gene symbols are indicated, when available, that were used for determining NF- B signature activity in the CMCLA dataset.
32 References 1. Shedden, K., Taylor, J.M., Enkemann, S.A., Tsao, M.S., Yeatman, T.J., Gerald, W.L., Eschrich, S., Jurisica, I., Giordano, T.J., Misek, D.E., et al Gene expression-based survival prediction in lung adenocarcinoma: a multi-site, blinded validation study. Nat Med 14: Beg, A.A., Finco, T.S., Nantermet, P.V., and Baldwin, A.S Tumor necrosis factor and interleukin-1 lead to phosphorylation and loss of I B: a mechanism for NF- B activation. Mol. Cell Biol. 13: Meylan, E., Dooley, A.L., Feldser, D.M., Shen, L., Turk, E., Ouyang, C., and Jacks, T Requirement for NF-kappaB signalling in a mouse model of lung adenocarcinoma. Nature 462:
Lung tumor NF-kB signaling promotes T cell mediated immune surveillance
 Lung tumor NF-kB signaling promotes T cell mediated immune surveillance Emily L. Hopewell,, Dung-Tsa Chen, Amer A. Beg J Clin Invest. 2013;123(6):2509-2522. https://doi.org/10.1172/jci67250. Research Article
MicroRNAs Modulate the Noncanonical NF- B Pathway by Regulating IKK Expression During Macrophage Differentiation
 MicroRNAs Modulate the Noncanonical NF- B Pathway by Regulating IKK Expression During Macrophage Differentiation Tao Li 1 *, Michael J. Morgan 1 *, Swati Choksi 1, Yan Zhang 1, You-Sun Kim 2#, Zheng-gang
Supplementary methods:
 Supplementary methods: Primers sequences used in real-time PCR analyses: β-actin F: GACCTCTATGCCAACACAGT β-actin [11] R: AGTACTTGCGCTCAGGAGGA MMP13 F: TTCTGGTCTTCTGGCACACGCTTT MMP13 R: CCAAGCTCATGGGCAGCAACAATA
Supplemental Information. T Cells Enhance Autoimmunity by Restraining Regulatory T Cell Responses via an Interleukin-23-Dependent Mechanism
 Immunity, Volume 33 Supplemental Information T Cells Enhance Autoimmunity by Restraining Regulatory T Cell Responses via an Interleukin-23-Dependent Mechanism Franziska Petermann, Veit Rothhammer, Malte
Supplementary Figure 1. Normal T lymphocyte populations in Dapk -/- mice. (a) Normal thymic development in Dapk -/- mice. Thymocytes from WT and Dapk
 Normal thymic development in Dapk -/- mice. Thymocytes from WT and Dapk") Supplementary Figure 1. Normal T lymphocyte populations in Dapk -/- mice. (a) Normal thymic development in Dapk -/- mice. Thymocytes from WT and Dapk -/- mice were stained for expression of CD4 and CD8.
Supplementary Figure 1. Normal T lymphocyte populations in Dapk -/- mice. (a) Normal thymic development in Dapk -/- mice. Thymocytes from WT and Dapk -/- mice were stained for expression of CD4 and CD8.
S1a S1b S1c. S1d. S1f S1g S1h SUPPLEMENTARY FIGURE 1. - si sc Il17rd Il17ra bp. rig/s IL-17RD (ng) -100 IL-17RD
 -100 IL-17RD") SUPPLEMENTARY FIGURE 1 0 20 50 80 100 IL-17RD (ng) S1a S1b S1c IL-17RD β-actin kda S1d - si sc Il17rd Il17ra rig/s15-574 - 458-361 bp S1f S1g S1h S1i S1j Supplementary Figure 1. Knockdown of IL-17RD enhances
SUPPLEMENTARY FIGURE 1 0 20 50 80 100 IL-17RD (ng) S1a S1b S1c IL-17RD β-actin kda S1d - si sc Il17rd Il17ra rig/s15-574 - 458-361 bp S1f S1g S1h S1i S1j Supplementary Figure 1. Knockdown of IL-17RD enhances
SUPPLEMENTARY INFORMATION
 DOI: 1.138/ncb3355 a S1A8 + cells/ total.1.8.6.4.2 b S1A8/?-Actin c % T-cell proliferation 3 25 2 15 1 5 T cells Supplementary Figure 1 Inter-tumoral heterogeneity of MDSC accumulation in mammary tumor
(a) Significant biological processes (upper panel) and disease biomarkers (lower panel)
 Significant biological processes (upper panel) and disease biomarkers (lower panel)") Supplementary Figure 1. Functional enrichment analyses of secretomic proteins. (a) Significant biological processes (upper panel) and disease biomarkers (lower panel) 2 involved by hrab37-mediated secretory
Supplementary Figure 1. Functional enrichment analyses of secretomic proteins. (a) Significant biological processes (upper panel) and disease biomarkers (lower panel) 2 involved by hrab37-mediated secretory
Supplemental Figure 1
 Supplemental Figure 1 A S100A4: SFLGKRTDEAAFQKLMSNLDSNRDNEVDFQEYCVFLSCIAMMCNEFFEGFPDK Overlap: SF G DE KLM LD N D VDFQEY VFL I M N FF G PD S100A2: SFVGEKVDEEGLKKLMGSLDENSDQQVDFQEYAVFLALITVMCNDFFQGCPDR
well for 2 h at rt. Each dot represents an individual mouse and bar is the mean ±
 Supplementary data: Control DC Blimp-1 ko DC 8 6 4 2-2 IL-1β p=.5 medium 8 6 4 2 IL-2 Medium p=.16 8 6 4 2 IL-6 medium p=.3 5 4 3 2 1-1 medium IL-1 n.s. 25 2 15 1 5 IL-12(p7) p=.15 5 IFNγ p=.65 4 3 2 1
Supplementary Figure 1: STAT3 suppresses Kras-induced lung tumorigenesis
 Supplementary Figure 1: STAT3 suppresses Kras-induced lung tumorigenesis (a) Immunohistochemical (IHC) analysis of tyrosine 705 phosphorylation status of STAT3 (P- STAT3) in tumors and stroma (all-time
SUPPLEMENTARY INFORMATION
 doi: 1.138/nature89 IFN- (ng ml ) 5 4 3 1 Splenocytes NS IFN- (ng ml ) 6 4 Lymph node cells NS Nfkbiz / Nfkbiz / Nfkbiz / Nfkbiz / IL- (ng ml ) 3 1 Splenocytes IL- (ng ml ) 1 8 6 4 *** ** Lymph node cells
Supplementary Fig. 1 p38 MAPK negatively regulates DC differentiation. (a) Western blot analysis of p38 isoform expression in BM cells, immature DCs
 Western blot analysis of p38 isoform expression in BM cells, immature DCs") Supplementary Fig. 1 p38 MAPK negatively regulates DC differentiation. (a) Western blot analysis of p38 isoform expression in BM cells, immature DCs (idcs) and mature DCs (mdcs). A myeloma cell line expressing
Supplementary Fig. 1 p38 MAPK negatively regulates DC differentiation. (a) Western blot analysis of p38 isoform expression in BM cells, immature DCs (idcs) and mature DCs (mdcs). A myeloma cell line expressing
Blocking antibodies and peptides. Rat anti-mouse PD-1 (29F.1A12, rat IgG2a, k), PD-
, PD-") Supplementary Methods Blocking antibodies and peptides. Rat anti-mouse PD-1 (29F.1A12, rat IgG2a, k), PD- L1 (10F.9G2, rat IgG2b, k), and PD-L2 (3.2, mouse IgG1) have been described (24). Anti-CTLA-4 (clone
Supplementary Methods Blocking antibodies and peptides. Rat anti-mouse PD-1 (29F.1A12, rat IgG2a, k), PD- L1 (10F.9G2, rat IgG2b, k), and PD-L2 (3.2, mouse IgG1) have been described (24). Anti-CTLA-4 (clone
Supplementary Figure 1 Role of Raf-1 in TLR2-Dectin-1-mediated cytokine expression
 Supplementary Figure 1 Supplementary Figure 1 Role of Raf-1 in TLR2-Dectin-1-mediated cytokine expression. Quantitative real-time PCR of indicated mrnas in DCs stimulated with TLR2-Dectin-1 agonist zymosan
Cell isolation. Spleen and lymph nodes (axillary, inguinal) were removed from mice
 were removed from mice") Supplementary Methods: Cell isolation. Spleen and lymph nodes (axillary, inguinal) were removed from mice and gently meshed in DMEM containing 10% FBS to prepare for single cell suspensions. CD4 + CD25
Supplementary Methods: Cell isolation. Spleen and lymph nodes (axillary, inguinal) were removed from mice and gently meshed in DMEM containing 10% FBS to prepare for single cell suspensions. CD4 + CD25
Supplementary Figure 1
 Supplementary Figure 1 Expression of apoptosis-related genes in tumor T reg cells. (a) Identification of FOXP3 T reg cells by FACS. CD45 + cells were gated as enriched lymphoid cell populations with low-granularity.
Supplementary Figure 1 IL-27 IL
 Tim-3 Supplementary Figure 1 Tc0 49.5 0.6 Tc1 63.5 0.84 Un 49.8 0.16 35.5 0.16 10 4 61.2 5.53 10 3 64.5 5.66 10 2 10 1 10 0 31 2.22 10 0 10 1 10 2 10 3 10 4 IL-10 28.2 1.69 IL-27 Supplementary Figure 1.
p = formed with HCI-001 p = Relative # of blood vessels that formed with HCI-002 Control Bevacizumab + 17AAG Bevacizumab 17AAG
 A.. Relative # of ECs associated with HCI-001 1.4 1.2 1.0 0.8 0.6 0.4 0.2 0.0 ol b p < 0.001 Relative # of blood vessels that formed with HCI-001 1.4 1.2 1.0 0.8 0.6 0.4 0.2 0.0 l b p = 0.002 Control IHC:
Supplemental Figure 1
 Supplemental Figure 1 1a 1c PD-1 MFI fold change 6 5 4 3 2 1 IL-1α IL-2 IL-4 IL-6 IL-1 IL-12 IL-13 IL-15 IL-17 IL-18 IL-21 IL-23 IFN-α Mut Human PD-1 promoter SBE-D 5 -GTCTG- -1.2kb SBE-P -CAGAC- -1.kb
Figure S1. Generation of inducible PTEN deficient mice and the BMMCs (A) B6.129 Pten loxp/loxp mice were mated with B6.
 B6.129 Pten loxp/loxp mice were mated with B6.") Figure S1. Generation of inducible PTEN deficient mice and the BMMCs (A) B6.129 Pten loxp/loxp mice were mated with B6.129-Gt(ROSA)26Sor tm1(cre/ert2)tyj /J mice. To induce deletion of the Pten locus,
Figure S1. Generation of inducible PTEN deficient mice and the BMMCs (A) B6.129 Pten loxp/loxp mice were mated with B6.129-Gt(ROSA)26Sor tm1(cre/ert2)tyj /J mice. To induce deletion of the Pten locus,
Supplemental Figure 1. Signature gene expression in in vitro differentiated Th0, Th1, Th2, Th17 and Treg cells. (A) Naïve CD4 + T cells were cultured
 Naïve CD4 + T cells were cultured") Supplemental Figure 1. Signature gene expression in in vitro differentiated Th0, Th1, Th2, Th17 and Treg cells. (A) Naïve CD4 + T cells were cultured under Th0, Th1, Th2, Th17, and Treg conditions. mrna
Supplemental Figure 1. Signature gene expression in in vitro differentiated Th0, Th1, Th2, Th17 and Treg cells. (A) Naïve CD4 + T cells were cultured under Th0, Th1, Th2, Th17, and Treg conditions. mrna
Nature Medicine doi: /nm.3957
 Supplementary Fig. 1. p38 alternative activation, IL-21 expression, and T helper cell transcription factors in PDAC tissue. (a) Tissue microarrays of pancreatic tissue from 192 patients with pancreatic
Supplementary Figure S1. Flow cytometric analysis of the expression of Thy1 in NH cells. Flow cytometric analysis of the expression of T1/ST2 and
 Supplementary Figure S1. Flow cytometric analysis of the expression of Thy1 in NH cells. Flow cytometric analysis of the expression of T1/ST2 and Thy1 in NH cells derived from the lungs of naïve mice.
Index. Index 439. Aequorin, 84, 94 Affinity precipitation, 372, AP-1, 100 Asthma, 170, 305
 Index 439 Index A Aequorin, 84, 94 Affinity precipitation, 372, 376 381 AP-1, 100 Asthma, 170, 305 B Bioassay, 185, comparison with ELISA, 318 GM-CSF bioassay, 351 IL-2 bioassay, 185 192, 300 IL-3 IL-6
Supplementary Figure 1. IDH1 and IDH2 mutation site sequences on WHO grade III
 Supplementary Materials: Supplementary Figure 1. IDH1 and IDH2 mutation site sequences on WHO grade III patient samples. Genomic DNA samples extracted from punch biopsies from either FFPE or frozen tumor
Nature Immunology: doi: /ni Supplementary Figure 1. Huwe1 has high expression in HSCs and is necessary for quiescence.
 Supplementary Figure 1 Huwe1 has high expression in HSCs and is necessary for quiescence. (a) Heat map visualizing expression of genes with a known function in ubiquitin-mediated proteolysis (KEGG: Ubiquitin
Electron micrograph of phosphotungstanic acid-stained exosomes derived from murine
 1 SUPPLEMENTARY INFORMATION SUPPLEMENTARY FIGURES Supplementary Figure 1. Physical properties of murine DC-derived exosomes. a, Electron micrograph of phosphotungstanic acid-stained exosomes derived from
Supplemental Information. Otic Mesenchyme Cells Regulate. Spiral Ganglion Axon Fasciculation. through a Pou3f4/EphA4 Signaling Pathway
 Neuron, Volume 73 Supplemental Information Otic Mesenchyme Cells Regulate Spiral Ganglion Axon Fasciculation through a Pou3f4/EphA4 Signaling Pathway Thomas M. Coate, Steven Raft, Xiumei Zhao, Aimee K.
Supplementary Data Table of Contents:
 Supplementary Data Table of Contents: - Supplementary Methods - Supplementary Figures S1(A-B) - Supplementary Figures S2 (A-B) - Supplementary Figures S3 - Supplementary Figures S4(A-B) - Supplementary
A Hepatocyte Growth Factor Receptor (Met) Insulin Receptor hybrid governs hepatic glucose metabolism SUPPLEMENTARY FIGURES, LEGENDS AND METHODS
 Insulin Receptor hybrid governs hepatic glucose metabolism SUPPLEMENTARY FIGURES, LEGENDS AND METHODS") A Hepatocyte Growth Factor Receptor (Met) Insulin Receptor hybrid governs hepatic glucose metabolism Arlee Fafalios, Jihong Ma, Xinping Tan, John Stoops, Jianhua Luo, Marie C. DeFrances and Reza Zarnegar
A Hepatocyte Growth Factor Receptor (Met) Insulin Receptor hybrid governs hepatic glucose metabolism Arlee Fafalios, Jihong Ma, Xinping Tan, John Stoops, Jianhua Luo, Marie C. DeFrances and Reza Zarnegar
p47 negatively regulates IKK activation by inducing the lysosomal degradation of polyubiquitinated NEMO
 Supplementary Information p47 negatively regulates IKK activation by inducing the lysosomal degradation of polyubiquitinated NEMO Yuri Shibata, Masaaki Oyama, Hiroko Kozuka-Hata, Xiao Han, Yuetsu Tanaka,
Supplementary Figure 1. Deletion of Smad3 prevents B16F10 melanoma invasion and metastasis in a mouse s.c. tumor model.
 A B16F1 s.c. Lung LN Distant lymph nodes Colon B B16F1 s.c. Supplementary Figure 1. Deletion of Smad3 prevents B16F1 melanoma invasion and metastasis in a mouse s.c. tumor model. Highly invasive growth
Title of file for HTML: Supplementary Information Description: Supplementary Figures and Supplementary Table
 Title of file for HTML: Supplementary Information Description: Supplementary Figures and Supplementary Table Title of file for HTML: Peer Review File Description: Innate Scavenger Receptor-A regulates
Supplementary Figure 1. mrna expression of chitinase and chitinase-like protein in splenic immune cells. Each splenic immune cell population was
 Supplementary Figure 1. mrna expression of chitinase and chitinase-like protein in splenic immune cells. Each splenic immune cell population was sorted by FACS. Surface markers for sorting were CD11c +
Supplementary Materials for
 www.sciencesignaling.org/cgi/content/full/7/310/ra11/dc1 Supplementary Materials for STAT3 Induction of mir-146b Forms a Feedback Loop to Inhibit the NF-κB to IL-6 Signaling Axis and STAT3-Driven Cancer
Nature Medicine: doi: /nm.3922
 Title: Glucocorticoid-induced tumor necrosis factor receptor-related protein co-stimulation facilitates tumor regression by inducing IL-9-producing helper T cells Authors: Il-Kyu Kim, Byung-Seok Kim, Choong-Hyun
Comparison of open chromatin regions between dentate granule cells and other tissues and neural cell types.
 Supplementary Figure 1 Comparison of open chromatin regions between dentate granule cells and other tissues and neural cell types. (a) Pearson correlation heatmap among open chromatin profiles of different
Islet viability assay and Glucose Stimulated Insulin Secretion assay RT-PCR and Western Blot
 Islet viability assay and Glucose Stimulated Insulin Secretion assay Islet cell viability was determined by colorimetric (3-(4,5-dimethylthiazol-2-yl)-2,5- diphenyltetrazolium bromide assay using CellTiter
Nature Immunology: doi: /ni Supplementary Figure 1. Gene expression profile of CD4 + T cells and CTL responses in Bcl6-deficient mice.
 Supplementary Figure 1 Gene expression profile of CD4 + T cells and CTL responses in Bcl6-deficient mice. (a) Gene expression profile in the resting CD4 + T cells were analyzed by an Affymetrix microarray
condition. Left panel, the HCT-116 cells were lysed with RIPA buffer containing 0.1%
 FIGURE LEGENDS Supplementary Fig 1 (A) sumoylation pattern detected under denaturing condition. Left panel, the HCT-116 cells were lysed with RIPA buffer containing 0.1% SDS in the presence and absence
IKK-dependent activation of NF-κB contributes to myeloid and lymphoid leukemogenesis by BCR-ABL1
 Supplemental Figures BLOOD/2014/547943 IKK-dependent activation of NF-κB contributes to myeloid and lymphoid leukemogenesis by BCR-ABL1 Hsieh M-Y and Van Etten RA Supplemental Figure S1. Titers of retroviral
Supplementary Information
 Supplementary Information Supplementary Figure 1. CD4 + T cell activation and lack of apoptosis after crosslinking with anti-cd3 + anti-cd28 + anti-cd160. (a) Flow cytometry of anti-cd160 (5D.10A11) binding
Supplementary Information
 Supplementary Information An orally available, small-molecule interferon inhibits viral replication Hideyuki Konishi 1, Koichi Okamoto 1, Yusuke Ohmori 1, Hitoshi Yoshino 2, Hiroshi Ohmori 1, Motooki Ashihara
Nature Immunology: doi: /ni Supplementary Figure 1. Production of cytokines and chemokines after vaginal HSV-2 infection.
 Supplementary Figure 1 Production of cytokines and chemokines after vaginal HSV-2 infection. C57BL/6 mice were (a) treated intravaginally with 20 µl of PBS or infected with 6.7x10 4 pfu of HSV-2 in the
Suppl Video: Tumor cells (green) and monocytes (white) are seeded on a confluent endothelial
 and monocytes (white) are seeded on a confluent endothelial") Supplementary Information Häuselmann et al. Monocyte induction of E-selectin-mediated endothelial activation releases VE-cadherin junctions to promote tumor cell extravasation in the metastasis cascade
Supplementary Information Häuselmann et al. Monocyte induction of E-selectin-mediated endothelial activation releases VE-cadherin junctions to promote tumor cell extravasation in the metastasis cascade
Supplementary Information Titles Journal: Nature Medicine
 Supplementary Information Titles Journal: Nature Medicine Article Title: Corresponding Author: Supplementary Item & Number Supplementary Fig.1 Fig.2 Fig.3 Fig.4 Fig.5 Fig.6 Fig.7 Fig.8 Fig.9 Fig. Fig.11
Supplementary Figure 1. SA-β-Gal positive senescent cells in various cancer tissues. Representative frozen sections of breast, thyroid, colon and
 Supplementary Figure 1. SA-β-Gal positive senescent cells in various cancer tissues. Representative frozen sections of breast, thyroid, colon and stomach cancer were stained with SA-β-Gal and nuclear fast
Bezzi et al., Supplementary Figure 1 *** Nature Medicine: doi: /nm Pten pc-/- ;Zbtb7a pc-/- Pten pc-/- ;Pml pc-/- Pten pc-/- ;Trp53 pc-/-
 Gr-1 Gr-1 Gr-1 Bezzi et al., Supplementary Figure 1 a Gr1-CD11b 3 months Spleen T cells 3 months Spleen B cells 3 months Spleen Macrophages 3 months Spleen 15 4 8 6 c CD11b+/Gr1+ cells [%] 1 5 b T cells
Supplementary Figure 1:
 Supplementary Figure 1: (A) Whole aortic cross-sections stained with Hematoxylin and Eosin (H&E), 7 days after porcine-pancreatic-elastase (PPE)-induced AAA compared to untreated, healthy control aortas
Supplementary Materials for
 www.sciencesignaling.org/cgi/content/full/9/439/ra78/dc1 Supplementary Materials for Small heterodimer partner mediates liver X receptor (LXR) dependent suppression of inflammatory signaling by promoting
Supplementary Figures
 Supplementary Figures Supplementary Figure 1 Characterization of stable expression of GlucB and sshbira in the CT26 cell line (a) Live cell imaging of stable CT26 cells expressing green fluorescent protein
Programmed necrosis, not apoptosis, is a key mediator of cell loss and DAMP-mediated inflammation in dsrna-induced retinal degeneration
 Programmed necrosis, not apoptosis, is a key mediator of cell loss and DAMP-mediated inflammation in dsrna-induced retinal degeneration The Harvard community has made this article openly available. Please
<10. IL-1β IL-6 TNF + _ TGF-β + IL-23
 3 ns 25 ns 2 IL-17 (pg/ml) 15 1 ns ns 5 IL-1β IL-6 TNF
ECM1 controls T H 2 cell egress from lymph nodes through re-expression of S1P 1
 ZH, Li et al, page 1 ECM1 controls T H 2 cell egress from lymph nodes through re-expression of S1P 1 Zhenhu Li 1,4,Yuan Zhang 1,4, Zhiduo Liu 1, Xiaodong Wu 1, Yuhan Zheng 1, Zhiyun Tao 1, Kairui Mao 1,
Supplemental Information. Aryl Hydrocarbon Receptor Controls. Monocyte Differentiation. into Dendritic Cells versus Macrophages
 Immunity, Volume 47 Supplemental Information Aryl Hydrocarbon Receptor Controls Monocyte Differentiation into Dendritic Cells versus Macrophages Christel Goudot, Alice Coillard, Alexandra-Chloé Villani,
Pathologic Stage. Lymph node Stage
 ASC ASC a c Patient ID BMI Age Gleason score Non-obese PBMC 1 22.1 81 6 (3+3) PBMC 2 21.9 6 6 (3+3) PBMC 3 22 84 8 (4+4) PBMC 4 24.6 68 7 (3+4) PBMC 24. 6 (3+3) PBMC 6 24.7 73 7 (3+4) PBMC 7 23. 67 7 (3+4)
Supplementary Table 1. Characterization of HNSCC PDX models established at MSKCC
 Supplementary Table 1. Characterization of HNSCC PDX models established at MSKCC Supplementary Table 2. Drug content and loading efficiency estimated with F-NMR and UV- Vis Supplementary Table 3. Complete
Stewart et al. CD36 ligands promote sterile inflammation through assembly of a TLR 4 and 6 heterodimer
 NFκB (fold induction) Stewart et al. ligands promote sterile inflammation through assembly of a TLR 4 and 6 heterodimer a. mrna (fold induction) 5 4 3 2 1 LDL oxldl Gro1a MIP-2 RANTES mrna (fold induction)
Supplemental Table S1
 Supplemental Table S. Tumorigenicity and metastatic potential of 44SQ cell subpopulations a Tumorigenicity b Average tumor volume (mm ) c Lung metastasis d CD high /4 8. 8/ CD low /4 6./ a Mice were injected
(A) PCR primers (arrows) designed to distinguish wild type (P1+P2), targeted (P1+P2) and excised (P1+P3)14-
 PCR primers (arrows) designed to distinguish wild type (P1+P2), targeted (P1+P2) and excised (P1+P3)14-") 1 Supplemental Figure Legends Figure S1. Mammary tumors of ErbB2 KI mice with 14-3-3σ ablation have elevated ErbB2 transcript levels and cell proliferation (A) PCR primers (arrows) designed to distinguish
1 Supplemental Figure Legends Figure S1. Mammary tumors of ErbB2 KI mice with 14-3-3σ ablation have elevated ErbB2 transcript levels and cell proliferation (A) PCR primers (arrows) designed to distinguish
Supplementary Figures
 Supplementary Figures Supplementary Figure 1. NKT ligand-loaded tumour antigen-presenting B cell- and monocyte-based vaccine induces NKT, NK and CD8 T cell responses. (A) The cytokine profiles of liver
HEK293FT cells were transiently transfected with reporters, N3-ICD construct and
 Supplementary Information Luciferase reporter assay HEK293FT cells were transiently transfected with reporters, N3-ICD construct and increased amounts of wild type or kinase inactive EGFR. Transfections
SUPPLEMENTARY INFORMATION
 Supplemental Figure 1. Furin is efficiently deleted in CD4 + and CD8 + T cells. a, Western blot for furin and actin proteins in CD4cre-fur f/f and fur f/f Th1 cells. Wild-type and furin-deficient CD4 +
NF-κB (p65) Transcription Factor Assay Kit
 Transcription Factor Assay Kit") NF-κB (p65) Transcription Factor Assay Kit Item No. 10007889 www.caymanchem.com Customer Service 800.364.9897 Technical Support 888.526.5351 1180 E. Ellsworth Rd Ann Arbor, MI USA TABLE OF CONTENTS GENERAL
NF-κB (p65) Transcription Factor Assay Kit Item No. 10007889 www.caymanchem.com Customer Service 800.364.9897 Technical Support 888.526.5351 1180 E. Ellsworth Rd Ann Arbor, MI USA TABLE OF CONTENTS GENERAL
Supplemental figure 1. PDGFRα is expressed dominantly by stromal cells surrounding mammary ducts and alveoli. A) IHC staining of PDGFRα in
 IHC staining of PDGFRα in") Supplemental figure 1. PDGFRα is expressed dominantly by stromal cells surrounding mammary ducts and alveoli. A) IHC staining of PDGFRα in nulliparous (left panel) and InvD6 mouse mammary glands (right
Supplemental figure 1. PDGFRα is expressed dominantly by stromal cells surrounding mammary ducts and alveoli. A) IHC staining of PDGFRα in nulliparous (left panel) and InvD6 mouse mammary glands (right
Supplementary Figures
 MiR-29 controls innate and adaptive immune responses against intracellular bacterial infection by targeting IFN-γ Feng Ma 1,2,5, Sheng Xu 1,5, Xingguang Liu 1, Qian Zhang 1, Xiongfei Xu 1, Mofang Liu 3,
MTC-TT and TPC-1 cell lines were cultured in RPMI medium (Gibco, Breda, The Netherlands)
") Supplemental data Materials and Methods Cell culture MTC-TT and TPC-1 cell lines were cultured in RPMI medium (Gibco, Breda, The Netherlands) supplemented with 15% or 10% (for TPC-1) fetal bovine serum
Supplemental data Materials and Methods Cell culture MTC-TT and TPC-1 cell lines were cultured in RPMI medium (Gibco, Breda, The Netherlands) supplemented with 15% or 10% (for TPC-1) fetal bovine serum
PKCζ Promotes Breast Cancer Invasion by Regulating Expression of E-cadherin and Zonula Occludens-1 (ZO-1) via NFκB-p65
 via NFκB-p65") SUPPLEMENTARY INFORMATION TITLE: PKCζ Promotes Breast Cancer Invasion by Regulating Expression of E-cadherin and Zonula Occludens-1 (ZO-1) via NFκB-p65 RUNNING TITLE: PKCζ-NFκB Signaling in Breast Cancer
SUPPLEMENTARY INFORMATION TITLE: PKCζ Promotes Breast Cancer Invasion by Regulating Expression of E-cadherin and Zonula Occludens-1 (ZO-1) via NFκB-p65 RUNNING TITLE: PKCζ-NFκB Signaling in Breast Cancer
B220 CD4 CD8. Figure 1. Confocal Image of Sensitized HLN. Representative image of a sensitized HLN
 B220 CD4 CD8 Natarajan et al., unpublished data Figure 1. Confocal Image of Sensitized HLN. Representative image of a sensitized HLN showing B cell follicles and T cell areas. 20 µm thick. Image of magnification
General Laboratory methods Plasma analysis: Gene Expression Analysis: Immunoblot analysis: Immunohistochemistry:
 General Laboratory methods Plasma analysis: Plasma insulin (Mercodia, Sweden), leptin (duoset, R&D Systems Europe, Abingdon, United Kingdom), IL-6, TNFα and adiponectin levels (Quantikine kits, R&D Systems
alveolar macrophages (AMs) after 24 hours of in vitro culture in complete medium
 after 24 hours of in vitro culture in complete medium") Online Supplement for: NF-κB ACTIVATION IN ALVEOLAR MACROPHAGES REQUIRES IκB KINASE-β, BUT NOT NF-κB INDUCING KINASE Supershift and Competition Assays for NF-κB Competition and supershift assays were performed
Online Supplement for: NF-κB ACTIVATION IN ALVEOLAR MACROPHAGES REQUIRES IκB KINASE-β, BUT NOT NF-κB INDUCING KINASE Supershift and Competition Assays for NF-κB Competition and supershift assays were performed
Supplemental Figure S1. RANK expression on human lung cancer cells.
 Supplemental Figure S1. RANK expression on human lung cancer cells. (A) Incidence and H-Scores of RANK expression determined from IHC in the indicated primary lung cancer subgroups. The overall expression
SUPPLEMENTARY MATERIAL
 SUPPLEMENTARY MATERIAL IL-1 signaling modulates activation of STAT transcription factors to antagonize retinoic acid signaling and control the T H 17 cell it reg cell balance Rajatava Basu 1,5, Sarah K.
Supplementary Figure 1 IMQ-Induced Mouse Model of Psoriasis. IMQ cream was
 Supplementary Figure 1 IMQ-Induced Mouse Model of Psoriasis. IMQ cream was painted on the shaved back skin of CBL/J and BALB/c mice for consecutive days. (a, b) Phenotypic presentation of mouse back skin
Supplementary Figure 1. Efficiency of Mll4 deletion and its effect on T cell populations in the periphery. Nature Immunology: doi: /ni.
 Supplementary Figure 1 Efficiency of Mll4 deletion and its effect on T cell populations in the periphery. Expression of Mll4 floxed alleles (16-19) in naive CD4 + T cells isolated from lymph nodes and
Sipper BK Experimental Animal Co. (Shanghai, China) and bred in a specific. pathogen-free environment. The animal study protocol was approved by the
 and bred in a specific. pathogen-free environment. The animal study protocol was approved by the") Supplementary information, Data S1 Materials and Methods Mice, Ad vectors and reagents Female C57BL/6 mice, 8-10 weeks of age, were purchased from Joint Ventures Sipper BK Experimental Animal Co. (Shanghai,
Supplementary information, Data S1 Materials and Methods Mice, Ad vectors and reagents Female C57BL/6 mice, 8-10 weeks of age, were purchased from Joint Ventures Sipper BK Experimental Animal Co. (Shanghai,
Title. CitationCancer science, 109(4): Issue Date Doc URL. Rights(URL)
: Issue Date Doc URL. Rights(URL)") Title Toll-like receptor 3 signal augments radiation-induc Yoshida, Sumito; Shime, Hiroaki; Takeda, Yohei; Nam, Author(s) Hiroki; Kasahara, Masanori; Seya, Tsukasa CitationCancer science, 19(): 956-965
Title Toll-like receptor 3 signal augments radiation-induc Yoshida, Sumito; Shime, Hiroaki; Takeda, Yohei; Nam, Author(s) Hiroki; Kasahara, Masanori; Seya, Tsukasa CitationCancer science, 19(): 956-965
Supplementary Figure 1. H-PGDS deficiency does not affect GI tract functions and anaphylactic reaction. (a) Representative pictures of H&E-stained
 Representative pictures of H&E-stained") 1 2 3 4 5 6 7 8 9 10 11 Supplementary Figure 1. H-PGDS deficiency does not affect GI tract functions and anaphylactic reaction. (a) Representative pictures of H&E-stained jejunum sections ( 200 magnification;
1 2 3 4 5 6 7 8 9 10 11 Supplementary Figure 1. H-PGDS deficiency does not affect GI tract functions and anaphylactic reaction. (a) Representative pictures of H&E-stained jejunum sections ( 200 magnification;
Tbk1-TKO! DN cells (%)! 15! 10!
! 15! 10!") a! T Cells! TKO! B Cells! TKO! b! CD4! 8.9 85.2 3.4 2.88 CD8! Tbk1-TKO! 1.1 84.8 2.51 2.54 c! DN cells (%)! 4 3 2 1 DP cells (%)! 9 8 7 6 CD4 + SP cells (%)! 5 4 3 2 1 5 TKO! TKO! TKO! TKO! 15 1 5 CD8
a! T Cells! TKO! B Cells! TKO! b! CD4! 8.9 85.2 3.4 2.88 CD8! Tbk1-TKO! 1.1 84.8 2.51 2.54 c! DN cells (%)! 4 3 2 1 DP cells (%)! 9 8 7 6 CD4 + SP cells (%)! 5 4 3 2 1 5 TKO! TKO! TKO! TKO! 15 1 5 CD8
Supplementary Figure 1. NAFL enhanced immunity of other vaccines (a) An over-the-counter, hand-held non-ablative fractional laser (NAFL).
 An over-the-counter, hand-held non-ablative fractional laser (NAFL).") Supplementary Figure 1. NAFL enhanced immunity of other vaccines (a) An over-the-counter, hand-held non-ablative fractional laser (NAFL). (b) Depiction of a MTZ array generated by NAFL. (c-e) IgG production
Supplementary Figure 1. NAFL enhanced immunity of other vaccines (a) An over-the-counter, hand-held non-ablative fractional laser (NAFL). (b) Depiction of a MTZ array generated by NAFL. (c-e) IgG production
Supplementary Fig. 1 No relative growth advantage of Foxp3 negative cells.
 Supplementary Fig. 1 Supplementary Figure S1: No relative growth advantage of Foxp3 negative cells. itreg were induced from WT (A) or FIR (B) CD4 + T cells. FIR itregs were then removed from the TCR signal
Supplementary Figure 1: si-craf but not si-braf sensitizes tumor cells to radiation.
 Supplementary Figure 1: si-craf but not si-braf sensitizes tumor cells to radiation. (a) Embryonic fibroblasts isolated from wildtype (WT), BRAF -/-, or CRAF -/- mice were irradiated (6 Gy) and DNA damage
Impact of hyper-o-glcnacylation on apoptosis and NF-κB activity SUPPLEMENTARY METHODS
 SUPPLEMENTARY METHODS 3D culture and cell proliferation- MiaPaCa-2 cell culture in 3D was performed as described previously (1). Briefly, 8-well glass chamber slides were evenly coated with 50 µl/well
Supplemental Information
 Supplemental Information Tobacco-specific Carcinogen Induces DNA Methyltransferases 1 Accumulation through AKT/GSK3β/βTrCP/hnRNP-U in Mice and Lung Cancer patients Ruo-Kai Lin, 1 Yi-Shuan Hsieh, 2 Pinpin
Supplementary Materials for
 immunology.sciencemag.org/cgi/content/full/2/16/eaan6049/dc1 Supplementary Materials for Enzymatic synthesis of core 2 O-glycans governs the tissue-trafficking potential of memory CD8 + T cells Jossef
ANGPTL2 increases bone metastasis of breast cancer cells through. Tetsuro Masuda, Motoyoshi Endo, Yutaka Yamamoto, Haruki Odagiri, Tsuyoshi
 Masuda et al. Supplementary information for ANGPTL2 increases bone metastasis of breast cancer cells through enhancing CXCR4 signaling Tetsuro Masuda, Motoyoshi Endo, Yutaka Yamamoto, Haruki Odagiri, Tsuyoshi
Supplementary Figure 1
 CD31 FN Supplementary Figure 1 a Multivariate Cox regression analysis of predicting factors for disease-free and overall survival in 435 HNSCC patients b FN staining in whole sections of HNSCC c FN expression
Serum Amyloid A3 Gene Expression in Adipocytes is an Indicator. of the Interaction with Macrophages
 Serum Amyloid A3 Gene Expression in Adipocytes is an Indicator of the Interaction with Macrophages Yohei Sanada, Takafumi Yamamoto, Rika Satake, Akiko Yamashita, Sumire Kanai, Norihisa Kato, Fons AJ van
Primer sequences Target Sequence F Sequence R TNF-α (Tnfa) TCAGCCGATTTGCTATCTCAT A
 TCAGCCGATTTGCTATCTCAT A") Supplementary Table 1. Q- and RT-PR primers used in this study. Primer sequences Target Sequence F Sequence R TNF-α (Tnfa) TGGTTTGTTTT GTTTGGGGTTG T hemokine (- motif) ligand 5 (cl5) GTGTTTGTTT TGGTGGTG
Supplementary Table 1. Q- and RT-PR primers used in this study. Primer sequences Target Sequence F Sequence R TNF-α (Tnfa) TGGTTTGTTTT GTTTGGGGTTG T hemokine (- motif) ligand 5 (cl5) GTGTTTGTTT TGGTGGTG
SUPPLEMENTARY INFORMATION
 DOI:.38/ncb3399 a b c d FSP DAPI 5mm mm 5mm 5mm e Correspond to melanoma in-situ Figure a DCT FSP- f MITF mm mm MlanaA melanoma in-situ DCT 5mm FSP- mm mm mm mm mm g melanoma in-situ MITF MlanaA mm mm
Intracellular MHC class II molecules promote TLR-triggered innate. immune responses by maintaining Btk activation
 Intracellular MHC class II molecules promote TLR-triggered innate immune responses by maintaining Btk activation Xingguang Liu, Zhenzhen Zhan, Dong Li, Li Xu, Feng Ma, Peng Zhang, Hangping Yao and Xuetao
SUPPLEMENTARY INFORMATION. CXCR4 inhibitors could benefit to HER2 but not to Triple-Negative. breast cancer patients
 SUPPLEMENTARY INFORMATION CXCR4 inhibitors could benefit to HER2 but not to Triple-Negative breast cancer patients Lefort S. 1,2, Thuleau A. 3, Kieffer Y. 1,2, Sirven P. 1,2, Bieche I. 4, Marangoni E.
Protection against doxorubicin-induced myocardial dysfunction in mice by cardiac-specific expression of carboxyl terminus of hsp70-interacting protein
 Protection against doxorubicin-induced myocardial dysfunction in mice by cardiac-specific expression of carboxyl terminus of hsp70-interacting protein Lei Wang 1, Tian-Peng Zhang 1, Yuan Zhang 2, Hai-Lian
Cells and reagents. Synaptopodin knockdown (1) and dynamin knockdown (2)
 and dynamin knockdown (2)") Supplemental Methods Cells and reagents. Synaptopodin knockdown (1) and dynamin knockdown (2) podocytes were cultured as described previously. Staurosporine, angiotensin II and actinomycin D were all obtained
Supplemental Methods Cells and reagents. Synaptopodin knockdown (1) and dynamin knockdown (2) podocytes were cultured as described previously. Staurosporine, angiotensin II and actinomycin D were all obtained
W/T Itgam -/- F4/80 CD115. F4/80 hi CD115 + F4/80 + CD115 +
 F4/8 % in the peritoneal lavage 6 4 2 p=.15 n.s p=.76 CD115 F4/8 hi CD115 + F4/8 + CD115 + F4/8 hi CD115 + F4/8 + CD115 + MHCII MHCII Supplementary Figure S1. CD11b deficiency affects the cellular responses
Title: Cytosolic DNA-mediated, STING-dependent pro-inflammatory gene. Fig. S1. STING ligands-mediated signaling response in MEFs. (A) Primary MEFs (1
 Primary MEFs (1") 1 Supporting Information 2 3 4 Title: Cytosolic DNA-mediated, STING-dependent pro-inflammatory gene induction necessitates canonical NF-κB activation through TBK1 5 6 Authors: Abe et al. 7 8 9 Supporting
1 Supporting Information 2 3 4 Title: Cytosolic DNA-mediated, STING-dependent pro-inflammatory gene induction necessitates canonical NF-κB activation through TBK1 5 6 Authors: Abe et al. 7 8 9 Supporting
Nature Immunology: doi: /ni Supplementary Figure 1. Cellularity of leukocytes and their progenitors in naive wild-type and Spp1 / mice.
 Supplementary Figure 1 Cellularity of leukocytes and their progenitors in naive wild-type and Spp1 / mice. (a, b) Gating strategies for differentiated cells including PMN (CD11b + Ly6G hi and CD11b + Ly6G
Supplemental Figure S1. A. Venn diagram depicting overlap between anti-correlated genes of
 Supplemental Figure S1. A. Venn diagram depicting overlap between anti-correlated genes of 1,000 most differentially expressed genes with NKX2-1 amplification in lung adenocarcinoma cell lines and anti-correlated
Eosinophils are required. for the maintenance of plasma cells in the bone marrow
 Eosinophils are required for the maintenance of plasma cells in the bone marrow Van Trung Chu, Anja Fröhlich, Gudrun Steinhauser, Tobias Scheel, Toralf Roch, Simon Fillatreau, James J. Lee, Max Löhning