Inhibition of fatty acid oxidation as a therapy for MYC-overexpressing triplenegative
|
|
|
- Coleen Lindsey
- 5 years ago
- Views:
Transcription
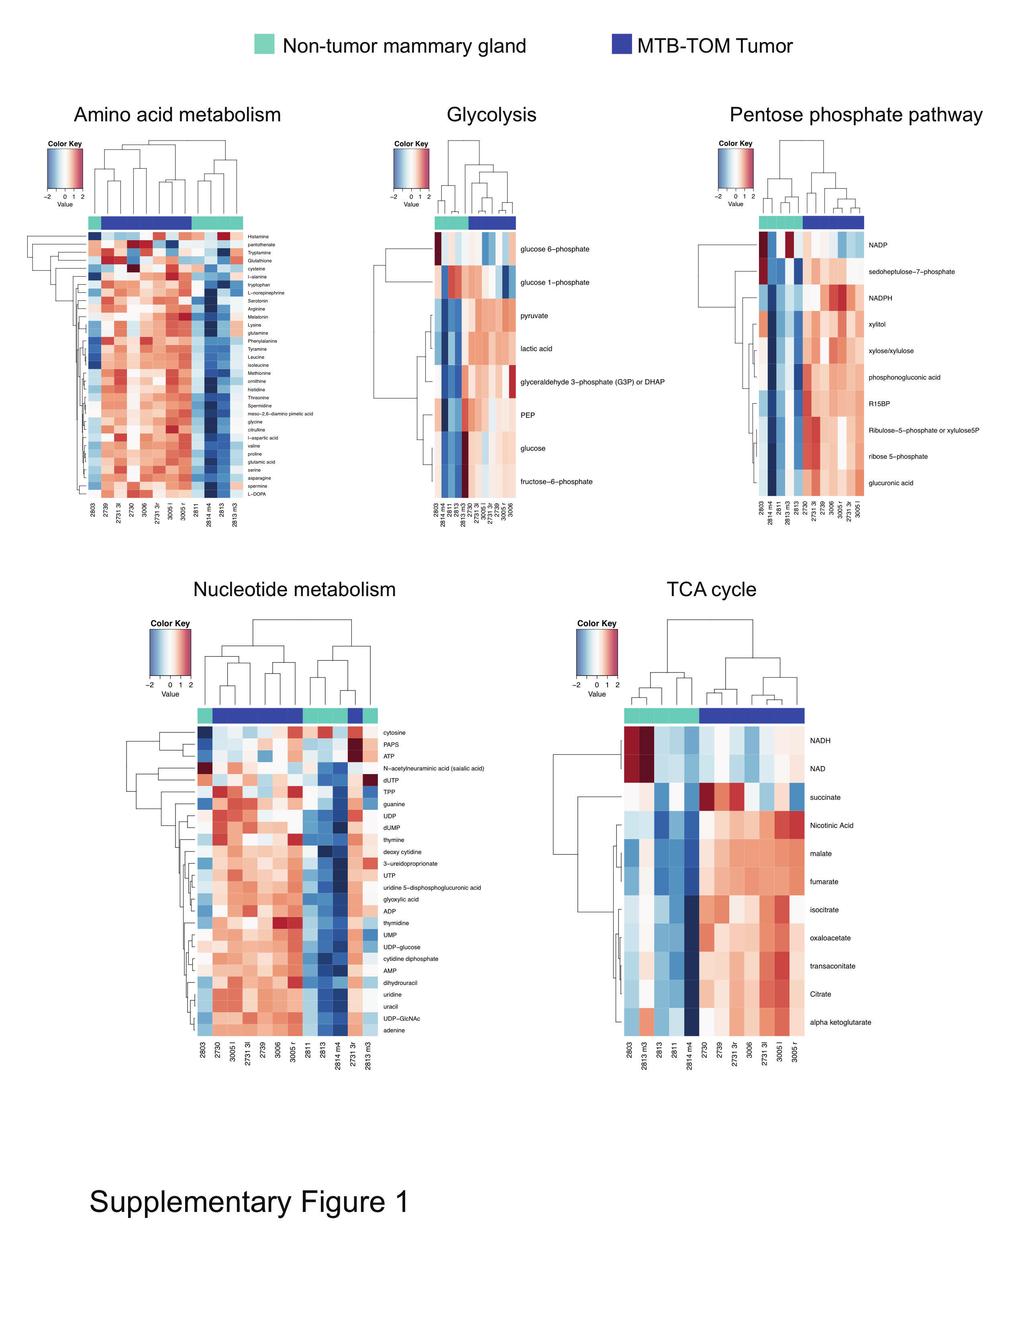
1 SUPPLEMENTARY INFORMATION Inhibition of fatty acid oxidation as a therapy for MYC-overexpressing triplenegative breast cancer Roman Camarda, Alicia Y. Zhou, Rebecca A. Kohnz, Sanjeev Balakrishnan, Celine Mahieu, Brittany Anderton, Henok Eyob, Shingo Kajimura, Aaron Tward, Gregor Krings, Daniel K. Nomura, and Andrei Goga Supplementary Table 1 Metabolomic changes in MTB-TOM tumors compared to nontumor mammary glands. All differential metabolite abundance analyses were performed using the limma R package. Supplementary Figure 1 Metabolic pathway alterations in MTB-TOM tumors compared to non-tumor mammary glands. Differential abundance of metabolites in five metabolic pathways commonly associated with tumorigenesis (amino acid, nucleotide, glycolysis, TCA cycle and pentose phosphate pathway) is shown. Detected metabolites were grouped by pathway (although many of these metabolites are intermediates in multiple pathways), and unbiased hierarchical clustering was used to display relative abundance of metabolites in MTB-TOM tumor versus non-tumor mammary gland. All differential metabolite abundance analyses were performed using the limma R package. Supplementary Table 2 List of genes associated with fatty acid metabolism by the Gene Ontology Database and their expression in TN compared to RP tumors from TCGA RNA-Seq data (771 patients). All differential gene expression analyses were performed using the limma R package. Supplementary Figure 2 Correlation analyses of TN and RP tumors to TCGA TN fatty acid metabolism centroid. A matrix of average fatty acid metabolism expression values was calculated for TCGA TN tumors. A sample-wise correlation analysis within each cohort against the TCGA TN centroid reveals the expression pattern to be significantly TN-specific (for P-values see Supplementary Table 3). Supplementary Table 3 Correlation analyses of TN and RP tumors to TCGA TN fatty acid metabolism centroid. Similarities between this centroid and gene expression profiles of samples from the four independent clinical cohorts were quantified using Pearson correlation. Supplementary Table 4 Univariate analysis indicating the effect of fatty acid metabolism gene expression on survival of all, TN and RP patients in a pooled neoadjuvant chemotherapy (taxane-anthracycline) treated cohort. Hazard ratio is Nature Medicine: doi: /nm.4055
2 associated with a one standard deviation in gene expression. P values are based on the likelihood ratio test. Supplementary Figure 3 Effect of etomoxir on TNBC cell proliferation and viability. Indicated cell types were treated with vehicle (dh 2 O) or 200 μm etomoxir for 24, 48 or 72 h. Cell growth plots showing effect of etomoxir on proliferation. Viability assay showing effect of etomoxir on viability. A two-tailed unpaired t-test was used to compare etomoxir-treated (red) to untreated (blue) cells. Values shown are mean ± s.e.m. from three biological replicates. *P 0.05 Supplementary Figure 4 Indicated cell types were treated with 30 pmol of CPT2 (M ) or non-targeting (D ) sirna pool for 72 h, then examined by immunoblotting for indicated protein expression. Supplementary Figure 5 Effects of matrix detachment on TN MYC high, TN MYC low and RP cells. Brightfield images of indicated cell lines 4 d after being seeded in ultra-low adhesion plates. After 4 d, indicated cell types were treated with 200 μm etomoxir or vehicle control for 48 h and ATP was measured. A two-tailed unpaired t-test was used to compare response of etomoxir-treated to untreated cells. Values shown are mean ± s.e.m. from five technical replicates. Number of biological replicates is indicated. ****P < Supplementary Figure 6 Effects of glucose starvation and/or etomoxir on TN MYC high, TN MYC low and RP cells. Indicated cell types were treated with glucose-depleted medium and/or 200 μm etomoxir or vehicle control for 24 h and ATP was measured. A two-tailed unpaired t-test was used to compare response of treated to untreated cells. Values shown are mean ± s.e.m. from triplicate samples. Number of biological replicates is indicated. ***P < 0.001, ****P < Supplementary Figure 7 Indicated cell types were examined by immunoblotting for indicated protein expression. Supplementary Figure 8 Indicated cell types were treated with 30 pmol of MYC (L ) or non-targeting (D ) sirna pool for 72 h, then examined by immunoblotting for indicated protein expression. Supplementary Table 5 Metabolomic changes in HCI-002 untreated tumors compared to 60 mg/kg etomoxir-treated tumors. All differential metabolite abundance analyses were performed using the limma R package. Supplementary Figure 9 Effects of etomoxir on metabolite levels in MTB-TOM tumors. MTB-TOM allografts were treated with 20 mg/kg daily via IP injection for 14 d. Fold change in metabolite levels in etomoxir-treated xenografts versus vehicle-treated tumors are shown. A two-tailed unpaired t-test was used to compare metabolite levels in etomoxir-treated to untreated tumors. Values are shown as min-to-max box plots from Nature Medicine: doi: /nm.4055
3 six mice in the control group and seven mice in the etomoxir-treated group. ^P 0.10, *P 0.05, **P < 0.01 Supplementary Table 6 Metabolomic changes in MTB-TOM untreated tumors compared to 20 mg/kg etomoxir-treated tumors. All differential metabolite abundance analyses were performed using the limma R package. Nature Medicine: doi: /nm.4055
4
5
6
7
8
9
10
11
12
Functional genomics reveal that the serine synthesis pathway is essential in breast cancer
 Functional genomics reveal that the serine synthesis pathway is essential in breast cancer Results Presented by Stacey Lin Lloyd Lab http://www.amsbio.com/expression-ready-lentiviral-particles.aspx Overview
SUPPLEMENTARY FIGURES AND TABLES
 SUPPLEMENTARY FIGURES AND TABLES Supplementary Figure S1: CaSR expression in neuroblastoma models. A. Proteins were isolated from three neuroblastoma cell lines and from the liver metastasis of a MYCN-non
SUPPLEMENTARY INFORMATION
 In the format provided by the authors and unedited. SUPPLEMENTARY INFORMATION VOLUME: 2 ARTICLE NUMBER: 17084 Metabolic anticipation in Mycobacterium tuberculosis Hyungjin Eoh, Zhe Wang, Emilie Layre,
Supplementary Figure 1. Metabolic landscape of cancer discovery pipeline. RNAseq raw counts data of cancer and healthy tissue samples were downloaded
 Supplementary Figure 1. Metabolic landscape of cancer discovery pipeline. RNAseq raw counts data of cancer and healthy tissue samples were downloaded from TCGA and differentially expressed metabolic genes
Supplementary Material. Contents include:
 Supplementary Material Contents include: 1. Supplementary Figures (p. 2-7) 2. Supplementary Figure Legends (p. 8-9) 3. Supplementary Tables (p. 10-12) 4. Supplementary Table Legends (p. 13) 1 Wellen_FigS1
PIM1 kinase inhibition as a targeted therapy against triple-negative breast tumors with elevated MYC expression
 kinase inhibition as a targeted therapy against triple-negative breast tumors with elevated expression 216 Nature America, Inc., part of Springer Nature. All rights reserved. Dai Horiuchi 1 4, Roman Camarda
EPIGENETIC RE-EXPRESSION OF HIF-2α SUPPRESSES SOFT TISSUE SARCOMA GROWTH
 EPIGENETIC RE-EXPRESSION OF HIF-2α SUPPRESSES SOFT TISSUE SARCOMA GROWTH Supplementary Figure 1. Supplementary Figure 1. Characterization of KP and KPH2 autochthonous UPS tumors. a) Genotyping of KPH2
m 6 A mrna methylation regulates AKT activity to promote the proliferation and tumorigenicity of endometrial cancer
 SUPPLEMENTARY INFORMATION Articles https://doi.org/10.1038/s41556-018-0174-4 In the format provided by the authors and unedited. m 6 A mrna methylation regulates AKT activity to promote the proliferation
Evidence for an Alternative Glycolytic Pathway in Rapidly Proliferating Cells. Matthew G. Vander Heiden, et al. Science 2010
 Evidence for an Alternative Glycolytic Pathway in Rapidly Proliferating Cells Matthew G. Vander Heiden, et al. Science 2010 Introduction The Warburg Effect Cancer cells metabolize glucose differently Primarily
Supplemental Information:
 SupplementalInformation: Content: FigureS1.AccessibilityoftheL.interrogansproteomebyLC MSanalysis. FigureS2.Functionalannotationoftheidentifiedproteins. FigureS3.DistributionofMS1 featureintensities. FigureS4.ComparisonoftheDDA
Nature Immunology: doi: /ni Supplementary Figure 1. Transcriptional program of the TE and MP CD8 + T cell subsets.
 Supplementary Figure 1 Transcriptional program of the TE and MP CD8 + T cell subsets. (a) Comparison of gene expression of TE and MP CD8 + T cell subsets by microarray. Genes that are 1.5-fold upregulated
Lentiviral Delivery of Combinatorial mirna Expression Constructs Provides Efficient Target Gene Repression.
 Supplementary Figure 1 Lentiviral Delivery of Combinatorial mirna Expression Constructs Provides Efficient Target Gene Repression. a, Design for lentiviral combinatorial mirna expression and sensor constructs.
Inhibition of TGFβ enhances chemotherapy action against triple negative breast cancer by abrogation of
 SUPPLEMENTAL DATA Inhibition of TGFβ enhances chemotherapy action against triple negative breast cancer by abrogation of cancer stem cells and interleukin-8 Neil E. Bhola 1, Justin M. Balko 1, Teresa C.
New tools bring greater understanding to cellular metabolism research
 New tools bring greater understanding to cellular metabolism research Mourad Ferhat, Ph.D, 7 Juin 2017 FDSS Users Meeting, Hamamatsu mourad.ferhat@promega.com Today s talk : focus on new cell-based assays
TEB. Id4 p63 DAPI Merge. Id4 CK8 DAPI Merge
 a Duct TEB b Id4 p63 DAPI Merge Id4 CK8 DAPI Merge c d e Supplementary Figure 1. Identification of Id4-positive MECs and characterization of the Comma-D model. (a) IHC analysis of ID4 expression in the
Supplementary Figures
 Supplementary Figures Supplementary Figure 1 DOT1L regulates the expression of epithelial and mesenchymal markers. (a) The expression levels and cellular localizations of EMT markers were confirmed by
Supplementary Figure 1: High-throughput profiling of survival after exposure to - radiation. (a) Cells were plated in at least 7 wells in a 384-well
 Cells were plated in at least 7 wells in a 384-well") Supplementary Figure 1: High-throughput profiling of survival after exposure to - radiation. (a) Cells were plated in at least 7 wells in a 384-well plate at cell densities ranging from 25-225 cells in
Supplementary Figure 1: High-throughput profiling of survival after exposure to - radiation. (a) Cells were plated in at least 7 wells in a 384-well plate at cell densities ranging from 25-225 cells in
Supplementary Materials for
 www.sciencesignaling.org/cgi/content/full/7/318/ra29/dc1 Supplementary Materials for Antagonism of EGFR and HER3 Enhances the Response to Inhibitors of the PI3K-Akt Pathway in Triple-Negative Breast Cancer
Supplementary Figure 1.TRIM33 binds β-catenin in the nucleus. a & b, Co-IP of endogenous TRIM33 with β-catenin in HT-29 cells (a) and HEK 293T cells
 and HEK 293T cells") Supplementary Figure 1.TRIM33 binds β-catenin in the nucleus. a & b, Co-IP of endogenous TRIM33 with β-catenin in HT-29 cells (a) and HEK 293T cells (b). TRIM33 was immunoprecipitated, and the amount of
Supplementary Figure 1.TRIM33 binds β-catenin in the nucleus. a & b, Co-IP of endogenous TRIM33 with β-catenin in HT-29 cells (a) and HEK 293T cells (b). TRIM33 was immunoprecipitated, and the amount of
Effects of UBL5 knockdown on cell cycle distribution and sister chromatid cohesion
 Supplementary Figure S1. Effects of UBL5 knockdown on cell cycle distribution and sister chromatid cohesion A. Representative examples of flow cytometry profiles of HeLa cells transfected with indicated
SUPPLEMENTARY INFORMATION
 SUPPLEMENTARY INFORMATION doi:10.1038/nature22359 Supplementary Discussion KRAS and regulate central carbon metabolism, including pathways supplied by abundant fuels like glucose and glutamine. Under control
Supplementary Figure 1
 Supplementary Figure 1 A B mir-141, human cell lines mir-2c, human cell lines mir-141, hepatocytes mir-2c, hepatocytes Relative RNA.1.8.6.4.2 Relative RNA.3.2.1 Relative RNA 1.5 1..5 Relative RNA 2. 1.5
Supplementary Information
 Supplementary Information mediates STAT3 activation at retromer-positive structures to promote colitis and colitis-associated carcinogenesis Zhang et al. a b d e g h Rel. Luc. Act. Rel. mrna Rel. mrna
Supplementary Figure 1 ITGB1 and ITGA11 increase with evidence for heterodimers following HSC activation. (a) Time course of rat HSC activation
 Time course of rat HSC activation") Supplementary Figure 1 ITGB1 and ITGA11 increase with evidence for heterodimers following HSC activation. (a) Time course of rat HSC activation indicated by the detection of -SMA and COL1 (log scale).
Supplementary Figure 1 ITGB1 and ITGA11 increase with evidence for heterodimers following HSC activation. (a) Time course of rat HSC activation indicated by the detection of -SMA and COL1 (log scale).
Supplementary Figure 1: Tissue of Origin analysis on 152 cell lines. (a) Heatmap representation of the 30 Tissue scores for the 152 cell lines.
 Heatmap representation of the 30 Tissue scores for the 152 cell lines.") Supplementary Figure 1: Tissue of Origin analysis on 152 cell lines. (a) Heatmap representation of the 30 Tissue scores for the 152 cell lines. The scores summarize the global expression of the tissue
Supplementary Figure 1: Tissue of Origin analysis on 152 cell lines. (a) Heatmap representation of the 30 Tissue scores for the 152 cell lines. The scores summarize the global expression of the tissue
Supplementary Figure 1. Repression of hepcidin expression in the liver of mice treated with
 Supplementary Figure 1. Repression of hepcidin expression in the liver of mice treated with DMN Immunohistochemistry for hepcidin and H&E staining (left). qrt-pcr assays for hepcidin in the liver (right).
Pharmacologic inhibition of histone demethylation as a therapy for pediatric brainstem glioma
 Supplementary information for: Pharmacologic inhibition of histone demethylation as a therapy for pediatric brainstem glioma Rintaro Hashizume 1, Noemi Andor 2, Yuichiro Ihara 2, Robin Lerner 2, Haiyun
Rescue of mutant rhodopsin traffic by metformin-induced AMPK activation accelerates photoreceptor degeneration Athanasiou et al
 Supplementary Material Rescue of mutant rhodopsin traffic by metformin-induced AMPK activation accelerates photoreceptor degeneration Athanasiou et al Supplementary Figure 1. AICAR improves P23H rod opsin
Application Note. Introduction
 Simultaneously Measuring Oxidation of Exogenous and Endogenous Fatty Acids Using the XF Palmitate-BSA FAO Substrate with the Agilent Seahorse XF Cell Mito Stress Test Application Note Introduction The
Nature Immunology: doi: /ni Supplementary Figure 1. RNA-Seq analysis of CD8 + TILs and N-TILs.
 Supplementary Figure 1 RNA-Seq analysis of CD8 + TILs and N-TILs. (a) Schematic representation of the tumor and cell types used for the study. HNSCC, head and neck squamous cell cancer; NSCLC, non-small
Supplementary Figure 1. A. Bar graph representing the expression levels of the 19 indicated genes in the microarrays analyses comparing human lung
 Supplementary Figure 1. A. Bar graph representing the expression levels of the 19 indicated genes in the microarrays analyses comparing human lung immortalized broncho-epithelial cells (AALE cells) expressing
Introduction to Carbohydrate metabolism
 Introduction to Carbohydrate metabolism Some metabolic pathways of carbohydrates 1- Glycolysis 2- Krebs cycle 3- Glycogenesis 4- Glycogenolysis 5- Glyconeogenesis - Pentose Phosphate Pathway (PPP) - Curi
Supplemental Figure S1. RANK expression on human lung cancer cells.
 Supplemental Figure S1. RANK expression on human lung cancer cells. (A) Incidence and H-Scores of RANK expression determined from IHC in the indicated primary lung cancer subgroups. The overall expression
Supplementary Figure 1
 Supplementary Figure 1 Asymmetrical function of 5p and 3p arms of mir-181 and mir-30 families and mir-142 and mir-154. (a) Control experiments using mirna sensor vector and empty pri-mirna overexpression
SUPPLEMENTARY INFORMATION
 DOI: 1.138/ncb3355 a S1A8 + cells/ total.1.8.6.4.2 b S1A8/?-Actin c % T-cell proliferation 3 25 2 15 1 5 T cells Supplementary Figure 1 Inter-tumoral heterogeneity of MDSC accumulation in mammary tumor
Plasma exposure levels from individual mice 4 hours post IP administration at the
 Supplemental Figure Legends Figure S1. Plasma exposure levels of MKC-3946 in mice. Plasma exposure levels from individual mice 4 hours post IP administration at the indicated dose mg/kg. Data represent
Supplementary Information
 Supplementary Information Supplementary Figure 1. Effect of mir mimics and anti-mirs on DTPs a, Representative fluorescence microscopy images of GFP vector control or mir mimicexpressing parental and DTP
c Ischemia (30 min) Reperfusion (8 w) Supplementary Figure bp 300 bp Ischemia (30 min) Reperfusion (4 h) Dox 20 mg/kg i.p.
 Reperfusion (8 w) Supplementary Figure bp 300 bp Ischemia (30 min) Reperfusion (4 h) Dox 20 mg/kg i.p.") a Marker Ripk3 +/ 5 bp 3 bp b Ischemia (3 min) Reperfusion (4 h) d 2 mg/kg i.p. 1 w 5 w Sacrifice for IF size A subset for echocardiography and morphological analysis c Ischemia (3 min) Reperfusion (8
a Marker Ripk3 +/ 5 bp 3 bp b Ischemia (3 min) Reperfusion (4 h) d 2 mg/kg i.p. 1 w 5 w Sacrifice for IF size A subset for echocardiography and morphological analysis c Ischemia (3 min) Reperfusion (8
underlying metastasis and recurrence in HNSCC, we analyzed two groups of patients. The
 Supplementary Figures Figure S1. Patient cohorts and study design. To define and interrogate the genetic alterations underlying metastasis and recurrence in HNSCC, we analyzed two groups of patients. The
Supplementary Information Titles
 Supplementary Information Titles Please list each supplementary item and its title or caption, in the order shown below. Note that we do NOT copy edit or otherwise change supplementary information, and
Supplementary Materials for
 www.sciencesignaling.org/cgi/content/full/7/310/ra11/dc1 Supplementary Materials for STAT3 Induction of mir-146b Forms a Feedback Loop to Inhibit the NF-κB to IL-6 Signaling Axis and STAT3-Driven Cancer
Supplementary Figure 1. Characterization of NMuMG-ErbB2 and NIC breast cancer cells expressing shrnas targeting LPP. NMuMG-ErbB2 cells (a) and NIC
 and NIC") Supplementary Figure 1. Characterization of NMuMG-ErbB2 and NIC breast cancer cells expressing shrnas targeting LPP. NMuMG-ErbB2 cells (a) and NIC cells (b) were engineered to stably express either a LucA-shRNA
Supplementary Figure 1. Characterization of NMuMG-ErbB2 and NIC breast cancer cells expressing shrnas targeting LPP. NMuMG-ErbB2 cells (a) and NIC cells (b) were engineered to stably express either a LucA-shRNA
Supplementary Information Titles Journal: Nature Medicine
 Supplementary Information Titles Journal: Nature Medicine Article Title: Corresponding Author: Supplementary Item & Number Supplementary Fig.1 Fig.2 Fig.3 Fig.4 Fig.5 Fig.6 Fig.7 Fig.8 Fig.9 Fig. Fig.11
Suppl. Figure 1. T 3 induces autophagic flux in hepatic cells. (A) RFP-GFP-LC3 transfected HepG2/TRα cells were visualized and cells were quantified
 RFP-GFP-LC3 transfected HepG2/TRα cells were visualized and cells were quantified") Suppl. Figure 1. T 3 induces autophagic flux in hepatic cells. (A) RFP-GFP-LC3 transfected HepG2/TRα cells were visualized and cells were quantified for RFP-LC3 puncta (red dots) representing both autolysosomes
Suppl. Figure 1. T 3 induces autophagic flux in hepatic cells. (A) RFP-GFP-LC3 transfected HepG2/TRα cells were visualized and cells were quantified for RFP-LC3 puncta (red dots) representing both autolysosomes
Human recombinat MIF protein (hrmif), MW: Da. m/z. hrmif ( Da) + 4-IPP (282 Da) MWtot ~ Da. m/z.
, MW: Da. m/z. hrmif ( Da) + 4-IPP (282 Da) MWtot ~ Da. m/z.") Intensity % Intensity % A Human recombinat MIF protein (hrmif), MW: 12428.31 Da m/z hrmif (12428.31 Da) + 4-IPP (282 Da) MWtot ~ 12715.21 Da m/z B HTC/C3 DAPI phistone-h3 Merge HTC/C3 DAPI phistone-h3
Intensity % Intensity % A Human recombinat MIF protein (hrmif), MW: 12428.31 Da m/z hrmif (12428.31 Da) + 4-IPP (282 Da) MWtot ~ 12715.21 Da m/z B HTC/C3 DAPI phistone-h3 Merge HTC/C3 DAPI phistone-h3
What is the Warburg Effect
 What is the Warburg Effect Roles nutrients play in the biochemistry of a cell Thus, proliferating cells must acquire more nutrients, convert them into biosynthetic building blocks, and coordinate the reactions
SUPPLEMENTARY INFORMATION
 doi:.38/nature8975 SUPPLEMENTAL TEXT Unique association of HOTAIR with patient outcome To determine whether the expression of other HOX lincrnas in addition to HOTAIR can predict patient outcome, we measured
ANGPTL2 increases bone metastasis of breast cancer cells through. Tetsuro Masuda, Motoyoshi Endo, Yutaka Yamamoto, Haruki Odagiri, Tsuyoshi
 Masuda et al. Supplementary information for ANGPTL2 increases bone metastasis of breast cancer cells through enhancing CXCR4 signaling Tetsuro Masuda, Motoyoshi Endo, Yutaka Yamamoto, Haruki Odagiri, Tsuyoshi
Figure S1, related to Figure 1. Escaper p38a-expressing cancer cells repopulate the tumors (A) Scheme of the mt/mg reporter that expresses a
 Scheme of the mt/mg reporter that expresses a") Cancer Cell, Volume 33 Supplemental Information Targeting p38a Increases DNA Damage, Chromosome Instability, and the Anti-tumoral Response to Taxanes in Breast Cancer Cells Begoña Cánovas, Ana Igea, Alessandro
Cancer Cell, Volume 33 Supplemental Information Targeting p38a Increases DNA Damage, Chromosome Instability, and the Anti-tumoral Response to Taxanes in Breast Cancer Cells Begoña Cánovas, Ana Igea, Alessandro
Journal: Nature Methods
 Journal: Nature Methods Article Title: Network-based stratification of tumor mutations Corresponding Author: Trey Ideker Supplementary Item Supplementary Figure 1 Supplementary Figure 2 Supplementary Figure
Supplementary Materials: Global Transcriptomic Analysis Reveals the Mechanism of Phelipanche Aegyptiaca Seed Germination
 Int. J. Mol. Sci. 2016, 17, 1139; doi:.3390/ijms17071139 S1 of S5 Supplementary Materials: Global Transcriptomic Analysis Reveals the Mechanism of Phelipanche Aegyptiaca Seed Germination Zhaoqun Yao, Fang
Supplementary Figures
 Supplementary Figures Supplementary Figure 1. Confirmation of Dnmt1 conditional knockout out mice. a, Representative images of sorted stem (Lin - CD49f high CD24 + ), luminal (Lin - CD49f low CD24 + )
T H E J O U R N A L O F C E L L B I O L O G Y
 Supplemental material Díaz et al., http://www.jcb.org/cgi/content/full/jcb.201209151/dc1 T H E J O U R N A L O F C E L L B I O L O G Y Figure S1. Hypoxia induces invadopodia formation in different epithelial
Nature Neuroscience: doi: /nn Supplementary Figure 1
 Supplementary Figure 1 EGFR inhibition activates signaling pathways (a-b) EGFR inhibition activates signaling pathways (a) U251EGFR cells were treated with erlotinib (1µM) for the indicated times followed
Supplementary Table 1. Classification of pathogenic BRCA1 mutations in prophylactic mastectomy samples
 Supplementary Table 1. Classification of pathogenic BRCA1 mutations in prophylactic mastectomy samples Patient ID Age (yrs) BIC classification * HGVS classification # 1 2 BRCA1 del exon BRCA1g.71598-?_71681+?del
Supplementary Figure 1. MLN8237 treatments show an unusual camel-back response pattern.
 Supplementary Figure 1. MLN8237 treatments show an unusual camel-ack response pattern. NCI-H1819 cells were treated with serial concentrations of MLN8237 and four days after treatment, cell viaility was
Nature Medicine: doi: /nm.4322
 1 2 3 4 5 6 7 8 9 10 11 Supplementary Figure 1. Predicted RNA structure of 3 UTR and sequence alignment of deleted nucleotides. (a) Predicted RNA secondary structure of ZIKV 3 UTR. The stem-loop structure
injected subcutaneously into flanks of 6-8 week old athymic male nude mice (LNCaP SQ) and body
 and body") SUPPLEMENTAL FIGURE LEGENDS Figure S1: Generation of ENZR Xenografts and Cell Lines: (A) 1x10 6 LNCaP cells in matrigel were injected subcutaneously into flanks of 6-8 week old athymic male nude mice (LNCaP
SUPPLEMENTAL FIGURE LEGENDS Figure S1: Generation of ENZR Xenografts and Cell Lines: (A) 1x10 6 LNCaP cells in matrigel were injected subcutaneously into flanks of 6-8 week old athymic male nude mice (LNCaP
Supplemental Figure S1A Notch1
 Supplemental Figure S1A Notch1 erage) epth of Cove ormalized De Log1(No Notch exons Figure S1: A) Relative coverage of Notch1 and Notch 2 exons in HCC2218, HCC1187, MB157, MDA-MB157 cell lines. Blue color
Supplementary Fig. 1. GPRC5A post-transcriptionally down-regulates EGFR expression. (a) Plot of the changes in steady state mrna levels versus
 Plot of the changes in steady state mrna levels versus") Supplementary Fig. 1. GPRC5A post-transcriptionally down-regulates EGFR expression. (a) Plot of the changes in steady state mrna levels versus changes in corresponding proteins between wild type and Gprc5a-/-
Supplementary Fig. 1. GPRC5A post-transcriptionally down-regulates EGFR expression. (a) Plot of the changes in steady state mrna levels versus changes in corresponding proteins between wild type and Gprc5a-/-
A. Generation and characterization of Ras-expressing autophagycompetent
 Supplemental Material Supplemental Figure Legends Fig. S1 A. Generation and characterization of Ras-expressing autophagycompetent and -deficient cell lines. HA-tagged H-ras V12 was stably expressed in
Lipid Metabolism. Remember fats?? Triacylglycerols - major form of energy storage in animals
 Remember fats?? Triacylglycerols - major form of energy storage in animals Your energy reserves: ~0.5% carbs (glycogen + glucose) ~15% protein (muscle, last resort) ~85% fat Why use fat for energy? 1 gram
Nature Genetics: doi: /ng Supplementary Figure 1
 Supplementary Figure 1 MSI2 interactors are associated with the riboproteome and are functionally relevant. (a) Coomassie blue staining of FLAG-MSI2 immunoprecipitated complexes. (b) GO analysis of MSI2-interacting
Supplementary Figure 1. DJ-1 modulates ROS concentration in mouse skeletal muscle.
 Supplementary Figure 1. DJ-1 modulates ROS concentration in mouse skeletal muscle. (a) mrna levels of Dj1 measured by quantitative RT-PCR in soleus, gastrocnemius (Gastroc.) and extensor digitorum longus
Supplementary Figure 1. Deletion of Smad3 prevents B16F10 melanoma invasion and metastasis in a mouse s.c. tumor model.
 A B16F1 s.c. Lung LN Distant lymph nodes Colon B B16F1 s.c. Supplementary Figure 1. Deletion of Smad3 prevents B16F1 melanoma invasion and metastasis in a mouse s.c. tumor model. Highly invasive growth
2.5. AMPK activity
 Supplement Fig. A 3 B phos-ampk 2.5 * Control AICAR AMPK AMPK activity (Absorbance at 45 nm) 2.5.5 Control AICAR Supplement Fig. Effects of AICAR on AMPK activation in macrophages. J774. macrophages were
5K ALDEFLUOR-positive/ CXCR1-negative. 5K ALDEFLUOR-positive/ CXCR1-positive BAAA BAAA CXCR1-APC BAAA BAAA CXCR1-APC
 A +DEAB -DEAB K ALDEFLUOR-positive/ CXCR-negative BAAA BAAA CXCR-APC B +DEAB -DEAB K ALDEFLUOR-positive/ CXCR-positive BAAA BAAA CXCR-APC C Supplemental Figure. Tumorigenicity of the ALDEFLUOR-positive/CXCR-positive
Supplementary Materials for
 www.sciencesignaling.org/cgi/content/full/8/364/ra18/dc1 Supplementary Materials for The tyrosine phosphatase (Pez) inhibits metastasis by altering protein trafficking Leila Belle, Naveid Ali, Ana Lonic,
Supplementary figure 1
 Supplementary figure 1 (A) Quantitative analysis of F-actin signal intensity in NIH3T3 cells treated with PTD4-myc- RBD. NIH3T3 cells were treated with PTD4-myc-RBD as described. Please note the increase
Profiling and Quantitation of Metabolomic Signatures for Breast Cancer Cell Progression
 Profiling and Quantitation of Metabolomic Signatures for Breast Cancer Cell Progression Henry Shion, 1 Irwin Kurland, 2 Sumanta Goswami, 2,3 David Kusin, 3 Haitao Lu, 2 Bhavapriya Vaitheesvaran, 2 John
MYC-driven inhibition of the glutamate-cysteine ligase promotes glutathione depletion in liver cancer
 Article MYC-driven inhibition of the glutamate-cysteine ligase promotes glutathione depletion in liver cancer Brittany Anderton 1,2, Roman Camarda 1,2, Sanjeev Balakrishnan 1,2, Asha Balakrishnan 1,2,3,
Lung Met 1 Lung Met 2 Lung Met Lung Met H3K4me1. Lung Met H3K27ac Primary H3K4me1
 a Gained Met-VELs 1.5 1.5 -.5 Lung Met 1 Lung Met Lung Met 3 1. Lung Met H3K4me1 Lung Met H3K4me1 1 Lung Met H3K4me1 Lung Met H3K7ac 1.5 Lung Met H3K7ac Lung Met H3K7ac.8 Primary H3K4me1 Primary H3K7ac
Supplementary Figure 1: Digitoxin induces apoptosis in primary human melanoma cells but not in normal melanocytes, which express lower levels of the
 Supplementary Figure 1: Digitoxin induces apoptosis in primary human melanoma cells but not in normal melanocytes, which express lower levels of the cardiac glycoside target, ATP1A1. (a) The percentage
SUPPLEMENTARY INFORMATION
 DOI: 10.1038/ncb3021 Supplementary figure 1 Characterisation of TIMPless fibroblasts. a) Relative gene expression of TIMPs1-4 by real time quantitative PCR (RT-qPCR) in WT or ΔTimp fibroblasts (mean ±
Supplementary Materials for
 www.sciencesignaling.org/cgi/content/full/6/283/ra57/dc1 Supplementary Materials for JNK3 Couples the Neuronal Stress Response to Inhibition of Secretory Trafficking Guang Yang,* Xun Zhou, Jingyan Zhu,
* * * * Supplementary Figure 1. DS Lv CK HSA CK HSA. CK Col-3. CK Col-3. See overleaf for figure legend. Cancer cells
 Supplementary Figure 1 Cancer cells Desmoplastic stroma Hepatocytes Pre-existing sinusoidal blood vessel New blood vessel a Normal liver b Desmoplastic HGP c Pushing HGP d Replacement HGP e f g h i DS
(A) RT-PCR for components of the Shh/Gli pathway in normal fetus cell (MRC-5) and a
 RT-PCR for components of the Shh/Gli pathway in normal fetus cell (MRC-5) and a") Supplementary figure legends Supplementary Figure 1. Expression of Shh signaling components in a panel of gastric cancer. (A) RT-PCR for components of the Shh/Gli pathway in normal fetus cell (MRC-5) and
Supplementary figure legends Supplementary Figure 1. Expression of Shh signaling components in a panel of gastric cancer. (A) RT-PCR for components of the Shh/Gli pathway in normal fetus cell (MRC-5) and
Pyruvate Alanine 0.15 *** ** ***
 SUPPLEMENTARY FIGURES Glucose ΔµM from fresh media / mg protein -1-2 -3 - -.1 -.3 -.5 Lactate Alanine Formate ΔµM from fresh media / mg protein 5 3 2 1.15.1.5.6..2.. NS-3 WT-NS G93A-NS Supplementary Figure
 DOI: 10.1038/ncb2210 b. ICAM1 ng ml -1 P = 0.0001 Small RNA (15-30nts) ng ml -1 Cell Lysate Exosome HDL Plasma HDL Normal Human HDL mirnas R = 0.45 P < 0.0001 Normal Human Exosome mirnas Figure S1. Characterization
SUPPLEMENTARY INFORMATION
 DOI: 10.1038/ncb2607 Figure S1 Elf5 loss promotes EMT in mammary epithelium while Elf5 overexpression inhibits TGFβ induced EMT. (a, c) Different confocal slices through the Z stack image. (b, d) 3D rendering
Supplementary table I. Real-time primers used in the study. The fold change was obtained by
 Supplementary table I. Real-time primers used in the study. The fold change was obtained by normalizing the gene expression number to those of HPRT, then comparing the samples to untreated or naive mice.
Supplementary Materials
 Supplementary Materials Figure S1. MTT Cell viability assay. To measure the cytotoxic potential of the oxidative treatment, the MTT [3-(4,5-dimethylthiazol- 2-yl)-2,5-diphenyl tetrazolium bromide] assay
Supplementary Figure 1
 Supplementary Figure 1 Supplementary Figure 1 Schematic depiction of the tandem Fc GDF15. Supplementary Figure 2 Supplementary Figure 2 Gfral mrna levels in the brains of both wild-type and knockout Gfral
Supplementary Fig. 1: ATM is phosphorylated in HER2 breast cancer cell lines. (A) ATM is phosphorylated in SKBR3 cells depending on ATM and HER2
 ATM is phosphorylated in SKBR3 cells depending on ATM and HER2") Supplementary Fig. 1: ATM is phosphorylated in HER2 breast cancer cell lines. (A) ATM is phosphorylated in SKBR3 cells depending on ATM and HER2 activity. Upper panel: Representative histograms for FACS
Supplementary Fig. 1: ATM is phosphorylated in HER2 breast cancer cell lines. (A) ATM is phosphorylated in SKBR3 cells depending on ATM and HER2 activity. Upper panel: Representative histograms for FACS
Class XI Chapter 14 Respiration in Plants Biology. 1. It is a biochemical process. 1. It is a physiochemical process.
 Question 1: Differentiate between (a) Respiration and Combustion (b) Glycolysis and Krebs cycle (c) Aerobic respiration and Fermentation (a) Respiration and combustion Respiration Combustion 1. It is a
hexahistidine tagged GRP78 devoid of the KDEL motif (GRP78-His) on SDS-PAGE. This
 on SDS-PAGE. This") SUPPLEMENTAL FIGURE LEGEND Fig. S1. Generation and characterization of. (A) Coomassie staining of soluble hexahistidine tagged GRP78 devoid of the KDEL motif (GRP78-His) on SDS-PAGE. This protein was expressed
SUPPLEMENTAL FIGURE LEGEND Fig. S1. Generation and characterization of. (A) Coomassie staining of soluble hexahistidine tagged GRP78 devoid of the KDEL motif (GRP78-His) on SDS-PAGE. This protein was expressed
glucose glucose 6-phospho fructose 6-phosphate fructose 1,6-bisphosphate glyceraldehyde 3-phosphate 1,3-bisphosphoglycerate 3-phosphoglycerate
 Cells glucose glucose glucose 6-phospho glycogen pentose phosphate T 1-phosphate 6-phosphate gluconate CC T CC+PD-1 pathway Isobar: fructose 1,6-diphosphate; glucose 1,6-diphosphate DHAP lactate fructose
Supplementary Figure 1. Blood glucose and insulin levels in mice during 4-day infusion.
 Supplementary Figure 1. Blood glucose and insulin levels in mice during 4-day infusion. (A-B) WT and HT mice infused with saline or glucose had overlapping achieved blood glucose and insulin levels, necessitating
Modulating Glucose Uptake in Skeletal Myotubes: Insulin Induction with Bioluminescent Glucose Uptake Analysis
 icell Skeletal Myoblasts Application Protocol Modulating Glucose Uptake in Skeletal Myotubes: Insulin Induction with Bioluminescent Glucose Uptake Analysis Introduction The skeletal muscle is one of the
SUPPLEMENTARY APPENDIX
 SUPPLEMENTARY APPENDIX 1) Supplemental Figure 1. Histopathologic Characteristics of the Tumors in the Discovery Cohort 2) Supplemental Figure 2. Incorporation of Normal Epidermal Melanocytic Signature
Control shrna#9 shrna#12. shrna#12 CD14-PE CD14-PE
 a Control shrna#9 shrna#12 c Control shrna#9 shrna#12 e Control shrna#9 shrna#12 h 14 12 CFU-E BFU-E GEMM GM b Colony number 7 6 5 4 3 2 1 6 pm A pa pc CFU-E BFU-E GEMM GM pu pgm A p pg B d f CD11b-APC
Cellular Respiration Other Metabolites & Control of Respiration. AP Biology
 Cellular Respiration Other Metabolites & Control of Respiration Cellular respiration: Beyond glucose: Other carbohydrates: Glycolysis accepts a wide range of carbohydrates fuels. polysaccharides glucose
 Question 1: Differentiate between (a) Respiration and Combustion (b) Glycolysis and Krebs cycle (c) Aerobic respiration and Fermentation (a) Respiration and combustion Respiration Combustion 1. It is a
Supplementary information
 Supplementary information High fat diet-induced changes of mouse hepatic transcription and enhancer activity can be reversed by subsequent weight loss Majken Siersbæk, Lyuba Varticovski, Shutong Yang,
J. A. Mayfield et al. FIGURE S1. Methionine Salvage. Methylthioadenosine. Methionine. AdoMet. Folate Biosynthesis. Methylation SAH.
 FIGURE S1 Methionine Salvage Methionine Methylthioadenosine AdoMet Folate Biosynthesis Methylation SAH Homocysteine Homocystine CBS Cystathionine Cysteine Glutathione Figure S1 Biochemical pathway of relevant
CANCER THERAPEUTICS: A NOVEL APPROACH
 CANCER THERAPEUTICS: A NOVEL APPROACH Mary Dwyer, Ph.D. HBRI and ChemRegen, Inc. SCDMDG Meeting October 23, 212 Outline Introduction Hit, HBRI1: identification & characterization Leads, HBRI2 & HBRI3:
Chapter 22. Before the class. 10 Steps of glycolysis. Outline. Can you tell the ten steps of glycolysis? Do you know how glucoses are
 Chapter 22 Gluconeogenesis, Glycogen metabolism, and the Pentose Phosphate Pathway Reginald H. Garrett Charles M. Grisham 1 Before the class Can you tell the ten steps of glycolysis? Do you know how glucoses
fasting blood glucose [mg/dl]
![fasting blood glucose [mg/dl]](/thumbs/80/82129652.jpg "fasting blood glucose [mg/dl]") SUPPLEMENTL MTERIL Supplemental Figure I body weight [g] 5 5 5 fasting blood glucose [mg/dl] 5 5 5 C total cholesterol [mg/dl] 8 6 4 WT Has -/- Supplemental Figure I: Has-deficient mice exhibited no apparent
SUPPLEMENTL MTERIL Supplemental Figure I body weight [g] 5 5 5 fasting blood glucose [mg/dl] 5 5 5 C total cholesterol [mg/dl] 8 6 4 WT Has -/- Supplemental Figure I: Has-deficient mice exhibited no apparent
SUPPLEMENTARY MATERIAL
 SUPPLEMENTARY MATERIAL IL-1 signaling modulates activation of STAT transcription factors to antagonize retinoic acid signaling and control the T H 17 cell it reg cell balance Rajatava Basu 1,5, Sarah K.
a) List of KMTs targeted in the shrna screen. The official symbol, KMT designation,
 List of KMTs targeted in the shrna screen. The official symbol, KMT designation,") Supplementary Information Supplementary Figures Supplementary Figure 1. a) List of KMTs targeted in the shrna screen. The official symbol, KMT designation, gene ID and specifities are provided. Those highlighted
Supplementary Information Supplementary Figures Supplementary Figure 1. a) List of KMTs targeted in the shrna screen. The official symbol, KMT designation, gene ID and specifities are provided. Those highlighted