Supplemental Information. Angiocrine Factors Deployed by Tumor Vascular. Niche Induce B Cell Lymphoma Invasiveness. and Chemoresistance
|
|
|
- Gabriel Francis
- 5 years ago
- Views:
Transcription
1 Cancer Cell, Volume 25 Supplemental Information Angiocrine Factors Deployed by Tumor Vascular Niche Induce B Cell Lymphoma Invasiveness and Chemoresistance Zhongwei Cao, Bi-Sen Ding, Peipei Guo, Sharrell B. Lee, Jason M. Butler, Stephanie C. Casey, Michael Simons, Wayne Tam, Dean W. Felsher, Koji Shido, Arash Rafii, Joseph M. Scandura, and Shahin Rafii
2 Supplemental Data: 1
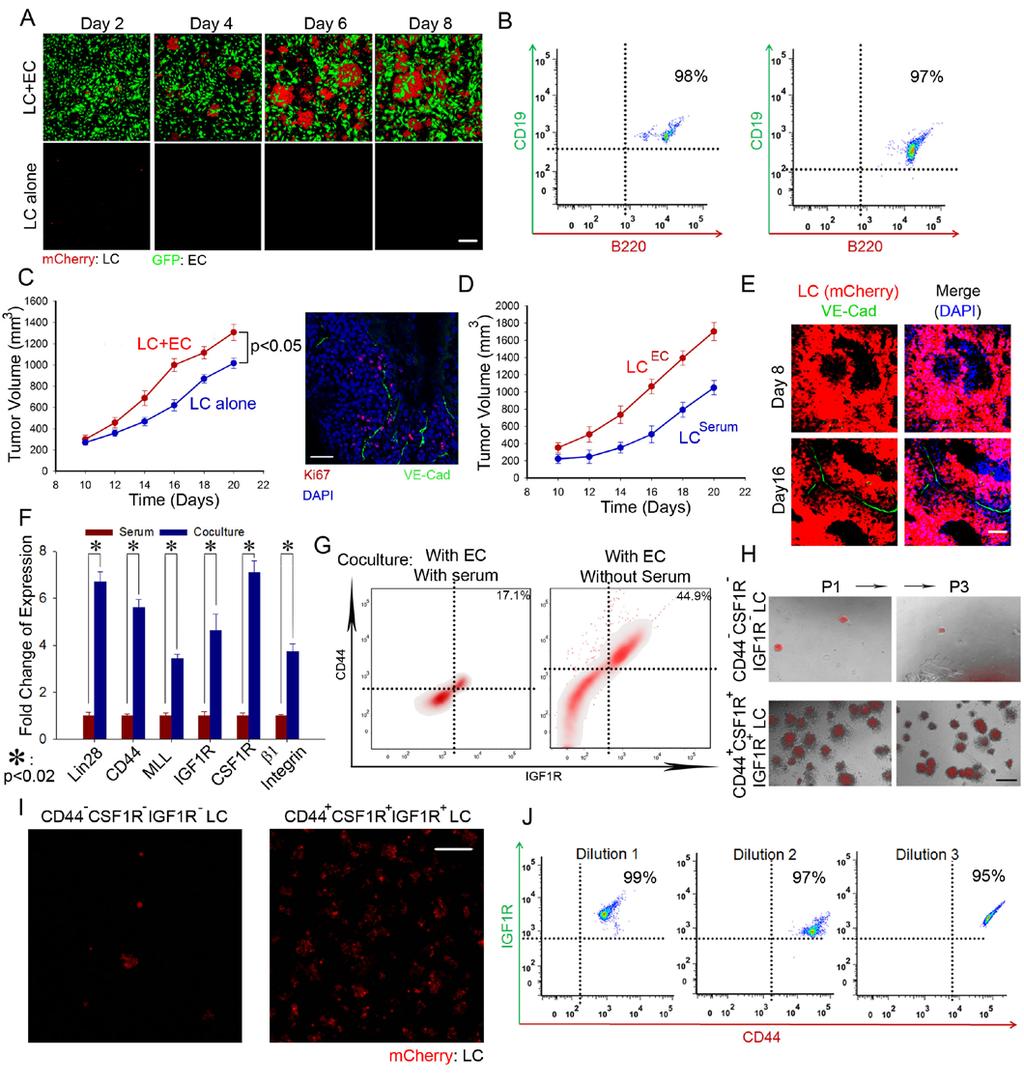
3 Figure S1 (related to Figure 1) Aggressive lymphoma initiating cell (LIC) attributes of Eµ-Myc lymphoma cells (LCs) co-cultured with endothelial cells (LC EC ) and maintained in serum supplementation (LC Serum ) (A) Representative images of time course of Myc + LCs co-cultured with monolayers of E4ORF1 transduced human umbilical cord endothelial cells (VeraVec endothelial cells)-referred here to as ECs- or cultured alone in serum-free condition. Scale bar= 200 µm. (B) Flow cytometry analysis of B cell LC marker B220 and CD19 expression in mouse Myc + LCs maintained in serum-containing condition (left panel) and EC co-culture (right panel). (C) 5x10 5 isolated Myc + LCs were subcutaneously transplanted into NSG mice alone (LC alone) or coinjected with 1x10 6 ECs (LC + EC). LCs positioned adjacent to GFP + ECs manifest increased mitosis, as evidenced by Ki67 staining (right panel). Scale bar= 50 µm. (D) Ten days after culture, retrieved LC EC and LC Serum were subcutaneously injected to wild-type C57/B6 mice (2x10 6 cells per mouse). Tumor volume was measured; n= 4. (E) 2x10 6 Myc + LCs were injected into wild type C57/B6 mice. At day 8 and 16 after injection, the lymphoma mass were stained for VE-cadherin. Note that VE-cadherin + host ECs were seen to invade the lymphoma mass on day 16 but not earlier (day 8). Scale bar= 50 µm. (F, G) Markers associated with aggressive attributes were determined in LCs after EC co-culture in serumfree or serum-supplemented condition by quantitative PCR (qpcr) (F) and flow cytometry (G), including CD44, IGF1R, and CSF1R. Expression of CD44 and IGF1R on LCs in serum containing medium without EC co-culture is shown in Figure 1J. (H) Serial colony formation of LCs in methylcellulose was assessed by randomly selecting and serially passing LC EC and LC Serum. Quantification is shown in Figure 1L. Scale bar= 500 µm. (I) Representative images of LC EC and LC Serum in response to treatment with 0.1 µg/ml doxorubicin. Quantification of growth inhibition by doxorubicin is shown in Figure 1M. Scale bar= 500 µm. (J) Flow cytometry analysis of CD44 and IGF1R expression mouse IGF1R + CD44 + CSF1R + LCs during limiting dilution transplantation. Table S1 (related to Figure 1, Provided as an Excel file) Transcriptional comparison between lymphoma cells (LCs) co-cultured with endothelial cells (ECs) and maintained in serum containing medium. 2
4 3
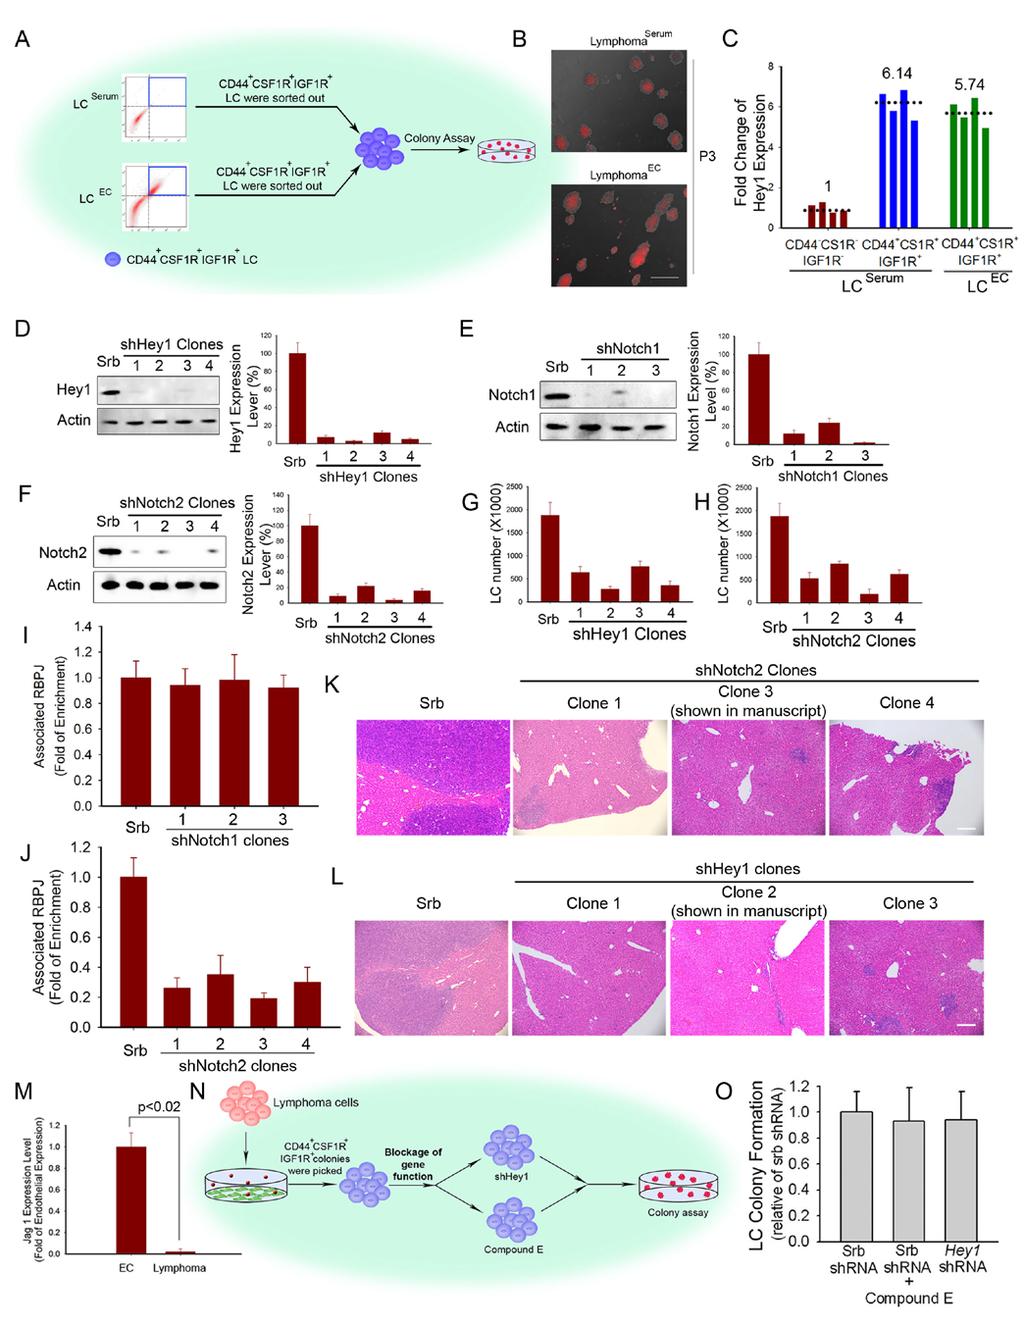
5 Figure S2 (related to Figure 2) Co-culture with ECs activates the Notch2-Hey1 pathway in indolent LCs, fostering emergence of aggressive LCs with LIC-like attributes (A, B) Serial colony forming capacity of IGF1R + CD44 + CSF1R + subset in LC EC and LC Serum was compared (A). Representative image of formed colonies in methylcellulose after serial passage 3 (P3) is shown in (B); Scale bar= 500 µm. (C) Notch effector Hey1 expression in IGF1R + CD44 + CSF1R + LC clones was compared with CD44 - IGF1R - CSF1R - LC subset in LC Serum by qpcr; n= 4. (D-F) Individual shrna clones were employed to knockdown mouse Hey1 (D), Notch1 (E), Notch2 (F). Protein level of targeted molecules was tested by immunoblot and quantified by densitometry; n= 3. (G-H) After Hey1 (G) and Notch2 (H) knockdown, LC expansion after EC co-culture was quantified; n= 3. (I-J) Effect of shrna against Notch1 (I) and Notch2 (J) on Notch signaling in LCs was compared by chromatin immunoprecipitation (ChIP) analysis of Notch downstream mediator RBPJ. (K-L) Notch2 (K) and Hey1 (L) were silenced in mouse LCs with three independent shrna constructs and intrasplenically injected into mice without EC co-culture. Hepatic lymphoma load was evaluated by H&E staining. 1x10 5 LCs were injected via spleen. Scale bar= 50 µm. (M) Expression of Jag1 in Myc + LCs express negligible level of Jag1, compared with that of ECs; n=3. (N) Approach to investigate the contribution of Notch-Hey1 in maintaining the colony forming capacity in aggressive CD44 + IGF1R + LCs. To block Notch-Hey1 pathway, CD44 + IGF1R + aggressive LCs were incubated with compound E or transduced with shhey1 after co-culture with ECs. (O) Colony formation capacity of CD44 + IGF1R + LCs with or without inhibition of Notch-Hey1 pathway was quantified; n= 3. 4
6 5
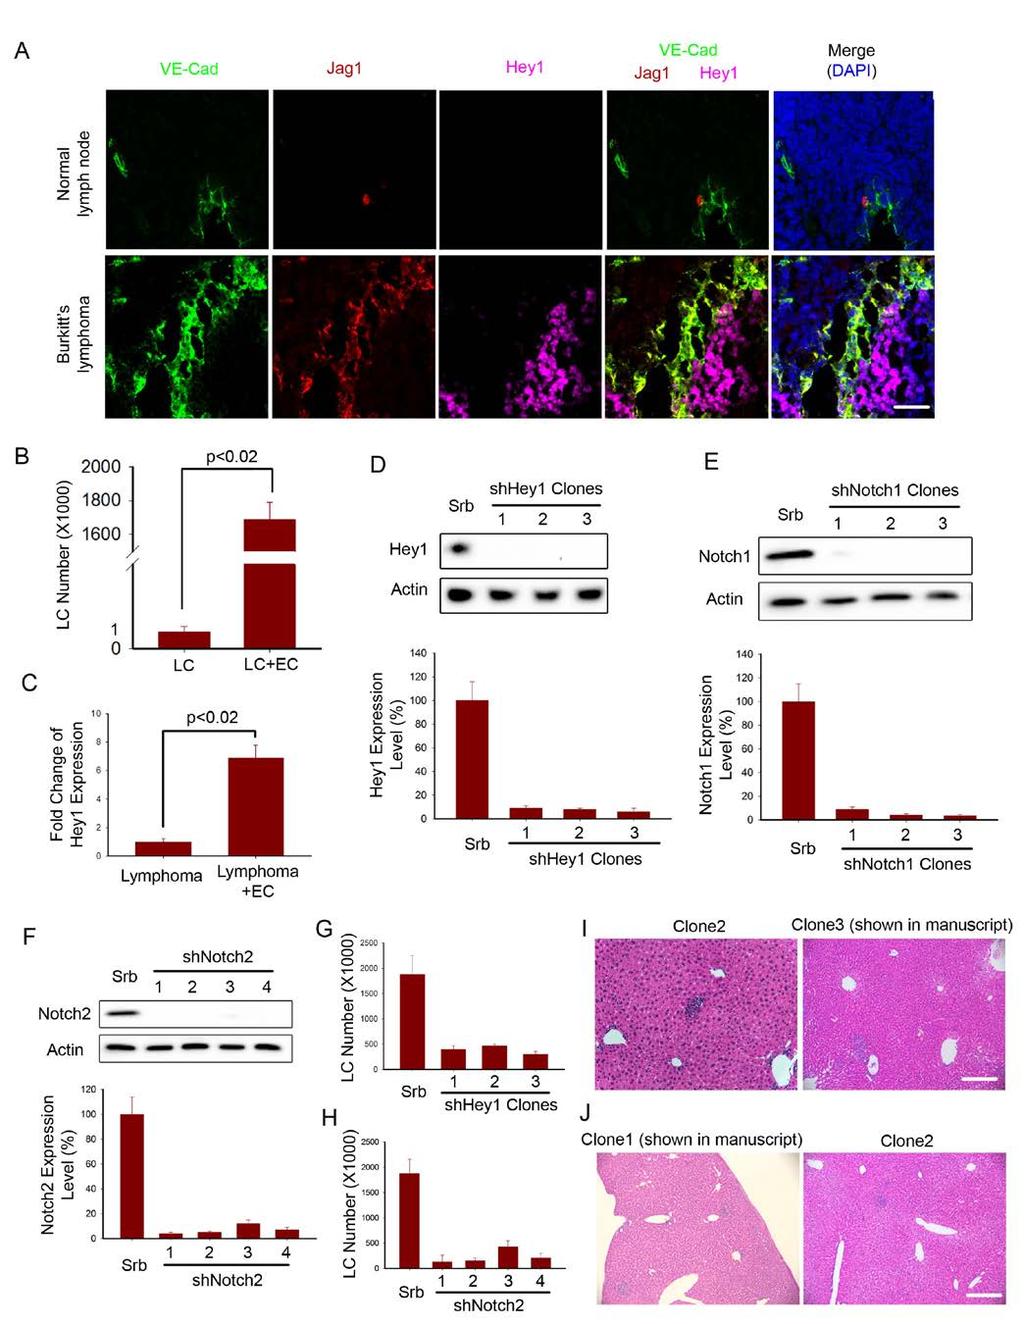
7 Figure S3 (related to Figure 3) Expression of Jag1 and Hey1 proteins in human Burkitt s lymphoma tissues (A) Jag1 expression in lymphoma tissues of Burkitt s lymphoma patients and normal lymph node. Three representative staining images of Jag1, EC-specific marker VE-cadherin, and Hey1 are shown in Figure 3A, and staining of 4 th Burkitt s lymphoma patient is shown here. Scale bar= 50 µm. (B, C) Proliferation of (B) and Hey1 expression (C) in human Burkitt s LCs harboring MYC chromosomal translocation under immunoglobulin heavy chain enhancer. Human LCs co-cultured with ECs (LC + EC group) were compared with those cultured in serum free medium (LC group); n= 4. (D-F) Efficiency of shrna-mediated knockdown of HEY1 (D), NOTCH1 (E), and NOTCH2 (F) in human Burkitt s LCs. Protein level was detected by immunoblot and quantified by densitometry. Each target gene was silenced by at least three individual shrna clones; n=3. (G-H) After knockdown of HEY1 (G) and NOTCH2 (H), expansion of human LCs after EC co-culture was determined; n=3. (I-J) HEY1 (I) and NOTCH2 (J) were silenced in human LCs with three individual shrna constructs and intrasplenically injected into mice. Hepatic lymphoma load was then compared by H&E staining. 5x10 5 human LCs were injected into the spleen of NSG mice. Scale bar= 50 µm. 6
8 Table S2 (related to Figure 3) Expression of Jagged1 and Hey1 in human Burkitt's lymphoma tissue Patient Number Age Gender Tumor site Jag1 expression in lymphoma ECs 1 Hey1 + cell percentage M Nasopharynx M Right Tonsil M Left Tonsil M Abdominal wall Jag1 + ECs in lymphoma per high power field. +++, over 60%; ++, between 40%-60%; + lower than 40%.. 2 Hey1 + lymphoma cells in lymphoma per high power field. +++, over 40%; ++, between 20%-40%; + lower than 20%.. 7
9 8
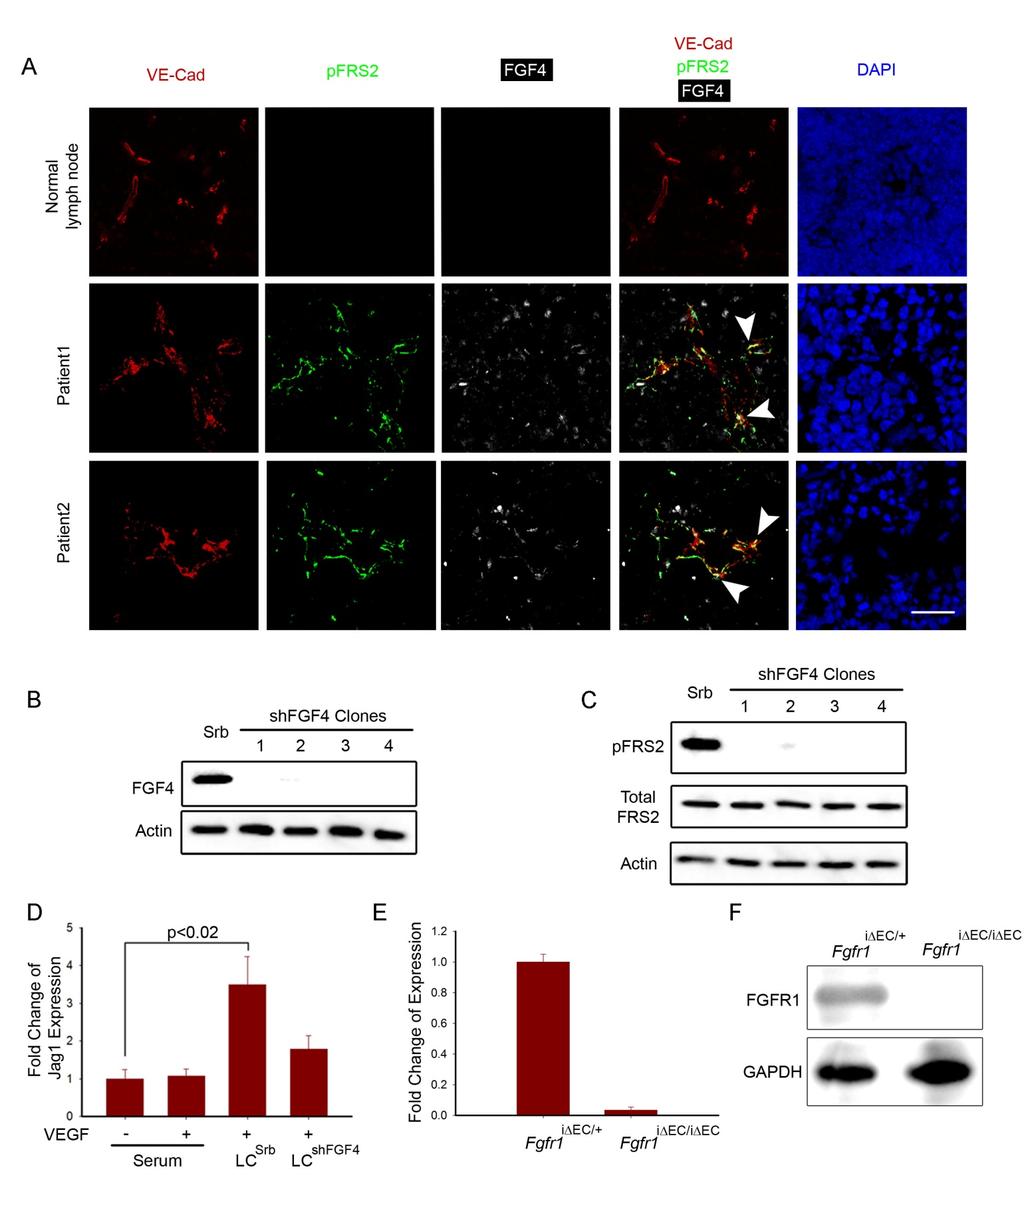
10 Figure S4 (related to Figure 4) Regulation of Jag1 expression in human ECs by FGF4 from Burkitt s LCs and inducible EC-specific deletion of Fgfr1 (Fgfr1 iδec/iδec ) in adult mice (A) FGF4 expression in two Burkitt s lymphoma patients and normal lymph node was examined by immunostaining. FGFR1 activation in lymphoma ECs was examined by immunostaining of phosphorylation/activation of downstream effector FRS2 (pfrs2). Note that pfrs2 is predominantly localized in VE-cadherin-expressing ECs (white arrow head). Scale bar= 50 µm. (B, C) FGFR1 activation in ECs co-cultured with human Burkitt s LCs was tested.fgf4 expression was knocked down in human LCs by four individual clones (B). After 2,000 LCs cells were incubated with 1x10 5 human ECs, FGFR1 activation in co-cultured human ECs was examined by immunoblot of the phosphorylation/activation of downstream effector FRS-2 (C). Scrambled (Srb) transduced human LCs were used as control. (D) Jag1 transcriptional level in human ECs maintained in serum-free medium containing 20 ng/ml VEGF- A. Mouse LCs were transduced with Srb or Fgf4 shrna and co-cultured with human ECs; n= 3. (E, F) Injection of tamoxifen into VE-Cad-Cre ERT+ Fgfr1 loxp/loxp and VE-Cad-Cre ERT+ Fgfr1 loxp/+ mice caused EC-specific deletion of Fgfr1 in adult mice (Fgfr1 iδec/iδec ). Deletion of Fgfr1 in ECs was verified by qpcr (E) and immunoblot (F) analyses. 9
 and control mice. Tumor volume was monitored; n= 4-6.")
11 Figure S5 (related to Figure 6) In vivo conversion of indolent LC subset to aggressive LCs by host ECs (A) 2x10 6 Myc + mouse LC Serum were subcutaneously injected to mice with EC-specific deletion of Jag1 (Jag1 iδec/iδec ) and control mice. Tumor volume was monitored; n= 4-6. (B) Individual LC clones were derived from both CD44 - IGF1R - CSF1R - and CD44 + IGF1R + CSF1R + subpopulations and subcutaneously injected to wild type mice. At day 28 after injection, LCs were isolated from tumor mass and analyzed for expression of CD44, IGF1R, and CSF1R. CD44 + IGF1R + CSF1R + LC clones were also transplanted as control. Representative flow cytometry graph of injected clones is shown. Each derived clone was injected into 3 mice. 10
 Vascular perfusion of Myc + Jag1 iδec/iδec and control mice was tested by intravenously injecting 50 µg isolectinb4 that binds to perfused and patent vasculature.")
12 Figure S6 (related to Figure 8) Vascular perfusion function in Eµ-Myc mice with EC-specific deletion of Jag1 (Myc + Jag1 iδec/iδec ) (A) Representative image of lymph node (arrow) in Myc + Jag1 iδec/iδec and control mice. (B, C) Vascular perfusion of Myc + Jag1 iδec/iδec and control mice was tested by intravenously injecting 50 µg isolectinb4 that binds to perfused and patent vasculature. Representative fluorescent image of isolectin and VE-cadherin staining is presented in (B), and quantification of patent ECs (isolectin + VE-cadherin + ) is shown in (C). Scale bar = 50 µm and 10 µm in inset. (D)Hypoxia in the lymphoma mass in Myc + Jag1 iδec/iδec and control mice was tested by probe Pimonidazole staining (Hypoxyprobe -1 Plus Kit, Hypoxyprobe, Inc). As control, Myc + mice were injected with VEGFR2 inhibitor SU1498 to induce hypoxia in enlarging tumor mass. Sale bar = 50 µm. 11
13 Supplemental Experimental Procedures: Animals Fgfr1 loxp/loxp or Jag1 loxp/loxp mice were bred with VE-cadherin-Cre ERT2 (cdh5-pac-cre ERT2 ) transgenic mice to establish VE-cadherin-Cre ERT2 Fgfr1 loxp/loxp or VE-cadherin-Cre ERT2 Jag1 loxp/loxp mice. Eµ-Myc mice were crossed with VE-cadherin-Cre ERT2 Fgfr1 loxp/loxp or VE-cadherin-Cre ERT2 Jag1 loxp/loxp mice to generate Myc + VE-cadherin-Cre ERT2 Fgfr1 loxp/loxp or Myc + VE-cadherin-Cre ERT2 Jag1 loxp/loxp mice.ecspecific deletion of Fgfr1 or Jag1 was induced by treating mice with tamoxifen at a dose of 250 mg/kg i.p. for 6 days interrupted for 3 days after the third dose, resulting in EC-specific gene deletion in lymphoma mice (Myc + Fgfr1 iδec/iδec or Myc + Jag1 iδec/iδec ).Transgenic Notch Reporter (TNR) mice were crossed with Myc + Jag1 loxp/loxp mice to analyze Notch pathway activity upon EC-specific deletion of Jag1. Deletion of target genes in tumor ECs was corroborated by quantitative PCR and immunoblot analysis. All animal experiments were carried out under the guidelines set by Institutional Animal Care and Use Committee at Weill Cornell Medical College. Co-culture of lymphoma cells (LCs) with VeraVec endothelial cells in serum/growth factor-free condition For serum/growth factor-free co-culture experiments, wild-type (WT) endothelial cells (ECs) or E4ORF1 transduced human umbilical endothelial cells (VeraVec ECs) in which Jag1 was knocked down by shrna (EC shjag1 ) were plated in 6 well plate at 1x10 5 cells/well. VeraVec ECs are cultivated without the confounding factors associated with the use of serum or exogenous recombinant angiogenic factors, including VEGF-A and FGF-2 as well as without supplementation with bovine brain extracts or xenobiotic factors. As such, VeraVec ECs sustain their native vascular niche attributes and supply the physiological levels of angiocrine factors necessary for the unbiased growth of the tumor cells. LCs isolated from Eµ- 12
14 Myc mice were seeded on top of the monolayer formed by WT ECs or EC shjag1 at 1000 cells/well. After 8 or 12 days after co-culture, the number of LCs was quantified by flow cytometric analysis. VeraVec ECs are referred here for simplicity as ECs. Inhibition of Notch pathway in LCs and Notch ligand Jag1 in ECs: shrna-mediated gene knockdown was utilized to selectively knock down Notch ligand (Jag1) and receptors (Notch1, 2) in VeraVec ECs and LCs, respectively. Human Notch1 was silenced by clones TRCN , TRCN , TRCN , and Notch2 was knocked down with clones TRCN , TRCN , TRCN , TRCN shrna clones targeting human Hey1, TRCN , TRCN , and TRCN were utilized. For mouse Hey1 knock down, we utilized shrna Clones: TRCN , TRCN , TRCN , TRCN Mouse Notch1 was knocked down with shrna Clones: TRCN , TRCN , TRCN Mouse Notch2 was silenced by clones: TRCN , TRCN , TRCN , and TRCN Lentiviruses were generated by cotransfecting 15 μg of shuttle lentiviral vector containing target gene or scrambled shrna, 3 μg of penv/vsv-g, 5 μg of prre, and 2.5 μg of prsv-rev in 293T cells by the calcium precipitation method. Viral supernatants were concentrated by ultracentrifugation and used to transduce HUVECs or LCs. γ- secretase inhibitor compound E was utilized to abolish Notch pathway activation in LCs. LCs were incubated with 1 µm compound E before injection into mice or co-culture with ECs. Compound E was injected to mice at 2 mg/kg. Detection of Notch2 activation in LCs Cultured LCs were retrieved from either serum containing medium or co-culture with serum/growth factorfree VeraVec ECs. Notch activation was detected by translocation of ICD of Notch 1 and 2. Notch 1 and 2 ICDs were detected by both immunostaining and immunoblot. Antibody detecting Notch1 ICD was from 13
15 Cell signaling, Notch 2 ICD was examined by antibody from Abcam. For ICD staining, retrieved LCs were cytospun onto glass slides and fixed with 4% paraformaldehyde. After rehydratation for 10 min at room temperature in PBS containing 10% bovine serum albumin, cells were incubated with primary antibodies and secondary antibody conjugated with fluorescent dyes. After nuclear countstaining with DAPI, cells were washed, mounted under glass and analyzed by confocal microscopy. Chromatin immunoprecipitation (ChIP) analysis was utilized to test the activation of RBPJ. ChIP was performed with antibody recognizing RBPJ (Cell Signaling, Cat. No. 5313). Cells were fixed in 1% formaldehyde for 9 min, washed in PBS and quenched with ph 8 Glycine solution (125 mm final concentration). ChIP was performed with Chromatin IP kit (Cell signaling). Different groups of LCs with knockdown of Notch1, Notch2, and inhibition of γ-secretase inhibitor compound E were compared. Flow cytometry Labeled LCs were measured by LSRII flow cytometer (Beckton Dickenson); compensation for multivariate experiments was carried out with FACS Diva software (Becton Dickinson Immunocytometry Systems). Flow cytometry analysis was performed using various controls, including isotype antibodies and unstained LCs for determining gates and compensations in flow cytometry. 14
Angiocrine Factors Deployed by Tumor Vascular Niche Induce B Cell Lymphoma Invasiveness and Chemoresistance
 Article Angiocrine Factors Deployed by Tumor Vascular Niche Induce B Cell Lymphoma Invasiveness and Chemoresistance Zhongwei Cao, 1 Bi-Sen Ding, 1, * Peipei Guo, 1 Sharrell B. Lee, 1 Jason M. Butler, 1
Supplementary Figure 1: Expression of NFAT proteins in Nfat2-deleted B cells (a+b) Protein expression of NFAT2 (a) and NFAT1 (b) in isolated splenic
 Protein expression of NFAT2 (a) and NFAT1 (b) in isolated splenic") Supplementary Figure 1: Expression of NFAT proteins in Nfat2-deleted B cells (a+b) Protein expression of NFAT2 (a) and NFAT1 (b) in isolated splenic B cells from WT Nfat2 +/+, TCL1 Nfat2 +/+ and TCL1 Nfat2
Supplementary Figure 1: Expression of NFAT proteins in Nfat2-deleted B cells (a+b) Protein expression of NFAT2 (a) and NFAT1 (b) in isolated splenic B cells from WT Nfat2 +/+, TCL1 Nfat2 +/+ and TCL1 Nfat2
(a) Significant biological processes (upper panel) and disease biomarkers (lower panel)
 Significant biological processes (upper panel) and disease biomarkers (lower panel)") Supplementary Figure 1. Functional enrichment analyses of secretomic proteins. (a) Significant biological processes (upper panel) and disease biomarkers (lower panel) 2 involved by hrab37-mediated secretory
Supplementary Figure 1. Functional enrichment analyses of secretomic proteins. (a) Significant biological processes (upper panel) and disease biomarkers (lower panel) 2 involved by hrab37-mediated secretory
Supplemental Table S1
 Supplemental Table S. Tumorigenicity and metastatic potential of 44SQ cell subpopulations a Tumorigenicity b Average tumor volume (mm ) c Lung metastasis d CD high /4 8. 8/ CD low /4 6./ a Mice were injected
Supplemental Figure 1. Intracranial transduction of a modified ptomo lentiviral vector in the mouse
 Supplemental figure legends Supplemental Figure 1. Intracranial transduction of a modified ptomo lentiviral vector in the mouse hippocampus targets GFAP-positive but not NeuN-positive cells. (A) Stereotaxic
Supplemental Figure 1
 Supplemental Figure 1 1a 1c PD-1 MFI fold change 6 5 4 3 2 1 IL-1α IL-2 IL-4 IL-6 IL-1 IL-12 IL-13 IL-15 IL-17 IL-18 IL-21 IL-23 IFN-α Mut Human PD-1 promoter SBE-D 5 -GTCTG- -1.2kb SBE-P -CAGAC- -1.kb
Suppl Video: Tumor cells (green) and monocytes (white) are seeded on a confluent endothelial
 and monocytes (white) are seeded on a confluent endothelial") Supplementary Information Häuselmann et al. Monocyte induction of E-selectin-mediated endothelial activation releases VE-cadherin junctions to promote tumor cell extravasation in the metastasis cascade
Supplementary Information Häuselmann et al. Monocyte induction of E-selectin-mediated endothelial activation releases VE-cadherin junctions to promote tumor cell extravasation in the metastasis cascade
Supplementary Materials for
 www.sciencetranslationalmedicine.org/cgi/content/full/4/117/117ra8/dc1 Supplementary Materials for Notch4 Normalization Reduces Blood Vessel Size in Arteriovenous Malformations Patrick A. Murphy, Tyson
Supplementary Figure 1. EC-specific Deletion of Snail1 Does Not Affect EC Apoptosis. (a,b) Cryo-sections of WT (a) and Snail1 LOF (b) embryos at
 Cryo-sections of WT (a) and Snail1 LOF (b) embryos at") Supplementary Figure 1. EC-specific Deletion of Snail1 Does Not Affect EC Apoptosis. (a,b) Cryo-sections of WT (a) and Snail1 LOF (b) embryos at E10.5 were double-stained for TUNEL (red) and PECAM-1 (green).
Supplementary Figure 1. EC-specific Deletion of Snail1 Does Not Affect EC Apoptosis. (a,b) Cryo-sections of WT (a) and Snail1 LOF (b) embryos at E10.5 were double-stained for TUNEL (red) and PECAM-1 (green).
Tbk1-TKO! DN cells (%)! 15! 10!
! 15! 10!") a! T Cells! TKO! B Cells! TKO! b! CD4! 8.9 85.2 3.4 2.88 CD8! Tbk1-TKO! 1.1 84.8 2.51 2.54 c! DN cells (%)! 4 3 2 1 DP cells (%)! 9 8 7 6 CD4 + SP cells (%)! 5 4 3 2 1 5 TKO! TKO! TKO! TKO! 15 1 5 CD8
a! T Cells! TKO! B Cells! TKO! b! CD4! 8.9 85.2 3.4 2.88 CD8! Tbk1-TKO! 1.1 84.8 2.51 2.54 c! DN cells (%)! 4 3 2 1 DP cells (%)! 9 8 7 6 CD4 + SP cells (%)! 5 4 3 2 1 5 TKO! TKO! TKO! TKO! 15 1 5 CD8
Supplementary. limb. bars
 Figure 1. CD163 -/- mice exhibit a similar phenotype ass WT mice in the absence of ischemic injury. a, Laser Doppler analysiss with perfusion quantitation at baseline (n= =10 per group). b, Immunostaining
well for 2 h at rt. Each dot represents an individual mouse and bar is the mean ±
 Supplementary data: Control DC Blimp-1 ko DC 8 6 4 2-2 IL-1β p=.5 medium 8 6 4 2 IL-2 Medium p=.16 8 6 4 2 IL-6 medium p=.3 5 4 3 2 1-1 medium IL-1 n.s. 25 2 15 1 5 IL-12(p7) p=.15 5 IFNγ p=.65 4 3 2 1
Type of file: PDF Title of file for HTML: Supplementary Information Description: Supplementary Figures and Supplementary Table.
 Type of file: PDF Title of file for HTML: Supplementary Information Description: Supplementary Figures and Supplementary Tale. Type of file: VI Title of file for HTML: Supplementary Movie 1 Description:
Supplementary Figure 1: STAT3 suppresses Kras-induced lung tumorigenesis
 Supplementary Figure 1: STAT3 suppresses Kras-induced lung tumorigenesis (a) Immunohistochemical (IHC) analysis of tyrosine 705 phosphorylation status of STAT3 (P- STAT3) in tumors and stroma (all-time
Supplementary Figure 1. Efficient DC depletion in CD11c.DOG transgenic mice
 Supplementary Figure 1. Efficient DC depletion in CD11c.DOG transgenic mice (a) CD11c.DOG transgenic mice (tg) were treated with 8 ng/g body weight (b.w.) diphtheria toxin (DT) i.p. on day -1 and every
Nature Immunology: doi: /ni Supplementary Figure 1. Huwe1 has high expression in HSCs and is necessary for quiescence.
 Supplementary Figure 1 Huwe1 has high expression in HSCs and is necessary for quiescence. (a) Heat map visualizing expression of genes with a known function in ubiquitin-mediated proteolysis (KEGG: Ubiquitin
(a) Schematic diagram of the FS mutation of UVRAG in exon 8 containing the highly instable
 Schematic diagram of the FS mutation of UVRAG in exon 8 containing the highly instable") Supplementary Figure 1. Frameshift (FS) mutation in UVRAG. (a) Schematic diagram of the FS mutation of UVRAG in exon 8 containing the highly instable A 10 DNA repeat, generating a premature stop codon
Supplementary Figure 1. Frameshift (FS) mutation in UVRAG. (a) Schematic diagram of the FS mutation of UVRAG in exon 8 containing the highly instable A 10 DNA repeat, generating a premature stop codon
Supplementary Figure 1 CD4 + T cells from PKC-θ null mice are defective in NF-κB activation during T cell receptor signaling. CD4 + T cells were
 Supplementary Figure 1 CD4 + T cells from PKC-θ null mice are defective in NF-κB activation during T cell receptor signaling. CD4 + T cells were isolated from wild type (PKC-θ- WT) or PKC-θ null (PKC-θ-KO)
The toll-like receptor 4 ligands Mrp8 and Mrp14 play a critical role in the development of autoreactive CD8 + T cells
 1 SUPPLEMENTARY INFORMATION The toll-like receptor 4 ligands Mrp8 and Mrp14 play a critical role in the development of autoreactive CD8 + T cells Karin Loser 1,2,6, Thomas Vogl 2,3, Maik Voskort 1, Aloys
Supplementary Figure 1.TRIM33 binds β-catenin in the nucleus. a & b, Co-IP of endogenous TRIM33 with β-catenin in HT-29 cells (a) and HEK 293T cells
 and HEK 293T cells") Supplementary Figure 1.TRIM33 binds β-catenin in the nucleus. a & b, Co-IP of endogenous TRIM33 with β-catenin in HT-29 cells (a) and HEK 293T cells (b). TRIM33 was immunoprecipitated, and the amount of
Supplementary Figure 1.TRIM33 binds β-catenin in the nucleus. a & b, Co-IP of endogenous TRIM33 with β-catenin in HT-29 cells (a) and HEK 293T cells (b). TRIM33 was immunoprecipitated, and the amount of
SUPPLEMENTAL EXPERIMENTAL PROCEDURES
 SUPPLEMENTAL EXPERIMENTAL PROCEDURES Crystal violet assay Cells were seeded in 24-well plates and cultured in media supplemented with % FBS for 7 days. Media were then removed, plates were briefly washed
Supplemental Figures:
 Supplemental Figures: Figure 1: Intracellular distribution of VWF by electron microscopy in human endothelial cells. a) Immunogold labeling of LC3 demonstrating an LC3-positive autophagosome (white arrow)
Supplementary Fig. 1: ATM is phosphorylated in HER2 breast cancer cell lines. (A) ATM is phosphorylated in SKBR3 cells depending on ATM and HER2
 ATM is phosphorylated in SKBR3 cells depending on ATM and HER2") Supplementary Fig. 1: ATM is phosphorylated in HER2 breast cancer cell lines. (A) ATM is phosphorylated in SKBR3 cells depending on ATM and HER2 activity. Upper panel: Representative histograms for FACS
Supplementary Fig. 1: ATM is phosphorylated in HER2 breast cancer cell lines. (A) ATM is phosphorylated in SKBR3 cells depending on ATM and HER2 activity. Upper panel: Representative histograms for FACS
Type of file: PDF Size of file: 0 KB Title of file for HTML: Supplementary Information Description: Supplementary Figures
 Type of file: PDF Size of file: 0 KB Title of file for HTML: Supplementary Information Description: Supplementary Figures Supplementary Figure 1 mir-128-3p is highly expressed in chemoresistant, metastatic
Blocking antibodies and peptides. Rat anti-mouse PD-1 (29F.1A12, rat IgG2a, k), PD-
, PD-") Supplementary Methods Blocking antibodies and peptides. Rat anti-mouse PD-1 (29F.1A12, rat IgG2a, k), PD- L1 (10F.9G2, rat IgG2b, k), and PD-L2 (3.2, mouse IgG1) have been described (24). Anti-CTLA-4 (clone
Supplementary Methods Blocking antibodies and peptides. Rat anti-mouse PD-1 (29F.1A12, rat IgG2a, k), PD- L1 (10F.9G2, rat IgG2b, k), and PD-L2 (3.2, mouse IgG1) have been described (24). Anti-CTLA-4 (clone
T H E J O U R N A L O F C E L L B I O L O G Y
 T H E J O U R N A L O F C E L L B I O L O G Y Supplemental material Amelio et al., http://www.jcb.org/cgi/content/full/jcb.201203134/dc1 Figure S1. mir-24 regulates proliferation and by itself induces
Tumor suppressor Spred2 interaction with LC3 promotes autophagosome maturation and induces autophagy-dependent cell death
 www.impactjournals.com/oncotarget/ Oncotarget, Supplementary Materials 2016 Tumor suppressor Spred2 interaction with LC3 promotes autophagosome maturation and induces autophagy-dependent cell death Supplementary
Endothelial PGC 1 - α 1 mediates vascular dysfunction in diabetes
 Endothelial PGC-1α mediates vascular dysfunction in diabetes Reporter: Yaqi Zhou Date: 04/14/2014 Outline I. Introduction II. Research route & Results III. Summary Diabetes the Epidemic of the 21st Century
MATERIALS AND METHODS. Neutralizing antibodies specific to mouse Dll1, Dll4, J1 and J2 were prepared as described. 1,2 All
 MATERIALS AND METHODS Antibodies (Abs), flow cytometry analysis and cell lines Neutralizing antibodies specific to mouse Dll1, Dll4, J1 and J2 were prepared as described. 1,2 All other antibodies used
Cell isolation. Spleen and lymph nodes (axillary, inguinal) were removed from mice
 were removed from mice") Supplementary Methods: Cell isolation. Spleen and lymph nodes (axillary, inguinal) were removed from mice and gently meshed in DMEM containing 10% FBS to prepare for single cell suspensions. CD4 + CD25
Supplementary Methods: Cell isolation. Spleen and lymph nodes (axillary, inguinal) were removed from mice and gently meshed in DMEM containing 10% FBS to prepare for single cell suspensions. CD4 + CD25
SUPPLEMENTARY INFORMATION. Supplementary Figures S1-S9. Supplementary Methods
 SUPPLEMENTARY INFORMATION SUMO1 modification of PTEN regulates tumorigenesis by controlling its association with the plasma membrane Jian Huang 1,2#, Jie Yan 1,2#, Jian Zhang 3#, Shiguo Zhu 1, Yanli Wang
Supplementary Figure 1. Characterization of basophils after reconstitution of SCID mice
 Supplementary figure legends Supplementary Figure 1. Characterization of after reconstitution of SCID mice with CD4 + CD62L + T cells. (A-C) SCID mice (n = 6 / group) were reconstituted with 2 x 1 6 CD4
X P. Supplementary Figure 1. Nature Medicine: doi: /nm Nilotinib LSK LT-HSC. Cytoplasm. Cytoplasm. Nucleus. Nucleus
 a b c Supplementary Figure 1 c-kit-apc-eflu780 Lin-FITC Flt3-Linc-Kit-APC-eflu780 LSK Sca-1-PE-Cy7 d e f CD48-APC LT-HSC CD150-PerCP-cy5.5 g h i j Cytoplasm RCC1 X Exp 5 mir 126 SPRED1 SPRED1 RAN P SPRED1
SUPPLEMENTARY INFORMATION
 DOI: 10.1038/ncb3021 Supplementary figure 1 Characterisation of TIMPless fibroblasts. a) Relative gene expression of TIMPs1-4 by real time quantitative PCR (RT-qPCR) in WT or ΔTimp fibroblasts (mean ±
NK cell flow cytometric assay In vivo DC viability and migration assay
 NK cell flow cytometric assay 6 NK cells were purified, by negative selection with the NK Cell Isolation Kit (Miltenyi iotec), from spleen and lymph nodes of 6 RAG1KO mice, injected the day before with
SUPPLEMENTARY INFORMATION
 DOI: 10.1038/ncb2566 Figure S1 CDKL5 protein expression pattern and localization in mouse brain. (a) Multiple-tissue western blot from a postnatal day (P) 21 mouse probed with an antibody against CDKL5.
VEGFR2-Mediated Vascular Dilation as a Mechanism of VEGF-Induced Anemia and Bone Marrow Cell Mobilization
 Cell Reports, Volume 9 Supplemental Information VEGFR2-Mediated Vascular Dilation as a Mechanism of VEGF-Induced Anemia and Bone Marrow Cell Mobilization Sharon Lim, Yin Zhang, Danfang Zhang, Fang Chen,
Erzsebet Kokovay, Susan Goderie, Yue Wang, Steve Lotz, Gang Lin, Yu Sun, Badrinath Roysam, Qin Shen,
 Cell Stem Cell, Volume 7 Supplemental Information Adult SVZ Lineage Cells Home to and Leave the Vascular Niche via Differential Responses to SDF1/CXCR4 Signaling Erzsebet Kokovay, Susan Goderie, Yue Wang,
p = formed with HCI-001 p = Relative # of blood vessels that formed with HCI-002 Control Bevacizumab + 17AAG Bevacizumab 17AAG
 A.. Relative # of ECs associated with HCI-001 1.4 1.2 1.0 0.8 0.6 0.4 0.2 0.0 ol b p < 0.001 Relative # of blood vessels that formed with HCI-001 1.4 1.2 1.0 0.8 0.6 0.4 0.2 0.0 l b p = 0.002 Control IHC:
Fig. S1. Upregulation of K18 and K14 mrna levels during ectoderm specification of hescs. Quantitative real-time PCR analysis of mrna levels of OCT4
 Fig. S1. Upregulation of K18 and K14 mrna levels during ectoderm specification of hescs. Quantitative real-time PCR analysis of mrna levels of OCT4 (n=3 independent differentiation experiments for each
Figure S1. Generation of inducible PTEN deficient mice and the BMMCs (A) B6.129 Pten loxp/loxp mice were mated with B6.
 B6.129 Pten loxp/loxp mice were mated with B6.") Figure S1. Generation of inducible PTEN deficient mice and the BMMCs (A) B6.129 Pten loxp/loxp mice were mated with B6.129-Gt(ROSA)26Sor tm1(cre/ert2)tyj /J mice. To induce deletion of the Pten locus,
Figure S1. Generation of inducible PTEN deficient mice and the BMMCs (A) B6.129 Pten loxp/loxp mice were mated with B6.129-Gt(ROSA)26Sor tm1(cre/ert2)tyj /J mice. To induce deletion of the Pten locus,
SUPPLEMENTARY INFORMATION
 Complete but curtailed T-cell response to very-low-affinity antigen Dietmar Zehn, Sarah Y. Lee & Michael J. Bevan Supp. Fig. 1: TCR chain usage among endogenous K b /Ova reactive T cells. C57BL/6 mice
Figure S1, related to Figure 1. Escaper p38a-expressing cancer cells repopulate the tumors (A) Scheme of the mt/mg reporter that expresses a
 Scheme of the mt/mg reporter that expresses a") Cancer Cell, Volume 33 Supplemental Information Targeting p38a Increases DNA Damage, Chromosome Instability, and the Anti-tumoral Response to Taxanes in Breast Cancer Cells Begoña Cánovas, Ana Igea, Alessandro
Cancer Cell, Volume 33 Supplemental Information Targeting p38a Increases DNA Damage, Chromosome Instability, and the Anti-tumoral Response to Taxanes in Breast Cancer Cells Begoña Cánovas, Ana Igea, Alessandro
Supplemental Information. CD4 + CD25 + Foxp3 + Regulatory T Cells Promote. Th17 Cells In Vitro and Enhance Host Resistance
 Immunity, Volume 34 Supplemental Information D4 + D25 + + Regulatory T ells Promote Th17 ells In Vitro and Enhance Host Resistance in Mouse andida albicans Th17 ell Infection Model Pushpa Pandiyan, Heather
SUPPLEMENTARY FIGURES
 SUPPLEMENTARY FIGURES Supplementary Figure S1: Fibroblast-induced elongation of cancer cells requires direct contact with living fibroblasts. A. Representative images of HT29-GFP cultured in the presence
SUPPLEMENTARY INFORMATION
 a. Smo+/+ b. Smo+/+ 5.63 5.48 c. Lin- d. e. 6 5 4 3 Ter119 Mac B T Sca1 Smo+/+ 25 15 2 o BMT 2 1 5 * Supplementary Figure 1: Deletion of Smoothened does not alter the frequency of hematopoietic lineages
IL-34 is a tissue-restricted ligand of CSF1R required for the development of Langerhans cells and microglia
 Supplementary Figures IL-34 is a tissue-restricted ligand of CSF1R required for the development of Langerhans cells and microglia Yaming Wang, Kristy J. Szretter, William Vermi, Susan Gilfillan, Cristina
SUPPLEMENTARY FIGURES
 SUPPLEMENTARY FIGURES 1 Supplementary Figure 1, Adult hippocampal QNPs and TAPs uniformly express REST a-b) Confocal images of adult hippocampal mouse sections showing GFAP (green), Sox2 (red), and REST
Supplementary Data Table of Contents:
 Supplementary Data Table of Contents: - Supplementary Methods - Supplementary Figures S1(A-B) - Supplementary Figures S2 (A-B) - Supplementary Figures S3 - Supplementary Figures S4(A-B) - Supplementary
Type of file: PDF Title of file for HTML: Supplementary Information Description: Supplementary Figures
 Type of file: PDF Title of file for HTML: Supplementary Information Description: Supplementary Figures Type of file: MOV Title of file for HTML: Supplementary Movie 1 Description: NLRP3 is moving along
Supplementary Figure 1. Characterization of ALDH-positive cell population in MCF-7 cells. (a) Expression level of stem cell markers in MCF-7 cells or
 Expression level of stem cell markers in MCF-7 cells or") Supplementary Figure 1. Characterization of ALDH-positive cell population in MCF-7 cells. (a) Expression level of stem cell markers in MCF-7 cells or ALDH-positive cell population by qpcr. Data represent
Supplementary Figure 1. Characterization of ALDH-positive cell population in MCF-7 cells. (a) Expression level of stem cell markers in MCF-7 cells or ALDH-positive cell population by qpcr. Data represent
Supplementary Materials. for Garmy-Susini, et al, Integrin 4 1 signaling is required for lymphangiogenesis and tumor metastasis
 Supplementary Materials for Garmy-Susini, et al, Integrin 4 1 signaling is required for lymphangiogenesis and tumor metastasis 1 Supplementary Figure Legends Supplementary Figure 1: Integrin expression
Effective Targeting of Quiescent Chronic Myelogenous
 Cancer Cell, Volume 7 Supplemental Information Effective Targeting of Quiescent Chronic Myelogenous Leukemia Stem Cells by Histone Deacetylase Inhibitors in Combination with Imatinib Mesylate Bin Zhang,
s u p p l e m e n ta ry i n f o r m at i o n
 Figure S1 Characterization of tet-off inducible cell lines expressing GFPprogerin and GFP-wt lamin A. a, Western blot analysis of GFP-progerin- or GFP-wt lamin A- expressing cells before induction (0d)
Title of file for HTML: Supplementary Information Description: Supplementary Figures and Supplementary Table
 Title of file for HTML: Supplementary Information Description: Supplementary Figures and Supplementary Table Title of file for HTML: Peer Review File Description: Innate Scavenger Receptor-A regulates
SUPPLEMENTARY INFORMATION
 doi:10.1038/nature11095 Supplementary Table 1. Summary of the binding between Angptls and various Igdomain containing receptors as determined by flow cytometry analysis. The results were summarized from
Supplementary Figure 1. mrna expression of chitinase and chitinase-like protein in splenic immune cells. Each splenic immune cell population was
 Supplementary Figure 1. mrna expression of chitinase and chitinase-like protein in splenic immune cells. Each splenic immune cell population was sorted by FACS. Surface markers for sorting were CD11c +
% of live splenocytes. STAT5 deletion. (open shapes) % ROSA + % floxed
 % ROSA + % floxed") Supp. Figure 1. a 14 1 1 8 6 spleen cells (x1 6 ) 16 % of live splenocytes 5 4 3 1 % of live splenocytes 8 6 4 b 1 1 c % of CD11c + splenocytes (closed shapes) 8 6 4 8 6 4 % ROSA + (open shapes) % floxed
Supp. Figure 1. a 14 1 1 8 6 spleen cells (x1 6 ) 16 % of live splenocytes 5 4 3 1 % of live splenocytes 8 6 4 b 1 1 c % of CD11c + splenocytes (closed shapes) 8 6 4 8 6 4 % ROSA + (open shapes) % floxed
SUPPLEMENTARY FIGURES AND TABLE
 SUPPLEMENTARY FIGURES AND TABLE Supplementary Figure S1: Characterization of IRE1α mutants. A. U87-LUC cells were transduced with the lentiviral vector containing the GFP sequence (U87-LUC Tet-ON GFP).
TITLE: Notch in Pathological Angiogenesis and Lymphangiogenesis
 Award Number: W81XWH-10-1-0304 TITLE: Notch in Pathological Angiogenesis and Lymphangiogenesis PRINCIPAL INVESTIGATOR: Minji Kim CONTRACTING ORGANIZATION: Columbia University New York, NY 10032 REPORT
Supplementary Figure 1. Characterization of NMuMG-ErbB2 and NIC breast cancer cells expressing shrnas targeting LPP. NMuMG-ErbB2 cells (a) and NIC
 and NIC") Supplementary Figure 1. Characterization of NMuMG-ErbB2 and NIC breast cancer cells expressing shrnas targeting LPP. NMuMG-ErbB2 cells (a) and NIC cells (b) were engineered to stably express either a LucA-shRNA
Supplementary Figure 1. Characterization of NMuMG-ErbB2 and NIC breast cancer cells expressing shrnas targeting LPP. NMuMG-ErbB2 cells (a) and NIC cells (b) were engineered to stably express either a LucA-shRNA
Effective activity of cytokine-induced killer cells against autologous metastatic melanoma including cells with stemness features
 Effective activity of cytokine-induced killer cells against autologous metastatic melanoma including cells with stemness features Loretta Gammaitoni, Lidia Giraudo, Valeria Leuci, et al. Clin Cancer Res
Supplementary Figure 1. Efficiency of Mll4 deletion and its effect on T cell populations in the periphery. Nature Immunology: doi: /ni.
 Supplementary Figure 1 Efficiency of Mll4 deletion and its effect on T cell populations in the periphery. Expression of Mll4 floxed alleles (16-19) in naive CD4 + T cells isolated from lymph nodes and
Hua Tang, Weiping Cao, Sudhir Pai Kasturi, Rajesh Ravindran, Helder I Nakaya, Kousik
 SUPPLEMENTARY FIGURES 1-19 T H 2 response to cysteine-proteases requires dendritic cell-basophil cooperation via ROS mediated signaling Hua Tang, Weiping Cao, Sudhir Pai Kasturi, Rajesh Ravindran, Helder
Nature Genetics: doi: /ng Supplementary Figure 1
 Supplementary Figure 1 MSI2 interactors are associated with the riboproteome and are functionally relevant. (a) Coomassie blue staining of FLAG-MSI2 immunoprecipitated complexes. (b) GO analysis of MSI2-interacting
Control GST GST-RAP. α2-mg. 170 kda. b-actin. 42 kda LRP-1
 % of max Supplementary Figure 1 Control GST GST-RP 17 kda α2-mg 42 kda b-actin Gate: CD11c+ (DCs) Gate: F4/8+ (Mfs) IgG Cd11cCre + Lrp1 fl/fl LRP-1 Supplementary figure 1. () MDCs were pretreated with
Supplementary Figure 1
 Supplementary Figure 1 Kif1a RNAi effect on basal progenitor differentiation Related to Figure 2. Representative confocal images of the VZ and SVZ of rat cortices transfected at E16 with scrambled or Kif1a
Supplemental Figure 1
 Supplemental Figure 1 A S100A4: SFLGKRTDEAAFQKLMSNLDSNRDNEVDFQEYCVFLSCIAMMCNEFFEGFPDK Overlap: SF G DE KLM LD N D VDFQEY VFL I M N FF G PD S100A2: SFVGEKVDEEGLKKLMGSLDENSDQQVDFQEYAVFLALITVMCNDFFQGCPDR
HEK293FT cells were transiently transfected with reporters, N3-ICD construct and
 Supplementary Information Luciferase reporter assay HEK293FT cells were transiently transfected with reporters, N3-ICD construct and increased amounts of wild type or kinase inactive EGFR. Transfections
Supplementary Figures
 Supplementary Figures Supplementary Figure 1 DOT1L regulates the expression of epithelial and mesenchymal markers. (a) The expression levels and cellular localizations of EMT markers were confirmed by
SUPPLEMENTARY INFORMATION
 a c e doi:10.1038/nature10407 b d f Supplementary Figure 1. SERCA2a complex analysis. (a) Two-dimensional SDS-PAGE gels of SERCA2a complexes. A silver-stained SDSPAGE gel is shown, which reveals a 12 kda
Gladstone Institutes, University of California (UCSF), San Francisco, USA
, San Francisco, USA") Fluorescence-linked Antigen Quantification (FLAQ) Assay for Fast Quantification of HIV-1 p24 Gag Marianne Gesner, Mekhala Maiti, Robert Grant and Marielle Cavrois * Gladstone Institutes, University of
Fluorescence-linked Antigen Quantification (FLAQ) Assay for Fast Quantification of HIV-1 p24 Gag Marianne Gesner, Mekhala Maiti, Robert Grant and Marielle Cavrois * Gladstone Institutes, University of
Supplementary Figures
 Supplementary Figures Supplementary Figure 1. Confirmation of Dnmt1 conditional knockout out mice. a, Representative images of sorted stem (Lin - CD49f high CD24 + ), luminal (Lin - CD49f low CD24 + )
Supplementary Figure 1
 Supplementary Figure 1 YAP negatively regulates IFN- signaling. (a) Immunoblot analysis of Yap knockdown efficiency with sh-yap (#1 to #4 independent constructs) in Raw264.7 cells. (b) IFN- -Luc and PRDs
Impact of hyper-o-glcnacylation on apoptosis and NF-κB activity SUPPLEMENTARY METHODS
 SUPPLEMENTARY METHODS 3D culture and cell proliferation- MiaPaCa-2 cell culture in 3D was performed as described previously (1). Briefly, 8-well glass chamber slides were evenly coated with 50 µl/well
Supplementary Materials for
 www.sciencesignaling.org/cgi/content/full/8/385/ra70/dc1 Supplementary Materials for The interaction of heparan sulfate proteoglycans with endothelial transglutaminase-2 limits VEGF 165 -induced angiogenesis
Supplementary Figures
 Supplementary Figures Supplementary Fig. 1. Galectin-3 is present within tumors. (A) mrna expression levels of Lgals3 (galectin-3) and Lgals8 (galectin-8) in the four classes of cell lines as determined
BCR-ABL - LSK BCR-ABL + LKS - (%)
") Marker Clone BCR-ABL + LSK (%) BCR-ABL + LKS - (%) BCR-ABL - LSK (%) P value vs. BCR-ABL + LKS - P value vs. BCR-ABL - LSK CD2 RM2-5 12.9 ± 3.6 36.7 ± 6.5 19.3 ± 2.4 0.01 0.10 CD5 53-7.3 13.9 ± 3.2 20.8
Marker Clone BCR-ABL + LSK (%) BCR-ABL + LKS - (%) BCR-ABL - LSK (%) P value vs. BCR-ABL + LKS - P value vs. BCR-ABL - LSK CD2 RM2-5 12.9 ± 3.6 36.7 ± 6.5 19.3 ± 2.4 0.01 0.10 CD5 53-7.3 13.9 ± 3.2 20.8
Figure S1. Reduction in glomerular mir-146a levels correlate with progression to higher albuminuria in diabetic patients.
 Supplementary Materials Supplementary Figures Figure S1. Reduction in glomerular mir-146a levels correlate with progression to higher albuminuria in diabetic patients. Figure S2. Expression level of podocyte
Supplementary Figures
 Supplementary Figures Supplementary Figure 1 Increased ABHD5 expression in human colon cancer associated macrophages. (a) Murine peritoneal macrophages were treated with regular culture medium (Ctrl) or
SREBP-2 promotes stem cell-like properties and metastasis by transcriptional activation of c-myc in prostate cancer
 SREBP-2 promotes stem cell-like properties and metastasis by transcriptional activation of c-myc in prostate cancer Supplementary Material Supplementary Methods Supplementary References Supplementary Figure
Supporting Information
 Supporting Information Chan et al. 1.173/pnas.9654916 A Patient B Xenograft C * remaining feature of normal lymph node * * * D lymphocytes Infiltrating transitional carcinoma cells E Enlarged axillary
Supplementary Figure S1. PTPN2 levels are not altered in proliferating CD8+ T cells. Lymph node (LN) CD8+ T cells from C57BL/6 mice were stained with
 CD8+ T cells from C57BL/6 mice were stained with") Supplementary Figure S1. PTPN2 levels are not altered in proliferating CD8+ T cells. Lymph node (LN) CD8+ T cells from C57BL/6 mice were stained with CFSE and stimulated with plate-bound α-cd3ε (10µg/ml)
Supplementary Figure S1. PTPN2 levels are not altered in proliferating CD8+ T cells. Lymph node (LN) CD8+ T cells from C57BL/6 mice were stained with CFSE and stimulated with plate-bound α-cd3ε (10µg/ml)
Supplementary Figure S1. Venn diagram analysis of mrna microarray data and mirna target analysis. (a) Western blot analysis of T lymphoblasts (CLS)
 Western blot analysis of T lymphoblasts (CLS)") Supplementary Figure S1. Venn diagram analysis of mrna microarray data and mirna target analysis. (a) Western blot analysis of T lymphoblasts (CLS) and their exosomes (EXO) in resting (REST) and activated
Supplementary Figure S1. Venn diagram analysis of mrna microarray data and mirna target analysis. (a) Western blot analysis of T lymphoblasts (CLS) and their exosomes (EXO) in resting (REST) and activated
Supplementary Materials for
 www.advances.sciencemag.org/cgi/content/full/1/3/e1400244/dc1 Supplementary Materials for PlGF-induced VEGFR1-dependent vascular remodeling determines opposing antitumor effects and drug resistance to
Influenza virus exploits tunneling nanotubes for cell-to-cell spread
 Supplementary Information Influenza virus exploits tunneling nanotubes for cell-to-cell spread Amrita Kumar 1, Jin Hyang Kim 1, Priya Ranjan 1, Maureen G. Metcalfe 2, Weiping Cao 1, Margarita Mishina 1,
SUPPLEMENTARY INFORMATION
 DOI: 1.138/ncb3355 a S1A8 + cells/ total.1.8.6.4.2 b S1A8/?-Actin c % T-cell proliferation 3 25 2 15 1 5 T cells Supplementary Figure 1 Inter-tumoral heterogeneity of MDSC accumulation in mammary tumor
ECM1 controls T H 2 cell egress from lymph nodes through re-expression of S1P 1
 ZH, Li et al, page 1 ECM1 controls T H 2 cell egress from lymph nodes through re-expression of S1P 1 Zhenhu Li 1,4,Yuan Zhang 1,4, Zhiduo Liu 1, Xiaodong Wu 1, Yuhan Zheng 1, Zhiyun Tao 1, Kairui Mao 1,
SUPPLEMENT Supplementary Figure 1: (A) (B)
 (B)") SUPPLEMENT Supplementary Figure 1: CD4 + naïve effector T cells (CD4 effector) were labeled with CFSE, stimulated with α-cd2/cd3/cd28 coated beads (at 2 beads/cell) and cultured alone or cocultured with
SUPPLEMENT Supplementary Figure 1: CD4 + naïve effector T cells (CD4 effector) were labeled with CFSE, stimulated with α-cd2/cd3/cd28 coated beads (at 2 beads/cell) and cultured alone or cocultured with
An epithelial-to-mesenchymal transition-inducing potential of. granulocyte macrophage colony-stimulating factor in colon. cancer
 An epithelial-to-mesenchymal transition-inducing potential of granulocyte macrophage colony-stimulating factor in colon cancer Yaqiong Chen, Zhi Zhao, Yu Chen, Zhonglin Lv, Xin Ding, Renxi Wang, He Xiao,
Prolonged mitotic arrest induces a caspase-dependent DNA damage
 SUPPLEMENTARY INFORMATION Prolonged mitotic arrest induces a caspase-dependent DNA damage response at telomeres that determines cell survival Karolina O. Hain, Didier J. Colin, Shubhra Rastogi, Lindsey
Nature Immunology: doi: /ni Supplementary Figure 1. Id2 and Id3 define polyclonal T H 1 and T FH cell subsets.
 Supplementary Figure 1 Id2 and Id3 define polyclonal T H 1 and T FH cell subsets. Id2 YFP/+ (a) or Id3 GFP/+ (b) mice were analyzed 7 days after LCMV infection. T H 1 (SLAM + CXCR5 or CXCR5 PD-1 ), T FH
Supplementary Figure 1: Imaging T-ALL progression and growth in transplanted
 Supplementary Figure 1: Imaging T-ALL progression and growth in transplanted rag2e450fs fish. Monoclonal T-ALLs were serially passaged in strain fish and then used as donors (left panel). Cells were transplanted
SUPPLEMENTARY INFORMATION
 Supplementary Figures Supplementary Figure S1. Binding of full-length OGT and deletion mutants to PIP strips (Echelon Biosciences). Supplementary Figure S2. Binding of the OGT (919-1036) fragments with
Supplementary Figures
 Supplementary Figures Supplementary Figure 1 Correlation between LKB1 and YAP expression in human lung cancer samples. (a) Representative photos showing LKB1 and YAP immunohistochemical staining in human
SUPPLEMENTARY INFORMATION
 SUPPLEMENTARY INFORMATION doi:1.138/nature9814 a A SHARPIN FL B SHARPIN ΔNZF C SHARPIN T38L, F39V b His-SHARPIN FL -1xUb -2xUb -4xUb α-his c Linear 4xUb -SHARPIN FL -SHARPIN TF_LV -SHARPINΔNZF -SHARPIN
Live cell imaging of trafficking of the chaperone complex vaccine to the ER. BMDCs were incubated with ER-Tracker Red (1 M) in staining solution for
 in staining solution for") Live cell imaging of trafficking of the chaperone complex vaccine to the ER. BMDCs were incubated with ER-Tracker Red (1 M) in staining solution for 15 min at 37 C and replaced with fresh complete medium.
Live cell imaging of trafficking of the chaperone complex vaccine to the ER. BMDCs were incubated with ER-Tracker Red (1 M) in staining solution for 15 min at 37 C and replaced with fresh complete medium.
Dysregulation of Blimp1 transcriptional repressor unleashes p130cas/erbb2 breast cancer invasion (SREP T) Supplementary File
 Supplementary File") Dysregulation of Blimp1 transcriptional repressor unleashes p130cas/erbb2 breast cancer invasion (SREP-16-42496-T) Marianna Sciortino 1, Maria del Pilar Camacho Leal 1, Francesca Orso 1, Elena Grassi 1,
Dysregulation of Blimp1 transcriptional repressor unleashes p130cas/erbb2 breast cancer invasion (SREP-16-42496-T) Marianna Sciortino 1, Maria del Pilar Camacho Leal 1, Francesca Orso 1, Elena Grassi 1,
Supplementary Information and Figure legends
 Supplementary Information and Figure legends Table S1. Primers for quantitative RT-PCR Target Sequence (5 -> 3 ) Target Sequence (5 -> 3 ) DAB2IP F:TGGACGATGTGCTCTATGCC R:GGATGGTGATGGTTTGGTAG Snail F:CCTCCCTGTCAGATGAGGAC
Cells and reagents. Synaptopodin knockdown (1) and dynamin knockdown (2)
 and dynamin knockdown (2)") Supplemental Methods Cells and reagents. Synaptopodin knockdown (1) and dynamin knockdown (2) podocytes were cultured as described previously. Staurosporine, angiotensin II and actinomycin D were all obtained
Supplemental Methods Cells and reagents. Synaptopodin knockdown (1) and dynamin knockdown (2) podocytes were cultured as described previously. Staurosporine, angiotensin II and actinomycin D were all obtained