Tumor stage : I II III IV. well differentiated. moderately differentiated. adenocarcinoma. normal colon (adjacent to cancer) Log (T/H) SLAP mrna level
|
|
|
- Mae Richardson
- 5 years ago
- Views:
Transcription
 adenocarcinoma Supplementary Figure 1.")
1 moderately differentiated well differentiated Log (T/H) mrna level a Tumor stage : I II III IV N # patient b normal colon (adjacent to cancer) adenocarcinoma Supplementary Figure 1. Downregulation of expression in CRC (a) The mrna level in microdissected tumors from 17 patients with CRC classified according to the tumor stage (stage II to IV) was expressed relative to the amount found in the matching healthy tissue samples. The relative mrna expression in each patient was presented as the Log 1 T (tumor) / H (healthy tissue) ratio. (b) Paraffinembedded sectio of colonic tumor samples were examined for expression by immunohistochemistry using the anti IMG6322A antibody. Representative examples showing a decrease of immunostaining in well or moderately differentiated adenocarcinomas (right part) compared to the adjacent normal colon (left part) of the same patient. Scale bar, 4µm. Magnification iet: x2. 1
2 Relative cell migration Relative cell migration Relative cell migration OD 49nm OD 49nm OD 49nm a sh2 sh1 shluc Time (days) Time (days) Time (days) b 2. shluc sh1 sh2 Supplementary Figure 2. controls CRC cell tumorigenicity (a) affects growth of CRC cells in standard culture conditio. The optical deity (OD) at 49nm indicating the relative cell number is plotted as a function of time (mea ± SEM; n=3). (b) affects cell migration in Boyden chamber assays. Histograms show the cell migration values expressed relative to the control ( or shluc) value, arbitrarily set at 1 (mea ± SEM; n=3; p<5 Student s t test). 2
3 pcdna3 mrna level a HEK293T m b 1.2 NIH3T si sim1 sim2 Supplementary Figure 3. Efficiency of the different antimouse Slap sirnas (a) HEK293T cells were trafected with a vector expressing mouse (m) or vector alone (pcdna3). 24h after trafection, cells were trafected with various sirna sequences, listed in Supplementary Table 2, that target mouse Slap (sim) or with a nontargeting sirna sequence (si). 72h after sirna trafection, mouse protein level in cell lysates was analyzed by immunoblotting. was used as loading control. (b) NIH3T3 mouse embryonic fibroblasts were trafected with the indicated sirnas. 72h after sirna trafection, Slap mrna level was measured by qpcr (mea ± SEM; n=3). Primers used for qpcr are listed in Supplementary Table 3. 3
.")
4 py : GST pulldown GST 28 GST Coomassie blue Supplementary Figure 4. The interaction between and in vitro requires an intact SH3 domain Indicated GSTfusion protei were incubated with recombinant that has been prephosphorylated by in vitro as shown in Figure 8c (py). The levels of precipitated were analyzed by immunoblotting. Coomassie blue staining shows the amount of precipitated GSTfusion protei. 4
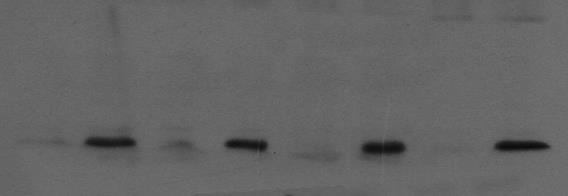
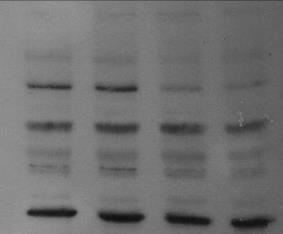
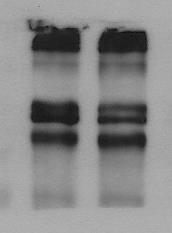
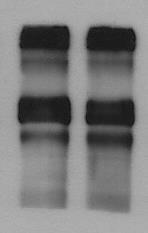
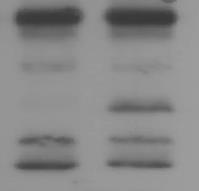
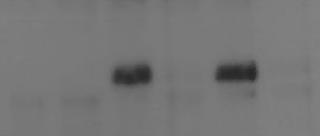
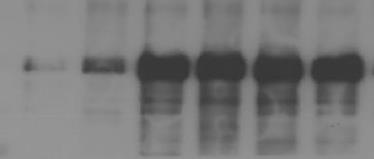
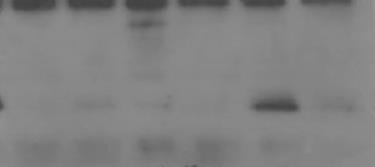
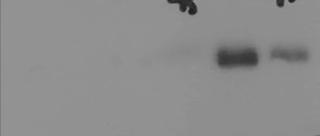
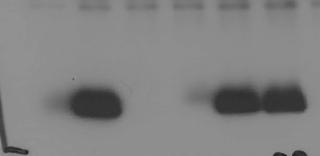
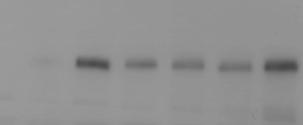
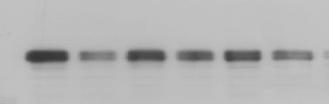
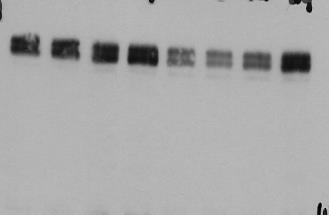
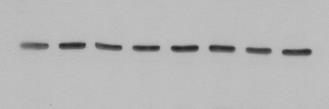
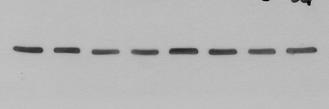
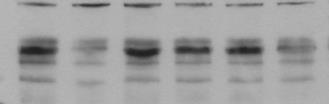
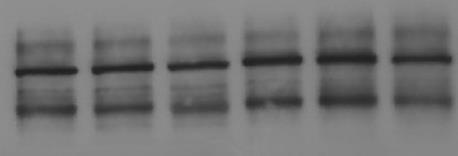
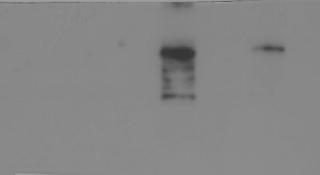
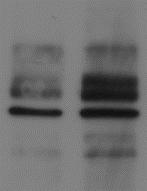
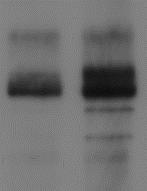
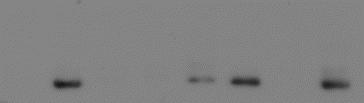
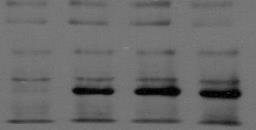
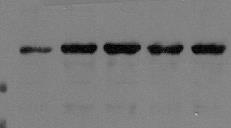
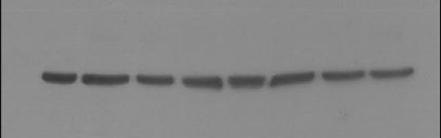
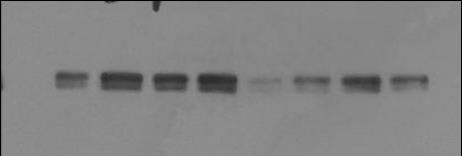
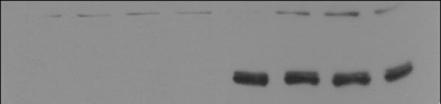
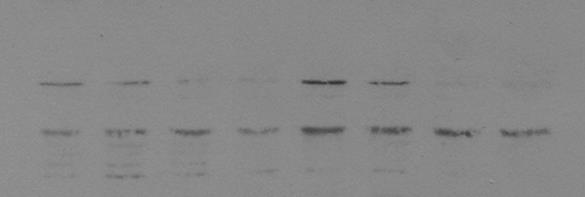
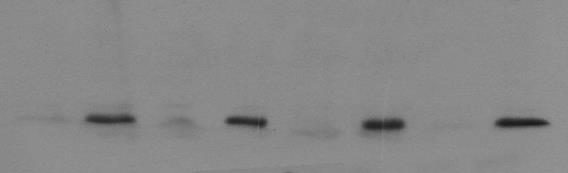
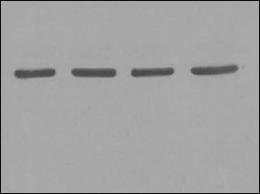
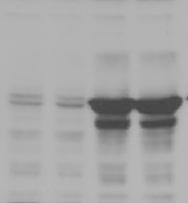
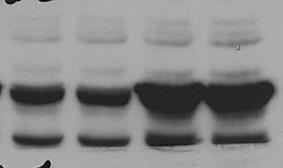
5 protein level mrna level mrna level mrna level mrna level a b H T c #3 N T #4 N T #5 N T #6 N T #8 N T #9 N T #1 N T #11 N T #14 N T #15 N T #16 N T #17 N T d Tumor xenograft : #1 #2 #3 #4 #5 #6 #1 #2 #3 #4 #5 # Supplementary Figure 5. affects the protein level in experimental CRC tumors (a) does not affect tracript level in CRC cells. mrna level was measured by qpcr in the indicated cell lines (mea ± SEM; n=3). (b) tracript level is not modified in CRC samples compared to matched normal colon tissue. mrna level was measured by qpcr in the tumor (T) and adjacent healthy tissue (H) samples of 12 patients with CRC (mea ± SEM; : not significant Student s t test). (c) The levels of and in tissue lysates obtained from the tumor (T) and adjacent healthy tissue (H) samples of 12 patients with CRC were assessed by immunoblotting. (d) expression decreases protein level but does not affect mrna level in tumor xenografts. cells that express or not () were inoculated s.c. in nude mice. After 35 days, tumors were removed. Upper panel: Immunoblot analysis of and levels in tumor lysates. Lower panels: the left graph shows the quantification of the immunoblot analysis showed in the upper panel using the ImageJ software. The middle and right graphs show and mrna levels measured by qpcr (mea ± SEM; n=6 mice/group; : not significant, p<5, p<1 Student s t test). 5
6 protein level (%) protein level (%) MG132 E64 Leupeptin Pepstatin NH4Cl Chloroquine MG132 E64 Leupeptin Pepstatin NH4Cl Chloroquine NH4Cl NH4Cl Chloroquine Chloroquine NH4Cl NH4Cl Chloroquine Chloroquine MG132 E64 Leupeptin Pepstatin MG132 E64 Leupeptin Pepstatin MG132 E64 Leupeptin Pepstatin MG132 E64 Leupeptin Pepstatin Inhibitor : Inhibitor : Inhibitor : Inhibitor : Inhibitor : Inhibitor : 51% 5% 44% 42% 43% 46% 44% 43% % 48% 45% 43% 49% 43% : : Supplementary Figure 6. induced degradation in CRC cells is independent from the lysosomal activity CRC cells expressing or not () were incubated for 24h () or 12h () in the absence () or presence of the proteasome inhibitor MG132 (5µM) or lysosome inhibitors E64 (1µM), Leupeptin (1µM), Pepstatin A (2µM), NH 4 Cl (1mM) and Chloroquine (5µM) as indicated. Upper panels: The levels of, and in lysates were analyzed by immunoblotting. Vertical black lines denote that lanes were nonadjacent in the gel. Lower panels: Histograms show the quantification of the immunoblot analysis using the ImageJ software. Data represent mea ± SEM; n=3. The percentage of degradation is indicated. 6
7 Number of colonies Relative cell invasion LTN1 mrna level UBE3C mrna level WCL IP CBL IP Flag a CBL Flag CBL Flag CBL Flag b sicbl : 95 CBL Flag sicbl : 95 CBL Flag c siube3c : Flag siube3c : d siltn1 :.6.4 Flag.2 siltn1 : e siube4a1 : siube4a2 : UBE4A 1 5 siube4a1 : siube4a2 : siube4a1 : siube4a2 : 7
8 Supplementary Figure 7. UBE4A, but not CBL, UBE3C and LTN1, mediates antioncogenic activity (a) does not interact with CBL in CRC cells. The levels of and CBL in whole cell lysates (WCL) and in samples coimmunoprecipitated (IP) with the indicated antibodies were analyzed by immunoblotting (IB). (b) dependent degradation does not require CBL. CRC cells that express or not () were trafected with sirna targeting CBL () or sirna negative control () for 72h. Cell lysates were analyzed by IB. (c) dependent degradation does not require UBE3C. cells that express or not () were trafected with sirna targeting UBE3C () or sirna negative control () for 72h. Left panel: UBE3C mrna level was measured by qpcr (mea ± SEM; n=3). Right panel: cell lysates were analyzed by IB. (d) dependent degradation does not require LTN1. cells that express or not () were trafected with sirna targeting LTN1 () or sirna negative control () for 72h. Left panel: LTN1 mrna level was measured by qpcr (mea ± SEM; n=3). Right panel: cell lysates were analyzed by IB. (e) UBE4A depletion reverses function in cells. cells that express or not () were trafected with sirnas targeting UBE4A () or sirna negative control (). Left panel: dependent degradation is mediated by UBE4A. 72h after trafection, cell lysates were analyzed by IB. Band inteity was quantified by the ImageJ software. levels were normalized to. Values are indicated. Middle panel: Soft agar colony formation assay. Right panel: Invasion assay. Data represent mea ± SEM; n=6; : not significant, p<5, p<1 (Student s t test). Molecular size markers () are shown. 8
9 protein level (%) protein level (%) a EphrinA1 : EphrinA1 : 15 39% 41% 25 61% 1 41% 48% % 5 1 : EphrinA1 : 5 sh2 : EphrinA1 : b Low deity High deity Low deity High deity Supplementary Figure 8. degradation induced by is independent from EphrinA1 binding (a) The EphrinA1 ligand induces degradation in a independent manner., and cells infected with the indicated viruses were stimulated with 1µg/ml preclustered EphrinA1Fc or Fc as a control for 15min. The levels of and were analyzed by immunoblotting. Upper panels: Representative western blots. Lower panels: Signal inteities of the blots showed in the upper panels were quantified using ImageJ. Data represent mea ± SEM; n=3. The percentage of degradation is indicated. (b) induces degradation in a ligandindependent manner. CRC cells that express or not () were plated at 1% confluence (low cell deity without cellcell contacts) or 9% confluence (high cell deity). Cell lysates were analyzed by immunoblotting with the indicated antibodies. 9
10 Number of colonies Relative cell invasion Number of colonies Relative cell invasion mrna level WCL IP a 8 6 b : HEK293T KD KD YF py : WT YF KD WT YF KD c : KD KD YF KD KD YF ps473 AKT 5 AKT : KD KD KD KD YF YF : KD KD KD KD YF YF d DMSO PP2 DMSO PP2 1 5 : WT YF KD WT YF KD : WT YF KD WT YF KD Supplementary Figure 9. and (KD) reverse function in a dependent manner (a) cells that express or not () were infected with retroviral vectors that express the indicated mutants (WT, wild type; YF, Y594F mutant and KD, kinase dead) and then mrna level was measured by qpcr (mea ± SEM; n=3). (b) (KD) is phosphorylated at Tyr594. HEK293T cells were trafected with the indicated cotructs for 48h. Cell lysates were immunoprecipitated with an anti antibody. Whole cell lysates (WCL) and immunoprecipitates were analyzed by immunoblotting (IB). (c) Adaptor function of in CRC cells. cells expressing or not () were infected with retroviral vectors that express the indicated mutants (KD, kinase dead and KD YF, kinase dead and Y594F double mutant). Left panel: Cell lysates were analyzed by IB. Middle panel: Soft agar colony formation assay. Right panel: Invasion assay. Data represent mea ± SEM; n=6; : not significant, p<5, p<1 (Student s t test). (d) cells that express or not () and infected with the indicated viruses were treated with the inhibitor PP2 (5µM) or vehicle (DMSO). Left panel: Soft agar colony formation assay. Right panel: Invasion assay. Data represent mea ± SEM; n=3. 1
11 Number of colonies Relative cell invasion 4 shluc sh2 5 shluc sh2 3 4 Akti1/2 : ps473 AKT AKT 2 1 Akti1/2 : Akti1/2 : Supplementary Figure 1. AKT inhibition reverses the traforming properties induced by depletion in CRC cells cells that express anti (sh) or antiluciferase (shluc) shrnas were treated with the AKT inhibitor Akti1/2 (1µM) or vehicle (DMSO). Left panel: After 2h of treatment, cell lysates were analyzed by immunoblotting with the indicated antibodies. Middle panel: Soft agar colony formation assay. Right panel: Invasion assay. Data represent mea ± SEM; n=3. : not significant, p<1, p<1 (Student s t test). 11
 Interaction between and is dependent. HEK293T cells were trafected with the indicated cotructs for 48h.")
12 WCL IP IP WCL WCL IP Flag IP IP IP a : : PP2 : HEK293T b Y594F : : : HEK293T ptyr py594 py594 Flag Flag Flag ptyr c : : : HEK293T Supplementary Figure 11. phosphorylates on Tyr594 promoting complex formation (a) Interaction between and is dependent. HEK293T cells were trafected with the indicated cotructs for 48h. Cells were next treated with the inhibitor PP2 (5µM) or vehicle (DMSO) for 4h. Cell lysates were immunoprecipitated (IP) with the indicated antibodies. Whole cell lysates (WCL) and immunoprecipitates were analyzed by immunoblotting (IB). (b) complex formation does not require ptyr594. HEK293T cells were trafected with the indicated cotructs for 48h. Cell lysates were IP with the indicated antibodies. WCL and immunoprecipitates were analyzed by IB. (c) overexpression does not affect complex formation. HEK293T cells were trafected with the indicated cotructs for 48h. Cell lysates were IP with the indicated antibodies. WCL and immunoprecipitates were analyzed by IB. Molecular size markers () are shown. 12
13 Number of colonies Relative cell invasion : sh2 : sh : / sh2 sh : sh : / sh2 Supplementary Figure 12. silencing reduces the oncogenic potential of induced by inactivation cells expressing and a shrna directed agait (sh2) were infected with retroviral vectors that express a shrna targeting (sh) or a scramble shrna () as control. Left panel: protein level in the corresponding cell lysates was analyzed by immunoblotting. was used as loading control. Middle panel: Soft agar colony formation assay. Right panel: Invasion assay. Data represent mea ± SEM; n=3. 13
14 colonies (%) cell invasion (%) 2 15 shluc sh2 shluc sh sh : sh : Supplementary Figure 13. inactivation dictates the oncogenic addiction of CRC cells to expression cells that express antisla (sh2) or antiluciferase (shluc) shrnas were infected with retroviral vectors that express a shrna targeting (sh) or a scramble shrna () as control. Left panel: Soft agar assays; histograms show the percentage of colonies obtained from cells that express the indicated shrnas and were grown in soft agar compared to control (cells expressing the scramble shrna), arbitrarily set at 1%. Right panel: Boyden chamber assays; histograms show the percentage of invasion of cells that express the indicated shrnas compared to control (cells expressing the scramble shrna), arbitrarily set at 1%. Data represent mea ± SEM; n=5. p<5, p<1 (Student s t test). 14


15 Fig. 2a Fig. 3c Fig. 3d py418 py py861 FAK 95 FAK 95 py861 FAK 95 FAK


16 Fig. 4a Fig. 4f ΔC ΔC Fig. 4g Fig. 4h HEK293T py ΔC ΔC 28 16


17 Fig. 5a Fig. 5c Fig. 5d Fig. 5e Fig. 5f


 n 25")


18 Fig. 6a UBE4A UBE4A 95 UBE4A Fig. 6b UBE4A ΔC Fig. 6c UBE4A Fig. 6d UBE4A Fig. 6e Fig. 6f 25 (Ub) n 25 (Ub) n UBE4A UBE4A 18


19 Fig. 6g Fig. 6h Fig. 7a 25 UBE4A ptyr Fig. 7b ps473 AKT 95 AKT Fig. 7d ps473 AKT ps473 AKT AKT AKT perk perk ERK ERK


20 Fig. 7e Fig. 7f 95 UBE4A ps473 AKT ps473 AKT 28 AKT 95 AKT 28 Fig. 8a Fig. 8b HEK293T ptyr ptyr py594 py594 py


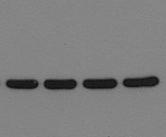
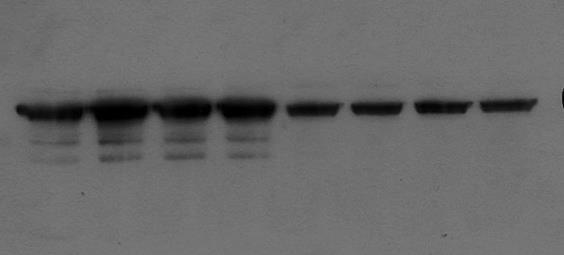
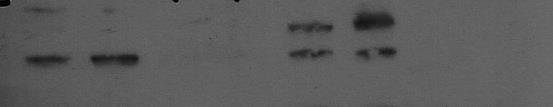
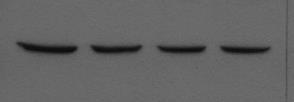
21 Fig. 8c Fig. 8d Fig. 8e 95 py py py418 Fig. 8f Fig. 8g 95 ptyr py594 py Supplementary Figure 14. Western blot images of the selected portion displayed in main figures Boxed areas were cropped for designated figures. 21
22 / py861fak / FAK py418 / / Fig. 2a n=3 Fig. 3d PP2 : n=3 Fig. 5a 2. n=4 22
23 / ps73akt / AKT / / / / Fig. 5c MG132 : h MG132 : h n=3 Fig. 5d WT SH2 SH3 SH3 N32 SH2 WT SH2 SH3 SH3 SH2 N32 n=3 Fig. 6h Fig. 7b siube4a1 : siube4a2 : n=3 : WT YF KD WT YF KD n=3 23
24 / / ps473akt / AKT ps473akt / AKT perk / ERK ps473akt / AKT Fig. 7d PP2 : n=3 Fig. 7e Fig. 7h sh sh siube4a : sh : n=2 n=3 Fig. 8d Fig. 8e PP1 : PP2 : PP1 : PP2 : n=1 n=1 24
25 / / / Fig. 8f : : : : n=5 Fig. 8g 2. sh : : n=2 Supplementary Figure 15. Quantification and statistical analysis of Western blot images displayed in main figures Signal levels were quantified by the ImageJ software. Histograms show the protein level relative to the indicated control level. Data represent mea ± SEM; : not significant, p<5, p<1, p<1 (Student s t test). The number of replicates (n) is indicated. 25
26 Supplementary Table 1. Correlation between expression levels and clinicopathological features in colorectal cancer Variable Number of patients Low expression index High UICC stage I II 13 6 (46,2%) 7 (53,8%) III IV (46,2%) 14 (53,8%) Site Cecum 2 2 (1%) Colon (45,8%) 13 (54,2%) Rectum 13 7 (53,8%) 6 (46,2%) 5 (55,6%) 4 (44,4%) Metastatis 9 Histology Omentum (1) ; Uterus (1) ; Ovary (1) ; Liver (1) ; Lung (1) ; Ovary (1) ; Liver (1) ; Lung (1) Lymph node (1) Adenocarcinoma, well differentiated 1 4 (4%) 6 (6%) Adenocarcinoma, moderately differentiated (5%) 11 (5%) Adenocarcinoma, poorly differentiated 3 2 (66,7%) 1 (33,3%) Mucinous adenocarcinoma 3 3 (1%) Age (years) < (47,6%) 8 (47,1%) 11 (52,4%) 9 (52,9%) Gender Male Female (44,4%) 6 (5%) 15 (55,6%) 6 (5%) 26
27 Supplementary Table 2. shrna and sirna sequences shrna Sequence Vector shluciferase Clontech psirenretroq sh1 h GAGTTACATCCCTGGAATA psirenretroq sh2 h GACCTGGTGAACCACTATT psirenretroq sh GACACTCGGTAGTCTATAC psuper.retro.neo.gfp sh h GCAGTATACGGAGCACTTC psuper.retro.neo.gfp sirna si siluciferase sim1 sim2 sim3 sim4 siube4a1 h siube4a2 h sicbl h siube3c h siltn1 h Sequence Nontargeting sirna#1 (Dharmacon) CGUACGCGGAAUACUUCGA GGGAAUAGCAUGAAAUCCA AGAUUGGUAGCUUCAUGAU AGAACUGUGUGUGUAUGUA GAGCCAAACUACCUUUAUA GCCAAUAGAGCUAACCUUU CCAGGCAACCACUUAAUUA GACACAUUUCGGAUUACUA GAUUGAUGAGCCUCUGUUG GCGAAAGGAUGCUUGCUAA 27
28 Supplementary Table 3. Primer sequences for qpcr Target Gene Forward primer Reverse primer Annealing temperature GAPDH h 5'TCTCCTCTGACTTCAACAGCGAC3' 5'CCCTGTTGCTGTAGCCAAATTC3' 6 C B2M h 5'GTGCTCGCGCTACTCTCTC3' 5'GTCAACTTCAATGTCGGAT3' 6 C h 5'CCGGAGGGACTGGATAGC3' 5'ACAGCCAGCCATGGTAAAC3' 58 C h 5'GGGACCTGATGCAGAACATC3' 5'AGTTGGTGCGGAGCCAGT3' 6 C UBE3C h 5'AAAGCAGATAAGGTCACTCAGC3' 5'CAAAAGGCAACTCTGTCAGGA3' 6 C LTN1 h 5'ACCGGGTTGTAACTTGTTCCT3' 5'TCTGAGGTACACTGTGTTTTCCA3' 6 C GAPDH m 5'TGTGTCCGTCGTGCATCTGA3' 5'CCTGCTTCTCCACCTTCTTGA3' 6 C ActinB m 5'TTGCTGACAGGATGCAGAAG3' 5'AGTCCGCCTAGAAGCACTTG3' 6 C m1 5 ATGGGGAATAGCATGAAATCCAC3 5 GGAGATGGGTAGTCAGTCAGC 3 6 C m2 5'GCACTGGCCGGGAAAGTTAT3' 5'CAGCAGTTCCTCAGCCTTGTC3' 6 C 28
29 SUPPLEMENTARY METHODS Standard proliferation assay. 5 cells were seeded in 24well plates in DMEM containing 5% FCS and then they were fixed every day in trichloroacetic acid (TCA) solution. Standard cell growth was measured by Sulforhodamine B staining (Sigma Aldrich). Migration assay. Cell migration assays were performed in Boyden chambers (BD Bioscience) using 3 cells. After 1h, cells were fixed in 3.7% paraformaldehyde solution containing.1% Hoechst. Whole well images were acquired using an inverted microscope (Zeiss Axiovert 2M or Leica DMIRE2) and a 1x EC Plan Neofluar.3 PH1 objective. Nuclei were then counted in whole wells using the Metamorph software (Molecular Devices, Inc.). Immunohistochemical analyses. For human tissues: a total of 6 formalinfixed, paraffinembedded colon tissue samples (Colorectal cancermetastasisnormal [CDA3] human tissue array) were obtained from Super Bio Chips. This array included 4 cores of colorectal cancer of different stages, 1 cores of metastatic lesion and 9 cores of normal colon tissue. Sectio of paraffinembedded tissue specime were stained with a polyclonal rabbit anti antibody (1:1 dilution, 5mg/ml, Imgenex: IMG6322A). Tissue sectio were immunostained with nopecific IgG and used as negative controls (not shown). The IHC test gives a score of to 3 that measures the amount of protein in the cells of a colon cancer tissue sample. Low expression referred to a score of 1 and high expression to a score of 23. Two investigators, while blinded to the clinical data, scored staining. GST pulldown assays. GSTfusion protei were produced and purified as described in Methods section. 1µg of GST alone, GST N32 or GST N32 bound to Glutathione magnetic beads (Promega) were incubated with,125 µg of prephosphorylated recombinant protein (see Methods section) at 4 C for 3 minutes in 1% BSATBS buffer supplemented with 1µg/ml aprotinin, 2µM leupeptin and 1µM sodium orthovanadate. Beads were washed in WLB buffer (2mM Tris ph 7.5, 15mM NaCl, 1% NP4, 1µg/ml aprotinin, 2µM leupeptin, 1mM DTT, 1mM NaF and 1µM sodium orthovanadate) supplemented with 1% BSA and analyzed by immunoblotting. 29
(a) Significant biological processes (upper panel) and disease biomarkers (lower panel)
 Significant biological processes (upper panel) and disease biomarkers (lower panel)") Supplementary Figure 1. Functional enrichment analyses of secretomic proteins. (a) Significant biological processes (upper panel) and disease biomarkers (lower panel) 2 involved by hrab37-mediated secretory
Supplementary Figure 1. Functional enrichment analyses of secretomic proteins. (a) Significant biological processes (upper panel) and disease biomarkers (lower panel) 2 involved by hrab37-mediated secretory
(a) Schematic diagram of the FS mutation of UVRAG in exon 8 containing the highly instable
 Schematic diagram of the FS mutation of UVRAG in exon 8 containing the highly instable") Supplementary Figure 1. Frameshift (FS) mutation in UVRAG. (a) Schematic diagram of the FS mutation of UVRAG in exon 8 containing the highly instable A 10 DNA repeat, generating a premature stop codon
Supplementary Figure 1. Frameshift (FS) mutation in UVRAG. (a) Schematic diagram of the FS mutation of UVRAG in exon 8 containing the highly instable A 10 DNA repeat, generating a premature stop codon
Supplementary Figure 1.TRIM33 binds β-catenin in the nucleus. a & b, Co-IP of endogenous TRIM33 with β-catenin in HT-29 cells (a) and HEK 293T cells
 and HEK 293T cells") Supplementary Figure 1.TRIM33 binds β-catenin in the nucleus. a & b, Co-IP of endogenous TRIM33 with β-catenin in HT-29 cells (a) and HEK 293T cells (b). TRIM33 was immunoprecipitated, and the amount of
Supplementary Figure 1.TRIM33 binds β-catenin in the nucleus. a & b, Co-IP of endogenous TRIM33 with β-catenin in HT-29 cells (a) and HEK 293T cells (b). TRIM33 was immunoprecipitated, and the amount of
Supplementary Fig. 1. GPRC5A post-transcriptionally down-regulates EGFR expression. (a) Plot of the changes in steady state mrna levels versus
 Plot of the changes in steady state mrna levels versus") Supplementary Fig. 1. GPRC5A post-transcriptionally down-regulates EGFR expression. (a) Plot of the changes in steady state mrna levels versus changes in corresponding proteins between wild type and Gprc5a-/-
Supplementary Fig. 1. GPRC5A post-transcriptionally down-regulates EGFR expression. (a) Plot of the changes in steady state mrna levels versus changes in corresponding proteins between wild type and Gprc5a-/-
Supplementary Figure S1 Supplementary Figure S2
 Supplementary Figure S A) The blots shown in Figure B were qualified by using Gel-Pro analyzer software (Rockville, MD, USA). The ratio of LC3II/LC3I to actin was then calculated. The data are represented
Supplemental information
 Carcinoemryonic antigen-related cell adhesion molecule 6 (CEACAM6) promotes EGF receptor signaling of oral squamous cell carcinoma metastasis via the complex N-glycosylation y Chiang et al. Supplemental
Supplementary Figures
 Supplementary Figures Supplementary Figure 1 DOT1L regulates the expression of epithelial and mesenchymal markers. (a) The expression levels and cellular localizations of EMT markers were confirmed by
Supplementary Figure 1: si-craf but not si-braf sensitizes tumor cells to radiation.
 Supplementary Figure 1: si-craf but not si-braf sensitizes tumor cells to radiation. (a) Embryonic fibroblasts isolated from wildtype (WT), BRAF -/-, or CRAF -/- mice were irradiated (6 Gy) and DNA damage
Supplementary Fig. 1: ATM is phosphorylated in HER2 breast cancer cell lines. (A) ATM is phosphorylated in SKBR3 cells depending on ATM and HER2
 ATM is phosphorylated in SKBR3 cells depending on ATM and HER2") Supplementary Fig. 1: ATM is phosphorylated in HER2 breast cancer cell lines. (A) ATM is phosphorylated in SKBR3 cells depending on ATM and HER2 activity. Upper panel: Representative histograms for FACS
Supplementary Fig. 1: ATM is phosphorylated in HER2 breast cancer cell lines. (A) ATM is phosphorylated in SKBR3 cells depending on ATM and HER2 activity. Upper panel: Representative histograms for FACS
S1a S1b S1c. S1d. S1f S1g S1h SUPPLEMENTARY FIGURE 1. - si sc Il17rd Il17ra bp. rig/s IL-17RD (ng) -100 IL-17RD
 -100 IL-17RD") SUPPLEMENTARY FIGURE 1 0 20 50 80 100 IL-17RD (ng) S1a S1b S1c IL-17RD β-actin kda S1d - si sc Il17rd Il17ra rig/s15-574 - 458-361 bp S1f S1g S1h S1i S1j Supplementary Figure 1. Knockdown of IL-17RD enhances
SUPPLEMENTARY FIGURE 1 0 20 50 80 100 IL-17RD (ng) S1a S1b S1c IL-17RD β-actin kda S1d - si sc Il17rd Il17ra rig/s15-574 - 458-361 bp S1f S1g S1h S1i S1j Supplementary Figure 1. Knockdown of IL-17RD enhances
RAW264.7 cells stably expressing control shrna (Con) or GSK3b-specific shrna (sh-
 or GSK3b-specific shrna (sh-") 1 a b Supplementary Figure 1. Effects of GSK3b knockdown on poly I:C-induced cytokine production. RAW264.7 cells stably expressing control shrna (Con) or GSK3b-specific shrna (sh- GSK3b) were stimulated
1 a b Supplementary Figure 1. Effects of GSK3b knockdown on poly I:C-induced cytokine production. RAW264.7 cells stably expressing control shrna (Con) or GSK3b-specific shrna (sh- GSK3b) were stimulated
hexahistidine tagged GRP78 devoid of the KDEL motif (GRP78-His) on SDS-PAGE. This
 on SDS-PAGE. This") SUPPLEMENTAL FIGURE LEGEND Fig. S1. Generation and characterization of. (A) Coomassie staining of soluble hexahistidine tagged GRP78 devoid of the KDEL motif (GRP78-His) on SDS-PAGE. This protein was expressed
SUPPLEMENTAL FIGURE LEGEND Fig. S1. Generation and characterization of. (A) Coomassie staining of soluble hexahistidine tagged GRP78 devoid of the KDEL motif (GRP78-His) on SDS-PAGE. This protein was expressed
SUPPLEMENTARY INFORMATION. Supplementary Figures S1-S9. Supplementary Methods
 SUPPLEMENTARY INFORMATION SUMO1 modification of PTEN regulates tumorigenesis by controlling its association with the plasma membrane Jian Huang 1,2#, Jie Yan 1,2#, Jian Zhang 3#, Shiguo Zhu 1, Yanli Wang
TRAF6 ubiquitinates TGFβ type I receptor to promote its cleavage and nuclear translocation in cancer
 Supplementary Information TRAF6 ubiquitinates TGFβ type I receptor to promote its cleavage and nuclear translocation in cancer Yabing Mu, Reshma Sundar, Noopur Thakur, Maria Ekman, Shyam Kumar Gudey, Mariya
William C. Comb, Jessica E. Hutti, Patricia Cogswell, Lewis C. Cantley, and Albert S. Baldwin
 Molecular Cell, Volume 45 Supplemental Information p85 SH2 Domain Phosphorylation by IKK Promotes Feedback Inhibition of PI3K and Akt in Response to Cellular Starvation William C. Comb, Jessica E. Hutti,
Supplementary Material for
 Supplementary Material for Parathyroid Hormone Signaling through Low-density-lipoprotein-related Protein 6 Mei Wan, Chaozhe Yang, Jun Li, Xiangwei Wu, Hongling Yuan, Hairong Ma, Xi He, Shuyi Nie, Chenbei
p = formed with HCI-001 p = Relative # of blood vessels that formed with HCI-002 Control Bevacizumab + 17AAG Bevacizumab 17AAG
 A.. Relative # of ECs associated with HCI-001 1.4 1.2 1.0 0.8 0.6 0.4 0.2 0.0 ol b p < 0.001 Relative # of blood vessels that formed with HCI-001 1.4 1.2 1.0 0.8 0.6 0.4 0.2 0.0 l b p = 0.002 Control IHC:
SUPPLEMENTARY INFORMATION
 SUPPLEMENTARY INFORMATION doi:1.138/nature9814 a A SHARPIN FL B SHARPIN ΔNZF C SHARPIN T38L, F39V b His-SHARPIN FL -1xUb -2xUb -4xUb α-his c Linear 4xUb -SHARPIN FL -SHARPIN TF_LV -SHARPINΔNZF -SHARPIN
Supplementary Figure 1. HOPX is hypermethylated in NPC. (a) Methylation levels of HOPX in Normal (n = 24) and NPC (n = 24) tissues from the
 Methylation levels of HOPX in Normal (n = 24) and NPC (n = 24) tissues from the") Supplementary Figure 1. HOPX is hypermethylated in NPC. (a) Methylation levels of HOPX in Normal (n = 24) and NPC (n = 24) tissues from the genome-wide methylation microarray data. Mean ± s.d.; Student
Supplementary Figure 1. HOPX is hypermethylated in NPC. (a) Methylation levels of HOPX in Normal (n = 24) and NPC (n = 24) tissues from the genome-wide methylation microarray data. Mean ± s.d.; Student
m 6 A mrna methylation regulates AKT activity to promote the proliferation and tumorigenicity of endometrial cancer
 SUPPLEMENTARY INFORMATION Articles https://doi.org/10.1038/s41556-018-0174-4 In the format provided by the authors and unedited. m 6 A mrna methylation regulates AKT activity to promote the proliferation
(A) RT-PCR for components of the Shh/Gli pathway in normal fetus cell (MRC-5) and a
 RT-PCR for components of the Shh/Gli pathway in normal fetus cell (MRC-5) and a") Supplementary figure legends Supplementary Figure 1. Expression of Shh signaling components in a panel of gastric cancer. (A) RT-PCR for components of the Shh/Gli pathway in normal fetus cell (MRC-5) and
Supplementary figure legends Supplementary Figure 1. Expression of Shh signaling components in a panel of gastric cancer. (A) RT-PCR for components of the Shh/Gli pathway in normal fetus cell (MRC-5) and
Supplementary data Supplementary Figure 1 Supplementary Figure 2
 Supplementary data Supplementary Figure 1 SPHK1 sirna increases RANKL-induced osteoclastogenesis in RAW264.7 cell culture. (A) RAW264.7 cells were transfected with oligocassettes containing SPHK1 sirna
Supplementary Information Supplementary Fig. 1. Elevated Usp9x in melanoma and NRAS mutant melanoma cells are dependent on NRAS for 3D growth.
 Supplementary Information Supplementary Fig. 1. Elevated Usp9x in melanoma and NRAS mutant melanoma cells are dependent on NRAS for 3D growth. a. Immunoblot for Usp9x protein in NRAS mutant melanoma cells
Supplements. Figure S1. B Phalloidin Alexa488
 Supplements A, DMSO, PP2, PP3 Crk-myc Figure S1. (A) Src kinase activity is necessary for recruitment of Crk to Nephrin cytoplasmic domain. Human podocytes expressing /7-NephrinCD () were treated with
Suppl Video: Tumor cells (green) and monocytes (white) are seeded on a confluent endothelial
 and monocytes (white) are seeded on a confluent endothelial") Supplementary Information Häuselmann et al. Monocyte induction of E-selectin-mediated endothelial activation releases VE-cadherin junctions to promote tumor cell extravasation in the metastasis cascade
Supplementary Information Häuselmann et al. Monocyte induction of E-selectin-mediated endothelial activation releases VE-cadherin junctions to promote tumor cell extravasation in the metastasis cascade
Supplementary Figures
 Supplementary Figures Supplementary Figure 1 Characterization of stable expression of GlucB and sshbira in the CT26 cell line (a) Live cell imaging of stable CT26 cells expressing green fluorescent protein
Supplemental Figure 1. Western blot analysis indicated that MIF was detected in the fractions of
 Supplemental Figure Legends Supplemental Figure 1. Western blot analysis indicated that was detected in the fractions of plasma membrane and cytosol but not in nuclear fraction isolated from Pkd1 null
Supplementary Information
 Supplementary Information mediates STAT3 activation at retromer-positive structures to promote colitis and colitis-associated carcinogenesis Zhang et al. a b d e g h Rel. Luc. Act. Rel. mrna Rel. mrna
SUPPLEMENTARY INFORMATION
 doi:10.1038/nature12652 Supplementary Figure 1. PRDM16 interacts with endogenous EHMT1 in brown adipocytes. Immunoprecipitation of PRDM16 complex by flag antibody (M2) followed by Western blot analysis
Supplementary Figure S1. Venn diagram analysis of mrna microarray data and mirna target analysis. (a) Western blot analysis of T lymphoblasts (CLS)
 Western blot analysis of T lymphoblasts (CLS)") Supplementary Figure S1. Venn diagram analysis of mrna microarray data and mirna target analysis. (a) Western blot analysis of T lymphoblasts (CLS) and their exosomes (EXO) in resting (REST) and activated
Supplementary Figure S1. Venn diagram analysis of mrna microarray data and mirna target analysis. (a) Western blot analysis of T lymphoblasts (CLS) and their exosomes (EXO) in resting (REST) and activated
Tbk1-TKO! DN cells (%)! 15! 10!
! 15! 10!") a! T Cells! TKO! B Cells! TKO! b! CD4! 8.9 85.2 3.4 2.88 CD8! Tbk1-TKO! 1.1 84.8 2.51 2.54 c! DN cells (%)! 4 3 2 1 DP cells (%)! 9 8 7 6 CD4 + SP cells (%)! 5 4 3 2 1 5 TKO! TKO! TKO! TKO! 15 1 5 CD8
a! T Cells! TKO! B Cells! TKO! b! CD4! 8.9 85.2 3.4 2.88 CD8! Tbk1-TKO! 1.1 84.8 2.51 2.54 c! DN cells (%)! 4 3 2 1 DP cells (%)! 9 8 7 6 CD4 + SP cells (%)! 5 4 3 2 1 5 TKO! TKO! TKO! TKO! 15 1 5 CD8
Supplemental Information
 Supplemental Information Tobacco-specific Carcinogen Induces DNA Methyltransferases 1 Accumulation through AKT/GSK3β/βTrCP/hnRNP-U in Mice and Lung Cancer patients Ruo-Kai Lin, 1 Yi-Shuan Hsieh, 2 Pinpin
supplementary information
 DOI: 10.1038/ncb1875 Figure S1 (a) The 79 surgical specimens from NSCLC patients were analysed by immunohistochemistry with an anti-p53 antibody and control serum (data not shown). The normal bronchi served
Impact of hyper-o-glcnacylation on apoptosis and NF-κB activity SUPPLEMENTARY METHODS
 SUPPLEMENTARY METHODS 3D culture and cell proliferation- MiaPaCa-2 cell culture in 3D was performed as described previously (1). Briefly, 8-well glass chamber slides were evenly coated with 50 µl/well
HEK293FT cells were transiently transfected with reporters, N3-ICD construct and
 Supplementary Information Luciferase reporter assay HEK293FT cells were transiently transfected with reporters, N3-ICD construct and increased amounts of wild type or kinase inactive EGFR. Transfections
Supplemental Materials. STK16 regulates actin dynamics to control Golgi organization and cell cycle
 Supplemental Materials STK16 regulates actin dynamics to control Golgi organization and cell cycle Juanjuan Liu 1,2,3, Xingxing Yang 1,3, Binhua Li 1, Junjun Wang 1,2, Wenchao Wang 1, Jing Liu 1, Qingsong
p47 negatively regulates IKK activation by inducing the lysosomal degradation of polyubiquitinated NEMO
 Supplementary Information p47 negatively regulates IKK activation by inducing the lysosomal degradation of polyubiquitinated NEMO Yuri Shibata, Masaaki Oyama, Hiroko Kozuka-Hata, Xiao Han, Yuetsu Tanaka,
Figure S1. Sorting nexin 9 (SNX9) specifically binds psmad3 and not psmad 1/5/8. Lysates from AKR-2B cells untreated (-) or stimulated (+) for 45 min
 specifically binds psmad3 and not psmad 1/5/8. Lysates from AKR-2B cells untreated (-) or stimulated (+) for 45 min") Figure S1. Sorting nexin 9 (SNX9) specifically binds psmad3 and not psmad 1/5/8. Lysates from AKR2B cells untreated () or stimulated () for 45 min with 5 ng/ml TGFβ or 10 ng/ml BMP4 were incubated with
Figure S1. Sorting nexin 9 (SNX9) specifically binds psmad3 and not psmad 1/5/8. Lysates from AKR2B cells untreated () or stimulated () for 45 min with 5 ng/ml TGFβ or 10 ng/ml BMP4 were incubated with
Supplementary Figures
 Supplementary Figures Supplementary Figure 1 Increased ABHD5 expression in human colon cancer associated macrophages. (a) Murine peritoneal macrophages were treated with regular culture medium (Ctrl) or
Supplementary Figure 1. Spatial distribution of LRP5 and β-catenin in intact cardiomyocytes. (a) and (b) Immunofluorescence staining of endogenous
 and (b) Immunofluorescence staining of endogenous") Supplementary Figure 1. Spatial distribution of LRP5 and β-catenin in intact cardiomyocytes. (a) and (b) Immunofluorescence staining of endogenous LRP5 in intact adult mouse ventricular myocytes (AMVMs)
Supplementary Figure 1. Spatial distribution of LRP5 and β-catenin in intact cardiomyocytes. (a) and (b) Immunofluorescence staining of endogenous LRP5 in intact adult mouse ventricular myocytes (AMVMs)
Live cell imaging of trafficking of the chaperone complex vaccine to the ER. BMDCs were incubated with ER-Tracker Red (1 M) in staining solution for
 in staining solution for") Live cell imaging of trafficking of the chaperone complex vaccine to the ER. BMDCs were incubated with ER-Tracker Red (1 M) in staining solution for 15 min at 37 C and replaced with fresh complete medium.
Live cell imaging of trafficking of the chaperone complex vaccine to the ER. BMDCs were incubated with ER-Tracker Red (1 M) in staining solution for 15 min at 37 C and replaced with fresh complete medium.
Schwarz et al. Activity-Dependent Ubiquitination of GluA1 Mediates a Distinct AMPAR Endocytosis
 Schwarz et al Activity-Dependent Ubiquitination of GluA1 Mediates a Distinct AMPAR Endocytosis and Sorting Pathway Supplemental Data Supplemental Fie 1: AMPARs undergo activity-mediated ubiquitination
SUPPLEMENTARY INFORMATION
 doi:10.1038/nature11095 Supplementary Table 1. Summary of the binding between Angptls and various Igdomain containing receptors as determined by flow cytometry analysis. The results were summarized from
a b G75 G60 Sw-2 Sw-1 Supplementary Figure 1. Structure predictions by I-TASSER Server.
 a b G75 2 2 G60 Sw-2 Sw-1 Supplementary Figure 1. Structure predictions by I-TASSER Server. a. Overlay of top 10 models generated by I-TASSER illustrates the potential effect of 7 amino acid insertion
(A) PCR primers (arrows) designed to distinguish wild type (P1+P2), targeted (P1+P2) and excised (P1+P3)14-
 PCR primers (arrows) designed to distinguish wild type (P1+P2), targeted (P1+P2) and excised (P1+P3)14-") 1 Supplemental Figure Legends Figure S1. Mammary tumors of ErbB2 KI mice with 14-3-3σ ablation have elevated ErbB2 transcript levels and cell proliferation (A) PCR primers (arrows) designed to distinguish
1 Supplemental Figure Legends Figure S1. Mammary tumors of ErbB2 KI mice with 14-3-3σ ablation have elevated ErbB2 transcript levels and cell proliferation (A) PCR primers (arrows) designed to distinguish
Nature Genetics: doi: /ng Supplementary Figure 1
 Supplementary Figure 1 MSI2 interactors are associated with the riboproteome and are functionally relevant. (a) Coomassie blue staining of FLAG-MSI2 immunoprecipitated complexes. (b) GO analysis of MSI2-interacting
T H E J O U R N A L O F C E L L B I O L O G Y
 Supplemental material Díaz et al., http://www.jcb.org/cgi/content/full/jcb.201209151/dc1 T H E J O U R N A L O F C E L L B I O L O G Y Figure S1. Hypoxia induces invadopodia formation in different epithelial
Supplementary Figure 1
 Supplementary Figure 1 a γ-h2ax MDC1 RNF8 FK2 BRCA1 U2OS Cells sgrna-1 ** 60 sgrna 40 20 0 % positive Cells (>5 foci per cell) b ** 80 sgrna sgrna γ-h2ax MDC1 γ-h2ax RNF8 FK2 MDC1 BRCA1 RNF8 FK2 BRCA1
a surface permeabilized
 a surface permeabilized RAW 64.7 P388D1 J774 b CD11b + Ly-6G - Blood Monocytes WT Supplementary Figure 1. Cell surface expression on macrophages and DCs. (a) RAW64.7, P388D1, and J774 cells were subjected
SUPPLEMENTARY FIGURE LEGENDS. atypical adenomatous hyperplasias (AAH); Grade II: adenomas; Grade III: adenocarcinomas;
; Grade II: adenomas; Grade III: adenocarcinomas;") SUPPLEMENTARY FIGURE LEGENDS Supplementary Figure S1: Tumor grades in Ras G12D ; p53 / lung tumors. Representative histology (H&E) of K-Ras G12D ; p53 / lung tumors 13 weeks after tumor initiation. Grade
SUPPLEMENTARY FIGURE LEGENDS Supplementary Figure S1: Tumor grades in Ras G12D ; p53 / lung tumors. Representative histology (H&E) of K-Ras G12D ; p53 / lung tumors 13 weeks after tumor initiation. Grade
Figure S1. Reduction in glomerular mir-146a levels correlate with progression to higher albuminuria in diabetic patients.
 Supplementary Materials Supplementary Figures Figure S1. Reduction in glomerular mir-146a levels correlate with progression to higher albuminuria in diabetic patients. Figure S2. Expression level of podocyte
A Hepatocyte Growth Factor Receptor (Met) Insulin Receptor hybrid governs hepatic glucose metabolism SUPPLEMENTARY FIGURES, LEGENDS AND METHODS
 Insulin Receptor hybrid governs hepatic glucose metabolism SUPPLEMENTARY FIGURES, LEGENDS AND METHODS") A Hepatocyte Growth Factor Receptor (Met) Insulin Receptor hybrid governs hepatic glucose metabolism Arlee Fafalios, Jihong Ma, Xinping Tan, John Stoops, Jianhua Luo, Marie C. DeFrances and Reza Zarnegar
A Hepatocyte Growth Factor Receptor (Met) Insulin Receptor hybrid governs hepatic glucose metabolism Arlee Fafalios, Jihong Ma, Xinping Tan, John Stoops, Jianhua Luo, Marie C. DeFrances and Reza Zarnegar
RNA extraction, RT-PCR and real-time PCR. Total RNA were extracted using
 Supplementary Information Materials and Methods RNA extraction, RT-PCR and real-time PCR. Total RNA were extracted using Trizol reagent (Invitrogen,Carlsbad, CA) according to the manufacturer's instructions.
Supplementary Materials for
 www.sciencesignaling.org/cgi/content/full/7/308/ra4/dc1 Supplementary Materials for Antipsychotics Activate mtorc1-dependent Translation to Enhance Neuronal Morphological Complexity Heather Bowling, Guoan
Supplementary Materials
 Supplementary Materials Supplementary Figure S1 Regulation of Ubl4A stability by its assembly partner A, The translation rate of Ubl4A is not affected in the absence of Bag6. Control, Bag6 and Ubl4A CRISPR
TFEB-mediated increase in peripheral lysosomes regulates. Store Operated Calcium Entry
 TFEB-mediated increase in peripheral lysosomes regulates Store Operated Calcium Entry Luigi Sbano, Massimo Bonora, Saverio Marchi, Federica Baldassari, Diego L. Medina, Andrea Ballabio, Carlotta Giorgi
Plasmids Western blot analysis and immunostaining Flow Cytometry Cell surface biotinylation RNA isolation and cdna synthesis
 Plasmids psuper-retro-s100a10 shrna1 was constructed by cloning the dsdna oligo 5 -GAT CCC CGT GGG CTT CCA GAG CTT CTT TCA AGA GAA GAA GCT CTG GAA GCC CAC TTT TTA-3 and 5 -AGC TTA AAA AGT GGG CTT CCA GAG
SUPPLEMENT. Materials and methods
 SUPPLEMENT Materials and methods Cell culture and reagents Cell media and reagents were from Invitrogen unless otherwise indicated. Antibiotics and Tet-certified serum were from Clontech. In experiments
Supplementary Materials for
 www.sciencesignaling.org/cgi/content/full/4/199/ra75/dc1 Supplementary Materials for Signaling by the Matrix Proteoglycan Decorin Controls Inflammation and Cancer Through PDCD4 and MicroRNA-21 Rosetta
SUPPLEMENTARY INFORMATION
 DOI: 10.1038/ncb2566 Figure S1 CDKL5 protein expression pattern and localization in mouse brain. (a) Multiple-tissue western blot from a postnatal day (P) 21 mouse probed with an antibody against CDKL5.
Supplementary Figure 1. Characterization of NMuMG-ErbB2 and NIC breast cancer cells expressing shrnas targeting LPP. NMuMG-ErbB2 cells (a) and NIC
 and NIC") Supplementary Figure 1. Characterization of NMuMG-ErbB2 and NIC breast cancer cells expressing shrnas targeting LPP. NMuMG-ErbB2 cells (a) and NIC cells (b) were engineered to stably express either a LucA-shRNA
Supplementary Figure 1. Characterization of NMuMG-ErbB2 and NIC breast cancer cells expressing shrnas targeting LPP. NMuMG-ErbB2 cells (a) and NIC cells (b) were engineered to stably express either a LucA-shRNA
Supplementary Figure 1. MAT IIα is Acetylated at Lysine 81.
 IP: Flag a Mascot PTM Modified Mass Error Position Gene Names Score Score Sequence m/z [ppm] 81 MAT2A;AMS2;MATA2 35.6 137.28 _AAVDYQK(ac)VVR_ 595.83-2.28 b Pre-immu After-immu Flag- WT K81R WT K81R / Flag
Supplementary Figure 1. A. Bar graph representing the expression levels of the 19 indicated genes in the microarrays analyses comparing human lung
 Supplementary Figure 1. A. Bar graph representing the expression levels of the 19 indicated genes in the microarrays analyses comparing human lung immortalized broncho-epithelial cells (AALE cells) expressing
Supplementary Figure 1. EC-specific Deletion of Snail1 Does Not Affect EC Apoptosis. (a,b) Cryo-sections of WT (a) and Snail1 LOF (b) embryos at
 Cryo-sections of WT (a) and Snail1 LOF (b) embryos at") Supplementary Figure 1. EC-specific Deletion of Snail1 Does Not Affect EC Apoptosis. (a,b) Cryo-sections of WT (a) and Snail1 LOF (b) embryos at E10.5 were double-stained for TUNEL (red) and PECAM-1 (green).
Supplementary Figure 1. EC-specific Deletion of Snail1 Does Not Affect EC Apoptosis. (a,b) Cryo-sections of WT (a) and Snail1 LOF (b) embryos at E10.5 were double-stained for TUNEL (red) and PECAM-1 (green).
Supplementary Figure 1
 Supplementary Figure 1 Supplementary Figure 1. Neither the activation nor suppression of the MAPK pathway affects the ASK1/Vif interaction. (a, b) HEK293 cells were cotransfected with plasmids encoding
Supplementary Figure 1: Expression of NFAT proteins in Nfat2-deleted B cells (a+b) Protein expression of NFAT2 (a) and NFAT1 (b) in isolated splenic
 Protein expression of NFAT2 (a) and NFAT1 (b) in isolated splenic") Supplementary Figure 1: Expression of NFAT proteins in Nfat2-deleted B cells (a+b) Protein expression of NFAT2 (a) and NFAT1 (b) in isolated splenic B cells from WT Nfat2 +/+, TCL1 Nfat2 +/+ and TCL1 Nfat2
Supplementary Figure 1: Expression of NFAT proteins in Nfat2-deleted B cells (a+b) Protein expression of NFAT2 (a) and NFAT1 (b) in isolated splenic B cells from WT Nfat2 +/+, TCL1 Nfat2 +/+ and TCL1 Nfat2
Supplementary Figure 1. Normal T lymphocyte populations in Dapk -/- mice. (a) Normal thymic development in Dapk -/- mice. Thymocytes from WT and Dapk
 Normal thymic development in Dapk -/- mice. Thymocytes from WT and Dapk") Supplementary Figure 1. Normal T lymphocyte populations in Dapk -/- mice. (a) Normal thymic development in Dapk -/- mice. Thymocytes from WT and Dapk -/- mice were stained for expression of CD4 and CD8.
Supplementary Figure 1. Normal T lymphocyte populations in Dapk -/- mice. (a) Normal thymic development in Dapk -/- mice. Thymocytes from WT and Dapk -/- mice were stained for expression of CD4 and CD8.
Supplementary Figure 1 ITGB1 and ITGA11 increase with evidence for heterodimers following HSC activation. (a) Time course of rat HSC activation
 Time course of rat HSC activation") Supplementary Figure 1 ITGB1 and ITGA11 increase with evidence for heterodimers following HSC activation. (a) Time course of rat HSC activation indicated by the detection of -SMA and COL1 (log scale).
Supplementary Figure 1 ITGB1 and ITGA11 increase with evidence for heterodimers following HSC activation. (a) Time course of rat HSC activation indicated by the detection of -SMA and COL1 (log scale).
HCC1937 is the HCC1937-pcDNA3 cell line, which was derived from a breast cancer with a mutation
 SUPPLEMENTARY INFORMATION Materials and Methods Human cell lines and culture conditions HCC1937 is the HCC1937-pcDNA3 cell line, which was derived from a breast cancer with a mutation in exon 20 of BRCA1
Supplementary Figure 1
 Supplementary Figure 1 Constitutive EGFR signaling does not activate canonical EGFR signals (a) U251EGFRInd cells with or without tetracycline exposure (24h, 1µg/ml) were treated with EGF for 15 minutes
Supplementary Figure 1. BMS enhances human T cell activation in vitro in a
 Supplementary Figure 1. BMS98662 enhances human T cell activation in vitro in a concentration-dependent manner. Jurkat T cells were activated with anti-cd3 and anti-cd28 antibody in the presence of titrated
T H E J O U R N A L O F C E L L B I O L O G Y
 T H E J O U R N A L O F C E L L B I O L O G Y Supplemental material Krenn et al., http://www.jcb.org/cgi/content/full/jcb.201110013/dc1 Figure S1. Levels of expressed proteins and demonstration that C-terminal
SUPPLEMENTARY INFORMATION
 DOI: 1.138/ncb3355 a S1A8 + cells/ total.1.8.6.4.2 b S1A8/?-Actin c % T-cell proliferation 3 25 2 15 1 5 T cells Supplementary Figure 1 Inter-tumoral heterogeneity of MDSC accumulation in mammary tumor
Supplementary Figure 1
 Supplementary Figure 1 YAP negatively regulates IFN- signaling. (a) Immunoblot analysis of Yap knockdown efficiency with sh-yap (#1 to #4 independent constructs) in Raw264.7 cells. (b) IFN- -Luc and PRDs
SUPPLEMENTARY FIGURE LEGENDS
 SUPPLEMENTARY FIGURE LEGENDS Supplementary Figure 1. Hippocampal sections from new-born Pten+/+ and PtenFV/FV pups were stained with haematoxylin and eosin (H&E) and were imaged at (a) low and (b) high
mtor Inhibition Specifically Sensitizes Colorectal Cancers with KRAS or BRAF Mutations to BCL-2/BCL-
 Supplementary Material for mtor Inhibition Specifically Sensitizes Colorectal Cancers with KRAS or BRAF Mutations to BCL-2/BCL- XL Inhibition by Suppressing MCL-1 Anthony C. Faber 1,2 *, Erin M. Coffee
Supplemental Figure 1
 Supplemental Figure 1 1a 1c PD-1 MFI fold change 6 5 4 3 2 1 IL-1α IL-2 IL-4 IL-6 IL-1 IL-12 IL-13 IL-15 IL-17 IL-18 IL-21 IL-23 IFN-α Mut Human PD-1 promoter SBE-D 5 -GTCTG- -1.2kb SBE-P -CAGAC- -1.kb
Effec<ve Use of PI3K and MEK Inhibitors to Treat Mutant K Ras G12D and PIK3CA H1047R Murine Lung Cancers
 Effec
Effec
Supplementary Figure 1. Characterization of ALDH-positive cell population in MCF-7 cells. (a) Expression level of stem cell markers in MCF-7 cells or
 Expression level of stem cell markers in MCF-7 cells or") Supplementary Figure 1. Characterization of ALDH-positive cell population in MCF-7 cells. (a) Expression level of stem cell markers in MCF-7 cells or ALDH-positive cell population by qpcr. Data represent
Supplementary Figure 1. Characterization of ALDH-positive cell population in MCF-7 cells. (a) Expression level of stem cell markers in MCF-7 cells or ALDH-positive cell population by qpcr. Data represent
Supplementary Materials for
 www.sciencesignaling.org/cgi/content/full/8/366/ra25/dc1 Supplementary Materials for Viral entry route determines how human plasmacytoid dendritic cells produce type I interferons Daniela Bruni, Maxime
Supplementary Figure 1. Deletion of Smad3 prevents B16F10 melanoma invasion and metastasis in a mouse s.c. tumor model.
 A B16F1 s.c. Lung LN Distant lymph nodes Colon B B16F1 s.c. Supplementary Figure 1. Deletion of Smad3 prevents B16F1 melanoma invasion and metastasis in a mouse s.c. tumor model. Highly invasive growth
SUPPLEMENTARY INFORMATION
 DOI: 10.1038/ncb3076 Supplementary Figure 1 btrcp targets Cep68 for degradation during mitosis. a) Cep68 immunofluorescence in interphase and metaphase. U-2OS cells were transfected with control sirna
Supplementary Figure 1 Induction of cellular senescence and isolation of exosome. a to c, Pre-senescent primary normal human diploid fibroblasts
 Supplementary Figure 1 Induction of cellular senescence and isolation of exosome. a to c, Pre-senescent primary normal human diploid fibroblasts (TIG-3 cells) were rendered senescent by either serial passage
SUPPLEMENTARY FIGURES
 SUPPLEMENTARY FIGURES Supplementary Figure S1: Fibroblast-induced elongation of cancer cells requires direct contact with living fibroblasts. A. Representative images of HT29-GFP cultured in the presence
Supplementary Table 1. The primers used for quantitative RT-PCR. Gene name Forward (5 > 3 ) Reverse (5 > 3 )
 Reverse (5 > 3 )") 770 771 Supplementary Table 1. The primers used for quantitative RT-PCR. Gene name Forward (5 > 3 ) Reverse (5 > 3 ) Human CXCL1 GCGCCCAAACCGAAGTCATA ATGGGGGATGCAGGATTGAG PF4 CCCCACTGCCCAACTGATAG TTCTTGTACAGCGGGGCTTG
770 771 Supplementary Table 1. The primers used for quantitative RT-PCR. Gene name Forward (5 > 3 ) Reverse (5 > 3 ) Human CXCL1 GCGCCCAAACCGAAGTCATA ATGGGGGATGCAGGATTGAG PF4 CCCCACTGCCCAACTGATAG TTCTTGTACAGCGGGGCTTG
SHREE ET AL, SUPPLEMENTAL MATERIALS. (A) Workflow for tumor cell line derivation and orthotopic implantation.
 Workflow for tumor cell line derivation and orthotopic implantation.") SHREE ET AL, SUPPLEMENTAL MATERIALS SUPPLEMENTAL FIGURE AND TABLE LEGENDS Supplemental Figure 1. Derivation and characterization of TS1-TGL and TS2-TGL PyMT cell lines and development of an orthotopic
SHREE ET AL, SUPPLEMENTAL MATERIALS SUPPLEMENTAL FIGURE AND TABLE LEGENDS Supplemental Figure 1. Derivation and characterization of TS1-TGL and TS2-TGL PyMT cell lines and development of an orthotopic
Protein tyrosine phosphatase 1B targets PITX1/p120RasGAP. thus showing therapeutic potential in colorectal carcinoma
 Protein tyrosine phosphatase 1B targets PITX1/p120RasGAP thus showing therapeutic potential in colorectal carcinoma Hao-Wei Teng, Man-Hsin Hung, Li-Ju Chen, Mao-Ju Chang, Feng-Shu Hsieh, Ming-Hsien Tsai,
SUPPLEMENTARY INFORMATION
 Supplementary Figures Supplementary Figure S1. Binding of full-length OGT and deletion mutants to PIP strips (Echelon Biosciences). Supplementary Figure S2. Binding of the OGT (919-1036) fragments with
Boucher et al NCOMMS B
 1 Supplementary Figure 1 (linked to Figure 1). mvegfr1 constitutively internalizes in endothelial cells. (a) Immunoblot of mflt1 from undifferentiated mouse embryonic stem (ES) cells with indicated genotypes;
Supplementary fig. 1. Crystals induce necroptosis does not involve caspases, TNF receptor or NLRP3. A. Mouse tubular epithelial cells were pretreated
 Supplementary fig. 1. Crystals induce necroptosis does not involve caspases, TNF receptor or NLRP3. A. Mouse tubular epithelial cells were pretreated with zvad-fmk (10µM) and exposed to calcium oxalate
Supplementary Figure 1. The mir-182 binding site of SMAD7 3 UTR and the. mutated sequence.
 Supplementary Figure 1. The mir-182 binding site of SMAD7 3 UTR and the mutated sequence. 1 Supplementary Figure 2. Expression of mir-182 and SMAD7 in various cell lines. (A) Basal levels of mir-182 expression
Supplementary Figure 1: Co-localization of reconstituted L-PTC and dendritic cells
 a CD11c Na + K + ATPase Na + K + ATPase CD11c x-y CD11c Na + K + ATPase Na + K + ATPase CD11c x-z c b x-y view BoNT NAPs CD11c BoNT CD11c NAPs BoNT NAPs CD11c 90 x-z view Apical Basolateral Supplementary
Supplementary Figure 1: STAT3 suppresses Kras-induced lung tumorigenesis
 Supplementary Figure 1: STAT3 suppresses Kras-induced lung tumorigenesis (a) Immunohistochemical (IHC) analysis of tyrosine 705 phosphorylation status of STAT3 (P- STAT3) in tumors and stroma (all-time
Supplemental information
 Supplemental information PI(3)K p11δ controls the sucellular compartmentalization of TLR4 signaling and protects from endotoxic shock Ezra Aksoy, Salma Taoui, David Torres, Sandrine Delauve, Aderrahman
Supplementary Figure 1. Basal level EGFR across a panel of ESCC lines. Immunoblots demonstrate the expression of phosphorylated and total EGFR as
 Supplementary Figure 1. Basal level EGFR across a panel of ESCC lines. Immunoblots demonstrate the expression of phosphorylated and total EGFR as well as their downstream effectors across a panel of ESCC
Supplementary Figures
 Supplementary Figures Supplementary Fig. 1. Galectin-3 is present within tumors. (A) mrna expression levels of Lgals3 (galectin-3) and Lgals8 (galectin-8) in the four classes of cell lines as determined
Supplementary Information and Figure legends
 Supplementary Information and Figure legends Table S1. Primers for quantitative RT-PCR Target Sequence (5 -> 3 ) Target Sequence (5 -> 3 ) DAB2IP F:TGGACGATGTGCTCTATGCC R:GGATGGTGATGGTTTGGTAG Snail F:CCTCCCTGTCAGATGAGGAC
SUPPLEMENTARY FIGURES AND TABLE
 SUPPLEMENTARY FIGURES AND TABLE Supplementary Figure S1: Characterization of IRE1α mutants. A. U87-LUC cells were transduced with the lentiviral vector containing the GFP sequence (U87-LUC Tet-ON GFP).
Soft Agar Assay. For each cell pool, 100,000 cells were resuspended in 0.35% (w/v)
") SUPPLEMENTARY MATERIAL AND METHODS Soft Agar Assay. For each cell pool, 100,000 cells were resuspended in 0.35% (w/v) top agar (LONZA, SeaKem LE Agarose cat.5004) and plated onto 0.5% (w/v) basal agar.
SUPPLEMENTARY MATERIAL AND METHODS Soft Agar Assay. For each cell pool, 100,000 cells were resuspended in 0.35% (w/v) top agar (LONZA, SeaKem LE Agarose cat.5004) and plated onto 0.5% (w/v) basal agar.
T H E J O U R N A L O F C E L L B I O L O G Y
 Supplemental material Jewell et al., http://www.jcb.org/cgi/content/full/jcb.201007176/dc1 T H E J O U R N A L O F C E L L B I O L O G Y Figure S1. IR Munc18c association is independent of IRS-1. (A and