Supporting Online Material for
|
|
|
- Ross Anthony
- 6 years ago
- Views:
Transcription

1 Supporting Online Material for Internally Generated Cell Assembly Sequences in the Rat Hippocampus Eva Pastalkova, Vladimir Itskov, Asohan Amarasingham, György Buzsáki* *To whom correspondence should be addressed. This PDF file includes: SOM Text Figs. S1 to S13 Table S1 References Published 5 September 2008, Science 321, 1322 (2008) DOI: /science Other Supporting Online Material for this manuscript includes the following: (available at Movie S1
2 Supporting Online Material Surgery and recording Three male Long-Evans rats ( g) were implanted bilaterally with 32 and/or 64-site silicon probes (4 or 8 shanks 200 µm apart, 8 recording sites per shank, 20 µm spacing between the sites, 1) under isoflurane anesthesia. Rat 4 was implanted with 4 tetrodes (2). The silicon probes/tetrodes were lowered into hippocampal CA1 pyramidal layer within two weeks after surgery. After full recovery (approximately 2 weeks after surgery), access to water was restricted and the rats were allowed to explore the task maze and identify the position of the water ports (Fig. 1A). During physiological recording, data from all channels were filtered (1Hz-5kHz), amplified (gain = 1000) and continuously sampled at 20 khz on a 128-channel DataMax system (16-bit resolution). Two small lightemitting diodes (5-cm separation), mounted above the headstage, were recorded by an overhead digital video camera and sampled (at 30 Hz). For offline spike sorting, the wideband signals were digitally high-pass filtered (0.8-5 khz). Spike sorting was performed semi-automatically, followed by manual adjustment of the clusters (3-5). We cannot exclude the possibility that some neurons recorded in different sessions were identical because spikes from each session were sorted separately. However, the likelihood of recording from the same neuron is small either because the probes moved spontaneously across recording sessions, as evidenced by the change in ripple amplitude or the loss/appearance of fast firing interneurons, or because the probe was moved by the experimenter. All protocols were approved by the Institutional Animal Care and Use Committee of Rutgers University. Behavioral training and recording Delayed spontaneous alternation task. The maze (100 cm by 120 cm) had a shape of figure 8 with two water spouts. A delay area was located at the junction of three arms between the reward sites (Fig. 1A). The delay area was separated from the two reward sites and the third arm (main stem) by three doors, 1
3 controlled by the experimenter. The running wheel (10 cm wide, 29.5 cm diameter) was attached to a wall of the delay area (Fig. 1A). Speed and direction of the wheel rotation was tracked with an optical sensor (0.72 o resolution), attached to the axis of the wheel rotation. Infrared-beam photo-detectors were fixed in all arms of the maze and were used to track the movement of an animal in the maze and to control the delivery of water reward (0.05 ml) after correct choices. Each session began by placing the rat into the delay area while all three doors were closed. During the first day of the training the animal was required to run in the wheel for at least 3 sec, after which the main-stem door was opened. Rats were not allowed to return to the main stem after making a choice at the T- junction of arms. After the consumption of the reward (or no reward), rats walked back to the delay area and could initiate a new trial by entering the wheel. The required length of a wheel running was gradually increased from the initial 3 sec up to 10 sec in rat 1 and up to 20 sec in rats 2 and 3. All rats were required to run steadily in the wheel, always facing the same direction in each trial (West, Fig. 1, S1). All rats reached high performance of spontaneous alternation (>90% correct choices) and steady wheel running within a week. A session was terminated after the animal failed to initiate a new trial within 2 minutes. After entering the wheel, the velocity of running increased rapidly and reached a steady level within a few seconds (Fig. S1). This stereotypic initial acceleration was used as a trigger to mark the beginning of a trial in offline data processing in both the memory task and in the control tasks (threshold speed: 20cm/sec). Control task 1: Wheel running for a water reward. Rats 3 and 4 were trained to run in a running wheel for a water reward. A wheel, identical to the one used in the maze, was attached to one side of a rectangular box (30x40x35 cm). A water port was placed on the wall opposite to the wheel. At the beginning of each session, a rat was introduced into a box and required to run for a fixed period of time (rat 3, 20sec; rat 4, 10sec). As in the alternation task, rats were trained to run with steady speed and heading always in the same direction. All trials were 2
4 rewarded by water (2, 6). Control task 2: Spontaneous wheel running. A wheel, identical to the one used in the maze, was attached to the home cage of the rat (30 x 40 x 35 cm). The rats (rat 2 and 3) had free access to the wheel and could run in either direction. The trials were defined as at least 10 second-long periods of wheel running with the running speed maintained above 50 cm/sec and preceded by at least 2 seconds of exploration in the home cage. Maze and control task recording sessions were alternated in rats 2 and 3. Hippocampal inactivation Five additional male rats ( g) were implanted with stainless steel injection guide cannulae (27 gauges) above dorsal hippocampi bilaterally (7-8) under Isoflurane anesthesia. After recovery, the rats were water restricted and trained in both non-delayed (zero) and delayed (15 sec) versions of left/right alternation task until their performance reached a steady level (5 days). These rats were not required to run in the wheel but were simply confined in the delay area for the duration of the delay. Lidocaine (4%, 0.5µl) or saline were slowly (5 min) injected into hippocampi bilaterally through a 33-gauge cannula connected to a 10-µl Hamilton syringe through tygon tubing. The injection cannula was left at its position for 1min before and after an injection. Five minutes after the injection, the rat was tested in either the non-delayed or delayed version of the alternation task. The order of lidocaine and saline injections and order of delayed and non-delayed versions of the task varied across animals. Data processing Place and episode fields. On each trial each neuron's spike train was convolved with a Gaussian (SD = 100msec, sampling rate 1250 Hz). Firing rate profile of each neuron triggered at the beginning of a wheel or a maze run ( post-stimulus time histogram with the moment of wheel/maze running initiation at time zero) was calculated from action potentials generated during trails of the same type (e. 3
5 g., during wheel or maze runs before left or right turn). In order to distinguish between place fields on a maze and bouts of increased firing generated by pyramidal neurons during wheel running, we refer to the areas of an increased firing rate in a wheel as episode fields. Place fields on the maze and episode fields in the wheel were defined by a minimal peak firing rate of 6.0 Hz or 5Hz and peak firing rate being at least 4.5-times or 3-times SD above a mean firing rate, respectively. Using these different criteria yielded similar results. The width of individual fields was determined by the onset and offset of >10 % rate of the peak firing rate of that field (9-10). Neuronal sequences. In each session two firing rate profiles for each neuron were constructed and normalized by their peak firing rate: one from action potentials generated during wheel runs before correct left arm choice ( left trials ) and one from action potentials generated during wheel runs before correct right arm choice ( right trials ) (e. g., Fig. 1D, E). Mean rate histograms of all neurons within each trial type (left or right) were ordered according to the latencies of peak firing rates of individual neurons (e.g., Fig. 1E). To establish an estimate of statistically reliable firing rate differences between left and right trial types we shuffled left and right single trial firing rate histograms in a randomized manner (11). Thus, we examined the null hypothesis whether real firing patterns of neurons during left and right trials differed significantly, and at which portion of trials these differences occurred. Note that this approach is more rigorous than simply comparing firing rate differences between left and right trials and may at least partially explain the low number of trial discriminating neurons in the stem of the maze, compared to previous findings (12-17). Population vector correlation. In the spatial domain, spatial scale factor of the hippocampal population is a measure of distance traveled by a rat over which temporally overlapping neuronal populations become de-correlated (18-20). Analogously, we calculated a temporal scale factor, which estimates an amount of time it took for population activity to become de-correlated ( life-time of population activity). Firing rate histograms of all neurons within each trial type (see above) were binned into 100 msec bins. Thus, activity of the whole neuronal 4
6 population within each 100 msec time bin was described by a vector that had a length of the number of active neurons (population vector). Spearman rank correlation between all pairs of population vectors characterizing all time bins was calculated. Values of correlation coefficients were color-coded and plotted (Fig 1G). The life-time of population activity was characterized as a width of a region along the diagonal of a correlation matrix with increased correlation coefficient values (19-20). Correlation of population vectors representing the same time bin is equal to 1 (and thus all values along a diagonal of a correlation matrix are equal to 1) unless different subsets of trials are used to build population vectors representing the same time bin (19-20, Fig. 1G). In order to exclude a bias of auto-correlation values along a correlation matrix diagonal, we constructed population vectors from activity generated during trialsn and trialsn+1. Due to the trial-by-trial variability of firing rates, the value of correlation between these population vectors is typically smaller than 1 (Fig. 3B, 5C, only pixels with significant correlation coefficient values are shown, p < 0.01). In the memory task, the correlation matrix was calculated from activity generated during trials with the same future choices (L-trials n vs. L-trials n+1 and R-trials n vs. R-trials n+1 ). In the control tasks, the correlation matrix was calculated from activity generated during even and odd trials (trials n vs. trials n+1; Fig. S9). Phase precession. Instantaneous theta phase was derived by Hilbert transform from filtered (4-10 Hz) LFP trace and a phase value was assigned to each action potential. Spearman rank correlation was used to estimate relationship between the phase precession slope and place/episode field size (9). Frequency of single unit oscillation. All action potentials emitted by a neuron during each pass through a field were convolved with a Gaussian function (SD = 1 msec), convolved with the first four Slepian functions and the dominant oscillations frequency was estimated with Fast Fourier Transform, as described in detail earlier (9). The frequency shift between the unit and LFP power spectra was estimated by cross-correlation. Only units with significant theta modulation were included in this analysis. 5
7 Compression index. Correlation of the distance between place/episode fields of two neurons in a maze or a wheel with the mean temporal offset of action potentials of the same pair of neurons within a theta cycle is called compression index (10). Only pairs of pyramidal neurons with robust place/episode fields and significant cross-correlogram peaks were used for this analysis (10). We obtained similar compression index values (0.75, 0.62, 0.59, p < for all) after selecting place fields based on three different sets of parameters: minimal peak firing rate of 6 Hz, 4.5 Hz or 5 Hz and the peak firing rate 4.5, 3.4 or 3 SDabove the mean firing rate. Firing fields of neurons. Neurons in the control tasks, strictly speaking, did not have fields. We compared activity of neurons generated during wheel running in the memory and control tasks in the temporal domain. An autocorrelogram of each neuron was filtered between 0.2 Hz and 2 Hz and the local minima of the filtered trace closest to zero were detected. Intra-field spikes were defined as spikes which occurred within 10% boundaries of the peak rate, and extra-field spikes those that occurred outside of this boundary. This index is high for compact episode/place fields and low for neurons with sustained or random spiking patterns. Inferring behavioral choice from neural activity. In addition to identifying neurons that reliably discriminate between left and right trials in some portion of wheel running, we also used a probabilistic model to predict future L/R trial type from total population activity during the preceding wheel run. To infer the L/R trial type for a given trial, we fit the model on all other trials in the same session and used it to predict the remaining trial type. The set of trials on which the model was fit is called the training set; the trial that is predicted from the model is called the test set. The percentage of correctly inferred trials was computed across all training/test set trial combinations, with leave-one-out cross-validation. The significance of this prediction was determined on a session-by-session basis by comparing the true values with the distribution of shuffled data. Each shuffled data set was constructed by randomly shuffling the left/right labels between the trial spike trains from each cell across all eligible trials. Only behaviorally correct 6
8 trials of length 7s for rat 1, and 17s for rats 2 and 3 were considered for model-fitting and for correct trial-type inference. For each training set and each k- th putative pyramidal cell that had an average firing rate of > 0.1Hz we computed the predictability index I k from the ratio of minimal and maximal average spikecounts across left and right trials: (here trials, and I min( Nk, Nk) 1, max( Nk, Nk) k L R L N k is the average spike count of the k-th neuron across the considered left L R N k is the average spike count of the k-th neuron across the considered right trials.) The higher the value of I k the more selective the cell on the training set (I k = 1 for the most selective, and I k = 0 for the least selective.) While this index is not necessarily indicative of statistical significance of left/right selectivity of a given cell, it was used for ranking cells in order of their tendency to be predictive. Putative pyramidal cells were ordered according to I k in each training set. Ten cells with the highest predictability index were selected for prediction in each training set. For each trial we computed a binary population vector u ( u1,.., u10) as follows. For each trial the cell could be in one of two states: u k = high if k k R N / N k 0. 25, and u k = low if N / Nk 0. 25, where N k is the average spikecount of the considered cell across all trials. We denote by k Pq ( u) the probabilities of observing k-th selected neuron (k = 1,,10) in the state u= low or u= high during a trial of type q=l,r: k Pq ( u ) =Prob( k-th neuron is in the state u given trial type q). Note that because there are only two states, k k P ( low) 1 P ( high). We assume q q that the neurons fire independently from each other. This is of course an incorrect assumption. However the prediction (based on this assumption) can be only worse than a prediction that would take correlations into account. Under this assumption the probability of observing a binary population vector u ( u1,.., u N ) 7
9 during trial type q can be computed as N k Pq ( u) Pq ( uk ) k 1 Given a new test-set trial, with binary population vector u, the model predicts the trial type q pred qpred (=L or R) via maximum-likelihood: ( u) L if P ( u) P ( u) and ( u) R R L qpred if P ( u) P ( u). The same analysis was repeated on 100 shuffled data sets. The prediction for a given session was considered to be significant if the percentage of trials correctly inferred from the real data was higher than the percentage of trials correctly inferred from at least 95 of the shuffled data sets. Error trials. For each session, only those error trials were selected that were longer than 7s for rat 1, and 17s for rats 2 and 3 (as in the selection of behaviorally correct trials). In order to predict error trials, the model was fit on all behaviorally correct trials in the same session. This model was then used to predict the L/R type of each error trial in a session, as described above. R L 8
. B.")
10 Supplementary figures Fig. S1. Motor correlates of wheel running A. Top view of the testing apparatus. Gray lines: trajectory of the animal. Black and green, position of front and rear LEDs during wheel running (all wheel runs within one recording session). B. Head position of the rat shown separately for the wheel running trials with future left and right choices (trials) in the maze. C. Grand mean head-direction angular vectors for all analyzed sessions (3 rats combined, red arrows: mean of all trials from one session followed by left turn choices, blue: mean of all trials from one session followed by right turn choices). D. Examples of single running wheel trial mean head-direction angles (black) and session mean (red, left trials, blue, right 9
11 trials) head direction angles. Data from the same rat as shown in A and B. E. top: Running speed during single wheel running trials (the same color-scheme as in the bottom panel, the same recording sessions as in Fig. 5 and Fig. S13). Bottom: Average running speed during correct left, correct right and error trials (the same data as in the upper panel). F. The significance level of speed differences between left and right trials was estimated based by the shuffling of the left and right speed labels (green lines, p<0.025 each, 11). Running speed during left and right trials did not differ significantly in any of the analyzed sessions. G. Mean running speed during L and R trials of all sessions of the memory tasks and during all trials of the control tasks. Note that head position, head direction and speed are not significantly different between trials followed by different behavioral choices. These observations indicate that idiothetic cues alone cannot be responsible for the choice-specific firing patterns of neurons (Fig. 4; 5, 12, 14). Fig. S2. Firing rates of putative interneurons in the wheel and in the maze are correlated. In contrast to pyramidal neurons (episode cells and place cells, Fig. 1C), the firing rates of putative interneurons were correlated significantly in the wheel and maze. This may occur because interneurons are typically controlled 10
12 by multiple pyramidal cell assemblies (19, 9). Fig. S3. Proportion of active neurons during wheel and maze running is similar at each moment in time. Percentage of neurons firing at least one spike within 100 msec windows during maze (black) and wheel (blue) running (dashed lines: SD). Note that similar fraction of neurons is active in the wheel and in the maze at each moment in time, despite the spatial 'over-representation' of the head position in the wheel by multiple neurons (Fig. 1B). This can occur because different episode cells in the wheel are activated in a sequence. 11


.")

13 Fig. S4. Control task 1. Rats were trained to run for water reward. Rat 4, twelve simultaneously recorded neurons (each panel shows activity of one neuron, rows: peak-normalized firing rate profiles of a neuron in 21 successive wheel running trials). Rat 3, 15 simultaneously recorded neurons in a session with 58 trials. Only pyramidal neurons with mean firing rate higher than 0.35 Hz are 12

.")
14 shown. Note that most neurons fire in a relatively sustained manner (2, 6) and that firing rate profiles of almost all neurons vary from trial to trial. Fig. S5. Control task 2. Rats could freely run in the wheel, attached to the wall of a home cage. No reward was delivered. Each panel shows activity of one neuron; all 16 neurons were recorded simultaneously (rat 2; single session). Rows show peak-normalized firing rate profiles of a neuron in successive trials. Trials are grouped according to the animal s head-direction/sense of the wheel rotation during trials (counter clockwise CCW, clockwise CW). Note that most neurons show differential firing rates depending on the rat s head direction. This observation emphasizes the dominance of distant cues in this control task (2, 6). 13
15 Fig. S6. Distribution of mean firing rates of neurons in the memory and control tasks. Note similar distribution of firing rates in both tasks. Arrows, medians. Fig. S7. Performance of rats in the delayed alternation task is impaired after bilateral inactivation of dorsal hippocampi. Five rats (different from rats 1-4 and 14
16 not equipped with electrodes) were trained in the alternation task with both 0 and 15 sec delays. Bilateral inactivation of dorsal hippocampi (4% lidocaine, 0.5 µl) impaired performance of the animals during sessions with 15 sec delay between trials but did not affect performance of the same animals during sessions with no waiting period between trials (see also ref. 17 for similar results). 15


17 Fig. S8. Episode fields in the memory task. Activity of individual neurons during wheel running predicts future behavior of an animal in the maze. Firing patterns 16
.")
18 of 32 simultaneously recorded neurons in Rat 2 during wheel running in the delayed alternation task, separated on the basis of future left and right correct turns in the maze. Each line corresponds to a single trial. Clu, cluster identity. FR: Firing rate (Hz). Note that many neurons fire only for a short duration ( life time ) and consistently at the same time after the beginning of wheel running. Note also robust firing pattern differences between left and right trials in several neurons. Fig. S9. Prediction of behavioral choices in the maze from the population activity during wheel running. In addition to identifying individual neurons with differential firing rate patterns before left and right choices (Fig. 4), we also examined how well population activity can predict correct choices. In this analysis, we used the best 10 discriminating neurons (based on mean spike count during wheel running before left and right choices), irrespective of whether they individually showed significant choice differences. In order to infer the left/right trial type for a given trial, we fit a model on all other trials (excluding the one to be predicted) and used the model to predict the remaining trial type (leave-one-out cross-validation 17
19 procedure). Black bars indicate the percentage of correctly predicted trials during each session. The significance of the prediction was determined by comparing the original data set with shuffled data from the same session (box plots; see Methods). Box plots display median, the first and third quartiles and 95% confidence intervals for model predictions based on shuffled data sets. Numbers at the bottom of each bar indicate the fraction of neurons that significantly differentiated between left and right trials on at least a portion of wheel running trials (Fig. 4B) compared with the total number of pyramidal neurons within a session. Rat 3 lost the implant after the last recording session. 18


.")

20 Fig. S10. Firing rates of some interneurons correlate with specific aspects of the memory task. Each map shows activity of a putative interneuron. Rows, wheel running trials separated according to the future choices in the maze (left, right). Neurons from 3 rats (n = 77 neurons). Several interneurons show increase or decrease of a firing rate at a specific portion of a wheel run (as visualized by the 19
21 vertical color-stripes). Interneurons, whose firing patterns were correlated with future left or right choices are highlighted (black frames). These observations are in register with recent observations reporting that a fraction of interneurons also show place or other task-related specificity (19, 21, 9). Fig. S11. Population vector cross-correlation matrices for a single session in each rat (rows). Matrices were calculated from population vectors representing activity during trials with either the same (Left: L-trial n vs L-trial n+1 ; Right: R-trial n+1 vs R-trial n+1, Supplementary Methods) or different future choice (Left vs. Right: L- trial n vs R-trial n ). The trial-to-trial consistency of subsequent trials that were followed by the same arm choice can be judged from the intensity of the diagonal. Note the lack of diagonal in the matrices calculated from trials followed 20
.")
22 by opposite choices (third column). Fig. S12. Behavioral errors in the maze can be predicted from firing patterns during wheel running. Two representative sessions from 2 rats (each session with 9 left and 9 right correct trials and 2 error trials). For each rat, 10 best left/right discriminating neurons (color-coded dots) from a larger population were chosen. Note that firing patterns of right error trials and right correct trials are similar. These findings suggest that assembly sequences of neurons reflect planned travel path of the rat. During most error trials the rat ran smoothly in the 21
23 wheel and through the center arm as well as the T-junction in one swift trajectory, and the commission error became detectable only after the wrong behavioral turn. Deadwyler et al. (23) referred to this kind of error as miscoding, implying that the previous choice is not correctly interpreted and the rat behaves indistinguishably from correct trials. The second type of error trials was associated with overt behavioral changes, such as stopping and premature departure from the wheel and return to the wheel, grooming and immobility in the wheel or delay area (analogous to the delay-dependent errors in ref. 23). The neuronal patterns associated with such behaviorally abnormal trials were often not possible to predict reliably from neuronal patterns, mainly because comparable correct reference assembly patterns were not available. Nevertheless, our anecdotal observations indicate that even such late errors could be distinguished by neurons with perfect left vs right discrimination (e.g., error trial in Movie 1). In the presented analyses (Fig. 5) all errors are presented, since the main goal was to differentiate between the effect of past and future movement paths of the rat. 22


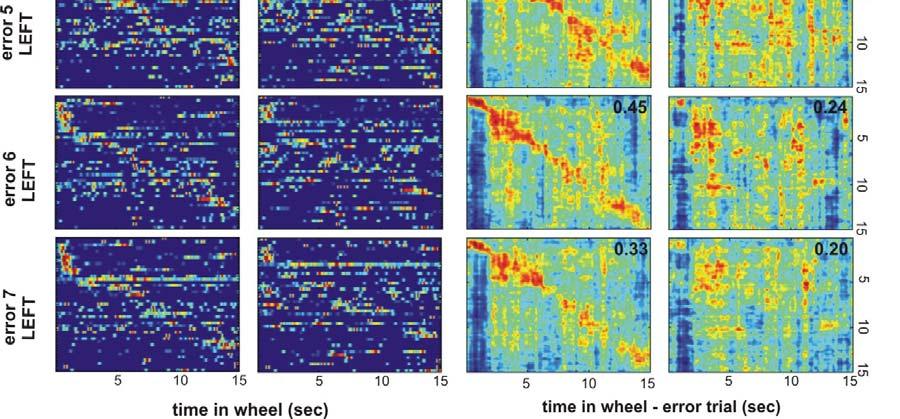
24 Fig. S13. Supplementary information for Fig. 5. A. Peak rate-normalized firing 23
25 rates of 43 neurons simultaneously recorded during wheel running, ordered by the latency of peak firing rates during correct left trials (left) and correct right trials (right). Note that while in Fig. 5B neuron order 1 to 43 is the same for both panels, here the ordering of neurons for LEFT and RIGHT trials was done separately. B. Activity of the same neurons as in A during seven error trials. Neuronal order in the left column is the same as in the correct-left matrix in A. Neuronal order in the right column is the same as in the correct-right matrix in A. C. Correlation between population vectors from the left-correct and left-error matrices (left column) and correlation between population vectors from the rightcorrect and right-error matrices (right column). Mean correlation coefficient along the correlation matrix diagonal (± 0.5 sec) is given in the upper right corner of each correlation matrix. Note that left correct vs. left error mean correlation coefficient is higher than right correct vs. right error correlation coefficient in all 7 left-error trials. Table S1. Variability between animals: selected behavioral and electrophysiological measures for rat
26 Movie 1. Single neurons can reliably predict future left and right turns. Running wheel on the right, the right and left side arms of the maze are on the top and bottom of the movie, respectively. Color LEDs indicate head orientation. This strongly discriminating neuron was virtually silent during wheel runs before right turns. Note that on the error trial (6th), the erroneous turn to the left is predicted by the increased firing of the cell at the end of the delay period. On another trial (last one in movie), the rat headed back toward the wheel. Prior to turning back toward the T junction the neuron became active followed by the neuron-predicted behavioral choice to the left. Although this neuron reliably discriminated left and right turns, it alone cannot be responsible for guiding future motor behavior since it fired transiently at the beginning of wheel running. This information should be 25
27 passed onto further neuronal assemblies, which continue to discriminate between left and right movement trajectories during later parts of running in the wheel and in the stem area ( prospective neurons, 12-14). Supplementary References 1. J. Csicsvari, D. A. Henze, B. Jamieson, K. D. Harris, A. Sirota, P. Barthó, K. D. Wise, G. Buzsáki, J. Neurophysiol. 90, (2003). 2. H. Hirase, A. Czurko, J. Csicsvari, G. Buzsáki, Eur J Neurosci 11, (1999). 3. K. D. Harris, D. A. Henze, J. Csicsvari, H. Hirase, G. Buzsáki, J. Neurophysiol. 84, (2000). 4. J. Csicsvari, H. Hirase, A. Czurko, G. Buzsáki, Neuron 21, (1998). 5. L. Hazan, M. Zugaro, G. Buzsáki, J Neurosci Methods 155, (2006). 6. A. Czurko, H. Hirase, J. Csicsvari, G. Buzsáki, Eur J Neurosci 11, (1999). 7. D. Klement, E. Pastalkova, A. A. Fenton, Hippocampus, 15, (2005). 8. E. Pastalkova, P. Serrano, D. Pinkhasova, E. Wallace, A. A. Fenton, T. C. Sacktor, Science 313, (2006). 9. C. Geisler, D. Robbe, M. Zugaro, A. Sirota, G. Buzsáki, Proc. Natl. Acad. Sci. U. S. A. 104, (2007). 10. G. Dragoi, G. Buzsáki, Neuron 50, (2006). 11. S. Fujisawa, A. Amarasingham, M. T. Harrison, G. Buzsáki, Nature Neurosci 11, (2008). 12. L. M. Frank, E. N. Brown, M. Wilson, Neuron 27, (2000). 13. J. Ferbinteanu, M. L. Shapiro, Neuron 40, , (2003). 14. E. R. Wood, P. A. Dudchenko, R. J. Robitsek, H. Eichenbaum, Neuron 27, (2000). 15. M. R. Bower, D. R. Euston, B. L. McNaughton, J Neurosci 25, (2005). 16. J. A. Ainge, M. Tamosiunaite F. Woergoetter, P. A. Dudchenko, J Neurosci 27, (2007). 17. J. A. Ainge, M. A. van der Meer, R. F. Langston, E. R. Wood, Hippocampus 26
28 17, (2007). 18. K. M. Gothard, W. E. Skaggs, B. L. McNaughton, J Neurosci 16, (1996). 19. A. P. Maurer, S. L. Cowen, S. N. Burke, C. A. Barnes, B. L. McNaughton, J. Neurosci. 26, (2006). 20. A. Terrazas, M. Krause, P. Lipa, K. M. Gothard, C. A. Barnes, B. L. McNaughton, J Neurosci 25, (2005). 21. W. B. Wilent, D. A. Nitz, J. Neurophysiol. 97, (2007). 22. V. Ego-Stengel, M. A. Wilson, Hippocampus, 17, (2007). 23. A. Deadwyler, T. Bunn, R. E. Hampson, J Neurosci 16, (1996). 27
Theta sequences are essential for internally generated hippocampal firing fields.
 Theta sequences are essential for internally generated hippocampal firing fields. Yingxue Wang, Sandro Romani, Brian Lustig, Anthony Leonardo, Eva Pastalkova Supplementary Materials Supplementary Modeling
Supplementary Figure 1 Information on transgenic mouse models and their recording and optogenetic equipment. (a) 108 (b-c) (d) (e) (f) (g)
 108 (b-c) (d) (e) (f) (g)") Supplementary Figure 1 Information on transgenic mouse models and their recording and optogenetic equipment. (a) In four mice, cre-dependent expression of the hyperpolarizing opsin Arch in pyramidal cells
Supplementary Figure 1 Information on transgenic mouse models and their recording and optogenetic equipment. (a) In four mice, cre-dependent expression of the hyperpolarizing opsin Arch in pyramidal cells
Nature Neuroscience: doi: /nn Supplementary Figure 1. Behavioral training.
 Supplementary Figure 1 Behavioral training. a, Mazes used for behavioral training. Asterisks indicate reward location. Only some example mazes are shown (for example, right choice and not left choice maze
Place-selective firing contributes to the reverse-order reactivation of CA1 pyramidal cells during sharp waves in open-field exploration
 European Journal of Neuroscience, Vol. 26, pp. 704 716, 2007 doi:10.1111/j.1460-9568.2007.05684.x Place-selective firing contributes to the reverse-order reactivation of CA1 pyramidal cells during sharp
Informationsverarbeitung im zerebralen Cortex
 Informationsverarbeitung im zerebralen Cortex Thomas Klausberger Dept. Cognitive Neurobiology, Center for Brain Research, Med. Uni. Vienna The hippocampus is a key brain circuit for certain forms of memory
Nov versus Fam. Fam 1 versus. Fam 2. Supplementary figure 1
 a Environment map similarity score (mean r ).5..3.2.1 Fam 1 versus Fam 2 Nov versus Fam b Environment cofiring similarity score (mean r ).7.6.5..3.2.1 Nov versus Fam Fam 1 versus Fam 2 First half versus
Hippocampal Time Cells : Time versus Path Integration
 Article Hippocampal Time Cells : Time versus Path Integration Benjamin J. Kraus, 1, * Robert J. Robinson II, 1 John A. White, 2 Howard Eichenbaum, 1 and Michael E. Hasselmo 1 1 Center for Memory and Brain,
Microcircuitry coordination of cortical motor information in self-initiation of voluntary movements
 Y. Isomura et al. 1 Microcircuitry coordination of cortical motor information in self-initiation of voluntary movements Yoshikazu Isomura, Rie Harukuni, Takashi Takekawa, Hidenori Aizawa & Tomoki Fukai
Supplementary Figure 1
 Supplementary Figure 1 Miniature microdrive, spike sorting and sleep stage detection. a, A movable recording probe with 8-tetrodes (32-channels). It weighs ~1g. b, A mouse implanted with 8 tetrodes in
Supplementary materials for: Executive control processes underlying multi- item working memory
 Supplementary materials for: Executive control processes underlying multi- item working memory Antonio H. Lara & Jonathan D. Wallis Supplementary Figure 1 Supplementary Figure 1. Behavioral measures of
Nature Neuroscience: doi: /nn Supplementary Figure 1. Large-scale calcium imaging in vivo.
 Supplementary Figure 1 Large-scale calcium imaging in vivo. (a) Schematic illustration of the in vivo camera imaging set-up for large-scale calcium imaging. (b) High-magnification two-photon image from
Brain and Cognitive Sciences 9.96 Experimental Methods of Tetrode Array Neurophysiology IAP 2001
 Brain and Cognitive Sciences 9.96 Experimental Methods of Tetrode Array Neurophysiology IAP 2001 An Investigation into the Mechanisms of Memory through Hippocampal Microstimulation In rodents, the hippocampus
SUPPLEMENTARY INFORMATION
 doi:1.138/nature1139 a d Whisker angle (deg) Whisking repeatability Control Muscimol.4.3.2.1 -.1 8 4-4 1 2 3 4 Performance (d') Pole 8 4-4 1 2 3 4 5 Time (s) b Mean protraction angle (deg) e Hit rate (p
Nature Neuroscience: doi: /nn Supplementary Figure 1
 Supplementary Figure 1 Reward rate affects the decision to begin work. (a) Latency distributions are bimodal, and depend on reward rate. Very short latencies (early peak) preferentially occur when a greater
Supplementary Information Supplementary Table 1. Quantitative features of EC neuron dendrites
 Supplementary Information Supplementary Table 1. Quantitative features of EC neuron dendrites Supplementary Table 2. Quantitative features of EC neuron axons 1 Supplementary Figure 1. Layer distribution
Nature Neuroscience: doi: /nn Supplementary Figure 1. Trial structure for go/no-go behavior
 Supplementary Figure 1 Trial structure for go/no-go behavior a, Overall timeline of experiments. Day 1: A1 mapping, injection of AAV1-SYN-GCAMP6s, cranial window and headpost implantation. Water restriction
Supporting Information
 1 2 3 4 5 6 7 8 9 10 11 12 13 14 15 16 17 18 19 20 21 22 23 24 25 26 27 28 29 30 31 32 33 34 35 36 37 38 39 40 Supporting Information Variances and biases of absolute distributions were larger in the 2-line
Sum of Neurally Distinct Stimulus- and Task-Related Components.
 SUPPLEMENTARY MATERIAL for Cardoso et al. 22 The Neuroimaging Signal is a Linear Sum of Neurally Distinct Stimulus- and Task-Related Components. : Appendix: Homogeneous Linear ( Null ) and Modified Linear
Supplementary Figure 1. Example of an amygdala neuron whose activity reflects value during the visual stimulus interval. This cell responded more
 1 Supplementary Figure 1. Example of an amygdala neuron whose activity reflects value during the visual stimulus interval. This cell responded more strongly when an image was negative than when the same
Supplemental Information. A 4 Hz Oscillation Adaptively Synchronizes. Prefrontal, VTA, and Hippocampal Activities
 Neuron, Volume 72 Supplemental Information A 4 Hz Oscillation Adaptively Synchronizes Prefrontal, VTA, and Hippocampal Activities Shigeyoshi Fujisawa and György Buzsáki SUPPEMENTAL FIGURES Figure S1. (A)
Temporal Encoding of Place Sequences by Hippocampal Cell Assemblies
 Neuron 50, 145 157, April 6, 2006 ª2006 Elsevier Inc. DOI 10.1016/j.neuron.2006.02.023 Temporal Encoding of Place Sequences by Hippocampal Cell Assemblies George Dragoi 1,2, * and György Buzsáki 1, * 1
Supplementary Material for
 Supplementary Material for Selective neuronal lapses precede human cognitive lapses following sleep deprivation Supplementary Table 1. Data acquisition details Session Patient Brain regions monitored Time
Hippocampal mechanisms of memory and cognition. Matthew Wilson Departments of Brain and Cognitive Sciences and Biology MIT
 Hippocampal mechanisms of memory and cognition Matthew Wilson Departments of Brain and Cognitive Sciences and Biology MIT 1 Courtesy of Elsevier, Inc., http://www.sciencedirect.com. Used with permission.
Supplementary Figure 1: Kv7 currents in neonatal CA1 neurons measured with the classic M- current voltage-clamp protocol.
 Supplementary Figures 1-11 Supplementary Figure 1: Kv7 currents in neonatal CA1 neurons measured with the classic M- current voltage-clamp protocol. (a), Voltage-clamp recordings from CA1 pyramidal neurons
Nature Neuroscience: doi: /nn Supplementary Figure 1
 Supplementary Figure 1 Hippocampal recordings. a. (top) Post-operative MRI (left, depicting a depth electrode implanted along the longitudinal hippocampal axis) and co-registered preoperative MRI (right)
Supplemental Information. A Visual-Cue-Dependent Memory Circuit. for Place Navigation
 Neuron, Volume 99 Supplemental Information A Visual-Cue-Dependent Memory Circuit for Place Navigation Han Qin, Ling Fu, Bo Hu, Xiang Liao, Jian Lu, Wenjing He, Shanshan Liang, Kuan Zhang, Ruijie Li, Jiwei
Mnemonic representations of transient stimuli and temporal sequences in the rodent hippocampus in vitro
 Supplementary Material Mnemonic representations of transient stimuli and temporal sequences in the rodent hippocampus in vitro Robert. Hyde and en W. Strowbridge Mossy ell 1 Mossy ell Mossy ell 3 Stimulus
Hippocampal theta sequences reflect current goals
 a r t i c l e s Hippocampal theta sequences reflect current goals Andrew M Wikenheiser 1 & A David Redish 2 npg 215 Nature America, Inc. All rights reserved. Hippocampal information processing is discretized
Summary of behavioral performances for mice in imaging experiments.
 Supplementary Figure 1 Summary of behavioral performances for mice in imaging experiments. (a) Task performance for mice during M2 imaging experiments. Open triangles, individual experiments. Filled triangles,
Accuracy of Tetrode Spike Separation as Determined by Simultaneous Intracellular and Extracellular Measurements
 Accuracy of Tetrode Spike Separation as Determined by Simultaneous Intracellular and Extracellular Measurements KENNETH D. HARRIS, DARRELL A. HENZE, JOZSEF CSICSVARI, HAJIME HIRASE, AND GYÖRGY BUZSÁKI
Supplementary Materials
 Supplementary Materials Supplementary Figure S1: Data of all 106 subjects in Experiment 1, with each rectangle corresponding to one subject. Data from each of the two identical sub-sessions are shown separately.
Supplemental Information. Gamma and the Coordination of Spiking. Activity in Early Visual Cortex. Supplemental Information Inventory:
 Neuron, Volume 77 Supplemental Information Gamma and the Coordination of Spiking Activity in Early Visual Cortex Xiaoxuan Jia, Seiji Tanabe, and Adam Kohn Supplemental Information Inventory: Supplementary
Experience-Dependent Development of Coordinated Hippocampal Spatial Activity Representing the Similarity of Related Locations
 11586 The Journal of Neuroscience, September 1, 2010 30(35):11586 11604 Behavioral/Systems/Cognitive Experience-Dependent Development of Coordinated Hippocampal Spatial Activity Representing the Similarity
SUPPLEMENTARY INFORMATION. Supplementary Figure 1
 SUPPLEMENTARY INFORMATION Supplementary Figure 1 The supralinear events evoked in CA3 pyramidal cells fulfill the criteria for NMDA spikes, exhibiting a threshold, sensitivity to NMDAR blockade, and all-or-none
Neural Coding. Computing and the Brain. How Is Information Coded in Networks of Spiking Neurons?
 Neural Coding Computing and the Brain How Is Information Coded in Networks of Spiking Neurons? Coding in spike (AP) sequences from individual neurons Coding in activity of a population of neurons Spring
Hippocampal Time Cells Bridge the Gap in Memory for Discontiguous Events
 Article Hippocampal Time Cells Bridge the Gap in Memory for Discontiguous Events Christopher J MacDonald, Kyle Q Lepage, Uri T Eden, and Howard Eichenbaum, * Center for Memory and Brain, Boston University,
Superficial Layers of the Medial Entorhinal Cortex Replay Independent of the Hippocampus
 Superficial Layers of the Medial Entorhinal Cortex Replay Independent of the Hippocampus J. O Neill *, C.N. Boccara, F. Stella, P. Schoenenberger, J. Csicsvari * IST Austria, Am Campus, A 34 Klosterneuburg,
Supplementary figure 1: LII/III GIN-cells show morphological characteristics of MC
 1 2 1 3 Supplementary figure 1: LII/III GIN-cells show morphological characteristics of MC 4 5 6 7 (a) Reconstructions of LII/III GIN-cells with somato-dendritic compartments in orange and axonal arborizations
Nature Methods: doi: /nmeth Supplementary Figure 1. Activity in turtle dorsal cortex is sparse.
 Supplementary Figure 1 Activity in turtle dorsal cortex is sparse. a. Probability distribution of firing rates across the population (notice log scale) in our data. The range of firing rates is wide but
Differential Consolidation and Pattern Reverberations within Episodic Cell Assemblies in the Mouse Hippocampus
 Differential Consolidation and Pattern Reverberations within Episodic Cell Assemblies in the Mouse Hippocampus Remus Oşan 1., Guifen Chen 2., Ruiben Feng 2, Joe Z. Tsien 2 * 1 Department of Pharmacology
Memory Modulates Journey-Dependent Coding in the Rat Hippocampus
 The Journal of Neuroscience, June 22, 2011 31(25):9135 9146 9135 Behavioral/Systems/Cognitive Memory Modulates Journey-Dependent Coding in the Rat Hippocampus Janina Ferbinteanu, Prasad Shirvalkar, and
File name: Supplementary Information Description: Supplementary Figures, Supplementary Table and Supplementary References
 File name: Supplementary Information Description: Supplementary Figures, Supplementary Table and Supplementary References File name: Supplementary Data 1 Description: Summary datasheets showing the spatial
Author(s) Satoshi; Yamaguchi, Kenji; Takahash. Citation Journal of physiology, Paris (2013)
 Satoshi; Yamaguchi, Kenji; Takahash. Citation Journal of physiology, Paris (2013)") Title Diverse synchrony of firing coding in the prefrontal cortex. reflect Author(s) Sakurai, Yoshio; Nakazono, Tomoaki; Satoshi; Yamaguchi, Kenji; Takahash Citation Journal of physiology, Paris (2013)
Title Diverse synchrony of firing coding in the prefrontal cortex. reflect Author(s) Sakurai, Yoshio; Nakazono, Tomoaki; Satoshi; Yamaguchi, Kenji; Takahash Citation Journal of physiology, Paris (2013)
Oscillatory Coupling of Hippocampal Pyramidal Cells and Interneurons in the Behaving Rat
 The Journal of Neuroscience, January 1, 1999, 19(1):274 287 Oscillatory Coupling of Hippocampal Pyramidal Cells and Interneurons in the Behaving Rat Jozsef Csicsvari, Hajime Hirase, András Czurkó, Akira
Identification of network-level coding units for real-time representation of episodic experiences in the hippocampus
 Identification of network-level coding units for real-time representation of episodic experiences in the hippocampus Longnian Lin*, Remus Osan*, Shy Shoham, Wenjun Jin*, Wenqi Zuo*, and Joe Z. Tsien* *Center
Early Learning vs Early Variability 1.5 r = p = Early Learning r = p = e 005. Early Learning 0.
 The temporal structure of motor variability is dynamically regulated and predicts individual differences in motor learning ability Howard Wu *, Yohsuke Miyamoto *, Luis Nicolas Gonzales-Castro, Bence P.
Neuron, Volume 63 Spatial attention decorrelates intrinsic activity fluctuations in Macaque area V4.
 Neuron, Volume 63 Spatial attention decorrelates intrinsic activity fluctuations in Macaque area V4. Jude F. Mitchell, Kristy A. Sundberg, and John H. Reynolds Systems Neurobiology Lab, The Salk Institute,
Double dissociation of value computations in orbitofrontal and anterior cingulate neurons
 Supplementary Information for: Double dissociation of value computations in orbitofrontal and anterior cingulate neurons Steven W. Kennerley, Timothy E. J. Behrens & Jonathan D. Wallis Content list: Supplementary
Nature Neuroscience doi: /nn Supplementary Figure 1. Characterization of viral injections.
 Supplementary Figure 1 Characterization of viral injections. (a) Dorsal view of a mouse brain (dashed white outline) after receiving a large, unilateral thalamic injection (~100 nl); demonstrating that
Nature Neuroscience: doi: /nn Supplementary Figure 1. Lick response during the delayed Go versus No-Go task.
 Supplementary Figure 1 Lick response during the delayed Go versus No-Go task. Trial-averaged lick rate was averaged across all mice used for pyramidal cell imaging (n = 9). Different colors denote different
Self-Motion and the Origin of Differential Spatial Scaling Along the Septo-Temporal Axis of the Hippocampus
 Self-Motion and the Origin of Differential Spatial Scaling Along the Septo-Temporal Axis of the Hippocampus Andrew P. Maurer, Shea R. VanRhoads, Gary R. Sutherland, Peter Lipa, and Bruce L McNaughton*
Neurons of the cerebral cortex exhibit precise inter spike timing in correspondence to behavior
 1 Neurons of the cerebral cortex exhibit precise inter spike timing in correspondence to behavior Tomer Shmiel [1], Rotem Drori [2], Oren Shmiel [1], Yoram Ben-Shaul [2], Zoltan Nadasdy [3], Moshe Shemesh
Supplementary Information. Staged decline of neuronal function in vivo in an animal model of Alzheimer s Disease. Supplementary Figures S1-10
 Supplementary Information Staged decline of neuronal function in vivo in an animal model of Alzheimer s Disease Christine Grienberger 1 *, Nathalie L. Rochefort 1 *, Helmuth Adelsberger 1, Horst A. Henning
Suppl. Information Supplementary Figure 1. Strategy/latency analysis of individual mice during maze learning. a,
 Goal-oriented searching mediated by ventral hippocampus early in trial-and-error learning Ruediger, S, Spirig, D., Donato, F., Caroni, P. Suppl. Information Supplementary Figure 1. Strategy/latency analysis
The individual animals, the basic design of the experiments and the electrophysiological
 SUPPORTING ONLINE MATERIAL Material and Methods The individual animals, the basic design of the experiments and the electrophysiological techniques for extracellularly recording from dopamine neurons were
Supplemental Material
 Supplemental Material Recording technique Multi-unit activity (MUA) was recorded from electrodes that were chronically implanted (Teflon-coated platinum-iridium wires) in the primary visual cortex representing
Sound Texture Classification Using Statistics from an Auditory Model
 Sound Texture Classification Using Statistics from an Auditory Model Gabriele Carotti-Sha Evan Penn Daniel Villamizar Electrical Engineering Email: gcarotti@stanford.edu Mangement Science & Engineering
Gap Junctions between Interneurons Are Required for Normal Spatial Coding in the Hippocampus and Short-Term Spatial Memory
 6542 The Journal of Neuroscience, April 27, 2011 31(17):6542 6552 Behavioral/Systems/Cognitive Gap Junctions between Interneurons Are Required for Normal Spatial Coding in the Hippocampus and Short-Term
Analysis of in-vivo extracellular recordings. Ryan Morrill Bootcamp 9/10/2014
 Analysis of in-vivo extracellular recordings Ryan Morrill Bootcamp 9/10/2014 Goals for the lecture Be able to: Conceptually understand some of the analysis and jargon encountered in a typical (sensory)
Supplementary Figure S1: Histological analysis of kainate-treated animals
 Supplementary Figure S1: Histological analysis of kainate-treated animals Nissl stained coronal or horizontal sections were made from kainate injected (right) and saline injected (left) animals at different
Tuning properties of individual circuit components and stimulus-specificity of experience-driven changes.
 Supplementary Figure 1 Tuning properties of individual circuit components and stimulus-specificity of experience-driven changes. (a) Left, circuit schematic with the imaged component (L2/3 excitatory neurons)
SUPPLEMENTARY INFORMATION Perceptual learning in a non-human primate model of artificial vision
 SUPPLEMENTARY INFORMATION Perceptual learning in a non-human primate model of artificial vision Nathaniel J. Killian 1,2, Milena Vurro 1,2, Sarah B. Keith 1, Margee J. Kyada 1, John S. Pezaris 1,2 1 Department
Figure 1D-F: These panels are not referred to at all in the text, as far as I can tell
 Reviewers' comments: Reviewer #1 (Remarks to the Author): The authors record single units from rat perirhinal cortex during performance of a task involving a rewarded visually cued turn on a figure of
The balance of forward and backward hippocampal sequences shifts across behavioral states
 The balance of forward and backward hippocampal sequences shifts across behavioral states Andrew M. Wikenheiser1 and A. David Redish2 28/May/212 1 Graduate Program in Neuroscience University of Minnesota
Decoding a Perceptual Decision Process across Cortex
 Article Decoding a Perceptual Decision Process across Cortex Adrián Hernández, 1 Verónica Nácher, 1 Rogelio Luna, 1 Antonio Zainos, 1 Luis Lemus, 1 Manuel Alvarez, 1 Yuriria Vázquez, 1 Liliana Camarillo,
Changing expectations about speed alters perceived motion direction
 Current Biology, in press Supplemental Information: Changing expectations about speed alters perceived motion direction Grigorios Sotiropoulos, Aaron R. Seitz, and Peggy Seriès Supplemental Data Detailed
Modeling of Hippocampal Behavior
 Modeling of Hippocampal Behavior Diana Ponce-Morado, Venmathi Gunasekaran and Varsha Vijayan Abstract The hippocampus is identified as an important structure in the cerebral cortex of mammals for forming
Navigation: Inside the Hippocampus
 9.912 Computational Visual Cognition Navigation: Inside the Hippocampus Jakob Voigts 3 Nov 2008 Functions of the Hippocampus: Memory and Space Short term memory Orientation Memory consolidation(h.m)
Spontaneous Cortical Activity Reveals Hallmarks of an Optimal Internal Model of the Environment. Berkes, Orban, Lengyel, Fiser.
 Statistically optimal perception and learning: from behavior to neural representations. Fiser, Berkes, Orban & Lengyel Trends in Cognitive Sciences (2010) Spontaneous Cortical Activity Reveals Hallmarks
2012 Course: The Statistician Brain: the Bayesian Revolution in Cognitive Sciences
 2012 Course: The Statistician Brain: the Bayesian Revolution in Cognitive Sciences Stanislas Dehaene Chair of Experimental Cognitive Psychology Lecture n 5 Bayesian Decision-Making Lecture material translated
Supplementary Information. Gauge size. midline. arcuate 10 < n < 15 5 < n < 10 1 < n < < n < 15 5 < n < 10 1 < n < 5. principal principal
 Supplementary Information set set = Reward = Reward Gauge size Gauge size 3 Numer of correct trials 3 Numer of correct trials Supplementary Fig.. Principle of the Gauge increase. The gauge size (y axis)
Behavioral generalization
 Supplementary Figure 1 Behavioral generalization. a. Behavioral generalization curves in four Individual sessions. Shown is the conditioned response (CR, mean ± SEM), as a function of absolute (main) or
SUPPLEMENTAL MATERIAL
 1 SUPPLEMENTAL MATERIAL Response time and signal detection time distributions SM Fig. 1. Correct response time (thick solid green curve) and error response time densities (dashed red curve), averaged across
Introduction to Computational Neuroscience
 Introduction to Computational Neuroscience Lecture 5: Data analysis II Lesson Title 1 Introduction 2 Structure and Function of the NS 3 Windows to the Brain 4 Data analysis 5 Data analysis II 6 Single
Nature Medicine: doi: /nm.4084
 Supplementary Figure 1: Sample IEDs. (a) Sample hippocampal IEDs from different kindled rats (scale bar = 200 µv, 100 ms). (b) Sample temporal lobe IEDs from different subjects with epilepsy (scale bar
Lateralized hippocampal oscillations underlie distinct aspects of human spatial memory and navigation. Jacobs et al.
 Lateralized hippocampal oscillations underlie distinct aspects of human spatial memory and navigation Jacobs et al. Supplementary Information Lateralized hippocampal oscillations underlie distinct aspects
Tanimoto et al., http ://www.jcb.org /cgi /content /full /jcb /DC1
 Supplemental material JCB Tanimoto et al., http ://www.jcb.org /cgi /content /full /jcb.201510064 /DC1 THE JOURNAL OF CELL BIOLOGY Figure S1. Method for aster 3D tracking, extended characterization of
Head Direction Cells in the Postsubiculum Do Not Show Replay of Prior Waking Sequences During Sleep
 HIPPOCAMPUS 22:604 618 (2012) Head Direction Cells in the Postsubiculum Do Not Show Replay of Prior Waking Sequences During Sleep Mark P. Brandon,* Andrew R. Bogaard, Chris M. Andrews, and Michael E. Hasselmo*
CS/NEUR125 Brains, Minds, and Machines. Due: Friday, April 14
 CS/NEUR125 Brains, Minds, and Machines Assignment 5: Neural mechanisms of object-based attention Due: Friday, April 14 This Assignment is a guided reading of the 2014 paper, Neural Mechanisms of Object-Based
ASSOCIATIVE MEMORY AND HIPPOCAMPAL PLACE CELLS
 International Journal of Neural Systems, Vol. 6 (Supp. 1995) 81-86 Proceedings of the Neural Networks: From Biology to High Energy Physics @ World Scientific Publishing Company ASSOCIATIVE MEMORY AND HIPPOCAMPAL
Supporting Online Material for
 www.sciencemag.org/cgi/content/full/323/5920/1496/dc1 Supporting Online Material for Human Substantia Nigra Neurons Encode Unexpected Financial Rewards Kareem A. Zaghloul,* Justin A. Blanco, Christoph
SUPPLEMENTARY INFORMATION
 doi:10.1038/nature11239 Introduction The first Supplementary Figure shows additional regions of fmri activation evoked by the task. The second, sixth, and eighth shows an alternative way of analyzing reaction
Lecture overview. What hypothesis to test in the fly? Quantitative data collection Visual physiology conventions ( Methods )
") Lecture overview What hypothesis to test in the fly? Quantitative data collection Visual physiology conventions ( Methods ) 1 Lecture overview What hypothesis to test in the fly? Quantitative data collection
Lecture overview What hypothesis to test in the fly? Quantitative data collection Visual physiology conventions ( Methods ) 1 Lecture overview What hypothesis to test in the fly? Quantitative data collection
Nature Neuroscience: doi: /nn Supplementary Figure 1. Overlap between default mode network (DMN) and movie/recall maps.
 and movie/recall maps.") Supplementary Figure 1 Overlap between default mode network (DMN) and movie/recall maps. We defined the DMN for each individual using the posterior medial cortex ROI as a seed for functional connectivity
Supplementary Figure 1 Overlap between default mode network (DMN) and movie/recall maps. We defined the DMN for each individual using the posterior medial cortex ROI as a seed for functional connectivity
Resonant synchronization of heterogeneous inhibitory networks
 Cerebellar oscillations: Anesthetized rats Transgenic animals Recurrent model Review of literature: γ Network resonance Life simulations Resonance frequency Conclusion Resonant synchronization of heterogeneous
Error Detection based on neural signals
 Error Detection based on neural signals Nir Even- Chen and Igor Berman, Electrical Engineering, Stanford Introduction Brain computer interface (BCI) is a direct communication pathway between the brain
Facilitative Effects of the Ampakine CX516 on Short-Term Memory in Rats: Correlations with Hippocampal Neuronal Activity
 The Journal of Neuroscience, April 1, 1998, 18(7):2748 2763 Facilitative Effects of the Ampakine CX516 on Short-Term Memory in Rats: Correlations with Hippocampal Neuronal Activity Robert E. Hampson, 1
Information Processing During Transient Responses in the Crayfish Visual System
 Information Processing During Transient Responses in the Crayfish Visual System Christopher J. Rozell, Don. H. Johnson and Raymon M. Glantz Department of Electrical & Computer Engineering Department of
Brain Forum, presented by Mark J. Schnitzer, HHMI / Stanford Univ.
 Imaging large-scale ensemble neural codes underlying learning and long-term memory Portable microscopy for mice Brain Forum, presented by Mark J. Schnitzer, HHMI / Stanford Univ. Imaging CA1, amygdala
A genetically targeted optical sensor to monitor calcium signals in astrocyte processes
 A genetically targeted optical sensor to monitor calcium signals in astrocyte processes 1 Eiji Shigetomi, 1 Sebastian Kracun, 2 Michael V. Sofroniew & 1,2 *Baljit S. Khakh Ψ 1 Departments of Physiology
2 INSERM U280, Lyon, France
 Natural movies evoke responses in the primary visual cortex of anesthetized cat that are not well modeled by Poisson processes Jonathan L. Baker 1, Shih-Cheng Yen 1, Jean-Philippe Lachaux 2, Charles M.
CHASING WITH A MODEL EYE
 J. exp. Biol. 137, 399-409 (1988) 399 Printed in Great Britain The Company of Biologists Limited 1988 CHASING WITH A MODEL EYE BY STEPHEN YOUNG Department of Pure and Applied Biology, Imperial College,
A Neural Coding Scheme Formed by the Combined Function of Gamma and Theta Oscillations
 Schizophrenia Bulletin vol. 34 no. 5 pp. 974 980, 2008 doi:10.1093/schbul/sbn060 Advance Access publication on June 16, 2008 A Neural Coding Scheme Formed by the Combined Function of Gamma and Theta Oscillations
SUPPLEMENTARY INFORMATION. Table 1 Patient characteristics Preoperative. language testing
 Categorical Speech Representation in the Human Superior Temporal Gyrus Edward F. Chang, Jochem W. Rieger, Keith D. Johnson, Mitchel S. Berger, Nicholas M. Barbaro, Robert T. Knight SUPPLEMENTARY INFORMATION
Graduate School of Integrated Design Engineering, Keio University, Yokohama, Kanagawa, Japan (2)
") AMPLITUDE AND FREQUENCY FEATURE EXTRACTION OF NEURAL ACTIVITY IN MOUSE VENTROLATERAL STRIATUM UNDER DIFFERENT MOTIVATIONAL STATES USING FIBER PHOTOMETRIC SYSTEM S. Imai (1), Y. Mitsukura (2), K. Yoshida
AMPLITUDE AND FREQUENCY FEATURE EXTRACTION OF NEURAL ACTIVITY IN MOUSE VENTROLATERAL STRIATUM UNDER DIFFERENT MOTIVATIONAL STATES USING FIBER PHOTOMETRIC SYSTEM S. Imai (1), Y. Mitsukura (2), K. Yoshida
Supplementary Figure 1. ACE robotic platform. A. Overview of the rig setup showing major hardware components of ACE (Automatic single Cell
 2 Supplementary Figure 1. ACE robotic platform. A. Overview of the rig setup showing major hardware components of ACE (Automatic single Cell Experimenter) including the MultiClamp 700B, Digidata 1440A,
Characterization of Sleep Spindles
 Characterization of Sleep Spindles Simon Freedman Illinois Institute of Technology and W.M. Keck Center for Neurophysics, UCLA (Dated: September 5, 2011) Local Field Potential (LFP) measurements from sleep
A cognitive map for object memory in the hippocampus
 Research A cognitive map for object memory in the hippocampus Joseph R. Manns 1,3 and Howard Eichenbaum 2 1 Department of Psychology, Emory University, Atlanta, Georgia 30322, USA; 2 Center for Memory
Preconfigured, Skewed Distribution of Firing Rates in the Hippocampus and Entorhinal Cortex
 Cell Reports Article Preconfigured, Skewed Distribution of Firing Rates in the Hippocampus and Entorhinal Cortex Kenji Mizuseki,, * and György uzsáki, * NYU Neuroscience Institute, Langone Medical Center,
Dynamic Interactions between Local Surface Cues, Distal Landmarks, and Intrinsic Circuitry in Hippocampal Place Cells
 The Journal of Neuroscience, July 15, 2002, 22(14):6254 6264 Dynamic Interactions between Local Surface Cues, Distal Landmarks, and Intrinsic Circuitry in Hippocampal Place Cells James J. Knierim Department