Nature Neuroscience: doi: /nn Supplementary Figure 1
|
|
|
- Ashley Wilkerson
- 5 years ago
- Views:
Transcription
 preferentially occur when a greater proportion of recent trials have been rewarded (same data set as Fig 1d-i). (b) (top) Schematic of video analysis.")
1 Supplementary Figure 1 Reward rate affects the decision to begin work. (a) Latency distributions are bimodal, and depend on reward rate. Very short latencies (early peak) preferentially occur when a greater proportion of recent trials have been rewarded (same data set as Fig 1d-i). (b) (top) Schematic of video analysis. Each trial was categorized as engaged (already waiting for Light-On) or non-engaged based upon distance (s) and orientation (θ) immediately before Light-On (see Methods). (bottom) Arrows indicate rat head position and orientation for engaged (pink) and non-engaged (green) trials (one example session shown). (c) Categorization into engaged, non-engaged trials accounts for bimodal latency distribution (data shown are all non-laser trials across 12 ChR2 sessions in TH-Cre+ rats). (d) Proportion of engaged trials increases when more recent trials have been rewarded (3336 trials from 4 rats, r=0.82, p=0.003). (e) Especially for non-engaged trials, latencies are lower when reward rate is higher (r=-0.11,p=0.004 for 1570 engaged trials, r=-0.18, p=5.2x10⁻¹⁹ for 1766 non-engaged trials).
2
3 Supplementary Figure 2 Individual microdialysis sessions. Each row shows data for a different session, with indicated rat ID (e.g. IM463) and recording side (LH = left, RH=right). From left: dialysis probe location, behavioral and [DA] time courses, and individual session correlations to behavioral variables. Reward rate is in units of rewards per min. Numbers of microdialysis samples for each of the seven sessions: 86,72,39,39,68,73,67 respectively. The overall relationship between dopamine and reward rate remained highly significant even if excluding periods of inactivity (defined as no trials initiated for >2 minutes, shaded in green; regression R 2 = 0.12, p = 1.4 x ).
.")
4 Supplementary Figure 3 Cross-correlograms for behavioral variables and neurochemicals. Each plot shows cross-correlograms averaged across all microdialysis sessions, all using the same axes (-20min to +20min lags, -0.5 to +1 correlation). Colored lines indicate statistical thresholds corrected for multiple comparisons (see Methods). Many neurochemical pairs show no evidence of covariation, but others display strong relationships including a cluster of glutamate, serine, aspartate and glycine.
5
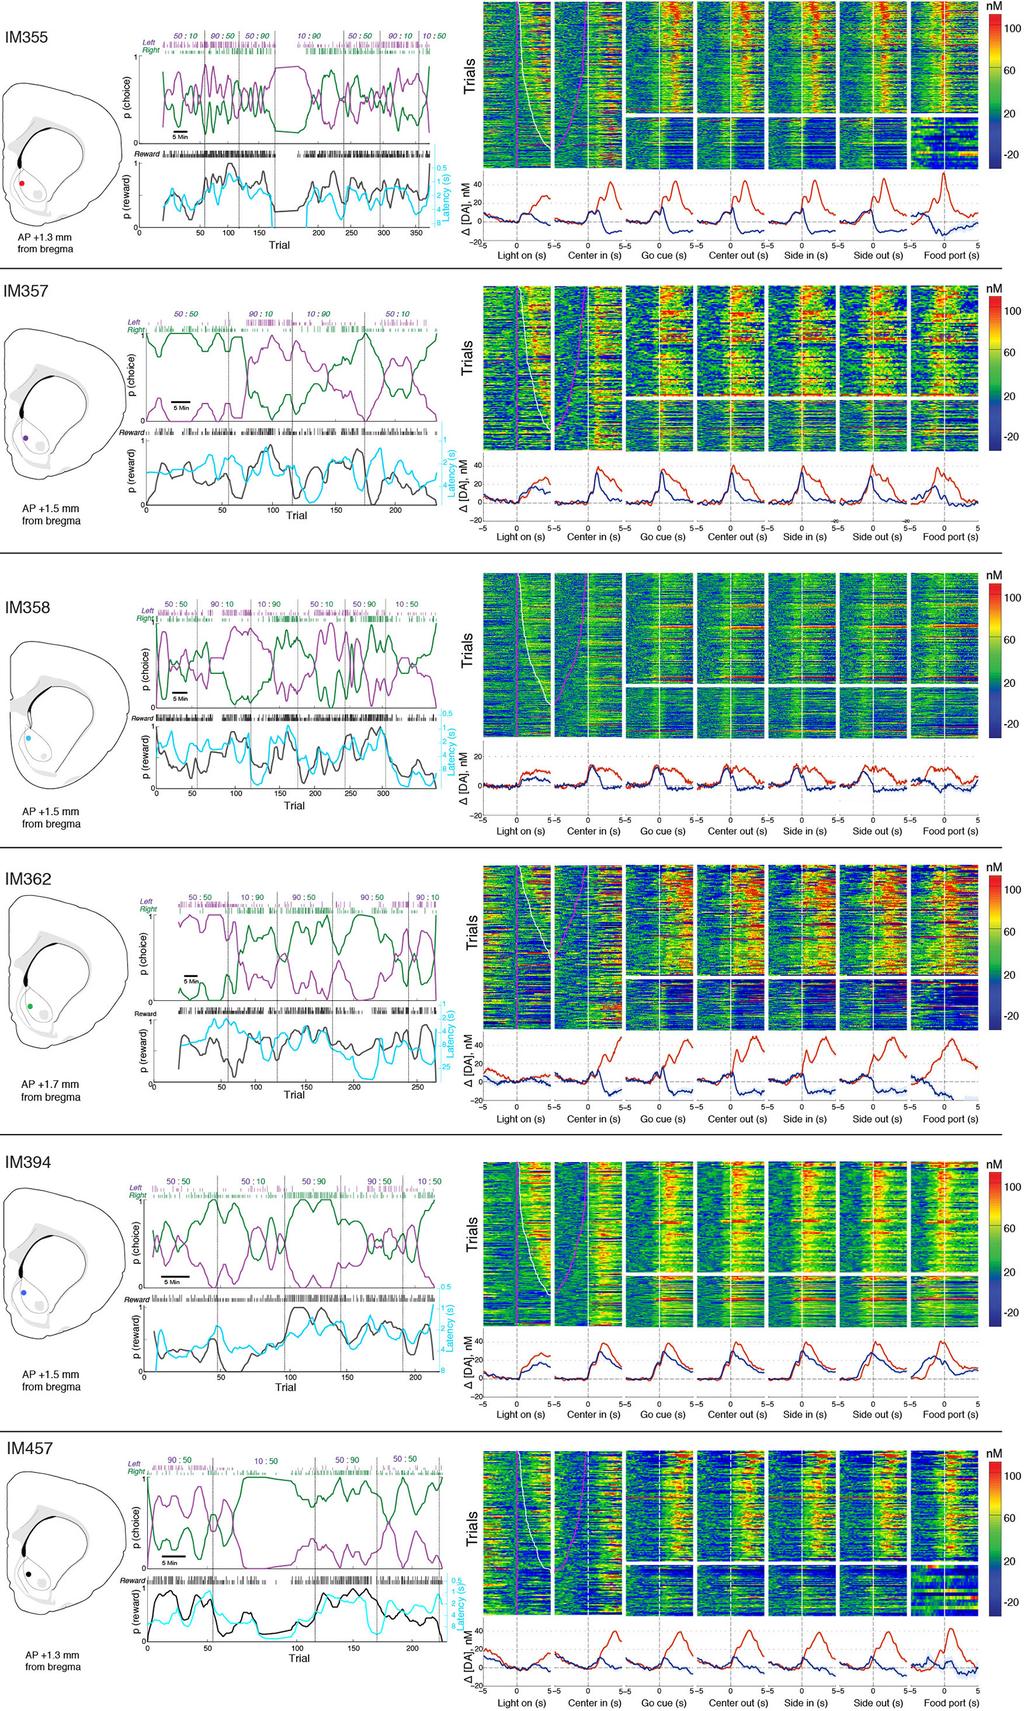
6 Supplementary Figure 4 Individual voltammetry sessions. Each row shows data for a different rat (e.g. IM355, which was also used as the example in Figs.3,4). At left, recording site within nucleus accumbens. Middle panels show behavioral data for the FSCV session (same format as Fig.1). Right panels show individual FSCV data (same format as Fig.3, but with additional event alignments).
 (rather than, for example, separate state-action (Q) values for leftward and rightward trials).")
7 Supplementary Figure 5 SMDP model. (a) Task performance was modeled as a sequence of transitions between states of the agent (rat). Each state had a single associated cached value V(s) (rather than, for example, separate state-action (Q) values for leftward and rightward trials). Most state transitions occur at variable times (hence semi-markov ) marked by observed external events (Center-In, Go-Cue, etc). In contrast, the state sequence between Side-Out and Reward Port In is arbitrarily defined ( Approaching Reward Port begins 1s before Reward Port In; Arriving At Reward Port begins 0.5s before Reward Port In). Changing the number or specific timing of these intermediate states does not materially affect the rising shape of the value function. (b) Average correlation (color scale = Spearman s r) between SMDP model state value at Center-In (Vci) and latency across all six FSCV rats, for a range of learning rates ɑ and exponential discounting time constants ɣ. Note that color scale is inverted (red indicates strongest negative relationship, with higher value corresponding to shorter latency). White dot marks point of strongest relationship (ɑ=0.40, ɣ=0.95). (c) Correlation between [DA] and state value V is stronger than the correlation between [DA] and reward prediction error δ, across the same range of parameters. Color scale at right is the same for both matrices (Spearman s r).
8
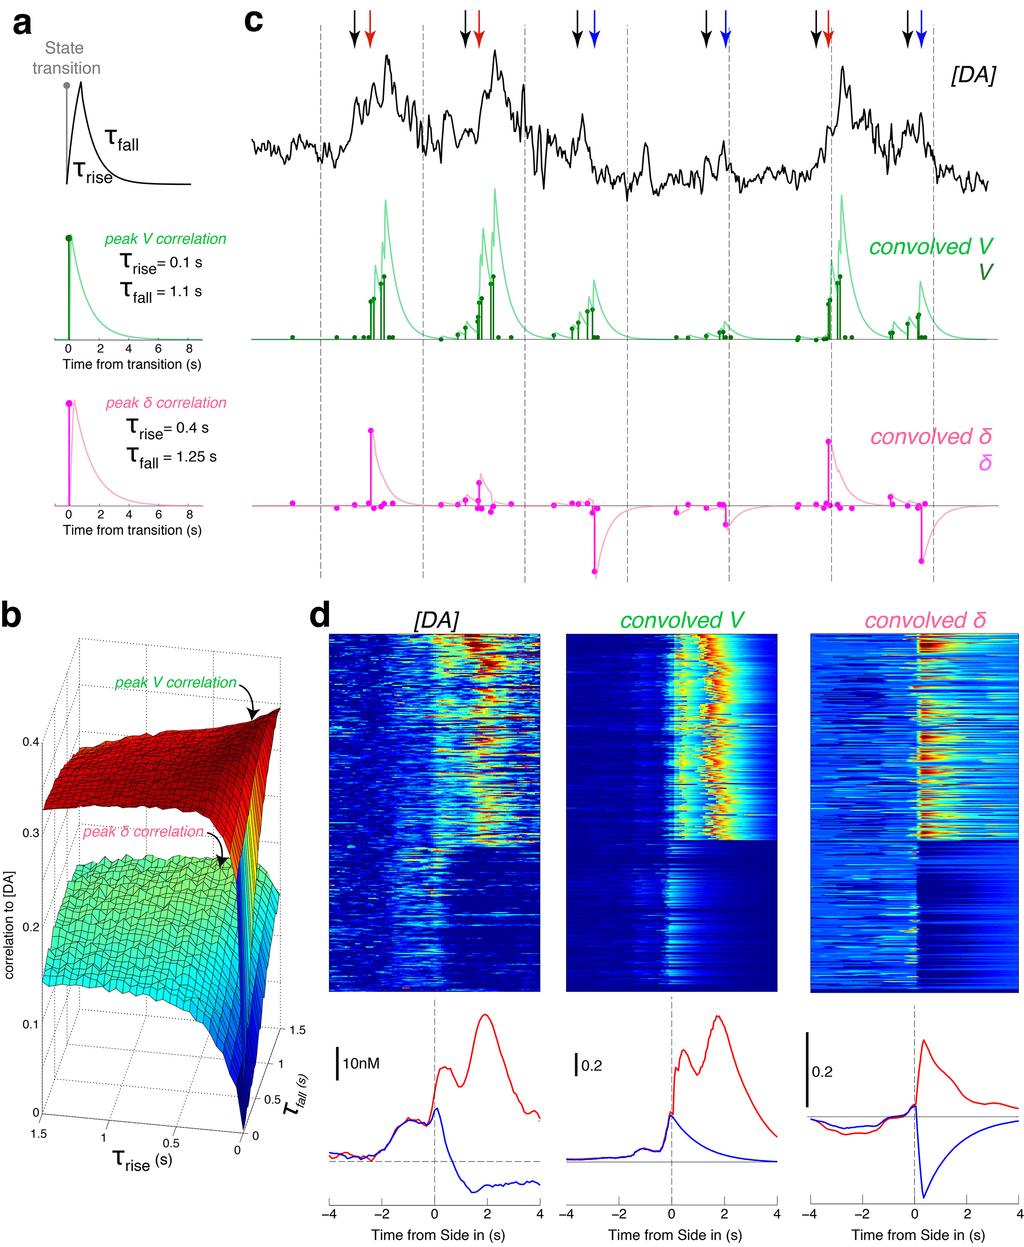
9 Supplementary Figure 6 Dopamine relationships to temporally-stretched model variables. (a) Kernel consisted of an exponential rise (to 50% of asymptote) and an exponential fall, with separate time constants. (b) Within-trial correlation coefficients between [DA] and kernel-convolved model variables V and δ, for a range of rise and fall time constants (0-1.5s each, in 50ms timesteps, using data from all 6 rats). Regardless of parameter values, [DA] correlations to V were always higher than to δ. (c) Same example data as Fig. 4E, but also showing convolved V and δ (using time constants that maximized correlation to [DA] in each case). (d) Trial-by-trial (top) and average (bottom) [DA], convolved V, and convolved δ, for the same session as Fig. 4d,e.
 of the observed fiber tip location. Green indicates expression of eyfp, blue is DAPI counterstain.")
10 Supplementary Figure 7 Histology for behavioral optogenetic experiments. Identifier (e.g. IM389 ) for each rat is given at bottom right corner. Coronal sections shown are within 180µm (anterior-posterior) of the observed fiber tip location. Green indicates expression of eyfp, blue is DAPI counterstain. In a couple of cases (IM423, IM441) autofluorescence of damaged brain tissue is visible along the optic fiber tracts; this was not specific to the green channel.
11
12 Supplementary Figure 8 Further analysis of persistence of optogenetic effects. (a) Regression analysis showing substantial effects of recent rewards (black) on latency, but no comparable effect of recent Side-In laser stimulations on latency. (b) Effects of Light-On [DA] manipulation on same-trial latency distributions (top), and of Side-In [DA] manipulation on next-trial latency distributions (bottom). Dataset shown is the same as Fig. 6c, i.e. all completed trials in TH-Cre + rats with ChR2 (left), TH-Cre - rats with ChR2 (middle) and TH-Cre + rats with halorhodopsin (right). (c) Regression analysis of laser stimulation on subsequent left/right choices. Recent food rewards for a given left/right action increase the probability that it will be repeated. Extra [DA] at Light-On has little or no effect on subsequent choices, but extra [DA] at Side-In is persistently reinforcing. For the Side-In data, note especially the positive coefficients for otherwise unrewarded laser trials.
 Extra [DA] at Light-On causes shorter latencies for non-engaged trials, but longer latencies for a subset of engaged trials.")
13 Supplementary Figure 9 Video analysis of optogenetic effects on latency. (a) Extra [DA] at Light-On causes shorter latencies for non-engaged trials, but longer latencies for a subset of engaged trials. Top plot shows all trials (for the n=4 TH-Cre + rats with ChR2 stimulation at Light-On for which video was recorded; 3 sessions/rat; 3336 no-laser trials in grey; 1335 laser trials in blue). Bottom plots show the breakdown into engaged (n=1975) and non-engaged (n=2696) trials. (b) We examined whether laser-slowed trials might be those in which the rat was waiting at the wrong port (if, for example, DA were to increase the salience of currently attended stimuli). Engaged trials were further broken down into lucky guesses (those trials for which the rat was immediately adjacent to the start port as it was illuminated) and unlucky guesses (immediately adjacent to one of the other two possible start ports). Blue dashed ellipses indicate zones used to classify trials by guessed port (8.5cm long diameter, 3.4cm short diameter) (c) Laser-slowing was observed for both lucky (n=603) and unlucky (n=1007) guesses. Note that blue distribution is bimodal in both cases, indicating that only a subset of trials were affected. Video observations suggested that on some trials extra [DA] evokes a small extra head/neck movement, that makes the trajectory to the illuminated port longer and therefore slower. (d) Quantification of trajectories, by scoring rat location on each video frame from 1s before Light-On to 1s after Center-In. Colored lines show all individual trajectories for one example session. Panels at right show the same trajectories plotted as distance remaining from Center-In port, by time elapsed from either Light-On or Center-In. Note that for non-engaged trials (green), the approach to the Center-In port consistently takes ~1-2s. Therefore, the epoch considered as baseline in the FSCV analyses (-3 to -1s relative to Center-In) is around the time that rats decide to initiate approach behaviors. (e) Extra [DA] causes longer average trajectories for engaged trials. Cumulative distributions of path-lengths between Light-On and Center-In, for (top-to-bottom) engaged/lucky, engaged/unlucky and non-engaged respectively. Blue lines indicate laser trials, and p-values are from Komolgorov-Smirnov tests comparing laser to no-laser distributions (no-laser/laser trial numbers: top, 292/75; middle, 424/99; bottom, 1897/792). On engaged trials rats often reoriented between the three potential start ports, perhaps checking if they were illuminated; one possibility is that the extra laser-evoked movement on engaged trials reflects dopaminergic facilitation of these orienting movements. If such a movement is already close to execution before Light-On, it may be evoked before the correct start port can be appropriately targeted. (f) Additional trajectory analysis, plotting time courses of rat distance from the illuminated start port. On non-engaged trials extra [DA] tends to make the approach to the illuminated start port occur earlier (note progressive separation of green, blue lines when aligned on Light-On). However, the approach time course is extremely similar (note overlapping lines in the final ~1-2s before Center-In), indicating that extra [DA] did not affect the speed of approach.
14 Supplementary Figure 10 Optogenetic effects on hazard rates for individual video-scored rats. Latency survivor plots (top) and corresponding hazard rates (bottom) for each of the four TH-Cre + rats with ChR2 stimulation at Light- On for which video was recorded (each rat had 3 video sessions that were concatenated for analysis). Only non-engaged trials are included (Numbers of no-laser/laser trials: IM-389, 522/215; IM-391, 294/125; IM-392, 481/191; IM-394, 462/189). For each rat laser stimulation caused an increase in the hazard rate of the Center-In event ~1-2s later (the duration of an approach).
Supplementary Figure 1 Information on transgenic mouse models and their recording and optogenetic equipment. (a) 108 (b-c) (d) (e) (f) (g)
 108 (b-c) (d) (e) (f) (g)") Supplementary Figure 1 Information on transgenic mouse models and their recording and optogenetic equipment. (a) In four mice, cre-dependent expression of the hyperpolarizing opsin Arch in pyramidal cells
Supplementary Figure 1 Information on transgenic mouse models and their recording and optogenetic equipment. (a) In four mice, cre-dependent expression of the hyperpolarizing opsin Arch in pyramidal cells
Nature Neuroscience: doi: /nn Supplementary Figure 1. Behavioral training.
 Supplementary Figure 1 Behavioral training. a, Mazes used for behavioral training. Asterisks indicate reward location. Only some example mazes are shown (for example, right choice and not left choice maze
Nature Neuroscience: doi: /nn Supplementary Figure 1. Trial structure for go/no-go behavior
 Supplementary Figure 1 Trial structure for go/no-go behavior a, Overall timeline of experiments. Day 1: A1 mapping, injection of AAV1-SYN-GCAMP6s, cranial window and headpost implantation. Water restriction
Nature Neuroscience: doi: /nn Supplementary Figure 1. Confirmation that optogenetic inhibition of dopaminergic neurons affects choice
 Supplementary Figure 1 Confirmation that optogenetic inhibition of dopaminergic neurons affects choice (a) Sample behavioral trace as in Figure 1d, but with NpHR stimulation trials depicted as green blocks
Nature Neuroscience: doi: /nn Supplementary Figure 1. Lick response during the delayed Go versus No-Go task.
 Supplementary Figure 1 Lick response during the delayed Go versus No-Go task. Trial-averaged lick rate was averaged across all mice used for pyramidal cell imaging (n = 9). Different colors denote different
Hormonal gain control of a medial preoptic area social reward circuit
 CORRECTION NOTICE Nat. Neurosci. 20, 449 458 (2017) Hormonal gain control of a medial preoptic area social reward circuit Jenna A McHenry, James M Otis, Mark A Rossi, J Elliott Robinson, Oksana Kosyk,
Supplementary figure 1: LII/III GIN-cells show morphological characteristics of MC
 1 2 1 3 Supplementary figure 1: LII/III GIN-cells show morphological characteristics of MC 4 5 6 7 (a) Reconstructions of LII/III GIN-cells with somato-dendritic compartments in orange and axonal arborizations
Nature Neuroscience: doi: /nn Supplementary Figure 1
 Supplementary Figure 1 Drd1a-Cre driven ChR2 expression in the SCN. (a) Low-magnification image of a representative Drd1a-ChR2 coronal brain section (n = 2) showing endogenous tdtomato fluorescence (magenta).
SUPPLEMENTAL MATERIAL
 1 SUPPLEMENTAL MATERIAL Response time and signal detection time distributions SM Fig. 1. Correct response time (thick solid green curve) and error response time densities (dashed red curve), averaged across
Theta sequences are essential for internally generated hippocampal firing fields.
 Theta sequences are essential for internally generated hippocampal firing fields. Yingxue Wang, Sandro Romani, Brian Lustig, Anthony Leonardo, Eva Pastalkova Supplementary Materials Supplementary Modeling
Summary of behavioral performances for mice in imaging experiments.
 Supplementary Figure 1 Summary of behavioral performances for mice in imaging experiments. (a) Task performance for mice during M2 imaging experiments. Open triangles, individual experiments. Filled triangles,
Supplementary Figure 1
 Supplementary Figure 1 Miniature microdrive, spike sorting and sleep stage detection. a, A movable recording probe with 8-tetrodes (32-channels). It weighs ~1g. b, A mouse implanted with 8 tetrodes in
Double dissociation of value computations in orbitofrontal and anterior cingulate neurons
 Supplementary Information for: Double dissociation of value computations in orbitofrontal and anterior cingulate neurons Steven W. Kennerley, Timothy E. J. Behrens & Jonathan D. Wallis Content list: Supplementary
Supplemental Information. Dorsal Raphe Dual Serotonin-Glutamate Neurons. Drive Reward by Establishing Excitatory Synapses
 Cell Reports, Volume 26 Supplemental Information Dorsal Raphe Dual Serotonin-Glutamate Neurons Drive Reward by Establishing Excitatory Synapses on VTA Mesoaccumbens Dopamine Neurons Hui-Ling Wang, Shiliang
Supplementary materials for: Executive control processes underlying multi- item working memory
 Supplementary materials for: Executive control processes underlying multi- item working memory Antonio H. Lara & Jonathan D. Wallis Supplementary Figure 1 Supplementary Figure 1. Behavioral measures of
Nature Neuroscience: doi: /nn Supplementary Figure 1. MADM labeling of thalamic clones.
 Supplementary Figure 1 MADM labeling of thalamic clones. (a) Confocal images of an E12 Nestin-CreERT2;Ai9-tdTomato brain treated with TM at E10 and stained for BLBP (green), a radial glial progenitor-specific
Nature Neuroscience doi: /nn Supplementary Figure 1. Characterization of viral injections.
 Supplementary Figure 1 Characterization of viral injections. (a) Dorsal view of a mouse brain (dashed white outline) after receiving a large, unilateral thalamic injection (~100 nl); demonstrating that
Supplementary Figure 1. Recording sites.
 Supplementary Figure 1 Recording sites. (a, b) Schematic of recording locations for mice used in the variable-reward task (a, n = 5) and the variable-expectation task (b, n = 5). RN, red nucleus. SNc,
Supplementary Information. Gauge size. midline. arcuate 10 < n < 15 5 < n < 10 1 < n < < n < 15 5 < n < 10 1 < n < 5. principal principal
 Supplementary Information set set = Reward = Reward Gauge size Gauge size 3 Numer of correct trials 3 Numer of correct trials Supplementary Fig.. Principle of the Gauge increase. The gauge size (y axis)
SUPPLEMENTARY INFORMATION. Supplementary Figure 1
 SUPPLEMENTARY INFORMATION Supplementary Figure 1 The supralinear events evoked in CA3 pyramidal cells fulfill the criteria for NMDA spikes, exhibiting a threshold, sensitivity to NMDAR blockade, and all-or-none
Nature Methods: doi: /nmeth Supplementary Figure 1. Activity in turtle dorsal cortex is sparse.
 Supplementary Figure 1 Activity in turtle dorsal cortex is sparse. a. Probability distribution of firing rates across the population (notice log scale) in our data. The range of firing rates is wide but
File name: Supplementary Information Description: Supplementary Figures, Supplementary Table and Supplementary References
 File name: Supplementary Information Description: Supplementary Figures, Supplementary Table and Supplementary References File name: Supplementary Data 1 Description: Summary datasheets showing the spatial
Behavioral generalization
 Supplementary Figure 1 Behavioral generalization. a. Behavioral generalization curves in four Individual sessions. Shown is the conditioned response (CR, mean ± SEM), as a function of absolute (main) or
Supplementary Figure 1. GABA depolarizes the majority of immature neurons in the
 Supplementary Figure 1. GABA depolarizes the majority of immature neurons in the upper cortical layers at P3 4 in vivo. (a b) Cell-attached current-clamp recordings illustrate responses to puff-applied
Sum of Neurally Distinct Stimulus- and Task-Related Components.
 SUPPLEMENTARY MATERIAL for Cardoso et al. 22 The Neuroimaging Signal is a Linear Sum of Neurally Distinct Stimulus- and Task-Related Components. : Appendix: Homogeneous Linear ( Null ) and Modified Linear
SUPPLEMENTARY INFORMATION
 doi:1.138/nature1139 a d Whisker angle (deg) Whisking repeatability Control Muscimol.4.3.2.1 -.1 8 4-4 1 2 3 4 Performance (d') Pole 8 4-4 1 2 3 4 5 Time (s) b Mean protraction angle (deg) e Hit rate (p
Nature Neuroscience: doi: /nn Supplementary Figure 1
 Supplementary Figure 1 Atlas representations of the midcingulate (MCC) region targeted in this study compared against the anterior cingulate (ACC) region commonly reported. Coronal sections are shown on
Nature Neuroscience: doi: /nn.4642
 Supplementary Figure 1 Recording sites and example waveform clustering, as well as electrophysiological recordings of auditory CS and shock processing following overtraining. (a) Recording sites in LC
SUPPLEMENTARY INFORMATION
 SUPPLEMENTARY INFORMATION doi:10.1038/nature12024 entary Figure 1. Distribution of the number of earned cocaine Supplementary Figure 1. Distribution of the number of earned cocaine infusions in Shock-sensitive
Nature Neuroscience: doi: /nn Supplementary Figure 1. Diverse anorexigenic signals induce c-fos expression in CEl PKC-δ + neurons
 Supplementary Figure 1 Diverse anorexigenic signals induce c-fos expression in CEl PKC-δ + neurons a-c. Quantification of CEl c-fos expression in mice intraperitoneal injected with anorexigenic drugs (a),
Book 3: Lab Procedures Book 3: Ch. 1: The Hypothesis and Overview
 Book 3: Lab Procedures Book 3: Ch. 1: The Hypothesis and Overview 13 Introduction This experiment will investigate how cocaine acts on dopamine neurons in the brain. Cocaine is a drug of abuse that increases
Mnemonic representations of transient stimuli and temporal sequences in the rodent hippocampus in vitro
 Supplementary Material Mnemonic representations of transient stimuli and temporal sequences in the rodent hippocampus in vitro Robert. Hyde and en W. Strowbridge Mossy ell 1 Mossy ell Mossy ell 3 Stimulus
Dopamine in Ube3a m-/p+ mice. Online Supplemental Material
 Online Supplemental Material S1 Supplemental Figure 1. Schematic of rate-dependent intracranial self-stimulation (ICSS) (A) Mice implanted with monopolar stimulating electrodes to the medial forebrain
Microcircuitry coordination of cortical motor information in self-initiation of voluntary movements
 Y. Isomura et al. 1 Microcircuitry coordination of cortical motor information in self-initiation of voluntary movements Yoshikazu Isomura, Rie Harukuni, Takashi Takekawa, Hidenori Aizawa & Tomoki Fukai
Tuning properties of individual circuit components and stimulus-specificity of experience-driven changes.
 Supplementary Figure 1 Tuning properties of individual circuit components and stimulus-specificity of experience-driven changes. (a) Left, circuit schematic with the imaged component (L2/3 excitatory neurons)
Supplementary Material for
 Supplementary Material for Selective neuronal lapses precede human cognitive lapses following sleep deprivation Supplementary Table 1. Data acquisition details Session Patient Brain regions monitored Time
Supporting Information
 1 2 3 4 5 6 7 8 9 10 11 12 13 14 15 16 17 18 19 20 21 22 23 24 25 26 27 28 29 30 31 32 33 34 35 36 37 38 39 40 Supporting Information Variances and biases of absolute distributions were larger in the 2-line
CD4 and CD8 T cells show a similar accumulation in the tumor stroma.
 Fig S1 CD4 Fibronectin EpCM CD8 CD4 and CD8 T cells show a similar accumulation in the tumor stroma. Fluorescently-labeled CD4 (CMFD, green) and CD8 (Hoechst, yellow) T cells were added to a human lung
Supplementary Information
 Supplementary Information The neural correlates of subjective value during intertemporal choice Joseph W. Kable and Paul W. Glimcher a 10 0 b 10 0 10 1 10 1 Discount rate k 10 2 Discount rate k 10 2 10
Supplementary Information. Detection and delineation of oral cancer with a PARP1 targeted optical imaging agent
 Supplementary Information Detection and delineation of oral cancer with a PARP1 targeted optical imaging agent Authors: Susanne Kossatz a, Christian Brand a, Stanley Gutiontov b, Jonathan T.C. Liu c, Nancy
Intravital Microscopic Interrogation of Peripheral Taste Sensation
 Supplementary Information Intravital Microscopic Interrogation of Peripheral Taste Sensation Myunghwan Choi 1, Woei Ming Lee 1,2, and Seok-Hyun Yun 1 * 1 Harvard Medical School and Wellman Center for Photomedicine,
Nature Neuroscience: doi: /nn Supplementary Figure 1. Large-scale calcium imaging in vivo.
 Supplementary Figure 1 Large-scale calcium imaging in vivo. (a) Schematic illustration of the in vivo camera imaging set-up for large-scale calcium imaging. (b) High-magnification two-photon image from
Early Learning vs Early Variability 1.5 r = p = Early Learning r = p = e 005. Early Learning 0.
 The temporal structure of motor variability is dynamically regulated and predicts individual differences in motor learning ability Howard Wu *, Yohsuke Miyamoto *, Luis Nicolas Gonzales-Castro, Bence P.
Supplementary Figure 1. Nature Neuroscience: doi: /nn.4547
 Supplementary Figure 1 Characterization of the Microfetti mouse model. (a) Gating strategy for 8-color flow analysis of peripheral Ly-6C + monocytes from Microfetti mice 5-7 days after TAM treatment. Living
Spike Sorting and Behavioral analysis software
 Spike Sorting and Behavioral analysis software Ajinkya Kokate Department of Computational Science University of California, San Diego La Jolla, CA 92092 akokate@ucsd.edu December 14, 2012 Abstract In this
Supplementary Figure 1. Reinforcement altered Training phase RTs.
 Supplementary Figure 1. Reinforcement altered Training phase RTs. To investigate if there were any effects of reinforcement on Simon task performance, the slope of RTs within each block was quantified
Supplementary Figure 1. Metabolic landscape of cancer discovery pipeline. RNAseq raw counts data of cancer and healthy tissue samples were downloaded
 Supplementary Figure 1. Metabolic landscape of cancer discovery pipeline. RNAseq raw counts data of cancer and healthy tissue samples were downloaded from TCGA and differentially expressed metabolic genes
Unique functional properties of somatostatin-expressing GABAergic neurons in mouse barrel cortex
 Supplementary Information Unique functional properties of somatostatin-expressing GABAergic neurons in mouse barrel cortex Luc Gentet, Yves Kremer, Hiroki Taniguchi, Josh Huang, Jochen Staiger and Carl
Resistance to forgetting associated with hippocampus-mediated. reactivation during new learning
 Resistance to Forgetting 1 Resistance to forgetting associated with hippocampus-mediated reactivation during new learning Brice A. Kuhl, Arpeet T. Shah, Sarah DuBrow, & Anthony D. Wagner Resistance to
Supplementary Figure 1
 Supplementary Figure 1 Localization of virus injections. (a) Schematic showing the approximate center of AAV-DIO-ChR2-YFP injection sites in the NAc of Dyn-cre mice (n=8 mice, 16 injections; caudate/putamen,
SUPPLEMENTARY INFORMATION. Teaching brain-machine interfaces as an alternative paradigm to neuroprosthetics control
 SUPPLEMENTARY INFORMATION Teaching brain-machine interfaces as an alternative paradigm to neuroprosthetics control Authors: Iñaki Iturrate 1,2, Ricardo Chavarriaga 2, Luis Montesano 1, Javier Minguez 1,
Nature Biotechnology: doi: /nbt Supplementary Figure 1. Analysis of hair bundle morphology in Ush1c c.216g>a mice at P18 by SEM.
 Supplementary Figure 1 Analysis of hair bundle morphology in Ush1c c.216g>a mice at P18 by SEM. (a-c) Heterozygous c.216ga mice displayed normal hair bundle morphology at P18. (d-i) Disorganized hair bundles
Specimen. Humeral Head. Femoral Head. Objective. Femoral Condyle (medial) Supplementary Figure 1
 Supplementary Figure 1") A B Specimen Humeral Head 2 1 µm 76 µm Femoral Head Objective Femoral Condyle (medial) Supplementary Figure 1 A Femoral Head Global Cell Density Superficial Cell Density Cell Number at 1 µm Nuclei /.1
A B Specimen Humeral Head 2 1 µm 76 µm Femoral Head Objective Femoral Condyle (medial) Supplementary Figure 1 A Femoral Head Global Cell Density Superficial Cell Density Cell Number at 1 µm Nuclei /.1
Supplementary Figure S1: Tanycytes are restricted to the central/posterior hypothalamus
 Supplementary Figure S1: Tanycytes are restricted to the central/posterior hypothalamus a: Expression of Vimentin, GFAP, Sox2 and Nestin in anterior, central and posterior hypothalamus. In the anterior
SUPPLEMENTARY INFORMATION
 doi:10.1038/nature11239 Introduction The first Supplementary Figure shows additional regions of fmri activation evoked by the task. The second, sixth, and eighth shows an alternative way of analyzing reaction
Nature Neuroscience: doi: /nn Supplementary Figure 1. Task timeline for Solo and Info trials.
 Supplementary Figure 1 Task timeline for Solo and Info trials. Each trial started with a New Round screen. Participants made a series of choices between two gambles, one of which was objectively riskier
Attention Response Functions: Characterizing Brain Areas Using fmri Activation during Parametric Variations of Attentional Load
 Attention Response Functions: Characterizing Brain Areas Using fmri Activation during Parametric Variations of Attentional Load Intro Examine attention response functions Compare an attention-demanding
Distinct Roles of Parvalbumin- and Somatostatin- Expressing Interneurons in Working Memory
 Article Distinct Roles of Parvalbumin- and Somatostatin- Expressing Interneurons in Working Memory Highlights d Roles of parvalbumin and somatostatin neurons in working memory were investigated d d Somatostatin
Hippocampal Time Cells : Time versus Path Integration
 Article Hippocampal Time Cells : Time versus Path Integration Benjamin J. Kraus, 1, * Robert J. Robinson II, 1 John A. White, 2 Howard Eichenbaum, 1 and Michael E. Hasselmo 1 1 Center for Memory and Brain,
Supplementary Data Dll4-containing exosomes induce capillary sprout retraction ina 3D microenvironment
 Supplementary Data Dll4-containing exosomes induce capillary sprout retraction ina 3D microenvironment Soheila Sharghi-Namini 1, Evan Tan 1,2, Lee-Ling Sharon Ong 1, Ruowen Ge 2 * and H. Harry Asada 1,3
Auditory Scene Analysis
 1 Auditory Scene Analysis Albert S. Bregman Department of Psychology McGill University 1205 Docteur Penfield Avenue Montreal, QC Canada H3A 1B1 E-mail: bregman@hebb.psych.mcgill.ca To appear in N.J. Smelzer
Nov versus Fam. Fam 1 versus. Fam 2. Supplementary figure 1
 a Environment map similarity score (mean r ).5..3.2.1 Fam 1 versus Fam 2 Nov versus Fam b Environment cofiring similarity score (mean r ).7.6.5..3.2.1 Nov versus Fam Fam 1 versus Fam 2 First half versus
cloglog link function to transform the (population) hazard probability into a continuous
 hazard probability into a continuous") Supplementary material. Discrete time event history analysis Hazard model details. In our discrete time event history analysis, we used the asymmetric cloglog link function to transform the (population)
Supplementary material. Discrete time event history analysis Hazard model details. In our discrete time event history analysis, we used the asymmetric cloglog link function to transform the (population)
Supplementary Information. Staged decline of neuronal function in vivo in an animal model of Alzheimer s Disease. Supplementary Figures S1-10
 Supplementary Information Staged decline of neuronal function in vivo in an animal model of Alzheimer s Disease Christine Grienberger 1 *, Nathalie L. Rochefort 1 *, Helmuth Adelsberger 1, Horst A. Henning
nature methods Organelle-specific, rapid induction of molecular activities and membrane tethering
 nature methods Organelle-specific, rapid induction of molecular activities and membrane tethering Toru Komatsu, Igor Kukelyansky, J Michael McCaffery, Tasuku Ueno, Lidenys C Varela & Takanari Inoue Supplementary
T H E J O U R N A L O F C E L L B I O L O G Y
 Supplemental material Brooks and Wallingford, http://www.jcb.org/cgi/content/full/jcb.201204072/dc1 T H E J O U R N A L O F C E L L B I O L O G Y Figure S1. Quantification of ciliary compartments in control
Disparity- and velocity- based signals for 3D motion perception in human MT+ Bas Rokers, Lawrence K. Cormack, and Alexander C. Huk
 Disparity- and velocity- based signals for 3D motion perception in human MT+ Bas Rokers, Lawrence K. Cormack, and Alexander C. Huk Supplementary Materials fmri response (!% BOLD) ).5 CD versus STS 1 wedge
-51mV 30s 3mV. n=14 n=4 p=0.4. Depolarization (mv) 3
 3") Supplementary Figure 1 a optoβ 2 -AR b ChR2-51mV 30s 3mV -50mV 30s 3mV c 4 n=14 n=4 p=0.4 Depolarization (mv) 3 2 1 0 Both optogenetic actuators, optoβ 2 AR and ChR2, were effective in stimulating astrocytes
Supplementary Figure 1 a optoβ 2 -AR b ChR2-51mV 30s 3mV -50mV 30s 3mV c 4 n=14 n=4 p=0.4 Depolarization (mv) 3 2 1 0 Both optogenetic actuators, optoβ 2 AR and ChR2, were effective in stimulating astrocytes
Supplementary Figure S1: Histological analysis of kainate-treated animals
 Supplementary Figure S1: Histological analysis of kainate-treated animals Nissl stained coronal or horizontal sections were made from kainate injected (right) and saline injected (left) animals at different
Supplemental Information. A Visual-Cue-Dependent Memory Circuit. for Place Navigation
 Neuron, Volume 99 Supplemental Information A Visual-Cue-Dependent Memory Circuit for Place Navigation Han Qin, Ling Fu, Bo Hu, Xiang Liao, Jian Lu, Wenjing He, Shanshan Liang, Kuan Zhang, Ruijie Li, Jiwei
Supplementary Information
 1 Supplementary Information A role for primary cilia in glutamatergic synaptic integration of adult-orn neurons Natsuko Kumamoto 1,4,5, Yan Gu 1,4, Jia Wang 1,4, Stephen Janoschka 1,2, Ken-Ichi Takemaru
d e f Spatiotemporal quantification of subcellular ATP levels in a single HeLa cell during changes in morphology Supplementary Information
 Ca 2+ level (a. u.) Area (a. u.) Normalized distance Normalized distance Center Edge Center Edge Relative ATP level Relative ATP level Supplementary Information Spatiotemporal quantification of subcellular
Supplementary Figure 1. Microdialysis measurements of extracellular dopamine in ventral and dorsal striatum.
 Supplementary Figure 1 Microdialysis measurements of extracellular dopamine in ventral and dorsal striatum. A. Behavioural preparation. Mice are placed in an operant box where a spout containing the artificial
Properties of Nerve Fibres. Dr. Ayisha Qureshi Professor MBBS, MPhil
 Properties of Nerve Fibres Dr. Ayisha Qureshi Professor MBBS, MPhil 1. PROPAGATION OF AN ACTION POTENTIAL Does the action potential become weak (decremental) as it travels down the nerve fiber? Does the
SUPPLEMENTARY INFORMATION
 SUPPLEMENTARY INFORMATION doi:10.1038/nature11306 Supplementary Figures Supplementary Figure 1. Basic characterization of GFP+ RGLs in the dentate gyrus of adult nestin-gfp mice. a, Sample confocal images
Nature Neuroscience: doi: /nn.4335
 Supplementary Figure 1 Cholinergic neurons projecting to the VTA are concentrated in the caudal mesopontine region. (a) Schematic showing the sites of retrograde tracer injections in the VTA: cholera toxin
EDGE DETECTION. Edge Detectors. ICS 280: Visual Perception
 EDGE DETECTION Edge Detectors Slide 2 Convolution & Feature Detection Slide 3 Finds the slope First derivative Direction dependent Need many edge detectors for all orientation Second order derivatives
Tanimoto et al., http ://www.jcb.org /cgi /content /full /jcb /DC1
 Supplemental material JCB Tanimoto et al., http ://www.jcb.org /cgi /content /full /jcb.201510064 /DC1 THE JOURNAL OF CELL BIOLOGY Figure S1. Method for aster 3D tracking, extended characterization of
Supplementary Figure 1. Example of an amygdala neuron whose activity reflects value during the visual stimulus interval. This cell responded more
 1 Supplementary Figure 1. Example of an amygdala neuron whose activity reflects value during the visual stimulus interval. This cell responded more strongly when an image was negative than when the same
Wenqin Hu, Cuiping Tian, Tun Li, Mingpo Yang, Han Hou & Yousheng Shu
 Distinct contributions of Na v 1.6 and Na v 1.2 in action potential initiation and backpropagation Wenqin Hu, Cuiping Tian, Tun Li, Mingpo Yang, Han Hou & Yousheng Shu Supplementary figure and legend Supplementary
A genetically targeted optical sensor to monitor calcium signals in astrocyte processes
 A genetically targeted optical sensor to monitor calcium signals in astrocyte processes 1 Eiji Shigetomi, 1 Sebastian Kracun, 2 Michael V. Sofroniew & 1,2 *Baljit S. Khakh Ψ 1 Departments of Physiology
SUPPLEMENTARY INFORMATION
 doi:10.1038/nature10776 Supplementary Information 1: Influence of inhibition among blns on STDP of KC-bLN synapses (simulations and schematics). Unconstrained STDP drives network activity to saturation
Actions in the Eye: Dynamic Gaze Datasets and Learnt Saliency Models for Visual Recognition
 Actions in the Eye: Dynamic Gaze Datasets and Learnt Saliency Models for Visual Recognition Stefan Mathe, Cristian Sminchisescu Presented by Mit Shah Motivation Current Computer Vision Annotations subjectively
Nature Immunology: doi: /ni Supplementary Figure 1. RNA-Seq analysis of CD8 + TILs and N-TILs.
 Supplementary Figure 1 RNA-Seq analysis of CD8 + TILs and N-TILs. (a) Schematic representation of the tumor and cell types used for the study. HNSCC, head and neck squamous cell cancer; NSCLC, non-small
Nature Neuroscience: doi: /nn Supplementary Figure 1
 Supplementary Figure 1 Relative expression of K IR2.1 transcript to enos was reduced 29-fold in capillaries from knockout animals. Relative expression of K IR2.1 transcript to enos was reduced 29-fold
Supplementary Figure 1. SDS-FRL localization of CB 1 in the distal CA3 area of the rat hippocampus. (a-d) Axon terminals (t) in stratum pyramidale
 Axon terminals (t) in stratum pyramidale") Supplementary Figure 1. SDS-FRL localization of CB 1 in the distal CA3 area of the rat hippocampus. (a-d) Axon terminals (t) in stratum pyramidale (b) show stronger immunolabeling for CB 1 than those in
Supplementary Figure 1. SDS-FRL localization of CB 1 in the distal CA3 area of the rat hippocampus. (a-d) Axon terminals (t) in stratum pyramidale (b) show stronger immunolabeling for CB 1 than those in
Neurobiological Foundations of Reward and Risk
 Neurobiological Foundations of Reward and Risk... and corresponding risk prediction errors Peter Bossaerts 1 Contents 1. Reward Encoding And The Dopaminergic System 2. Reward Prediction Errors And TD (Temporal
The individual animals, the basic design of the experiments and the electrophysiological
 SUPPORTING ONLINE MATERIAL Material and Methods The individual animals, the basic design of the experiments and the electrophysiological techniques for extracellularly recording from dopamine neurons were
Nature Neuroscience: doi: /nn Supplementary Figure 1. Splenic atrophy and leucopenia caused by T3 SCI.
 Supplementary Figure 1 Splenic atrophy and leucopenia caused by T3 SCI. (a) Gross anatomy of representative spleens from control and T3 SCI mice at 28 days post-injury. (b and c) Hematoxylin and eosin
Reward prediction based on stimulus categorization in. primate lateral prefrontal cortex
 Reward prediction based on stimulus categorization in primate lateral prefrontal cortex Xiaochuan Pan, Kosuke Sawa, Ichiro Tsuda, Minoro Tsukada, Masamichi Sakagami Supplementary Information This PDF file
Subjectively interpreted shape dimensions as privileged and. orthogonal axes in mental shape space
 Running head: A ROADMAP INTO MENTAL SHAPE SPACE Subjectively interpreted shape dimensions as privileged and orthogonal axes in mental shape space Bart Ons 1 Wouter De Baene 2, 3 Johan Wagemans 1 1 Laboratory
Nature Biotechnology: doi: /nbt Supplementary Figure 1. Experimental design and workflow utilized to generate the WMG Protein Atlas.
 Supplementary Figure 1 Experimental design and workflow utilized to generate the WMG Protein Atlas. (a) Illustration of the plant organs and nodule infection time points analyzed. (b) Proteomic workflow
Nature Medicine: doi: /nm.4084
 Supplementary Figure 1: Sample IEDs. (a) Sample hippocampal IEDs from different kindled rats (scale bar = 200 µv, 100 ms). (b) Sample temporal lobe IEDs from different subjects with epilepsy (scale bar
Lateral Geniculate Nucleus (LGN)
") Lateral Geniculate Nucleus (LGN) What happens beyond the retina? What happens in Lateral Geniculate Nucleus (LGN)- 90% flow Visual cortex Information Flow Superior colliculus 10% flow Slide 2 Information
Lateral Geniculate Nucleus (LGN) What happens beyond the retina? What happens in Lateral Geniculate Nucleus (LGN)- 90% flow Visual cortex Information Flow Superior colliculus 10% flow Slide 2 Information
Supplementary Figure 1
 Supplementary Figure 1 Global TeNT expression effectively impairs synaptic transmission. Injection of 100 pg tent mrna leads to a reduction of vesicle mediated synaptic transmission in the spinal cord
Supplementary Information
 Nature Immunology doi:1.138/ni.2477 Supplementary Information Capillary and arteriolar pericytes attract innate leukocytes exiting through venules and instruct them with pattern recognition and motility
Tasks of Executive Control TEC. Interpretive Report. Developed by Peter K. Isquith, PhD, Robert M. Roth, PhD, Gerard A. Gioia, PhD, and PAR Staff
 Tasks of Executive Control TEC Interpretive Report Developed by Peter K. Isquith, PhD, Robert M. Roth, PhD, Gerard A. Gioia, PhD, and PAR Staff Client Information Client Name: Sample Client Client ID:
The Visual World as Seen by Neurons and Machines. Aaron Walsman, Akanksha Saran
 The Visual World as Seen by Neurons and Machines Aaron Walsman, Akanksha Saran PPA dataset What does the data encode? Clustering Exemplars clustered together Very few clusters had same category images
Broad Integration of Expression Maps and Co-Expression Networks Compassing Novel Gene Functions in the Brain
 Supplementary Information Broad Integration of Expression Maps and Co-Expression Networks Compassing Novel Gene Functions in the Brain Yuko Okamura-Oho a, b, *, Kazuro Shimokawa c, Masaomi Nishimura b,
Supplementary Materials
 1 Supplementary Materials Rotger et al. Table S1A: Demographic characteristics of study participants. VNP RP EC CP (n=6) (n=66) (n=9) (n=5) Male gender, n(%) 5 (83) 54 (82) 5 (56) 3 (60) White ethnicity,