Spatiotemporal Regime of Climate & Streamflow in the US Great Lakes Basin
|
|
|
- Lewis Freeman
- 5 years ago
- Views:
Transcription


1 Spatiotemporal Regime of Climate & Streamflow in the US Great Lakes Basin Boris Shmagin & Carol Johnston, South Dakota State University, Nir Y. Krakauer, City College of New York


2 Introduction
3 Five main regions & streamflow regimes
4 Introduction
. It is usually desired to break factors down into the smallest possible pieces so that no factor is itself factorable.")
5 Multivariate empirical data & philosophy of analysis {Q * } A factor is a portion of a quantity, usually an integer or polynomial that, when multiplied by other factors, gives the entire quantity. The determination of factors is called factorization (or sometimes "factoring"). It is usually desired to break factors down into the smallest possible pieces so that no factor is itself factorable. Factor analysis allows the determination of common axes influencing sets of independent measured sets. It is "the granddaddy of multivariate techniques (Gould 996, pp. 4-4) & was invented by Spearman. The main applications of factor analytic techniques are: () to reduce the number of variables and () to detect structure in the relationships between variables, that is to classify variables. (From: Wolfram MathWorld)
6 The explanation for regime of streamflow has to be found


7 The boundaries are administrative

8 The explanation for regime of streamflow has to be found Consideration of the Great Lakes region as uniform in joint boundaries is the common approach


9 Report from USGS
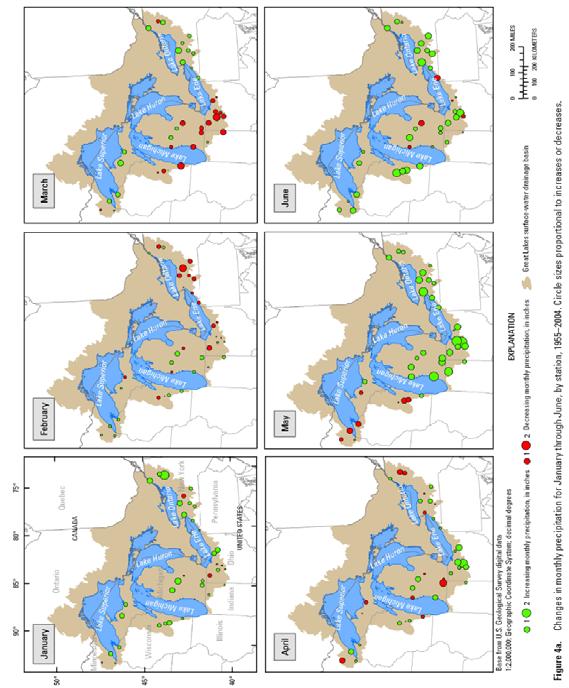


10 Historical changes were presented month by month
11 Topics Introduction: The explanation for regime of streamflow has to be found (presented earlier) Regime of climate characteristics (air temperature & precipitations) Scale in Regime what is it? The model Results for discussion


12 {P 5*65 } {T 5*98 } Data for characteristics of climate regime

13 Air temperatures '988-89' '9-' '94-5' '98-9' '9-' '96-7' '9-' '98-9' '9-' '96-7' '94-4' '944-45' '948-49' '95-5' '956-57' '964-65' '968-69' '97-7' '976-77' '98-8' '984-85' Factor Scores '99-9' '-' '4-5' Factor Linear (Factor ) Poly. (Factor ) Factor Linear (Factor ) Poly. (Factor ) Hydrological year '9-' '94-5' '98-9' '9-' '96-7' '9-' '98-9' '9-' '96-7' '94-4' '944-45' '948-49' '95-5' '956-57' '964-65' '968-69' '97-7' '976-77' '98-8' '984-85' '988-89' '99-9' '-' '4-5' Hydrological year Factor Scores '9-' '94-5' '98-9' '9-' '96-7' '9-' '98-9' '9-' '96-7' '94-4' '944-45' '948-49' '95-5' '956-57' '964-65' '968-69' '97-7' '976-77' '98-8' '984-85' '988-89' '99-9' '-' '4-5' {T 5*98 } Factor Linear (Factor ) Poly. (Factor ) Hydrological year Factor Scores
14 Precipitation, annual sum Precipitation, annual sum Factor 5 Linear (Factor 5) Poly. (Factor 5). Factor Linear (Factor ) Poly. (Factor ) '9-' '94-5' '98-9' '9-' '96-7' '9-' '98-9' '9-' '96-7' '94-4' '944-45' '948-49' '95-5' '956-57' '964-65' '968-69' '97-7' '976-77' '98-8' '984-85' '988-89' '99-9' '-' '4-5' '9-' '94-5' '98-9' '9-' '96-7' '9-' '98-9' '9-' '96-7' '94-4' '944-45' '948-49' '95-5' '956-57' '964-65' '968-69' '97-7' '976-77' '98-8' '984-85' '988-89' '99-9' '-' '4-5' {T 5*65 } Factor Linear (Factor ) Poly. (Factor ). Factor 4 Linear (Factor 4) Poly. (Factor 4) Factor Linear (Factor ) Poly. (Factor ) '9-' '94-5' '98-9' '9-' '96-7' '9-' '98-9' '9-' '96-7' '94-4' '944-45' '948-49' '95-5' '956-57' '964-65' '968-69' '97-7' '976-77' '98-8' '984-85' '988-89' '99-9' '-' '4-5' '9-' '94-5' '98-9' '9-' '96-7' '9-' '98-9' '9-' '96-7' '94-4' '944-45' '948-49' '95-5' '956-57' '964-65' '968-69' '97-7' '976-77' '98-8' '984-85' '988-89' '99-9' '-' '4-5' '9-' '94-5' '98-9' '9-' '96-7' '9-' '98-9' '9-' '96-7' '94-4' '944-45' '948-49' '95-5' '956-57' '964-65' '968-69' '97-7' '976-77' '98-8' '984-85' '988-89' '99-9' '-' '4-5'

![[%] Explained Variability by Factor in](/docs-images/88/116894954/images/15-1.jpg "Temp. [%] No of COOP station Factor")


15 The typical stations Explained Variability by Factor in Precip. [%] Explained Variability by Factor in Temp. [%] No of COOP station Factor Loading of station in Precip. Factor Loading of station Temp. I - 4 I I.86 I.89 II - II II.8 II.9 III III.8 IV - III IV.77 III -.86 V V.55
![Station, air temperatures Station, air temperatures T 4 (8*,) Factor Linear (Factor ) Poly. (Factor ).. Ann [F] Linear (Ann [F]) Poly. (Ann [F]). 5. -.](/docs-images/88/116894954/images/16-0.jpg "5. 5. -. '5-6' '888-89' '897-98' '96-7' '95-6' '9-4' '94-4' '95-5' '969-7' '978-79' '987-88' 49. -. 48. 47. Factor Linear (Factor ) Poly. (Factor ).. -. -. Factor Linear (Factor ) Poly. (Factor ) 4.")
16 Station, air temperatures Station, air temperatures T 4 (8*,) Factor Linear (Factor ) Poly. (Factor ).. Ann [F] Linear (Ann [F]) Poly. (Ann [F]) '5-6' '888-89' '897-98' '96-7' '95-6' '9-4' '94-4' '95-5' '969-7' '978-79' '987-88' Factor Linear (Factor ) Poly. (Factor ) Factor Linear (Factor ) Poly. (Factor ) '5-6' '5-6' '888-89' '897-98' '96-7' '95-6' '9-4' '94-4' '95-5' '969-7' '978-79' '987-88' '5-6' '888-89' '897-98' '96-7' '95-6' '9-4' '94-4' '95-5' '969-7' '978-79' '987-88' Jan Ann [F] Dec Nov Jun Aug Sep Mar Apr Feb Oct May Jul Expl.Var Prp.Totl Jul May Mar Apr Feb Jan Dec Nov Aug Jun Sep Oct Expl.Var Prp.Totl Factor Factor Factor Factor Factor Factor Factor Factor Factor 4 Linear (Factor 4) Poly. (Factor 4) '888-89' '897-98' '96-7' '95-6' '9-4' '94-4' '95-5' '969-7' '978-79' '987-88' '888-89' '897-98' '96-7' '95-6' '9-4' '94-4' '95-5' '969-7' '978-79' '987-88' '5-6'
![Station, precipitations Station, precipitations P 4 (8*,) 55 5 45 4 5 5 Ann sum [in] Linear (Ann sum [in]) Poly. (Ann sum [in]) Factor Factor Factor Factor 4 Factor 5 Sep.79 Oct.66 Ann [in].64.5.4. Nov.](/docs-images/88/116894954/images/17-0.jpg "68.8 Dec.6 Jun.5 -. May.7 Apr.7 Aug.8 Feb.7 Mar.7 Jul.6.7 -.6 -.6 Jan. -.5.8 -.6 Expl.Var.74.7.64.6. Prp.Totl.")
 Poly. (Factor 5) '888-89' '897-98' '96-7' '95-6' '9-4' '94-4' '95-5' '969-7' '978-79' '987-88' '5-6' Factor Linear (Factor ) Poly. (Factor ) 4.")
17 Station, precipitations Station, precipitations P 4 (8*,) Ann sum [in] Linear (Ann sum [in]) Poly. (Ann sum [in]) Factor Factor Factor Factor 4 Factor 5 Sep.79 Oct.66 Ann [in] Nov.68.8 Dec.6 Jun.5 -. May.7 Apr.7 Aug.8 Feb.7 Mar.7 Jul Jan Expl.Var Prp.Totl '888-89' '897-98' '96-7' '95-6' '9-4' '94-4' '95-5' '969-7' '978-79' '987-88' '5-6' Factor Linear (Factor ) Poly. (Factor ). Factor 4 Linear (Factor 4) Poly. (Factor 4) Factor 5 Linear (Factor 5) Poly. (Factor 5) '888-89' '897-98' '96-7' '95-6' '9-4' '94-4' '95-5' '969-7' '978-79' '987-88' '5-6' Factor Linear (Factor ) Poly. (Factor ) 4. Factor Linear (Factor ) Poly. (Factor ) '5-6' '888-89' '897-98' '96-7' '95-6' '9-4' '94-4' '95-5' '969-7' '978-79' '987-88' '5-6' '888-89' '897-98' '96-7' '95-6' '9-4' '94-4' '95-5' '969-7' '978-79' '987-88' '5-6' '888-89' '897-98' '96-7' '95-6' '9-4' '94-4' '95-5' '969-7' '978-79' '987-88' '888-89' '897-98' '96-7' '95-6' '9-4' '94-4' '95-5' '969-7' '978-79' '987-88' '5-6'
18 Station, precipitations Station, precipitations '888-89' '897-98' '96-7' '95-6' '9-4' '94-4' '95-5' '969-7' '978-79' '987-88' '5-6' Ann sum [in] Linear (Ann sum [in]) Poly. (Ann sum [in]) P 4 (8*,) P 4 (8*,) '86-7' '84-4' '858-59' '874-75' '89-9' '96-7' '9-' '98-9' '954-55' '97-7' '986-87' '-' Use of longer time series changes the trend Ann [in] Linear (Ann [in]) Poly. (Ann [in])
 - - - 95 9 95 9 95 94 945 95 955 96 965 97 975 98 985 99 995 Factor Scores - - - FACTOR Linear (FACTOR ) Poly.")
19 Analyzing precipitation from Analyzing precipitation from USGS FACTOR Linear (FACTOR ) Poly. (FACTOR ) FACTOR4 Linear (FACTOR4 ) Poly. (FACTOR4 ) FACTOR Linear (FACTOR ) Poly. (FACTOR ) Factor Scores FACTOR Linear (FACTOR ) Poly. (FACTOR ) year Factor Scores Factor Scores Factor Scores year - - Data for 95 5 were collected & passed for analysis by Glenn Hodgkins from USGS) FACTOR6 Linear (FACTOR6 ) Poly. (FACTOR6 ) {P 9*4 } FACTOR7 Linear (FACTOR7 ) Poly. (FACTOR7 ) - year FACTOR5 Linear (FACTOR5 ) Poly. (FACTOR5 ) Factor Scores Factor Scores Factor Scores year year year year
20 Scale in Regime what is this? * Streamflow * Precipitation * Upper Peninsula (UP) of Michigan
21 Regimes of annual stream runoff scale in research: GL & UP MI MN UP MI UP MI LP MI NY Regions for GL (956( ) OH


22 Annual Runoff 4 - F II Annual Runoff F I 4 7 Annual Runoff F YII cfs 8 5 cfs 4 cfs cfs F Water year F Water year (X(X (X #S $ &V xz (X (X(X &V 4 (X &V #S 6 5 (X (X(X &V 6 5 (X #S#S (X #S # $ &V&V &V &V 6 5 $ #S#S S xz 7 $ #S#S &V xz (X #S $ #S #S #S (X (X xz $ #S#S &V 78 7 &V &V &V xz #S #S $ #S (X $$ #S $ xz &V xz F 7 'W 9 'W xzxz 9 $ xz $ #S &V xz $ %U (X &V %U (X $ %U &V 'W 'W 'W'W &V 57 F 5 &V (X &V xz $ (X 49 %U %U 5 5 %U 5 %U 5 %U (X F 5 xz Annual Runoff 86 - F Y Water year cfs F Annual Runoff 85 - F IY 9 %U Water year cfs 96 'W 'W #S 987 Annual Runoff 79 - F III 9 (X 87 xz 4 $ 'W %U 'W xz $ 'W'W 98 #S 'W F Water year 99 #S 'W cfs Annual Runoff F YI Water year Water year Factor Loadings for US territory & annual discharge for typical watersheds
.75.")
23 Precipitation from Global grid Time series gathered in initial matrix: {P 8*9 } P 8,i Lat ( o N) \ Lon ( o W)
 - - - 979 98 98 985 987 989 99 99 995 997 999 5 7 Factor Scores - - - FACTOR Linear (FACTOR ) Poly. (FACTOR ).5.5.5 -.5 - -.5 - FACTOR Linear (FACTOR ) Poly.")
24 , , FACTOR Linear (FACTOR ) Poly. (FACTOR ) Factor Scores FACTOR Linear (FACTOR ) Poly. (FACTOR ) FACTOR Linear (FACTOR ) Poly. (FACTOR ) year year Factor Scores year Factor Scores FACTOR4 Linear (FACTOR4 ) Poly. (FACTOR4 ) year FACTOR5 Linear (FACTOR5 ) Poly. (FACTOR5 ) Factor Scores Factor Scores year FACTOR7 Linear (FACTOR7 ) Poly. (FACTOR7 ) FACTOR6 Linear (FACTOR6 ) Poly. (FACTOR6 ) Factor Scores year Factor Scores year Precipitation


25 Data from cooperative stations for UP MI Picture: Location & elevation of 44 meteorological cooperative stations with annual sum of total monthly snowfall & monthly air temperature On April 8, (
26 Annual snowfall as traditional map & as structure from initial matrix: T (95 TS98.88 TS9.8 TS Fact Fact Fact TS TS (95-4*8) 4*8) FACTOR Year TS TS TS47.8 TS TS TS TS TS TS TS TS Expl.Var Prp.Totl Picture: FACTOR FACTOR Year Year
27 Annual & seasonal regime as a structure for monthly Scatterplot (Spreadsheet7 v*5c) FACTOR = *x FACTOR = *x+.6*x^ FACTOR = Spline air temperature (UP MI) FACTOR MT 78 FACTOR = *x FA CTOR = *x +.*x^ FACTOR = Spline Year MT 78 FACTOR4 = *x FACTOR4 = *x+.4*x^ FACTOR4 = Spline MT 98 FACTOR = *x FACTOR = *x-. *x^ FACTOR = Spline 4 Scatterplot (Spreadsheet7 v*5c) FACTOR = *x FACTOR = *x+.*x^ FACTOR = Spline FACTOR FACTOR4 FACTOR FACTOR YEAR MT 78 FACTOR = *x FACTOR = *x+.4*x^ FACTOR = Spline MT FACTOR YEAR = *x FACTOR = *x-.7*x^ FACTOR = Spline FACTOR YEAR YEAR MT 78 FACTOR5 = *x FACTOR5 = *x+.*x^ FACTOR5 = Spline FACTOR5 - - Fact Fact Fact Fact 4 Fact 5 - JAN YEAR FEB.75 MAR.4.57 APR.9.64 MAY.8 JUN.8.66 JUL.5.5 AUG.8 SEP.55 OCT.75 NOV.5.54 DEC.87 Expl.Var Prp.Totl FACTOR YEAR MT 98 FACTOR = *x FACTOR = *x+.*x^ FACTOR = Spline MT MT 98 FACTOR4 = *x FACTOR = *x FACTOR4 = *x-.9*x^ FACTOR = *x+.*x^ YEAR FACTOR = Spline FACTOR4 = Spline MT 98 FACTOR5 YEAR = *x FACTOR5 = *x+.7*x^ -. FACTOR5 = Spline YEAR.5 FACTOR FACTOR YEAR FACTOR4 FACTOR Year Fac Fac Fac Fac 4 Fac 5 JAN.86 FEB.75.8 MAR.6.7 APR.78 MAY.69 JUN.57.5 JUL.6.4 AUG SEP.7 OCT NOV DEC.9.8 Expl.Var Prp.Totl
28 Air temperature - observed Model for simplified Fourier analysis: Where are: values & model K π X t = X + Ai cos ( t ϕi ) + Z i= T i t X t observation, X mean for the interval of observations, A i amplitude, Ti period, ϕ i phase of i-cosinusoid, Z t difference between observation & model. The equation quotients are calculated separately for each selected period & for all periods together under the condition of minimization of the random part, No T- period [year] A-amplitude [F] ϕ -phase F '888-89' '898-99' '98-9' '98-9' '98-9' '98-9' Model '948-49' '958-59' '968-69' '978-79' Hydr. year 4 T ann '988-89' '998-99' 8-9' '8-9' '8-9'
29 Scale for time series Scale for time series '86-7' '88-9' '85-5' '86-6' '874-75' '886-87' '898-99' '9-' '9-' '94-5' '946-47' '958-59' '97-7' '98-8' '994-95' in '6-7' '8-9' '-' '998-99' '888-89' '898-99' '98-9' '98-9' '98-9' '98-9' '948-49' '958-59' '968-69' '978-79' '988-89' F 8-9' '8-9' '8-9' No T- period [year] A-amplitude [F] ϕ -phase Model 4 T ann Hydr. year Model 4 prec ann sum Hydr. year

30 The Model
")

31 The System Model of Geosphere Vertical slice of the Geographical Sphere with two independent elements: System of Anthropological Geography (S AG ) & System of Physical Geography (S FG ). Arrows indicate vertical and horizontal components of matter, energy and information circulating (after Krcho, 978)


 with five independent elements: a")

32 System Model for Landscape Each of these components may be characterized by matrix of input {Wi}, matrix of output {Qi}, & matrix of states {Hi}. System of Physical Geography Sphere (S FG ) with five independent elements: a - atmosphere, a - hydrosphere, a - lithosphere, a 4 - pedosphere, a 5 -biosphere.

33 Multidimensional structure of relations R ij The number of characteristics for elements of landscape and watershed is unlimited but for stable landscape the set of watersheds or stations with data allows to obtain statistical description of connections. {Ri} is a matrix of relations between parts of landscape. Entering the codes and numbers for initial matrix {X n*p } we open the way to recovery connections those exist in landscape Axis for hydrological space factors (principal components) of initial data matrixes {X n*p }, allow consider {Ri} as a time spatial structure.
34 Discover of invisible structure by system analysis
35 Results for discussion System model applied to landscape allows to formulate research tasks, develop methods of analysis, & present results as a map Hydrological object has a scaled time-spatial structure of interaction (straight & feedback connections) with other components of landscape (air, rocks & sediments, soil, plants & animals) The complex multidimensional structure of time spatial regime for regional hydrosphere was described for U. S. part of Great Lake watershed The entire set of empirical data was used Results may be used for improvement of observational net & in applications


36 Questions? Lake Superior, /8/9 : pm Scientific research completed on a base of authors donated time
NILE RIVER WATER RESOURCES ANALYSIS
 Tenth International Water Technology Conference, IWTC1 26, Alexandria, Egypt 39 NILE RIVER WATER RESOURCES ANALYSIS Medhat Aziz 1 and Sherine Ismail 2 1 Deputy Director, Nile Research Institute (NRI),
Going with the Flow Update. An update and comparative analysis of five years of Water Sentinels flow data collection of the Upper Verde River
 Going with the Flow Update An update and comparative analysis of five years of Water Sentinels flow data collection of the Upper Verde River Rachel Shultis Intern for Science-Practice Integration Grand
FAQs about Provider Profiles on Breast Cancer Screenings (Mammography) Q: Who receives a profile on breast cancer screenings (mammograms)?
 Q: Who receives a profile on breast cancer screenings (mammograms)?") FAQs about Provider Profiles on Breast Cancer Screenings (Mammography) Q: Who receives a profile on breast cancer screenings (mammograms)? A: We send letters and/or profiles to PCPs with female members
FAQs about Provider Profiles on Breast Cancer Screenings (Mammography) Q: Who receives a profile on breast cancer screenings (mammograms)? A: We send letters and/or profiles to PCPs with female members
Overview of the Radiation Exposure Doses of the Workers at Fukushima Daiichi Nuclear Power Station
 Click here for the corrections made < Reference > December 3, 212 Tokyo Electric Power Company Overview of the Radiation Exposure Doses of the Workers at Fukushima Daiichi Nuclear Power Station * As of
Don Pedro Project Project Operations/Water Balance Model Attachment B Model Description and User s Guide, Addendum 1 Base Case Description
 Don Pedro Project Project Operations/Water Balance Model Attachment B Model Description and User s Guide, Addendum 1 Base Case Description 5-2-213 1. INTRODUCTION The Turlock Irrigation District ( TID
Hydrologic Modeling Workshop. HEC-5 Modeling of ACF Interim Operation by Mobile District
 Hydrologic Modeling Workshop HEC-5 Modeling of ACF Interim Operation by Mobile District May 24, 2006 Model Settings Demands Hydropower Water Supply 2001 actual Required Flow Atlanta Columbus Jim Woodruff
NORTH DAKOTA 2011 FLOOD EVENT
 NORTH DAKOTA 2011 FLOOD EVENT OUTLINE Missouri River Basin Geography Generic Reservoir Operations Weather and Climate 2011 Basin-wide Hydrology Missouri River Timeline Missouri River Damages Mouse River
If you have questions or need additional information, please contact us. Attachment: Prior Lake Outlet Annual Operations Report, Year 2008
 January 16, 2009 Ms. Janell Miersch, Area Hydrologist Metro Region of Waters Department of Natural Resources 1200 Warner Road St. Paul, Minnesota 55106 Prior Lake Outlet Annual Operations Report, Year
18 Week 92% Open Pathway Recovery Plan and Backlog Clearance
 18 Week 92% Open Pathway Recovery Plan and Backlog Clearance Page 1 of 6 17.05.2012 1.0 Background 18-Week 92% Open Pathway RECOVERY PLAN The Trust has achieved compliance against the admitted and non-admitted
McLean ebasis plus TM
 McLean ebasis plus TM Sample Hospital (0000) Report For Qtr HBIPS Core Measures McLean Hospital 115 Mill Street Belmont, MA 02478 1 2012 Department of Mental Health Services Evaluation Tel: 617-855-3797
Flu Watch. MMWR Week 3: January 14 to January 20, and Deaths. Virologic Surveillance. Influenza-Like Illness Surveillance
 Flu Watch MMWR Week 3: January 14 to January 2, 218 All data are provisional and subject to change as more reports are received. Geographic Spread South Carolina reported widespread activity this week.
Avian influenza in poultry, wild and captive birds (AI)
") Avian influenza in poultry, wild and captive birds (AI) Analysis of ADNS data since 01/2018 Reporting period: 2018-01-01 2018-10-28 Data query: 2018-10-30 AGES DSR Austrian Agency for Health and Food Safety
Avian influenza in poultry, wild and captive birds (AI) Analysis of ADNS data since 01/2018 Reporting period: 2018-01-01 2018-10-28 Data query: 2018-10-30 AGES DSR Austrian Agency for Health and Food Safety
Seasonality of influenza activity in Hong Kong and its association with meteorological variations
 Seasonality of influenza activity in Hong Kong and its association with meteorological variations Prof. Paul Chan Department of Microbiology The Chinese University of Hong Kong Mr. HY Mok Senior Scientific
Phase 6 Watershed Model: Prototype-I
 07/09/2015 Phase 6 Watershed Model: Prototype-I Modeling Workgroup Conference Call Gopal Bhatt (gopal.bhatt@psu.edu) Research Associate, Penn State University 1 Evolution of Phase 6 Watershed Model Phase
Flu Watch. MMWR Week 4: January 21 to January 27, and Deaths. Virologic Surveillance. Influenza-Like Illness Surveillance
 Flu Watch MMWR Week 4: January 21 to January 27, 218 All data are provisional and subject to change as more reports are received. Geographic Spread South Carolina reported widespread activity this week.
From Analytics to Action
 From Analytics to Action Overview So, what are we talking about here? How to make incremental changes to your digital content that will result in positive user actions Overview Rooted in the hard sciences
A Simple Regression Model for Estimating Actual Evapotranspiration in Various Types of Land Use, THAILAND
 Journal of Agriculture and Life Sciences ISSN 2375-4214 (Print), 2375-4222 (Online) Vol. 3, No. 1; June 2016 A Simple Regression Model for Estimating Actual Evapotranspiration in Various Types of Land
Telehealth Data for Syndromic Surveillance
 Telehealth Data for Syndromic Surveillance Karen Hay March 30, 2009 Ontario Ministry of Health and Long-Term Care Public Health Division, Infectious Diseases Branch Syndromic Surveillance Ontario (SSO)
HIV POSITIVE YOUTH: LINKAGE & RETENTION IN CARE
 HIV POSITIVE YOUTH: LINKAGE & RETENTION IN CARE Site C Youth clinic HIV care pathway DAY 1 Test HIV + PIMA point of care CD4 count in in 3-5 days initiation + in session 3 session 4 1 month Youth Club
U.S. Flock Trends and Projections
 U.S. Flock Trends and Projections JULY 15, 2015 Compiled by Maro Ibarburu Sponsored in part by:!!! The Egg Industry Center Market Reports & Industry Analysis are compiled in the memory of their creator,
Date : September Permit/License or Registration Application. Permit/License/ Notification/ Registration Description. Remark
 Number 1. s 29 Jul 13 N/A Environmental Permit to construct the Passenger Clearance and associated works of the Hong Kong Zhuhai and Macao Bridge Boundary Crossing Facilities EP-353/2009/G 06 Aug 13 N/A
PERFORMANCE OF THOMAS FIERING MODEL FOR GENERATING SYNTHETIC STREAMFLOW OF JAKHAM RIVER
 Plant Archives Vol. 18 No. 1, 2018 pp. 325-330 ISSN 0972-5210 PERFORMANCE OF THOMAS FIERING MODEL FOR GENERATING SYNTHETIC STREAMFLOW OF JAKHAM RIVER Priyanka Sharma 1, S. R. Bhakar 2 and P. K. Singh 2
FGSZ Zrt. from 28 February 2019 till 29 February 2020 AUCTION CALENDAR: YEARLY YEARLY BUNDLED AT CROSS BORDER POINTS
 AUCTION CALENDAR: YEARLY YEARLY BUNDLED AT CROSS BORDER POINTS FIRM CAPACITY - First Monday of July 01.06.2019* 01.07.2019 07:00 01.10.2019 04:00 01.10.2020 04:00 2019/2020 01.10.2020 04:00 01.10.2021
FIDS Symposium The River Bender
 FIDS Symposium 2014 The River Bender TransAlta Bow River Simulation Model Location 3 Cumulative Annual Volume - Bow River at Calgary Dry year = 1.5 M ac-ft Average = 2.34 M ac-ft 1941 2001 Horseshoe /
Table.'Outbreaks'from'Unpasteurized'(Raw)'Milk'and'non<Mexican'Style'Raw'Milk'Cheeses,'United'States,' 1998<2011.*'
'Milk'and'non<Mexican'Style'Raw'Milk'Cheeses,'United'States,' 1998<2011.*'") Table.'Outbreaks'from'Unpasteurized'(Raw)'Milk'and'non
Table.'Outbreaks'from'Unpasteurized'(Raw)'Milk'and'non
MB Drought Plan and Strategies Data, Information and Assessment Needed
 MB Drought Plan and Strategies Data, Information and Assessment Needed Abul Kashem P.Eng. Surface Water Management Section Manitoba Water Stewardship EGO- DRI Workshop May 10 to 11, 2010 Outline Drought
CURRICULUM PACING CHART ACES Subject: Science-Second Grade
 SCIENCE EXPERIMENTS DONE DURING EACH UNIT COVER THE FOLLOWING SOL DURING EACH NINE WEEKS: SOL # Unit Bloom s Objective 2.1 Scientific Investigation, Reasoning, and Logic Synthesis The student will demonstrate
Data Visualization - Basics
 Data Visualization - Basics The Visualization Process ACQUIRE PARSE FILTER MINE REPRESENT REFINE INTERACT Sales Data (US $ in thousands) Region Jan Feb Mar Apr May Jun Jul Aug Sep Oct Nov Dec Domestic
Measure Up/Pressure Down Medical Group Success
 Measure Up/Pressure Down Medical Group Success Deborah A. Molina, MPA, MBA Manager, Quality Jamie L. Reedy, MD, MPH Medical Director, Population Health Laura Balsamini, Pharm D, BCPS Director, Pharmacy
CryoSat-2 SARin mode over great rivers
 CryoSat-2 SARin mode over great rivers CryoSat Third Users Workshop, 12-14 March 2013, Dresden, Germany S. Calmant (1), N. Bercher (1), S. Fleury (1), S. Dinardo (2), B. Lucas (2), P. Femenias (2), F.
SUPPLIER/MANUFACTURER PERFORMANCE REPORT
 80/30 MOO 8 PHAHOLYOTHIN RD., T.KUKHOT, A.LUMLOOKKAR, PATHUMTHANI 30, THAILAND TEL : (66-) 9958 9, 995330 FAX : (66-) SUPPLIER/MANUFACTURER PERFORMANCE REPORT 80/30 MOO 8 PHAHOLYOTHIN RD., T.KUKHOT, A.LUMLOOKKAR,
FORECASTING DEMAND OF INFLUENZA VACCINES AND TRANSPORTATION ANALYSIS.
 FORECASTING DEMAND OF INFLUENZA VACCINES AND TRANSPORTATION ANALYSIS. GROUP MEMBER 1. HOLLY / NGHIEM NGUYET HUU RA6057117 2. YOSUA TJOKRO HINDRO / RA6057060 3. ADAM HUNG 洪一智 4. STAN LU 陸潤龍 RA7041193 CONTENTS
Interpretability of Sudden Concept Drift in Medical Informatics Domain
 Interpretability of Sudden Concept Drift in Medical Informatics Domain Gregor Stiglic, Peter Kokol Faculty of Health Sciences University of Maribor Slovenia Presentation Outline Visualization of Concept
Understanding Phosphorus Dynamics and Controls to Better Manage the Turbid Minnesota River System
 Understanding Phosphorus Dynamics and Controls to Better Manage the Turbid Minnesota River System William F. James US Army Corps of Engineers Engineer Research and Development Center Eau Galle Aquatic
Global Fund Approach to Health System Strengthening
 Global Fund Approach to Health System Strengthening WHO Expert consultation on positive synergies between health systems and Global Health Initiatives Geneva, 29-30 May 2008 Dr Stefano Lazzari, Director
EFFECT OF METEOROLOGICAL PARAMETERS ON POLLEN CONCENTRATION IN THE ATMOSPHERE OF ISLAMABAD
 EFFECT OF METEOROLOGICAL PARAMETERS ON POLLEN CONCENTRATION IN THE ATMOSPHERE OF ISLAMABAD Muhammad Athar Haroon 1, Ghulam Rasul * Abstract: This study is aimed to find meteorological factors affecting
Real World Variables University Wind Studies Part 1. Randy Montgomery
 Real World Variables University Wind Studies Part 1 Randy Montgomery Research Purpose Current and proposed legislation is looking at all kinds of irrigation efficiency numbers EPA WaterSense Single Family
Pollen Seasonality - A Methodology to Assess the Timing of Pollen Seasons Throughout the US
 Pollen Seasonality - A Methodology to Assess the Timing of Pollen Seasons Throughout the US Arie Manangan, MA Health Scientist (CDC Climate and Health Program) Coauthors/Contributors: Claudia Brown (CDC)
Has the UK had a double epidemic?
 Has the UK had a double epidemic? Dr Rodney P Jones Healthcare Analysis & Forecasting www.hcaf.biz hcaf_rod@yahoo.co.uk Introduction Outbreaks of a new type of epidemic, possibly due to immune manipulation,
Dementia Content Report January Produced By The NHS Choices Reporting Team
 Dementia Content Report January 2014 Produced By The NHS Choices Reporting Team CH.NHSChoices-Reporting@nhs.net Dementia Dashboard Page 1 Overall Choices Site Visits Tag cloud showing top dental related
PROVINCIAL RISK MAPS FOR HIGHEST TENDENCY RANKING EPIDEMIOLOGICAL SURVEILLANCE DISEASES IN AYUTTHAYA PROVINCE, THAILAND
 PROVINCIAL RISK MAPS FOR HIGHEST TENDENCY RANKING EPIDEMIOLOGICAL SURVEILLANCE DISEASES IN AYUTTHAYA PROVINCE, THAILAND Soutthanome KEOLA, Mitsuharu TOKUNAGA Space Technology Applications and Research
FORECASTING THE DEMAND OF INFLUENZA VACCINES AND SOLVING TRANSPORTATION PROBLEM USING LINEAR PROGRAMMING
 National Cheng Kung University Institute of International Management Business Decision Methods FORECASTING THE DEMAND OF INFLUENZA VACCINES AND SOLVING TRANSPORTATION PROBLEM USING LINEAR PROGRAMMING HOLLY
Dust Storms Impact on Air pollution and public Health: A Case Study in Iran
 Dust Storms Impact on Air pollution and public Health: A Case Study in Iran Abbas Miri 1, Hassan Ahmadi 2, Naser Panjehkeh 3, Ahmad Ghanbari 3, Alireza Moghaddamnia 1 and Mohammad Galavi 3 1 University
Analysis of Meter Reading Validation Tolerances proposed by Project Nexus
 Analysis of Meter Reading Validation Tolerances proposed by Project Nexus January 2014 Description of analysis Aim of analysis: To assess the impact of the meter read validation tolerances that have been
Quit Rates of New York State Smokers
 Quit Rates of New York State Smokers Sara M. Abrams, MPH Data Manager NYS Smokers Quitline Sara.Abrams@roswellpark.org September 6, 20 Presentation Outline Basic Quitline Service How Quit Rates are defined
THE CITY OF BRYANT, ARKANSAS SAMPLING AND TESTING PLAN FOR SITE SPECIFIC TESTING FOR COPPER AND ZINC BRYANT WASTEWATER TREATMENT FACILITY
 THE CITY OF BRYANT, ARKANSAS SAMPLING AND TESTING PLAN FOR SITE SPECIFIC TESTING FOR COPPER AND ZINC BRYANT WASTEWATER TREATMENT FACILITY NPDES PERMIT NO. AR342 ORIGINAL SUBMISSION DATE: NOVEMBER 16, 215
Sleep Market Panel. Results for June 2015
 Sleep Market Panel Results for June 2015 Notes: o This is a monthly trending report of panel member data along with additional analysis by: Sleep labs affiliated with Hospitals vs. Independent Labs o Hospital
Trends in Feed and Manure Phosphorus. John Peters Soil Science Department UW-Madison
 Trends in Feed and Manure Phosphorus John Peters Soil Science Department UW-Madison Acknowledgments Laboratory manure and TMR data provided by: Dairyland Laboratories, Inc. Rock River Laboratory, Inc.
Magellan s Transport Route Lead Monitoring Program
 Magellan s Transport Route Lead Monitoring Program Magellan s lead monitoring requirements Magellan s approval to export sealed shipments of lead carbonate through Fremantle is subject to the Interim Implementation
Curators of the University of Missouri - Combined January 01, 2013 through December 31, 2013 Cost Management Report
 Cost Management Report Program Design Specifics Standard Claims Management SAVINGS CATEGORIES SAVINGS RESULTS % OF NET SUBMITTED DOLLARS % OF PAID DOLLARS Deductible Applied $1,296,627 5.68% 9.78% Patient
Lauren DiBiase, MS, CIC Associate Director Public Health Epidemiologist Hospital Epidemiology UNC Hospitals
 Lauren DiBiase, MS, CIC Associate Director Public Health Epidemiologist Hospital Epidemiology UNC Hospitals Statistics Numbers that describe the health of the population The science used to interpret these
Durham Region Influenza Bulletin: 2017/18 Influenza Season
 Durham Region Influenza Bulletin: 2017/18 Influenza Season Surveillance Week 21 (May 20, 2018 to May 26, 2018) Table 1: Assessment of influenza activity in Durham Region Measure Laboratory confirmed cases
Effects of a Televised Two-City Safer Sex Mass Media Campaign Targeting High Sensation-Seeking and Impulsive Decision- Making Young Adults
 Effects of a Televised Two-City Safer Sex Mass Media Campaign Targeting High Sensation-Seeking and Impulsive Decision- Making Young Adults Seth M. Noar, Ph.D. Assistant Professor Department of Communication
Ed Minter Mary Michaud
 G3658-13 Ed Minter Mary Michaud 2003 PD &E Program Development & Evaluation University of Wisconsin-Extension Why use graphics to present evaluation results? People consume information in different ways
Figure 1: Quantity Dispensed/100 Members (Ambien and Sonata on left axis)
") Sedative Hypnotic Quantity Limit Policy Impact Analysis Effective 12/6/2 OMAP implemented a 15 tablet per 3 day quantity limit on non-barbiturate sedative hypnotics for FFS patients. This policy was made
Sedative Hypnotic Quantity Limit Policy Impact Analysis Effective 12/6/2 OMAP implemented a 15 tablet per 3 day quantity limit on non-barbiturate sedative hypnotics for FFS patients. This policy was made
STRENGTHENING THE COORDINATION, DELIVERY AND MONITORING OF HIV AND AIDS SERVICES IN MALAWI THROUGH FAITH-BASED INSTITUTIONS.
 STRENGTHENING THE COORDINATION, DELIVERY AND MONITORING OF HIV AND AIDS SERVICES IN MALAWI THROUGH FAITH-BASED INSTITUTIONS. Acknowledgements This project was fully funded by Center For Disease Control
North Dakota Board of Pharmacy
 North Dakota Board of Pharmacy Updates on Drug Abuse Trends, the PDMP and Medical Marijuana Mark J. Hardy, Pharm D Executive Director Disclosure Statement I have no conflict of interests to report Objectives
Cork Integrated Falls Service: New ways of working in specialist, community and continuing care
 Cork Integrated Falls Service: New ways of working in specialist, community and continuing care Dr Kieran O Connor & Dr Sheena McHugh, O n b e h a l f o f t h e C o r k I n tegrate d Fa l l s S e r v i
Welcome. Recreational Enhancements on the Lehigh River Public Information Workshop 31 January 2008
 Welcome Recreational Enhancements on the Lehigh River Public Information Workshop 31 January 2008 Cooperating Agencies US Army Corps of Engineers Philadelphia District Delaware River Basin Commission Pennsylvania
Hand, Foot, and Mouth Disease Situation Update. Hand, Foot, and Mouth Disease surveillance summary
 Hand, Foot, and Mouth Disease Situation Update 24 February 215 Hand, Foot, and Mouth Disease surveillance summary This surveillance summary includes information from countries where transmission of Hand,
Successful Falls Prevention in Aged Persons Mental Health. Reducing the risk and decreasing severity of outcome
 Successful Falls Prevention in Aged Persons Mental Health Reducing the risk and decreasing severity of outcome Vahitha Koshy Seema Dua Elda Kimberlee Introduction Unit 3- Acute Aged Mental Health inpatient
Cincinnati Children s Hospital Medical Center PHO/OVPCA Constipation Initiative Monthly Report February 2018
 Cincinnati Children s Hospital Medical Center PHO/OVPCA Constipation Initiative Monthly Report February 2018 Aim: Project focus to embed evidence based protocol for the treatment of Constipation in the
Curators of the University of Missouri - Combined January 1, 2016 through December 31, 2016
 Cost Management Report Delta Dental Network Coverage Network Utilization Discount Delta Dental PPO Network 28.3% 29.4% Delta Dental Premier Network 67.0% 12.0% Total 95.3% Savings Categories $ % of Net
CASE STUDY Improving the quality of VMMC services at Mangochi, Mzimba North, and Nkhotakota District Hospitals in Malawi
 CASE STUDY Improving the quality of VMMC services at Mangochi, Mzimba North, and Nkhotakota District Hospitals in Malawi With support from United States Agency for International Development (USAID), multi-sectoral
LAB 1 The Scientific Method
 From the LAMC Bio 3 Lab Manual 6 th edition, by Mike Reynolds & Stephen Brown Modified by Diane Livio LAB 1 The Scientific Method Objectives 1. Apply the basic principles of the scientific method. 2. Generate
SNOW/ICE ON GND(IN) WATER- EQUIV DEPTH
 WATER- EQUIV DEPTH") SEPTEMBER 2015 LOCAL CLIMATOLOGICAL DATA NOAA, National Centers for Environmental Information RICHMOND INTERNATIONAL AIRPORT (KRIC) Lat:37 30'N Long: 77 19'W Elev (Ground) 164 Feet Time Zone : EASTERN
SEPTEMBER 2015 LOCAL CLIMATOLOGICAL DATA NOAA, National Centers for Environmental Information RICHMOND INTERNATIONAL AIRPORT (KRIC) Lat:37 30'N Long: 77 19'W Elev (Ground) 164 Feet Time Zone : EASTERN
CHILDHOOD ALLERGIES IN AMERICA
 CHILDHOOD ALLERGIES IN AMERICA Severe Allergic Reactions Causing More Emergency Room Visits for U.S. Children PUBLISHED MARCH 13, 2018 ( 2 ) EXECUTIVE SUMMARY In this report, the Blue Cross Blue Shield
Travel Time Reliability Summary
 7 Travel Time Reliability Summary RETHINKING I-94 APPENDIX T7 TRAVEL TIME RELIABILITY SUMMARY Background Since 2016, MnDOT has been working with neighborhoods, community groups, district councils, local
TB Outbreak in a Homeless Shelter
 TB Outbreak in a Homeless Shelter Objectives Epidemiology of Outbreak Population Health Interventions Population Health Goals 2007 One active case identified Less than compliant Prolonged recovery Contact
Essentials of Aggregate System Dynamics Infectious Disease Models
 Essentials of Aggregate System Dynamics Infectious Disease Models Nathaniel Osgood CMPT 394 February 5, 2013 Comments on Mathematics & Dynamic Modeling Many accomplished & well-published dynamic modelers
Avg PM10. Avg Low Temp
 Geography 532 Geography of Environmental Health Dr. Paul Marr Name: Ex 16- Seasonality, Time Delay, and Disease (10 pts) Below are asthma cases per month for the years 1992-1994. The table also includes
Sexual Health Content Report June Produced By The NHS Choices Reporting Team
 Sexual Health Content Report June 2013 Produced By The NHS Choices Reporting Team CH.NHSChoices-Reporting@nhs.net Sexual health Dashboard Page 1 35.0M 30.0M 25.0M 20.0M 15.0M 10.0M 5.0M 0.0 15.6M Overall
Dementia Content Report May Produced By The NHS Choices Reporting Team
 Dementia Content Report May 2013 Produced By The NHS Choices Reporting Team CH.NHSChoices-Reporting@nhs.net 35.0M 30.0M 25.0M 20.0M 15.0M 10.0M 5.0M 0.0 15.9M Overall Choices Site Visits NHS Choices Policy
Flood Hydrology. for. Michigan Watercourses
 Flood Hydrology for Michigan Watercourses Michigan Hydrologic Methodologies FEMA Flood Insurance Study (FIS) Statistical Analysis of USGS Gage Data (Gage) Statistical Models for Estimating Flow Characteristics
Poster Session HRT1317 Innovation Awards November 2013 Brisbane
 Poster Session HRT17 Innovation Awards November 20 Brisbane Presenter: Keren Harvey, Clinical Director Rehabilitation and Geriatric Medicine, TPCH Visibility enhancing the Geriatric & Rehabilitation Liaison
Improving care of HIV-infected breastfeeding
 Improving care of HIV-infected breastfeeding and their : Early results from the Partnership for HIV-free Survival Initiative in Uganda Tamara Nsubuga-Nyombi, URC IAS- Melbourne, Australia July 22nd, 2014
Tri-County Opioid Safety Coalition Data Brief December 2017 Clackamas, Multnomah, and Washington Counties
 Medicaid-Funded Alternative Treatment for Back Pain in the Tri-County Region Key Findings The percentage of members with a back pain diagnosis who received an alternative treatment increased from 29% in
Salinas Valley Water Project Annual Flow Monitoring Report
 Salinas Valley Water Project Annual Flow Monitoring Report Operational Season 2013 Monterey County Water Resources Agency 893 Blanco Circle Salinas, CA 93901 April 2014 Revised July 2014 TABLE OF CONTENTS
National Data Analysis
 National Data Analysis Dr Maeve Skelly QI Programme Working Group Member 30 th November 2017 National Data Reporting 2 nd National Data Report released today Data set covers the full training year from
Implementation of an Interprofessional Team to Prevent Inpatient Hypoglycemic Events. September 13, 2016
 Implementation of an Interprofessional Team to Prevent Inpatient Hypoglycemic Events September 13, 2016 St Joseph s Health Fast Facts Founded 1869 by Sisters of St. Francis Patient Volumes (2014) Inpatient
CONTROL CHART METHODOLOGY
 Center for Performance Sciences, 2001 CONTROL CHART METHODOLOGY Statistical Process Control (SPC) Analysis Statistical process control is a tool (e.g., control chart) used to help understand any process
BLOOD ALCOHOL LEVELS FOR FATALLY INJURED DRIVERS
 BLOOD ALCOHOL LEVELS FOR FATALLY INJURED DRIVERS 128 MOTOR VEHICLE CRASHES IN NEW ZEALAND 213 BLOOD ALCOHOL LEVELS FOR FATALLY INJURED DRIVERS 129 CONTENTS TABLES Table 1 Blood alcohol levels of fatally
Weekly Influenza News 2016/17 Season. Communicable Disease Surveillance Unit. Summary of Influenza Activity in Toronto for Week 43
 + Weekly / Influenza News Week 43 (October 23 to October 29, 2016) Summary of Influenza Activity in Toronto for Week 43 Indicator (Click on the indicator Activity Level * Description name for more details)
GREENWOOD PUBLIC SCHOOL DISTRICT PHYSICAL EDUCATION
 Week 1 2 3 Days Comp/Obj. Aug. 07 11 Introduction Aug. 14 18 Aug. 21 2 C4a. 4 Aug. 29-Sept.1 Sept. -8 (Labor Day Sept.4) 4 6 Sept. 11-1 7 Sept. 18 22 8 Sept. 2 29 9 Oct. 2-6 with Hands FIRST NINE WEEKS
BIOST/STAT 578 A Statistical Methods in Infectious Diseases Lecture 16 February 26, Cholera: ecological determinants and vaccination
 BIOST/STAT 578 A Statistical Methods in Infectious Diseases Lecture 16 February 26, 2009 Cholera: ecological determinants and vaccination Latest big epidemic in Zimbabwe Support International Vaccine
SPECIAL ASPECTS OF ASSESSING THE ELEMENTAL COMPOSITION OF PHYTOPLANKTON AND SESTON USING NEUTRON ACTIVATION ANALYSIS
 SPECIAL ASPECTS OF ASSESSING THE ELEMENTAL COMPOSITION OF PHYTOPLANKTON AND SESTON USING NEUTRON ACTIVATION ANALYSIS Nekhoroshkov P. S., Frontasyeva M. V. Joint Institute for Nuclear Research, FLNP, SNAAAR
EQAS. Hemoglobin Program (BC80) Cycle 12: December 2014 December 2015 Sample No: 1 Sample Date: 17 Dec 14. Exceptions. Customer Information
 Cycle 12: December 2014 December 2015 Sample No: 1 Sample Date: 17 Dec 14. Exceptions. Customer Information") (BC80) : December 2014 December 20 Exceptions None at this time. Legend: No Warnings Missing Result Late Results < < > * Amended Result (per participant s request) News Customer Information Please refer
(BC80) : December 2014 December 20 Exceptions None at this time. Legend: No Warnings Missing Result Late Results < < > * Amended Result (per participant s request) News Customer Information Please refer
End Stage Renal Disease (ESRD) Network Learning and Action Network (LAN) Series: Bloodstream Infection (BSI) Quality Improvement Activity
 Network Learning and Action Network (LAN) Series: Bloodstream Infection (BSI) Quality Improvement Activity") End Stage Renal Disease (ESRD) Network Learning and Action Network (LAN) Series: Bloodstream Infection (BSI) Quality Improvement Activity October 2, 2018 Note: Computer speakers or headphones are necessary
End Stage Renal Disease (ESRD) Network Learning and Action Network (LAN) Series: Bloodstream Infection (BSI) Quality Improvement Activity October 2, 2018 Note: Computer speakers or headphones are necessary
The Impact of Clinical Decision Support (CDS) Tools on Catheter Associated Urinary Tract Infections (CAUTI) January 22, 2010.
 Tools on Catheter Associated Urinary Tract Infections (CAUTI) January 22, 2010.") 4 th Annual NDNQI Conference The Impact of Clinical Decision Support (CDS) Tools on Catheter Associated Urinary Tract Infections (CAUTI) January 22, 2010 UPMC St Margaret Bonnie B. Anton, MN RN antonbb@upmc.edu
4 th Annual NDNQI Conference The Impact of Clinical Decision Support (CDS) Tools on Catheter Associated Urinary Tract Infections (CAUTI) January 22, 2010 UPMC St Margaret Bonnie B. Anton, MN RN antonbb@upmc.edu
Outbreak of Salmonella Newport Infections Linked to Cucumbers United States, 2014
 Outbreak of Salmonella Newport Infections Linked to Cucumbers United States, 2014 Laura Gieraltowski, PhD, MPH Outbreak Response and Prevention Branch Division of Foodborne, Waterborne, and Environmental
Cycle Elements Amended Goals, Objectives, and Policies ESR (Effective August 13, 2018) County Ordinance No City Ordinance No.
 County Ordinance No City Ordinance No.") Tallahassee-Leon County Comprehensive Plan: Table of Amended Policies, 1991-2018 (in reverse order) Cycle Elements Amended Goals, Objectives, and Policies 2018-2 ESR (Effective August 13, 2018) County
Tallahassee-Leon County Comprehensive Plan: Table of Amended Policies, 1991-2018 (in reverse order) Cycle Elements Amended Goals, Objectives, and Policies 2018-2 ESR (Effective August 13, 2018) County
Sex Differences in Fitness Variance and the Evolution of Mating Systems II
 Sex Differences in Fitness Variance and the Evolution of Mating Systems II Stephen M. Shuster Northern Arizona University Last Time, I mates = [1/(1 - p )][ (V harem ) / (H 2 )] + (p ) / (1 - p ) becomes
RESULTS OF AGRONOMIC AND WEED SCIENCE RESEARCH CONDUCTED IN SOUTH CENTRAL MONTANA
 RESULTS OF AGRONOMIC AND WEED SCIENCE RESEARCH CONDUCTED IN SOUTH CENTRAL MONTANA - 2005 The Annual Report of the Investigations at and Administration of the Southern Agricultural Research Center, Huntley,
UPPER MIDWEST DAIRY NEWS
 Federal Milk Market Administrator U.S. Department of Agriculture UPPER MIDWEST DAIRY NEWS H. Paul Kyburz, Market Administrator Volume 14, Issue 1 Upper Midwest Marketing Area, Federal Order No. 30 January
An Updated Approach to Colon Cancer Screening and Prevention
 An Updated Approach to Colon Cancer Screening and Prevention Kevin Liebovich, MD Director for Quality for Gastrointestinal diseases Advocate Condell Medical Center Colon Cancer Screening and Prevention
Carisoprodolol Quantity Limit Policy Impact Analysis
 Carisoprodolol Quantity Limit Policy Impact Analysis Carisoprodolol (Soma ) is a skeletal muscle relaxant that has deemed by many to have limited effectiveness for the treatment of acute musculoskeletal
GSK Medicine: Study No.: Title: Rationale: Study Period Objectives: Indication: Study Investigators/Centers: Research Methods: Data Source:
 The study listed may include approved and non-approved uses, formulations or treatment regimens. The results reported in any single study may not reflect the overall results obtained on studies of a product.
Kansas EMS Naloxone (Narcan) Administration
 Administration") Kansas EMS Naloxone (Narcan) Administration Executive Summary Kansas Board of Emergency Medical Services August 217 The following pages denote an ongoing trending of naloxone administration by Kansas Emergency
Kansas EMS Naloxone (Narcan) Administration Executive Summary Kansas Board of Emergency Medical Services August 217 The following pages denote an ongoing trending of naloxone administration by Kansas Emergency
Assessing Change with IIS. Steve Robison Oregon Immunization Program
 Assessing Change with IIS Steve Robison Oregon Immunization Program Assessing Change with IIS Steve Robison Oregon Immunization Program Overview IIS Use in Public Health Static vs Dynamic Assessment Working