UNIT 2: RESEARCH METHODS
|
|
|
- Stephen Norton
- 5 years ago
- Views:
Transcription


1 UNIT 2: RESEARCH METHODS Need for Psychological Science Scientific Method Correlation & Experimentation Statistical Reasoning Applied Research & Ethics


2 Module 4 NEED FOR PSYCH SCIENCE
3 What is Intuition? Lets test it. 1. Most people suffer from unrealistically low self-esteem. 2. The opinions of 1500 randomly selected people can provide a fairly accurate picture of the opinions of an entire nation. 3. The scientific finding that depressed people tend to have low self-esteem proves that depression causes people to be down on themselves. 4.Often people think that psychological findings are common sense that people knew all along. 5. Given the number of people who purchase lottery tickets, statisticians believe it is actually likely that somewhere, someone will win the lottery twice. 6. Several psychics have been subjected to scientific tests of their abilities and found to possess real paranormal powers.


4 Intuitive Thinking.. 1. TED Talk & Analysis 2. Flaws of Intuition 3. Intuition Research Overconfidence Hindsight Bias Perceiving Order Bonus: CONFIRMATION BIAS Flaws of Intuition

5 Scientific Attitude & Critical Thinking What are the three main components of the scientific attitude? Foundation of Critical Thinking? The Amazing James Randi!
6 Wrap Up: Identify whether hindsight bias (HB), overconfidence (O), or the tendency to perceive patterns in random events (P) is at work below 1. Toni notices that the last four times she has been to the grocery store she has scored a parking place right up front! She knows she is on a lucky streak! 2. Bruce is often called a Monday Morning Quarterback by his friends for saying he knew the Eagles should have put the rookie wide receiver in last Sunday s game. 3. Amanda, a senior in high school with a 3.0 GPA, is filling out her college applications. When asked by her friends and family what schools she is applying to and what schools she thinks she will get into, she lists Princeton, Yale, Harvard and Stanford and says she thinks she will get into all of them, except maybe for Harvard, which is her reach school. 4. Shreya and Steve break up. Their classmate, Iram, tells her mother that she knew all along the two of them were not going to make it. 5. Fiona, a student in your class, is certain that the instructor does not like her. For the last three class sessions, the instructor has not called on her to answer a question, even though her hand was raised.


7 Module 5 THE SCIENTIFIC METHOD & DESCRIPTION

8 Basics of Scientific Method 1. Crash Course Key Points 2. Module 5 Takeaways 3. Operational Definitions 1. Forming a question 3. Testing the Hypothesis 5. Drawing Conclusions 2. Forming a hypothesis 4. Analyzing the results Final Element: REPLICATION
9 Variables and Null Hypothesis Anything that can change or be changed Independent Variable (sleep): Experimenter manipulates this Dependent Variable (memory): Variable that researchers measure Null Hypothesis: IV has no impact on DV (trying to disprove/reject this)

10 How does a researcher choose which method to use? It depends on the research question. Each research method has advantages and disadvantages.


11 Complete Chart on Descriptive Research
12 Case Studies ADVANTAGES Good source of hypotheses. Provides in-depth information on individuals. Unusual examples can shed light on situations or problems that are unethical or impractical to study in other ways. DISADVANTAGES Vital information may be missing, making the example difficult to interpret. The person s memories may be selective or inaccurate. The individual may not be representative or typical.
13 Naturalistic Observation ADVANTAGES Allows description of behavior as it occurs in the environment. Often useful in first stages of a research program. DISADVANTAGES Allows researcher little or no control of the situation. Observations may be biased. Does not allow firm conclusions about cause and effect.
14 Laboratory Observation ADVANTAGES Allows more control than naturalistic observation. Allows use of sophisticated equipment. DISADVANTAGES Allows researcher only limited control of the situation. Observations may be biased. Does not allow firm conclusions about cause and effect. Behavior may differ from behavior in the natural environment.
15 Surveys ADVANTAGES Provides a large amount of information on large numbers of people. Cheap Hits a lot of people at once DISADVANTAGES If sample is non-representative or biased (Volunteer bias), it may be impossible to generalize from the results. Demand characteristics: people respond in a way they know the researcher wants them to The wording of surveys may be biased and participants are not always honest Low response rate
16 Framing (Why is Wording of Surveys/Interviews important) 1255 people were surveyed by New York s American Museum of Natural History: 1. 77% interested in plants and trees, but only 39% interested in botany 2. 48% interested in fossils, but only 39% interested in paleontology 3. 42% interested in rocks and minerals, but 53% interested in geology Other EXAMPLES?
17 KEY TERMS: Populations & Samples Population: everyone who can be in a study Psychologists would like to generalize what they learn to all people but due to time and money, they have to pick a sample of the total population Sample: Subset of a population who is actually IN the study Random sample (random selection): every person has an equal chance of participating (names in a hat) Representative sample: characteristics that are similar to those in the population A random sample typically generates a representative sample Sampling bias: An error in the sampling process that allows some members of a population to be more or less likely than others to be included in a study.

18 Replication Crisis? Read article and summarize key points Why is replication so important?
19 WRAP UP A theory. is an explanation using an integrated set of principles that organizes observations and predicts behaviors or events, often highly researched A hypothesis. is a testable prediction, often implied by a theory. In psych, it is a statement between or among variables Operationally defining the variables allows for repetition and replication, which is essential;.. These need to be measurable and manageable. Replication importance:. If a result is true, it should show itself over and over. If a study shows that gratitude increases positive well-being, then replication of that study should show the same results. Replicated studies with the same results can lead to advancing our knowledge. Generalizability. The degree that results of a study can be applied to different types of populations
20 Discuss and explain
21 Which descriptive technique would be best utilized in each case: a case study (CS), naturalistic observation (NO) or survey (S). 1. Mr. Bucher wants to determine whether he should use the building funds for a renovated student courtyard or a faculty exercise room. 2. An army doctor wants to see how soldiers are handling the transition back to civilian life. 3. A parent is curious to know how their child behaves when away from home at school. 4. An animal researcher wants to prove that squirrels run in packs as wolves do. 5. The Central Bucks School Board is trying to determine if teachers and students feel the building facilities are adequate and safe.


22 Module 6 CORRELATION & EXPERIMENTATION


23 Discuss and Identify these basic concepts Correlation Correlation Coefficient Scatterplot Positive/Direct Negative/Inverse
24 Correlations Shows how closely related two sets of scores are to each other How well does A predict B? No manipulation of variables in correlational studies so cannot prove causation A statistical measurement called a correlation coeffiecient (represented as r) describes the strength and direction of the relationship. You will not have to calculate! A scatterplot is a type of graph used to display correlational data so that the relationship between two variables is visible
25 Netflix & Not so Chill A positive or DIRECT correlation, shows variables that either rise or fall together V1: # of HW assignment turned in increases; V2: a person s grade in AP Psych also increases A negative or INVERSE correlation, shows variables that go in opposite directions # of hours watching Netflix increases; a person s GPA decreases
 represents the strength of the correlation and the sign (+/-) represents the DIRECTION A correlation coefficient of -.")
26 Correlations Correlation coefficients range from to The number (-.38) represents the strength of the correlation and the sign (+/-) represents the DIRECTION A correlation coefficient of -.70 indicates a stronger relationship than a coefficient of +.65 A correlation of 0 shows that the two sets are not related

27

28 How do you visually represent correlation coefficient on a scatterplot?


29 Positive Correlation +.70 $ $ $ A A A Positive correlation: Variables related in same direction $ A Show graph


30 Negative Correlation -.70 Negative correlation: Variables related in opposite direction Show graph


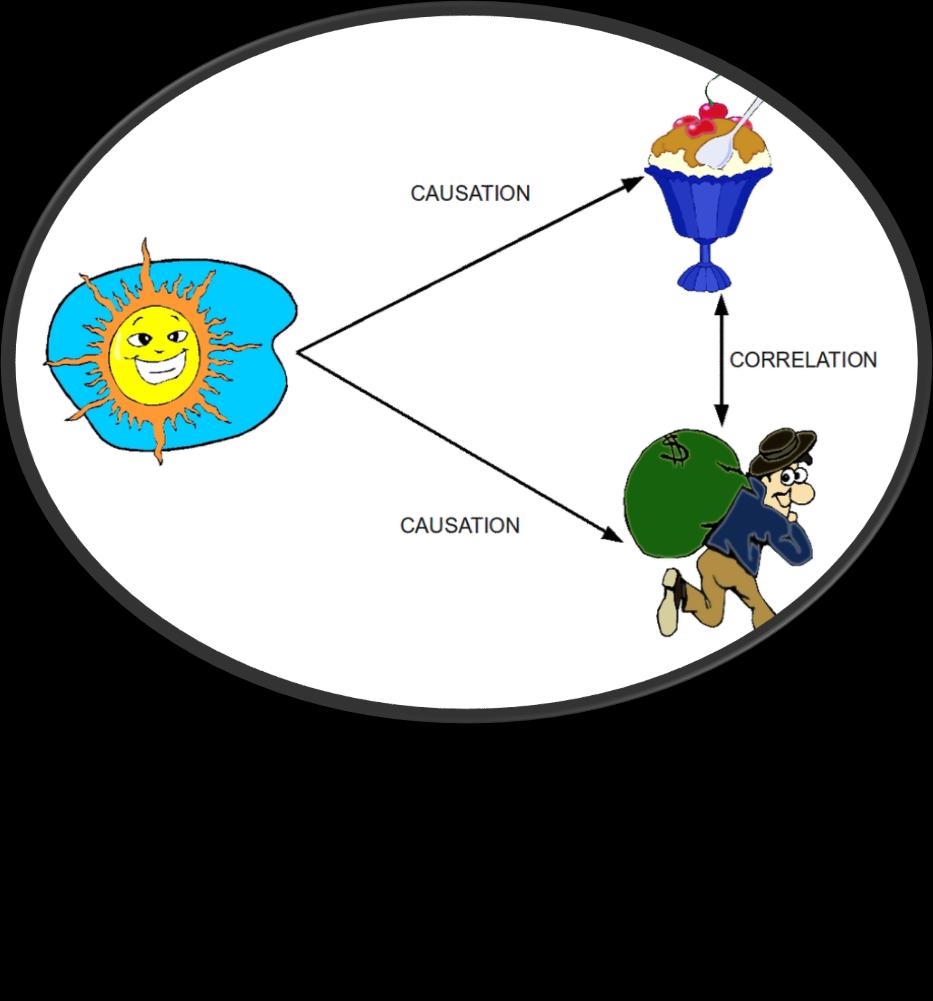
31 Confounding (Third) Variables Third variable problem: Positive correlation between murder rate and the sale of ice-cream. Third variable which includes a confounding variable Weather is cold, fewer people are out interacting with others and less likely to purchase ice-cream. Hot outside, more social interaction and more ice-cream being purchased Weather is the variable that confounds the relationship between ice-cream sales and murder

32 Correlation Does not mean Causation

33 Correlation Does not mean Causation

34 Correlation Does not mean Causation
35 Correlation Does not mean Causation
36 Correlation Does not mean Causation

37 Illusory Correlations? Illusory correlation: A suspected relationship that doesn t empirically exist I saw a few very short students getting A s on my quizzes in class, therefore, short kids must be smarter!


38
39 Predict whether the correlation would likely be positive (P) or negative (N): 1. The number of fast food restaurants: the obesity rate in the U.S. 2. The average U.S. household income: annual gross profit reported by U.S. retailers. 3. The illiteracy rate: the presence of Head Start or early intervention education programs. 4. The number of hours spent commuting to and from work; the amount of dinners cooked at home from scratch. 5. Hours spent learning a skill; proficiency in the skill.
40 Scatterplot Correlation Practice 1. Which is +/- 2. Which scatterplot is stronger? Why? 3. Could you estimate numerical range from this data?
41 Experimentation: Discuss Basic Terms Control Groups Experimental Experimentation Independent Variables Dependent
42 Experiment ADVANTAGES Allows researcher to control the situation. Permits researcher to isolate cause and effect and to distinguish placebo effects from treatment effects. DISADVANTAGES Situation is artificial, and results may not generalize well to the real world. Sometimes difficult to avoid experimenter effects.
43 When psychologists set up an experiment, they think, If I do X, the people in my study will do Y. X Independent variable Y Dependent variable

44 Do Cell Phone Use and Driving Mix?

45 In an experiment, participants are randomly assigned into experimental and control groups... which are then subject to independent and dependent variables. Random Assignment Controlling for confounding variables such as parental intelligence and environment Participants


46 Experimental Method Experimental group Members of an experiment who are exposed to the treatment variable or manipulation by the researcher; represents the treatment group. Control group Participants in an experiment who are not exposed to the treatment variable; this is the comparison group.


47 Experimental Method Independent variable (IV) In an experimental design, the variable manipulated by the researcher to determine its effect on the dependent variable Dependent variable (DV) In an experimental design, the characteristic or response that is measured to determine the effect of the researcher s manipulation
48 Variables continued. Extraneous variable Variable in the environment or of the participants that could unintentionally influence the outcome of the study Confounding variable Type of extraneous variable that may interfere with the independent variable, making it difficult to discern which one is causing changes in the dependent variable Effect of protein on running speed; other foods in diet may confound


49 What does blind mean in research lingo? Single-blind study Experimenter knows who is in which group Participants do not Double-blind study Neither experimenter nor participants know who is in which group Eliminates experimenter bias

50 What is the Placebo Effect? An action or substance given to members of the control group; the fake treatment that has no benefit, but is administered as if it does People taking the placebos often experience effects that are similar to those reported by the participants taking the actual drug or treatment
51 Does my Experiment Test what it is supposed to test? What is validity? Internal Validity: How well constructed was the experiment to control for confounding variables? Content Validity: Learning Shakespeare, test questions on Shakespeare NOT Geometry IQ tests are strictly timed, may be a good measure of speed of processing. However, if researchers do not believe processing speed is an important component of intelligence, content validity would be questioned Face Validity: Tests appears valid to test taker Construct Validity: Self-esteem is a CONSTRUCT. What does it exactly mean though? Difficult to operationalize, need to be clear how you are measuring the construct

52 What about Reliability? Refers to the consistency of a research study or measuring test. If a person weighs themselves during the course of a day they would expect to see a similar reading. Scales which measured weight differently each time would be of little use.


53 Exit Slip What is meant by the phrase correlation does not imply causation? Explain using 4 terms discussed in class today (underline the 4 terms you use)


54 Module 7 STATS IN EVERYDAY LIFE
55

56 Importance of Statistics From what we have already discussed this unit and from module 7 why is statistical reasoning and transparency so important?

57 Descriptive Statistics Organized into a frequency distribution (orderly arrangement of scores) so as to get a measure Type of data determines the type of statistics Nominal: identifies categories(e.g. Eye color; Are you a Democrat (1), Republican (2) or Independent (3)) Ordinal: produces data that can be ordered in a set(compare the GPA of all kids in class, Shortest to tallest) Interval: falls within a number line that has a zero point (height and weight); weight of zero is no weight Ratio: falls within a number line where zero is another number in the line, 0 degrees doesn t mean 0 temperature


58 Data Display Pie chart: % or proportions Bar graph: Good for when data are in categories, spaces between data Histogram: when you have continuous data (person's height), no spaces
59 Measures of Central Tendency Defined View Kahn Academy Video Basic concept of central tendency Measures Mean Mode Median Skewing Positive Skew Negative Skew
 Mean: the arithmetic average Add all")


60 Central Tendency 3 Measures of Central Tendency (OR single scores that represents a whole set of scores) Mean: the arithmetic average Add all scores then divide by number of scores (N) Strongly influenced by outliers gets pulled up or down depending on extreme data points Median: the middle score in a distribution Mode: the most frequently occurring score Bimodal if two scores appear most frequently Multimodal if three or more scores appear most frequently
61 Note that when a variable is normally distributed, the mean, median, and mode are the same number. You can use the following two rules to provide some information about skewness even when you cannot see a line graph of the data (i.e., all you need is the mean and the median): 1. Rule One. If the mean is smaller (because of a very low score) than the median, the data are skewed to the left. 2. Rule Two. If the mean is larger (because of a very high score) than the median, the data are skewed to the right.

62 Practice: Central Tendency AT Dunder-Mifflin $25,000-Pam $25,000- Kevin $25,000- Angela $100,000- Andy $100,000- Dwight $200,000- Jim $300,000- Michael The median salary looks good at $100,000. The mean salary also looks good at about $110,000. But the mode salary is only $25,000. Maybe not the best place to work. Then again living in Scranton is kind of cheap. Mean, Median and Mode - Watch out for extreme scores or outliers!
63 Measures of Variation: Standard Deviation What is the important takeaway related to standard deviation? View Kahn Academy video on Standard Deviation and summarize key points

64 Measures of Variation (Variability) Variability: How spread out or dispersed the data is Range: Calculated by taking the largest data point and subtracting from it the smallest data point, represents span of scores Variance: The mean of the squared difference scores

65 Measures of Variation (Variability) Standard deviation: Average distance from the mean for a set of scores Higher the SD, the less similar the scores are SD = 0 means all the scores in the distribution are the same If our first test has a SD of 5, everyone scored similarly, if it was 50, our scores were not similar at all! Z-score measures the distance of a score from the mean in units of standard deviation A z-score of -1SD means a score is 1SD BELOW the mean, a +1SD is one above
66 Z-Score practice IQ tests scores were compared between CB South & CB West. CB South had a positive Z score while CB West had a negative Z score. These scores definitively show: a. Children at West are not as intelligent as children at South b. Children at South scored above the mean c. The IQ test result differences are statistically significant between the two schools d. Children at South are above average in intelligence e. None of the above
67 To Calculate Variance To calculate the variance for the set of numbers 4, 5, 5, 6, 6, 6, 6, 7, 7, 8: 1. Calculate the mean (average) = 6 2. Subtract the mean from each score in the distribution above 3. This shows you how far each score deviates from the mean, and when you add all of these numbers together, they should always equal zero. 4-6= = = = 0 6-6= 0 6-6= 0 6-6= 0 7-6= 1 7-6= 1 8-6= 2
68 To Calculate Variance (cont.) 4. However, we want to convert the scores to a form that allows us to add them up and not get zero. Therefore, we square all of the deviations scores, which removes all of the negative values. 5. Now when we add them up, we get 12. The larger this number is, the greater the dispersion of the scores is. 6. Now divide the sum above by the number of scores in the group. This gives you the variance or the estimate of the average distance that a score is away from the mean = (squar e this) -2 x -2= x -1= x -1= x 0= x 0= x 0= x 0= x 1= x 1= x 2= 4
69 To Calculate Standard Deviation To calculate standard deviation, all you do is calculate the square root of the variation you just calculated. 1.2 = 1.1 The smaller this number is, the more confident you can be in using the mean to represent the group.
70 How to find the standard deviation when given the variance Simply take the square root of the variance. Ex: If the variance is 81. Take the square root of that. The standard deviation is 9. Try these: If the variance is 144, the standard dev is. If the variance is 9, the standard dev is.

71 Normal Distribution Of Scores IQ Scores, heights, shoe sizes of large groups of people usually produce a symmetrical distribution; pattern of scores on one side are a mirror of the other side Referred to as Bell Curve because of the shape Data in a normal distribution fall around the mean in the same way each time Percentile rank: Percentage of scores in a distribution that a particular score falls above

72 rule In a normal distribution: 68% of scores fall within 1 SD of the mean 95% fall within 2 SD 99.7% fall within 3 SD

73
74 Inferential Statistics Inferential vs Descriptive Statistical Significance Statistical Reliability
75 Statistical Significance Significance reported as p- value, which is the probability of getting the experimental results The closer the p- value is to ZERO, the less likely the result is due to chance ZERO indicates near certainty that the result is due to manipulation of variables, basically impossible When p (equal to or less than) 0.05 a researcher can conclude that the result is unlikely due to chance BUT with p 0.05, you can still expect a different result in 1/20 trials When statistical analysis shows that the results of a study are significant, the researcher can reject the null hypothesis When you reject the null, you are saying that the IV had an impact on the DV With p 0.05, rejecting the null will be the wrong decision 5/100 times or less

76 Module 8 FREQUENTLY ASKED QUESTIONS ABOUT PSYCHOLOGY
77 Ethical studies in past View video on studies from the past Why considered unethical? Ethical guidelines What considerations are given today for animal/human research? what is important about the concepts of informed consent and debriefing? Is psychology free of value judgements?
78 Psychology Applied Meyers Text discussion Can laboratory experiments illuminate everyday life? Does behavior depend on one s culture and gender? Video Discussion Key points from video How does this connect to our previous modules?


79 Social Media Assignment Step 2: Social Media Analysis (Small Group/In Class) A. Share your findings with your group and discuss patterns B. Choose one example from your group, research the actual study or an actual study related to the reference. Using terminology from this unit, write a brief summary of your findings as to whether the study was presented in social media accurately and properly. Step 3: Reflection (Individual/In Class/On Back): How does this assignment reflect the themes of this unit?
80 Unit Review 4.1: Describe how hindsight bias, overconfidence, and the tendency to perceive order in random events illustrate why sciencebased answers are more valid than those based on intuition and common sense. 4.2: Identify how the three main components of the scientific attitude relate to critical thinking. 5.1: Describe how theories advance psychological science. 5.2: Describe how psychologists use case studies, naturalistic observation, and surveys to observe and describe behavior, and explain the importance of random sampling.
81 Unit Review 6.1: Describe positive and negative correlations, and explain how correlational measures can aid the process of prediction but not provide evidence of cause-effect relationships. 6.2: Explain illusory correlations. 6.3: Describe the characteristics of experimentation that make it possible to isolate cause and effect. 7.1: Describe the three measures of central tendency, and discuss the relative usefulness of the two measures of variation.
82 Unit Review 7.2: Explain how we know whether an observed difference can be generalized to other populations. 8.1: Explain the value of simplified laboratory conditions in illuminating everyday life. 8.2: Discuss whether psychological research can be generalized across cultures and genders. 8.3: Explain why psychologists study animals, and describe the ethical guidelines that safeguard animal research participants. 8.4: Describe the ethical guidelines that safeguard human research participants. 8.5: Examine whether psychology is free of value judgements.
Enduring Understanding:
 Research Methods Enduring Understanding: It is actually way more exciting than it sounds!!!! Psychologists use various methods to conduct their scientific research, each having benefits and drawbacks.
Research Methods. It is actually way more exciting than it sounds!!!!
 Research Methods It is actually way more exciting than it sounds!!!! Why do we have to learn this stuff? Psychology is first and foremost a science. Thus it is based in research. Before we delve into how
UNIT II: RESEARCH METHODS
 THINKING CRITICALLY WITH PSYCHOLOGICAL SCIENCE UNIT II: RESEARCH METHODS Module 4: The Need for Psychological Science Module 5: Scientific Method and Description Module 6: Correlation and Experimentation
Students will understand the definition of mean, median, mode and standard deviation and be able to calculate these functions with given set of
 Students will understand the definition of mean, median, mode and standard deviation and be able to calculate these functions with given set of numbers. Also, students will understand why some measures
Theory. = an explanation using an integrated set of principles that organizes observations and predicts behaviors or events.
 Definition Slides Hindsight Bias = the tendency to believe, after learning an outcome, that one would have foreseen it. Also known as the I knew it all along phenomenon. Critical Thinking = thinking that
Describe what is meant by a placebo Contrast the double-blind procedure with the single-blind procedure Review the structure for organizing a memo
 Please note the page numbers listed for the Lind book may vary by a page or two depending on which version of the textbook you have. Readings: Lind 1 11 (with emphasis on chapters 10, 11) Please note chapter
Still important ideas
 Readings: OpenStax - Chapters 1 11 + 13 & Appendix D & E (online) Plous - Chapters 2, 3, and 4 Chapter 2: Cognitive Dissonance, Chapter 3: Memory and Hindsight Bias, Chapter 4: Context Dependence Still
Readings: Textbook readings: OpenStax - Chapters 1 11 Online readings: Appendix D, E & F Plous Chapters 10, 11, 12 and 14
 Readings: Textbook readings: OpenStax - Chapters 1 11 Online readings: Appendix D, E & F Plous Chapters 10, 11, 12 and 14 Still important ideas Contrast the measurement of observable actions (and/or characteristics)
Describe what is meant by a placebo Contrast the double-blind procedure with the single-blind procedure Review the structure for organizing a memo
 Please note the page numbers listed for the Lind book may vary by a page or two depending on which version of the textbook you have. Readings: Lind 1 11 (with emphasis on chapters 5, 6, 7, 8, 9 10 & 11)
Myers Psychology for AP* David G. Myers PowerPoint Presentation Slides by Kent Korek Germantown High School Worth Publishers, 2010
 Myers Psychology for AP* David G. Myers PowerPoint Presentation Slides by Kent Korek Germantown High School Worth Publishers, 2010 *AP is a trademark registered and/or owned by the College Board, which
Module 2/3 Research Strategies: How Psychologists Ask and Answer Questions
 Myers PSYCHOLOGY 8 th Edition in Modules Module 2/3 Research Strategies: How Psychologists Ask and Answer Questions 1 The Need for Psychological Science Psychologists, like all scientists, use the scientific
Clever Hans the horse could do simple math and spell out the answers to simple questions. He wasn t always correct, but he was most of the time.
 Clever Hans the horse could do simple math and spell out the answers to simple questions. He wasn t always correct, but he was most of the time. While a team of scientists, veterinarians, zoologists and
Unit 1 History and Methods Chapter 1 Thinking Critically with Psychological Science
 Myers PSYCHOLOGY (7th Ed) Unit 1 History and Methods Chapter 1 Thinking Critically with James A. McCubbin, PhD Clemson University Worth Publishers Fact vs. Falsehood 1. Human intuition is remarkably accurate
Chapter 1 Thinking Critically with Psychological Science
 Myers PSYCHOLOGY (7th Ed) Chapter 1 Thinking Critically with James A. McCubbin, PhD Clemson University Worth Publishers The Need for Psychologists, like all scientists, use the scientific method to construct
Business Statistics Probability
 Business Statistics The following was provided by Dr. Suzanne Delaney, and is a comprehensive review of Business Statistics. The workshop instructor will provide relevant examples during the Skills Assessment
Statistics is the science of collecting, organizing, presenting, analyzing, and interpreting data to assist in making effective decisions
 Readings: OpenStax Textbook - Chapters 1 5 (online) Appendix D & E (online) Plous - Chapters 1, 5, 6, 13 (online) Introductory comments Describe how familiarity with statistical methods can - be associated
9 research designs likely for PSYC 2100
 9 research designs likely for PSYC 2100 1) 1 factor, 2 levels, 1 group (one group gets both treatment levels) related samples t-test (compare means of 2 levels only) 2) 1 factor, 2 levels, 2 groups (one
Welcome to OSA Training Statistics Part II
 Welcome to OSA Training Statistics Part II Course Summary Using data about a population to draw graphs Frequency distribution and variability within populations Bell Curves: What are they and where do
The degree to which a measure is free from error. (See page 65) Accuracy
 Accuracy") Accuracy The degree to which a measure is free from error. (See page 65) Case studies A descriptive research method that involves the intensive examination of unusual people or organizations. (See page
Accuracy The degree to which a measure is free from error. (See page 65) Case studies A descriptive research method that involves the intensive examination of unusual people or organizations. (See page
Statistics is the science of collecting, organizing, presenting, analyzing, and interpreting data to assist in making effective decisions
 Readings: OpenStax Textbook - Chapters 1 5 (online) Appendix D & E (online) Plous - Chapters 1, 5, 6, 13 (online) Introductory comments Describe how familiarity with statistical methods can - be associated
Biostatistics. Donna Kritz-Silverstein, Ph.D. Professor Department of Family & Preventive Medicine University of California, San Diego
 Biostatistics Donna Kritz-Silverstein, Ph.D. Professor Department of Family & Preventive Medicine University of California, San Diego (858) 534-1818 dsilverstein@ucsd.edu Introduction Overview of statistical
Describe what is meant by a placebo Contrast the double-blind procedure with the single-blind procedure Review the structure for organizing a memo
 Business Statistics The following was provided by Dr. Suzanne Delaney, and is a comprehensive review of Business Statistics. The workshop instructor will provide relevant examples during the Skills Assessment
Still important ideas
 Readings: OpenStax - Chapters 1 13 & Appendix D & E (online) Plous Chapters 17 & 18 - Chapter 17: Social Influences - Chapter 18: Group Judgments and Decisions Still important ideas Contrast the measurement
Readings: Textbook readings: OpenStax - Chapters 1 13 (emphasis on Chapter 12) Online readings: Appendix D, E & F
 Online readings: Appendix D, E & F") Readings: Textbook readings: OpenStax - Chapters 1 13 (emphasis on Chapter 12) Online readings: Appendix D, E & F Plous Chapters 17 & 18 Chapter 17: Social Influences Chapter 18: Group Judgments and Decisions
Readings: Textbook readings: OpenStax - Chapters 1 13 (emphasis on Chapter 12) Online readings: Appendix D, E & F Plous Chapters 17 & 18 Chapter 17: Social Influences Chapter 18: Group Judgments and Decisions
Human intuition is remarkably accurate and free from error.
 Human intuition is remarkably accurate and free from error. 3 Most people seem to lack confidence in the accuracy of their beliefs. 4 Case studies are particularly useful because of the similarities we
Chapter 7: Descriptive Statistics
 Chapter Overview Chapter 7 provides an introduction to basic strategies for describing groups statistically. Statistical concepts around normal distributions are discussed. The statistical procedures of
Psychology Research Process
 Psychology Research Process Logical Processes Induction Observation/Association/Using Correlation Trying to assess, through observation of a large group/sample, what is associated with what? Examples:
THE RESEARCH ENTERPRISE IN PSYCHOLOGY
 THE RESEARCH ENTERPRISE IN PSYCHOLOGY Chapter 2 Mr. Reinhard Winston Churchill High School Adapted from: Psychology: Themes and Variations by Wayne Weiten, 9 th edition Looking for laws Psychologists share
AP Psychology -- Chapter 02 Review Research Methods in Psychology
 AP Psychology -- Chapter 02 Review Research Methods in Psychology 1. In the opening vignette, to what was Alicia's condition linked? The death of her parents and only brother 2. What did Pennebaker s study
Readings: Textbook readings: OpenStax - Chapters 1 4 Online readings: Appendix D, E & F Online readings: Plous - Chapters 1, 5, 6, 13
 Readings: Textbook readings: OpenStax - Chapters 1 4 Online readings: Appendix D, E & F Online readings: Plous - Chapters 1, 5, 6, 13 Introductory comments Describe how familiarity with statistical methods
Thinking Critically with Psychological Science
 PSYCHOLOGY (8th Edition) David Myers PowerPoint Slides Aneeq Ahmad Henderson State University Worth Publishers, 2006 1 Thinking Critically with Psychological Science Chapter 1 2 Thinking Critically with
AP Psych - Stat 1 Name Period Date. MULTIPLE CHOICE. Choose the one alternative that best completes the statement or answers the question.
 AP Psych - Stat 1 Name Period Date MULTIPLE CHOICE. Choose the one alternative that best completes the statement or answers the question. 1) In a set of incomes in which most people are in the $15,000
Psychological Research
 Introduction Psychologists do more than just wonder about human behavior: they conduct research to understand exactly why people think, feel, and behave the way they do. Like other scientists, psychologists
Conducting Research. Research Methods Chapter 1. Descriptive Research Methods. Conducting Research. Case Study
 Research Methods Chapter 1 Conducting Research Goals of Psychology Describe Explain Predict Control Pitfalls of intuition and common sense explanations: Hindsight bias, overconfidence Remember psychology
Psychology Research Process
 Psychology Research Process Logical Processes Induction Observation/Association/Using Correlation Trying to assess, through observation of a large group/sample, what is associated with what? Examples:
Results & Statistics: Description and Correlation. I. Scales of Measurement A Review
 Results & Statistics: Description and Correlation The description and presentation of results involves a number of topics. These include scales of measurement, descriptive statistics used to summarize
Analysis and Interpretation of Data Part 1
 Analysis and Interpretation of Data Part 1 DATA ANALYSIS: PRELIMINARY STEPS 1. Editing Field Edit Completeness Legibility Comprehensibility Consistency Uniformity Central Office Edit 2. Coding Specifying
Research. how we figure stuff out. Methods
 Research how we figure stuff out Methods Penny in the Glass Activity Let s Make A Deal! One volunteer is needed for a chance to win $1,334,499! Let s Make A Deal Shows Us That: Human Intuition is highly
Chapter 11. Experimental Design: One-Way Independent Samples Design
 11-1 Chapter 11. Experimental Design: One-Way Independent Samples Design Advantages and Limitations Comparing Two Groups Comparing t Test to ANOVA Independent Samples t Test Independent Samples ANOVA Comparing
AP Psychology Ch. 01 Psych Science & Stats Study Guide
 Name: Period: 1. Which of the following best describes the hindsight bias? A) Events seem more predictable before they have occurred. B) Events seem more predictable after they have occurred. C) A person's
Psychology - MR. CALLAWAY Mundy s Mill High School Unit RESEARCH METHODS
 Psychology - MR. CALLAWAY Mundy s Mill High School Unit 2.1 - RESEARCH METHODS Intro to Research How do psychologists ask & answer questions? Differentiate types of research with regard to purpose, strengths,
Unit 1 Exploring and Understanding Data
 Unit 1 Exploring and Understanding Data Area Principle Bar Chart Boxplot Conditional Distribution Dotplot Empirical Rule Five Number Summary Frequency Distribution Frequency Polygon Histogram Interquartile
Unit 2: Research Methods: Thinking Critically With Psychological Science
 Unit 2: Research Methods: Thinking Critically With Psychological Science Module 4- The Need for Psychological Science Define the following key terms 1. hindsight bias 2. critical thinking Answer the following
AP Psych - Stat 2 Name Period Date. MULTIPLE CHOICE. Choose the one alternative that best completes the statement or answers the question.
 AP Psych - Stat 2 Name Period Date MULTIPLE CHOICE. Choose the one alternative that best completes the statement or answers the question. 1) In a set of incomes in which most people are in the $15,000
Political Science 15, Winter 2014 Final Review
 Political Science 15, Winter 2014 Final Review The major topics covered in class are listed below. You should also take a look at the readings listed on the class website. Studying Politics Scientifically
CHAPTER 2. MEASURING AND DESCRIBING VARIABLES
 4 Chapter 2 CHAPTER 2. MEASURING AND DESCRIBING VARIABLES 1. A. Age: name/interval; military dictatorship: value/nominal; strongly oppose: value/ ordinal; election year: name/interval; 62 percent: value/interval;
Introduction to PSYCHOLOGY
 Introduction to PSYCHOLOGY PSYCHOLOGY The scientific study of behavior and the mental process. What are the characteristics of an excellent Psychologist? How do psychologists think? I feel myself a naturalist
CHAPTER 3 DATA ANALYSIS: DESCRIBING DATA
 Data Analysis: Describing Data CHAPTER 3 DATA ANALYSIS: DESCRIBING DATA In the analysis process, the researcher tries to evaluate the data collected both from written documents and from other sources such
1. What is the difference between positive and negative correlations?
 1. What is the difference between positive and negative correlations? 2. Can correlations make predictions? 3. Can correlations prove causation? 4. What are illusory correlations? We can take data from
Quizzes (and relevant lab exercises): 20% Midterm exams (2): 25% each Final exam: 30%
: 20% Midterm exams (2): 25% each Final exam: 30%") 1 Intro to statistics Continued 2 Grading policy Quizzes (and relevant lab exercises): 20% Midterm exams (2): 25% each Final exam: 30% Cutoffs based on final avgs (A, B, C): 91-100, 82-90, 73-81 3 Numerical
1 Intro to statistics Continued 2 Grading policy Quizzes (and relevant lab exercises): 20% Midterm exams (2): 25% each Final exam: 30% Cutoffs based on final avgs (A, B, C): 91-100, 82-90, 73-81 3 Numerical
Outline. Practice. Confounding Variables. Discuss. Observational Studies vs Experiments. Observational Studies vs Experiments
 1 2 Outline Finish sampling slides from Tuesday. Study design what do you do with the subjects/units once you select them? (OI Sections 1.4-1.5) Observational studies vs. experiments Descriptive statistics
The Beauty and Necessity of Good Research Design
 Name: 1 Shaw - PSYC& 100 The Beauty and Necessity of Good Research Design 1 The authors say, Research design matters. Why do we need research designs? What do they accomplish for us? Use the case of prefrontal
Beware of Confounding Variables
 Beware of Confounding Variables If I wanted to prove that smoking causes heart issues, what are some confounding variables? The object of an experiment is to prove that A causes B. A confounding variable
Chapter 1: Exploring Data
 Chapter 1: Exploring Data Key Vocabulary:! individual! variable! frequency table! relative frequency table! distribution! pie chart! bar graph! two-way table! marginal distributions! conditional distributions!
04/12/2014. Research Methods in Psychology. Chapter 6: Independent Groups Designs. What is your ideas? Testing
 Research Methods in Psychology Chapter 6: Independent Groups Designs 1 Why Psychologists Conduct Experiments? What is your ideas? 2 Why Psychologists Conduct Experiments? Testing Hypotheses derived from
Chapter 2. The Research Enterprise in Psychology 8 th Edition
 Chapter 2 The Research Enterprise in Psychology 8 th Edition The Scientific Approach: A Search for Laws Empiricism Basic assumption: events are governed by some lawful order Goals: Measurement and description
c. Construct a boxplot for the data. Write a one sentence interpretation of your graph.
 STAT 280 Sample Test Problems Page 1 of 1 1. An English survey of 3000 medical records showed that smokers are more inclined to get depressed than non-smokers. Does this imply that smoking causes depression?
Descriptive Statistics Lecture
 Definitions: Lecture Psychology 280 Orange Coast College 2/1/2006 Statistics have been defined as a collection of methods for planning experiments, obtaining data, and then analyzing, interpreting and
9/24/2014 UNIT 2: RESEARCH METHODS AND STATISTICS RESEARCH METHODS RESEARCH METHODS RESEARCH METHODS
 RESEARCH METHODS UNIT 2: RESEARCH METHODS AND STATISTICS 8-10% of AP Exam Case Studies A case study is an in-depth study of one person. In a case study, nearly every aspect of the subject's life and history
3 CONCEPTUAL FOUNDATIONS OF STATISTICS
 3 CONCEPTUAL FOUNDATIONS OF STATISTICS In this chapter, we examine the conceptual foundations of statistics. The goal is to give you an appreciation and conceptual understanding of some basic statistical
MBA 605 Business Analytics Don Conant, PhD. GETTING TO THE STANDARD NORMAL DISTRIBUTION
 MBA 605 Business Analytics Don Conant, PhD. GETTING TO THE STANDARD NORMAL DISTRIBUTION Variables In the social sciences data are the observed and/or measured characteristics of individuals and groups
Table of Contents. Plots. Essential Statistics for Nursing Research 1/12/2017
 Essential Statistics for Nursing Research Kristen Carlin, MPH Seattle Nursing Research Workshop January 30, 2017 Table of Contents Plots Descriptive statistics Sample size/power Correlations Hypothesis
Psychology's History and Approaches
 Psychology's History and Approaches Empiricism: the view that knowledge originates in experience and that science should rely on observation and experimentation. Structuralism: an early school of psychology
Empirical Knowledge: based on observations. Answer questions why, whom, how, and when.
 INTRO TO RESEARCH METHODS: Empirical Knowledge: based on observations. Answer questions why, whom, how, and when. Experimental research: treatments are given for the purpose of research. Experimental group
INTRODUCTION TO STATISTICS
 Basic Statistics Introduction to Statistics Basic Statistical Formulas Commonly used Ecological Equations INTRODUCTION TO STATISTICS Statistics is the branch of mathematics that deals with the techniques
Samples, Sample Size And Sample Error. Research Methodology. How Big Is Big? Estimating Sample Size. Variables. Variables 2/25/2018
 Research Methodology Samples, Sample Size And Sample Error Sampling error = difference between sample and population characteristics Reducing sampling error is the goal of any sampling technique As sample
Higher Psychology RESEARCH REVISION
 Higher Psychology RESEARCH REVISION 1 The biggest change from the old Higher course (up to 2014) is the possibility of an analysis and evaluation question (8-10) marks asking you to comment on aspects
Conducting Research. Research Methods Chapter 1. Descriptive Research Methods. Conducting Research
 Research Methods Chapter 1 Conducting Research Goals of Psychology Describe Explain Predict Control Pitfalls of intuition and common sense explanations: Hindsight bias, overconfidence Remember psychology
DO NOT OPEN THIS BOOKLET UNTIL YOU ARE TOLD TO DO SO
 NATS 1500 Mid-term test A1 Page 1 of 8 Name (PRINT) Student Number Signature Instructions: York University DIVISION OF NATURAL SCIENCE NATS 1500 3.0 Statistics and Reasoning in Modern Society Mid-Term
The Scientific Approach: A Search for Laws Basic assumption of science: Events are governed by some lawful order. Goals of psychology: Measure and
 The Scientific Approach: A Search for Laws Basic assumption of science: Events are governed by some lawful order. Goals of psychology: Measure and describe Understand and predict Apply and control Explain
Correlational Method. Does ice cream cause murder, or murder cause people to eat ice cream? As more ice cream is eaten, more people are murdered.
 Correlational Method Naturalistic observations, surveys, and case studies often show us that one trait or behavior is related to another. Correlation expresses a relationship between two variables. Does
Appendix B Statistical Methods
 Appendix B Statistical Methods Figure B. Graphing data. (a) The raw data are tallied into a frequency distribution. (b) The same data are portrayed in a bar graph called a histogram. (c) A frequency polygon
The Science of Psychology
 The Science of Psychology Module 2 Psychology s Scientific Method Module Objectives Why is Psychology a Science? What is the scientific method? Why should I believe what researchers say? How do Psychologist
C-1: Variables which are measured on a continuous scale are described in terms of three key characteristics central tendency, variability, and shape.
 MODULE 02: DESCRIBING DT SECTION C: KEY POINTS C-1: Variables which are measured on a continuous scale are described in terms of three key characteristics central tendency, variability, and shape. C-2:
*Karle Laska s Sections: There is NO class Thursday or Friday! Have a great Valentine s Day weekend!
 STATISTICS 100 EXAM 1 Spring 2016 PRINT NAME (Last name) (First name) NETID: CIRCLE SECTION: L1 (Laska MWF 12pm) L2 (Laska Tues/Thurs 11am) Write answers in appropriate blanks. When no blanks are provided
Skills Center Psychology Practice Exam II
 1.) The scientific method always a. begins with observation and ends with generation of a hypothesis. b. begins with generation of a hypothesis and ends with systematic observation. c. begins and ends
Psychology: The Science
 Psychology: The Science How Psychologists Do Research Ex: While biking, it seems to me that drivers of pick up trucks aren t as nice as car drivers. I make a hypothesis or even develop a theory that p/u
WDHS Curriculum Map Probability and Statistics. What is Statistics and how does it relate to you?
 WDHS Curriculum Map Probability and Statistics Time Interval/ Unit 1: Introduction to Statistics 1.1-1.3 2 weeks S-IC-1: Understand statistics as a process for making inferences about population parameters
Announcement. Homework #2 due next Friday at 5pm. Midterm is in 2 weeks. It will cover everything through the end of next week (week 5).
.") Announcement Homework #2 due next Friday at 5pm. Midterm is in 2 weeks. It will cover everything through the end of next week (week 5). Political Science 15 Lecture 8: Descriptive Statistics (Part 1) Data
Announcement Homework #2 due next Friday at 5pm. Midterm is in 2 weeks. It will cover everything through the end of next week (week 5). Political Science 15 Lecture 8: Descriptive Statistics (Part 1) Data
Statistics for Psychology
 Statistics for Psychology SIXTH EDITION CHAPTER 3 Some Key Ingredients for Inferential Statistics Some Key Ingredients for Inferential Statistics Psychologists conduct research to test a theoretical principle
STATISTICS AND RESEARCH DESIGN
 Statistics 1 STATISTICS AND RESEARCH DESIGN These are subjects that are frequently confused. Both subjects often evoke student anxiety and avoidance. To further complicate matters, both areas appear have
RESEARCH IN PSYCHOLOGY
 RESEARCH IN PSYCHOLOGY BASIC VS. APPLIED Basic Seeking knowledge for the sake of knowledge itself pure research Applied Studying psychological issues in order to apply the findings to help solve problems
Lecture 4: Research Approaches
 Lecture 4: Research Approaches Lecture Objectives Theories in research Research design approaches ú Experimental vs. non-experimental ú Cross-sectional and longitudinal ú Descriptive approaches How to
Unit 3: Collecting Data. Observational Study Experimental Study Sampling Bias Types of Sampling
 Unit 3: Collecting Data Observational Study Experimental Study Sampling Bias Types of Sampling Feb 7 10:12 AM The step of data collection is critical to obtain reliable information for your study. 2 Types
Distributions and Samples. Clicker Question. Review
 Distributions and Samples Clicker Question The major difference between an observational study and an experiment is that A. An experiment manipulates features of the situation B. An experiment does not
Statistics. Nur Hidayanto PSP English Education Dept. SStatistics/Nur Hidayanto PSP/PBI
 Statistics Nur Hidayanto PSP English Education Dept. RESEARCH STATISTICS WHAT S THE RELATIONSHIP? RESEARCH RESEARCH positivistic Prepositivistic Postpositivistic Data Initial Observation (research Question)
Standard Deviation and Standard Error Tutorial. This is significantly important. Get your AP Equations and Formulas sheet
 Standard Deviation and Standard Error Tutorial This is significantly important. Get your AP Equations and Formulas sheet The Basics Let s start with a review of the basics of statistics. Mean: What most
ISC- GRADE XI HUMANITIES ( ) PSYCHOLOGY. Chapter 2- Methods of Psychology
 PSYCHOLOGY. Chapter 2- Methods of Psychology") ISC- GRADE XI HUMANITIES (2018-19) PSYCHOLOGY Chapter 2- Methods of Psychology OUTLINE OF THE CHAPTER (i) Scientific Methods in Psychology -observation, case study, surveys, psychological tests, experimentation
ISC- GRADE XI HUMANITIES (2018-19) PSYCHOLOGY Chapter 2- Methods of Psychology OUTLINE OF THE CHAPTER (i) Scientific Methods in Psychology -observation, case study, surveys, psychological tests, experimentation
Practice for Units 1 & 2
 PSYCHOLOGY SECTION I Time--.7 Minutes per question 50 Questions, Units 1 & 2 Practice for Units 1 & 2 Directions: Each of the questions or incomplete statements below is followed by five suggested answers
copyright D. McCann, 2006) PSYCHOLOGY is
 PSYCHOLOGY is") UNIT I(slides copyright D. McCann, 2006) PSYCHOLOGY is PSYCHOLOGY is the scientific study of behavior and mental processes SCOPE OF THE SUBJECT Blowfly Wilder Penfield Attitude change Mob Violence (deindividuation)
UNIT I(slides copyright D. McCann, 2006) PSYCHOLOGY is PSYCHOLOGY is the scientific study of behavior and mental processes SCOPE OF THE SUBJECT Blowfly Wilder Penfield Attitude change Mob Violence (deindividuation)
M 140 Test 1 A Name SHOW YOUR WORK FOR FULL CREDIT! Problem Max. Points Your Points Total 60
 M 140 Test 1 A Name SHOW YOUR WORK FOR FULL CREDIT! Problem Max. Points Your Points 1-10 10 11 3 12 4 13 3 14 10 15 14 16 10 17 7 18 4 19 4 Total 60 Multiple choice questions (1 point each) For questions
V. Gathering and Exploring Data
 V. Gathering and Exploring Data With the language of probability in our vocabulary, we re now ready to talk about sampling and analyzing data. Data Analysis We can divide statistical methods into roughly
Introduction to Statistical Data Analysis I
 Introduction to Statistical Data Analysis I JULY 2011 Afsaneh Yazdani Preface What is Statistics? Preface What is Statistics? Science of: designing studies or experiments, collecting data Summarizing/modeling/analyzing
Statistical Techniques. Masoud Mansoury and Anas Abulfaraj
 Statistical Techniques Masoud Mansoury and Anas Abulfaraj What is Statistics? https://www.youtube.com/watch?v=lmmzj7599pw The definition of Statistics The practice or science of collecting and analyzing
Lesson 11 Correlations
 Lesson 11 Correlations Lesson Objectives All students will define key terms and explain the difference between correlations and experiments. All students should be able to analyse scattergrams using knowledge
STATISTICS & PROBABILITY
 STATISTICS & PROBABILITY LAWRENCE HIGH SCHOOL STATISTICS & PROBABILITY CURRICULUM MAP 2015-2016 Quarter 1 Unit 1 Collecting Data and Drawing Conclusions Unit 2 Summarizing Data Quarter 2 Unit 3 Randomness
Chapter 1: Thinking critically with. Introduction
 Chapter 1: Thinking critically with psychological science Introduction Fact or Falsehood 1. Human intuition is remarkable accurate and free from error. 2. Most people seem to lack confidence in the accuracy
MODULE 1 - PSYCHOLOGY S HISTORY
 Name Period AP Psychology Units 1 & 2 History, Approaches MODULE 1 - PSYCHOLOGY S HISTORY 1. Prescientific Psychology - Our understanding of psychology has evolved over centuries, beginning with the Greeks
Research Methods. Page 1 of 23
 Research Methods Page 1 of 23 Research Methods Revision Guide The Various Experimental and Non-Experimental Research Methods 1 2 Experimental Research Methods, including: Laboratory Experiment features,
Thinking Critically with Psychological Science
 Introductory Psychology PSY 120000-003 Prof. Kipling Williams Purdue University Fall 2008 Teaching Assistants: Alvin Ty Law Jim Wirth Going over the Syllabus Go to: www2.psych.purdue.edu/~kip Click on