Lesion evidence for the critical role of the intraparietal sulcus in spatial attention
|
|
|
- Dustin Bishop
- 5 years ago
- Views:
Transcription
1 Lesion evidence for the critical role of the intraparietal sulcus in spatial attention Céline R. Gillebert 1, Dante Mantini 2, Vincent Thijs 3,4, Stefan Sunaert 5, Patrick Dupont 1, Rik Vandenberghe 1,4 1 Laboratory for Cognitive Neurology, K.U.Leuven; 2 Laboratory for Neuro- and Psychophysiology, K.U.Leuven; 3 Vesalius Research Centre, Vlaams Instituut voor Biotechnologie; 4 Neurology Department, University Hospitals Leuven; 5 Radiology Department, University Hospitals Leuven; Herestraat 49, 3000 Leuven, Belgium Running title: Orienting deficits after IPS lesions Correspondence to: Rik Vandenberghe. Neurology Department, University Hospitals Leuven, Herestraat 49 - bus 7003, B-3000 Leuven, Belgium. Tel: , Fax: rik.vandenberghe@uz.kuleuven.ac.be. This is a pre-copy-editing, author-produced PDF of an article accepted for publication in Brain following peer review. The definitive publisher-authenticated version (Gillebert, C.R., Mantini, D., Thijs, V., Sunaert, S., Dupont, P., and Vandenberghe, R. (2011). Lesion evidence for the critical role of the intraparietal sulcus in spatial attention. Brain, 134: ) is available online at: 1
2 Abstract Based on lesion mapping studies, the inferior parietal lobule and temporoparietal junction are considered the critical parietal regions for spatial-attentional deficits. Lesion evidence for a key role of the intraparietal sulcus, a region featuring prominently in nonhuman primate studies and human functional imaging studies of the intact brain, is still lacking, probably due to the exceptional nature of isolated intraparietal sulcus lesions. We combined behavioral testing and functional imaging in 2 patients with a focal intraparietal sulcus lesion sparing the inferior parietal lobule and temporoparietal junction to examine the critical contribution of the intraparietal sulcus to spatial attention. HH had a focal ischemic lesion (1.8 cm 3 ) that was confined to the posterior segment of the left intraparietal sulcus, whereas NV had a partially reversible lesion of the middle segment of the right intraparietal sulcus extending into the superior parietal lobule (13.8 cm 3 ). The performance of these cases was contrasted with 5 cases with a classical inferior parietal lesion, as well as with a group of 31 age-matched controls. In the behavioral study the patients performed an orientation discrimination task on a peripheral target (eccentricity 7.6 ) that was preceded by a central spatial cue. We manipulated both the cue ity (17% trials with an in spatial cue) and the presence of a competing distracter in the visual field contralateral to the target (17% double stimulation trials). The ability of the intraparietal sulcus patients to re-orient their spatial focus of attention and to select between competing stimuli was impaired for contralesional targets compared to controls, similarly to what we saw in the inferior parietal group. Furthermore, we could observe that the deficit in NV resolved with regression of the lesion. To further evaluate the correspondence between spatial-attentional deficits and the intraparietal sulcus lesions, we ascertained the functional integrity of the inferior parietal lobule and temporoparietal junction in HH using an event-related fmri with the same task as in the behavioral study. His intraparietal sulcus lesion did not affect the task-related activation of the inferior parietal lobule or temporoparietal junction. Additionally, a resting-state fmri study in HH and 62 controls revealed that his lesion did not affect the topology of the ventral attention network nor the strength of its main inter- and intrahemispheric connections. Our findings demonstrate that the human superior parietal cortex critically contributes to spatially selective attention. Key Words: spatial attention; parietal cortex; stroke; neuroimaging Abbreviations: IPS = intraparietal sulcus; IPL = inferior parietal lobule; TPJ = temporopari- 2
3 etal junction; SPL = superior parietal lobule; STG = superior temporal gyrus; IFG = inferior frontal gyrus; RSN = resting-state network; MRI = magnetic resonance imaging; FLAIR = fluid attenuated inversion recovery; VLSM = voxel-based lesion-symptom mapping; IC = independent component Introduction Decades of clinical neurology have highlighted the critical role of parietal cortex in spatially selective attention (Critchley, 1953; Mesulam, 1990, 2000; Corbetta et al., 2008; Riddoch et al., 2010). Neuroanatomically more refined techniques in healthy human subjects have implicated separate parts (Husain and Nachev, 2007) of parietal cortex, such as the intraparietal sulcus (IPS) (Corbetta and Shulman, 2002; Hung et al., 2005; Molenberghs et al., 2007, 2008; Vandenberghe and Gillebert, 2009), the temporoparietal junction (TPJ) (Corbetta et al., 2000; Downar et al., 2000; Corbetta and Shulman, 2002; Vossel et al., 2009) or the superior parietal lobule (SPL) (Vandenberghe et al., 2001; Yantis et al., 2002) in different attentional processes, including, among others, endogenous control (Corbetta and Shulman, 2002), spatial reorienting (Corbetta et al., 2008) and shifting (Vandenberghe et al., 2001; Yantis et al., 2002), the computation of a saliency map (Molenberghs et al., 2008) or the detection of low-frequency events (Downar et al., 2000; Vossel et al., 2009). The IPS itself is composed of functionally specialised areas in humans and in nonhuman primates (Gottlieb et al., 1998). The horizontal segment of the IPS contains the putative human homologue of monkey area LIP, where neurons are strongly modulated by spatial attention and code for a topographical representation of attentional weights (Gottlieb et al., 1998; Sereno et al., 2001; Bundesen et al., 2005; Molenberghs et al., 2008). More posteriorly, the human IPS contains a series of visually responsive areas (denominated as IPS0/V7, IPS1, IPS2) with retinotopic representations of the contralateral visual field (Silver et al., 2005; Swisher et al., 2007; Wandell et al., 2007; Silver and Kastner, 2009; Sheremata et al., 2010) which are sensitive to the direction of attention (Yantis et al., 2002; Vandenberghe et al., 2005; Vandenberghe and Gillebert, 2009; Silver and Kastner, 2009; Bressler and Silver, 2010). To the left, the directional effect in IPS0 persists during short-term memory tasks in particular when set size is high (Sheremata et al., 2010). The exact monkey homologue of these posterior IPS regions is still under debate (Tootell et al., 1998; Koyama et al., 2004; Orban et al., 2006) and to the best of our knowledge isolated lesions in humans have not been reported previously. The key role of IPS in selective attention is supported by transcranial 3
4 magnetic stimulation studies showing that disruption of the posterior parietal cortex activity can induce attentional deficits in healthy subjects, including a failure to detect (Pascual-Leone et al., 1994; Koch et al., 2005), identify (Hung et al., 2005) or visually track (Battelli et al., 2009) targets in the visual field contralateral to the stimulation site under conditions of bilateral simultaneous stimulation (see Driver et al., 2010; Sack, 2010, for reviews). Lesion evidence that IPS is critically important for spatially selective attention in patients is lacking. A highly influential lesion study in parietal stroke patients attributed the spatialattentional deficit, as measured in Posner s inity paradigm (Posner et al., 1984), to inferior rather than superior parietal damage (Friedrich et al., 1998). Lesion overlap (Vallar and Perani, 1986; Karnath et al., 2001; Karnath et al., 2003; Bays et al., 2010), lesion subtraction (Mort et al., 2003; Grandjean et al., 2008; Ticini et al., 2010) and voxel-based lesion-symptom mapping (VLSM) (Karnath et al., 2004, 2010) studies in neglect and extinction have also emphasized the contribution of the inferior parietal lobule (IPL) (Vallar and Perani, 1986; Mort et al., 2003; Bays et al., 2010), TPJ (Karnath et al., 2003; Grandjean et al., 2008; Ticini et al., 2010) and posterior third of the superior temporal gyrus (STG) (Karnath et al., 2001, 2004, 2010) rather than IPS. The typical parietal lesions causing neglect and extinction have their center of gravity in IPL (Mort et al., 2003) but often extend into the lateral bank of IPS (Molenberghs et al., 2008). In a recent model of visual attention that integrates evidence from multiple scientific disciplines, the occurrence of spatial neglect after acute stroke is attributed to the combined effect of a reorienting problem originating from TPJ and a lateralized attentional bias originating from IPS (Corbetta and Shulman, 2002; Corbetta et al., 2005; Carter et al., 2010). This model is partly based on task-related (Corbetta et al., 2005) and resting-state (He et al., 2007; Carter et al., 2010) functional magnetic resonance imaging (fmri) studies in patients with neglect during the acute phase and after recovery. These provide evidence for alterations at a distance of the structural lesion, in activity of individual nodes and in connectivity between nodes (Alstott et al., 2009), within but also between functional networks (Corbetta, 2010). Cases with cortical lesions restricted to IPS and sparing IPL are extremely valuable to evaluate whether IPS in its own right critically contributes to spatially selective attention in the intact brain and whether lesions of IPS can independently cause spatial-attentional deficits. Such lesions, however, are exceptional given the distribution of vascular territories in the human brain. We report performance of a hybrid /in cueing (Posner et al., 1984; Friedrich et al., 1998) and stimulus competition paradigm (Molenberghs et al., 2008) in two cases with a 4
5 Table 1 Patient characteristics. Values in bold indicate a pathological score on the test. Abbreviations: M = male; F = female; L = left; R = right; time = time-to-stroke onset; VF = visual field; LL = left lower quadrantanopia. Bisection = percentage deviation to the patients right (positive) or left (negative) hand side. Omissions = omissions on the star cancellation test in left and right hemispace. case age sex lesion time volume VF bisection omissions side (days) (cm 3 ) defect (%) (L/R) IPS cases: HH 52 M L % 0/0 NV 23 F R % 2/0 IPL cases: AN 65 M R % 6/2 CK 62 M R LL -3% 0/0 MD 67 M R % 2/0 RE 77 M R % 0/0 PS 67 M R % 0/0 focal IPS lesion. Given the evidence from task-related and resting-state fmri studies in neglect (Corbetta et al., 2005; He et al., 2007; Carter et al., 2010; Corbetta, 2010), we took special care to ascertain not only the structural but also the functional integrity of IPL and TPJ. Five cases with a typical IPL lesion served as positive controls. Methods The study was approved by the Ethics Committee, University Hospitals Leuven. All participants provided written informed consent in accordance with the Declaration of Helsinki. Participants Patients with ischemic lesions restricted to parietal cortex on clinical fluid attenuated inversion recovery (FLAIR) or diffusion-weighted MRI were consecutively recruited via the acute stroke unit of the University Hospitals Leuven, Belgium, or on occasion of their first post-stroke visit to the outpatient clinic. Extension into the insula or the posterior temporal cortex was permitted based on the known distribution of the vascular territory of the posterior branches of the middle cerebral artery. Exclusion criteria were age above 85 years, pre-existing structural lesions or extensive periventricular or subcortical white matter hyperintensities on MRI, presence of hemianopia, insufficient balance to sit autonomously in front of a computer, and general inability to understand and perform a computerized perceptual discrimination task. Visual perimetry was formally tested in each patient in a computerized manner. We screened a consecutive series of 870 patients, 7 of whom fulfilled the inclusion criteria (Table 1). 5
6 Two of the participants, HH and NV, had an IPS lesion that strictly spared IPL (Fig. 1A- D). HH (strictly right-handed male, 52 years; Table 1) had a focal lesion (volume = 1.8 cm 3 ) that was confined to the posterior segment of left IPS (Fig. 1A,B). The lesion consisted of 2 juxtaposed components at Montreal Neurological Institute (MNI) coordinates x=-19, y=- 72, z=36 (1.1 cm 3 ) and x=-15, y=-67, z=59 (0.7 cm 3 ). NV (strictly right-handed female, 23 years) had a lesion of the horizontal segment of right IPS (volume = 13.8 cm 3 ) extending into SPL. The center of gravity was located at x=19, y=-64, z=47. She also had a second smaller asymptomatic FLAIR hyperintense lesion in the left postcentral gyrus (Suppl. Fig. 1A). NV s symptoms were strictly lateralized to the left foot and leg (numbness and weakness) and she also reported having hit the door jamb with her left side on several occasions. She was tested 4 days after her stroke (Fig. 1C,D, Suppl. Fig. 1A) and 107 days later when her lesions had significantly diminished (1.2 cm 3 ) to a small portion of SPL (Suppl. Fig. 1B). As the underlying cause, HH had an arterial ischemia and NV a venous infarction. The 5 remaining parietal lesion patients had a classical arterial ischemic lesion that was confined to right IPL extending into the posterior part of STG and the insula (center of gravity: x=55, y=-37, z=19; Fig. 1E,F). In one of the IPL cases (AN, Table 1) 3% of the lesion overlapped with NV s lesion. All patients participated in a computerized behavioral experiment and underwent a structural MRI. The IPS cases also participated in a task-related and resting-state fmri experiment. Because HH and NV differed in age (Table 1) we recruited both elderly and young controls. For the behavioral experiment, 17 healthy subjects above the age of 50 (8 women, age 52-73) served as controls for HH and the IPL group, and 14 healthy subjects below the age of 35 (10 women, age 19-31) served as controls for NV. Sixteen healthy subjects (8 women, age 20-26) participated as controls in the task-related fmri experiment and 62 healthy subjects (25 women, age 20-72) in the resting-state fmri experiment. Behavioral experiment Stimulus presentation and response registration were controlled by a PC running Presentation 11.3 (Neurobehavioral systems, Albany, CA). Participants were seated at 50 cm from a 19-inch cathode ray tube monitor (resolution pixels, refresh rate 75 Hz). A trial started with a warning cue (duration 150 ms), followed by a central spatial arrow cue pointing leftward or rightward (200 ms), a delay phase (200 ms) during which only the fixation dot (size 0.45 ) was shown, and a test phase during which a peripheral grating was added (200 ms, size 3.5, 0.5 cycles/degree; mean luminance, 192 cd/m 2 ) (Fig. 2A). The grating could be 6


 Anatomy")


 Lesions")


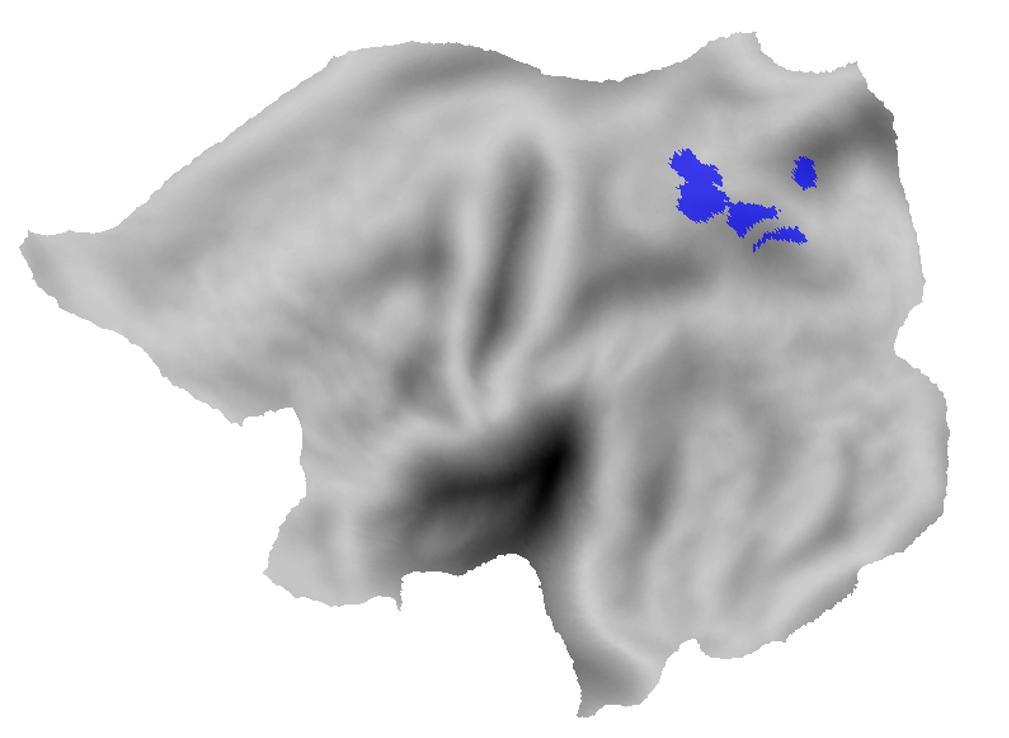

7 A z=30 Z=35 z=40 z=45 z=50 z=55 z=60 y=-55 y=-60 y=-65 y=-70 y=-75 y=-80 y=-85 z=30 z=35 z=40 z=45 z=50 z=55 z=60 y=-55 y=-60 y=-65 y=-70 y=-75 y=-80 y=-85 B C D L E R F L R L R n=1 n=5 case HH IPL cases case NV overlap IPS and IPL cases Figure 1 Neuroanatomy of lesions. (A-D) Anatomy of the patients brain on T1-weighted MR images, normalized to MNI space. The lesions of HH (A,B) and NV (day 4, C,D) are projected on axial (A,C) and coronal (B,D) slices. (E) Lesions in HH, NV and the 5 IPL cases projected onto a surface rendering of the brain (lateral, medial and dorsal view) (PALS Atlas, Caret (Van Essen, 2005)). The black outline indicates the lesion overlap between case NV and one of the IPL cases (AN). (F) Projection of the lesions on the flattened brain surface. 7
8 A warning 150 ms delay 50 ms cue 200 ms delay 200 ms stimulus 200 ms maximum trial duration 6000 ms B (66.6%) in (16.7%) double (16.7%) (66.6%) in (16.7%) double (16.7%) left-sided target (50%) right-sided target (50%) Figure 2 Experimental paradigm (A) Example of the trial sequence. (B) The experimental design: target location (left-sided, right-sided) and trial type (/, in/, /double) as independent factors. presented to the left or to the right at 7.6 eccentricity on the horizontal meridian. Its orientation was either horizontal (90 ) or vertical (0 ). With their right hand subjects held a response box with two response buttons. They were instructed to maintain fixation on the central fixation dot and select a button depending on the orientation of the target grating. In 66% of the trials ( / ) a grating appeared at the cued location, in 17% of the trials ( in/ ) a grating appeared contralaterally to the cued location, and in 17% of the trials ( /double ) the target grating appeared at the cued location together with a second, irrelevant grating at the contralateral location (Fig. 2B). The distracter orientation, horizontal or vertical, was pseudorandomly chosen with the constraint that each option occurred equally often and that it was congruent with the target orientation in half of trials and incongruent in the remaining half. The intertrial interval was paced by the subject s response, with a minimum intertrial interval of 2250 ms. If no response was given, the trial was aborted after 6000 ms and the next trial was initiated. Subjects first received 24 training trials followed by 3 series of 120 trials separated by a brief pause. Gaze fixation was monitored by means of infrared eye monitoring (Viewpoint Eye Tracker; Arrington Research; Scottsdale, AZ) throughout the training and experimental runs. As accuracy measure we used A, a non-parametric estimate of how well the grating orientations can be discriminated (Snodgrass et al., 1985), with a value near 1.0 corresponding to good discriminability and a value near 0.5 corresponding to chance performance. We analyzed 8
9 the reaction times (RTs) of correct responses for each subject using an ex-gaussian distribution probability-density model (Vossel et al., 2006; Lacouture and Cousineau, 2008). From the fitted function, we derived the mean (µ), standard deviation and exponential component in each subject. The primary outcome analysis consisted of the contrast between in/ and / ( inity effect ) for contra- and ipsilesional targets and the contrast between /double and / ( competition effect ) for contra- and ipsilesional targets in HH and NV compared to age-matched controls. Inference was based on a modified t-test (Crawford and Garthwaite, 2002). As a second primary outcome measure we conducted a analysis of variance (ANOVA) with group (3 levels: IPS cases, IPL cases, healthy controls) as between-subjects factor and trial type (3 levels: /, in/, /double) and target location (2 levels: contralesional versus ipsilesional in patients, left-sided versus right-sided in healthy controls) as within-subjects factors. For NV, the behavioral data on day 4 were used. A non-parametric randomization test with 2000 iterations was used to determine the statistical significance of the obtained F -values: we repeatedly randomized the subject order, assigned the individual subjects to the levels of the factor group according to the shuffled subject order, submitted the shuffled data to a ANOVA and saved the resulting F -values for each main and interaction effect. The F -values observed in the ANOVA on the original data were compared to distribution of F -values obtained using the randomization procedure. F -values in the right tail of the probability distribution (Bowman and Azzalini, 1997)(P <0.05) were considered statistically significant (Fig. 3). Post-hoc analyses were conducted using the same randomization procedure: the 3 groups of subjects were compared in a pairwise manner (2 3 2 design) and correction for multiple contrasts was done using Bonferroni (P <0.05). Structural MRI Structural and functional images were acquired on a 3 tesla Philips Intera system (Best, Netherlands) equipped with a head volume coil. Structural imaging sequences consisted of a T1- weighted 3D turbo-field-echo sequence (repetition time (TR) 9.6 ms, echo time (TE) 4.6 ms, inplane resolution 0.97 mm, slice thickness 1.2 mm) and FLAIR image (TR ms, TE 150 ms, in-plane resolution 0.45 mm, slice thickness 4 mm). Using Statistical Parametric Mapping 2005 (SPM5) (Welcome Trust Centre for Neuroimaging, London, UK, we co-registered the T1 and FLAIR images of each patient. The boundary of the lesion was delineated on the individual MR images for every transverse slice (voxel-resolution mm 3 ) 9
10 number of instances F = 9.69, P = F-value for the 3-way interaction between group, trial type and target location Figure 3 Behavioral experiment The distribution of F -values corresponding to the 3-way interaction group trial type target location, was generated using a randomization procedure and is shown in grey. Its estimated density function is shown by the black curve. The F-value associated with the 3-way interaction in an ANOVA on the original data, is indicated by a red line. with MRIcron (Rorden et al., 2007) ( The T1- weighted image was segmented and the resulting parameters were used to spatially normalize all images into the standard MNI space. A cost-function masking was used to prevent the damaged brain areas from biasing the transformation matrix. The spatial normalization involved both linear (12 parameters) and nonlinear (7 9 7 basis functions, 16 iterations) transformations (Ashburner and Friston, 1999). The match between each patient s normalized brain and the template was carefully evaluated through visual inspection and use of a cross-hair yoked between the template and the normalized image. Task-related fmri experiment In order to evaluate functional changes of parietal regions that were structurally intact in HH and NV, we acquired whole-brain functional scans consisting of T2* gradient-echo echoplanar images acquired continuously in ascending order (TR 2 s, TE 30 ms, 90 flip angle, acquisition matrix, mm 2 in-plane resolution, mm thick axial slices without gap). NV underwent the fmri experiment on day 107 when her lesion was reduced to a small portion of the SPL and her performance on the spatial cueing task had already normalized. Sixteen controls and the 2 IPS cases completed 6 runs with respectively 189 and 100 scans per run. Eye movements were registered in controls using an Applied Science Laboratory (Waltham, MA) infrared system and analyzed using an automatized procedure. In controls the intertrial interval was fixed (2250 ms) and the orientation difference to be 10
11 discriminated relative to a 45 reference orientation was adjusted from run to run to reach an accuracy level of 75-85% across all conditions. The effects of trial type and target location on performance were tested with a repeated measures ANOVA. Each run consisted of 140 trials (60% /, 20% in/, 20% /double) and 28 null events. The stimuli and task were otherwise identical to what was used in the behavioral experiment. To ensure adequate task performance in the patients during fmri (Price et al., 2006), they had to discriminate between a horizontal and vertical orientation, similarly to the behavioral experiment, and the intertrial interval was paced by their response with a minimum of 2000 ms and a maximum of 6000 ms. The fmri data were analyzed using SPM5. Following realignment, normalization and smoothing (5 5 7 mm 3 Full Width Half Maximum, FWHM) we calculated for each subject the contrast image of in/ versus / trials, as this contrast has been shown to activate IPL and TPJ (Corbetta et al., 2000; Vossel et al., 2006). We also calculated the contrast image of right-sided target versus left-sided target trials across all trial types, as well as the contrast image of right-sided versus left-sided target trials for the /double condition specifically. At a second level we determined whether the average contrast images were significantly different from zero (one-sample t-test: voxel-level threshold P <0.001, cluster-level threshold P <0.05 corrected for the entire brain volume (Poline et al., 1997)). In order to evaluate whether task-related activity in structurally preserved parietal regions in the patients differed from that observed in healthy controls, we used a leave-one-out strategy: for each control we determined the effect size of the contrast of in/ minus / trials in parietal volumes-of-interest (VOIs) which were defined on the basis of the same contrast in the remaining 15 controls. The effect size was defined as the weighted sum of β-values (β in left target +β in right target -β left target -β right target ) and averaged across all voxels within a VOI. After having obtained a normal range of values, we determined the effect size in the patients in the VOIs defined in the controls. Inference was based on a modified t-test (Crawford and Garthwaite, 2002). Resting-state fmri experiment We obtained resting-state fmri in HH, NV (at day 107), and 62 controls. Two IPL cases (AN, PS) also participated as positive patient controls. During the resting-state fmri run (425 s), we acquired 250 functional images with TR 1700 ms, TE 33 ms, 90 flip angle, acquisition matrix, mm 2 in-plane resolution, 32 axial slices with 4 mm thickness and no gap. 11
12 Subjects were instructed to remain awake with their eyes closed and not to think about anything in particular. Following realignment, normalization and smoothing (7 7 7 mm 3 FWHM) we defined the ventral and dorsal attention networks (Fox et al., 2006; Mantini et al., 2007) in the healthy control group by means of a template-matching procedure (Mantini et al., 2009). The restingstate networks (RSNs) were defined as Independent Component (IC) clusters (Esposito et al., 2005) with high across-subject consistency (proportion of subjects contributing to the cluster > 66%) and a significant difference between intra- and extra-cluster correlations (P <0.001, Bonferroni corrected for sample size) (Mantini et al., 2007). For each patient we derived the lesion fraction, the proportion of the lesion that spatially overlapped with each of the RSNs (threshold: Z >2). We also examined in the patients how their lesion affected the topology of the ventral and dorsal attention networks (Fox et al., 2006). The similarity in topology between an IC in the individual subject and the RSNs in the group of controls (group RSNs) was estimated by measuring the spatial correlation between the maps, excluding the damaged brain area. We computed the spatial correlation between the ICs in each patient and the group RSNs and determined on that basis which ICs in each patient best matched the ventral and dorsal attention networks. Next, we compared the spatial correlation between the selected ICs in each patient and the group RSNs with the distribution of correlation values obtained in controls using the same procedure (leave-one out approach). Values in the left tail of the distribution (P <0.05) were considered pathological. As an additional measure of the functional integrity of TPJ, we analyzed the strength of its main inter- and intrahemispheric connections (Fox et al., 2006; Carter et al., 2010): we measured the resting-state functional connectivity (Carter et al., 2010) of right TPJ with left TPJ and right inferior frontal gyrus (IFG), respectively. The VOIs were defined by a sphere (6-mm radius) centered in the peak foci of the ventral attention network derived by ICA in controls (right TPJ: x=56,y=-43,z=13; left TPJ: x=-59,y=-46,z=15; right IFG: x=58,y=10,z=9). A representative time-course was obtained by averaging across all voxels within each VOI. Pearson s correlations were calculated for each subject using the VOI time-courses and converted to Z -scores by means of the Fisher s r-to-z transformation (Carter et al., 2010). Statistical significance of the difference in Z -scores between patients and controls was assessed using a modified t-test (Crawford and Garthwaite, 2002). 12
13 Table 2 Accuracy (A ) in the behavioral and fmri experiments L = left-sided target; R = rightsided target; A = a non-parametric measure of performance. (A) Behaviorial experiment: For HH and the IPL group values in bold indicate a significant performance decrease relative to the / condition between the patient(s) and the elderly age-matched control group (n=17). For NV performance was compared with the young age-matched control group (n=14). (B) fmri experiment: Values in bold indicate a significant performance decrease relative to / condition between HH or NV and the healthy control group (n=16). s.d. = standard deviation. case / in/ /double L R L R L R A. Behavioral experiment: HH NV, day NV, day IPL group elderly healthy controls young healthy controls B. fmri experiment: HH NV healthy controls (s.d.) (0.02) (0.03) (0.05) (0.03) (0.04) (0.04) Results Behavioral experiment According to on-line infrared eye tracking, patients and controls kept stable gaze fixation on the central fixation dot, except for one IPL case (AN) in whom eye fixation could not be monitored reliably. Analysis of the RTs did not yield any significant differences (Suppl. Table 2A). HH performed the / trials accurately, both for contra- (t 16 =-1.05, P=0.15, (Crawford and Garthwaite, 2002)) and ipsilesional targets (t 16 =-0.50, P=0.31; Fig. 4A, Table 2A). He however showed a pathological increase of the inity effect when in/ trials were compared to / trials for contralesional targets (t 16 =1.75, P=0.049). When /double trials were compared to / trials for contralesional targets, A dropped from 0.96 to 0.50, corresponding to chance performance (competition effect in HH compared to controls: t 16 =4.49, P=0.0002). For ipsilesional targets, the inity effect (t 16 =0, P=0.50) and the competition effect (t 16 =0.49, P=0.32) did not differ from age-matched controls (Fig. 4A, Table 2A). In NV, at day 4 performance during ipsilesional / trials was within the normal range (t 13 =0.18, P=0.43). Accuracy during contralesional / trials however was decreased compared to age-matched controls (t 13 =1.80, P=0.047; Fig. 4B, Table 2A). The in- 13
14 A A A A controls (n=17) case HH B 1.0 in double contralesional target in double ipsilesional target controls (n=14) case NV, day 4 case NV, day 107 C 1.0 in double contralesional target in double ipsilesional target controls (n=31) IPS cases (n=2) IPL cases (n=5) in double contralesional target in double ipsilesional target Figure 4 Behavioral experiment: A (A) HH (in red) versus age-matched controls (in black). (B) NV at day 4 (solid red line) and day 107 (dotted red line) versus age-matched controls (in black). (C) Group analysis. The mean values are plotted for the IPS group (HH, NV, red), the IPL group (in blue), and the control group. Error bars denote s.e.m. 14
15 ity effect (the reduction in A from / to in/ trials) was pathologically increased compared to controls, both for contra- (t 13 =2.90, P=0.006) and for ipsilesional targets (t 13 =3.86, P=0.001). This was also true when /double trials were compared to / trials for contralesional targets (t 13 =4.35, P=0.0004). For ipsilesional targets, the competition effect did not differ from healthy controls (t 13 =-0.48, P=0.32). Three months later, when the lesion had regressed (Suppl. Fig. 1B), all outcome parameters in NV had normalized (P >0.05; Fig. 4B, Table 2A). In 4 of the 5 IPL patients, the inity effect was increased for contralesional targets (Fig. 5A-D; AN: t 16 =1.70, P=0.05; CK, t 16 =3.16, P=0.003; MD: t 16 =2.92, P=0.006; RE: t 16 =7.05, P<0.001). In one patient (CK), it was also significantly increased for ipsilesional targets (Fig. 5B; t 16 =2.92, P=0.005). In 3 of the IPL patients, the competition effect was significantly increased for contralesional targets (Fig. 5A, AN: t 16 =5.18, P<0.001; Fig. 5C, MD: t 16 =5.35, P<0.001; Fig. 5D, RE: t 16 =5.83, P<0.001), with chance level performance in /double trials with contralesional targets. Performance of /double trials with ipsilesional targets was intact. At the group level, a ANOVA with group (IPS, IPL, healthy controls), trial type (/, in/, /double) and target location (contra- versus ipsilesional for patients, left-sided versus right-sided attention for controls) as factors and A as outcome measure revealed a three-way interaction (F 4,70 =9.69, P=0.001; Fig. 4C, Fig. 3). We further evaluated this interaction effect by pairwise comparison between each of the groups. When the IPS group was contrasted with controls, the three-way interaction between group, trial type and target location (F 2,62 =13.93, P=0.006) and the two-way interactions between group and trial type (F 2,62 =4.59, P=0.03) and between group and target location (F 1,31 =28.96, P =0.002) were significant. In the IPS group the inity effect was larger than in controls for contralesional targets (F 1,31 =9.17, P=0.009) but not for ipsilesional targets (F 1,31 =0.84, P =0.20; Fig. 4C). The competition effect was also significantly larger than in controls for contralesional (F 1,31 =22.8, P=0.004) but not for ipsilesional targets (F 1,31 =0.05, P=0.84). When the IPL group was contrasted with controls, the three-way interaction between group, trial type and target location (F 2,68 =13.16, P=0.001) and the two-way interactions between group and trial type (F 2,68 =8.32, P=0.004) and between group and target location (F 1,34 =20.36, P=0.0007) were significant: The inity effect was larger in the IPL patients relative to controls for contralesional targets (F 1,34 =34.82, P<0.0001; Fig. 4C), with a trend present for ipsilesional targets (F 1,34 =3.23, P=0.05). The competition effect was significantly 15
 (PALS Atlas, Caret 5.612; Van Essen et al., 2005).")
16 A. case AN A B. case CK A C. case MD A D. case RE A E. case PS A in double contralesional target in double ipsilesional target Figure 5 Behavioral experiment: A in the IPL group. Left panel: The lesions of the 5 IPL cases are projected onto a surface rendering of the brain (lateral view of the right hemisphere) (PALS Atlas, Caret 5.612; Van Essen et al., 2005). Right panel: Performance (A ) of each IPL case (in red) versus age-matched elderly controls (in black). (A) Case AN. (B) Case CK. (C) Case MD. (D) Case RE. (E) Case PS. 16
17 larger relative to controls for contralesional (F 1,34 =23.13, P=0.0001) but not for ipsilesional targets (F 1,34 =0.17, P=0.67). No significant differences were found between the IPS and IPL patient groups in the inity or competition effect, neither for contra- nor for ipsilesional targets (three-way interaction: F 2,10 =0.14, P=0.80; Fig. 4C). HH, AN, CK, MD and RE were re-tested 15 months later to evaluate the degree of recovery of their spatial attentional deficits (Suppl. Table 1A). The competition effect and the inity effect remained significantly increased in HH for contralesional targets (t 16 =4.17, P<.001 and t 16 =2.33, P=0.02, respectively). This was also true for the competition effect in AN (t 16 =5.18, P<.001) and for the inity effect in MD (t 16 =1.76, P<0.05). Evaluation of functional integrity of IPL HH, NV (day 107) and 16 healthy controls participated in an event-related fmri study using the same paradigm as during the behavioral experiment. In controls the orientation difference to be discriminated during fmri was 8.6, averaged across subjects and runs (range 6-11 ). We observed a significant main effect of trial type on A (F 2,30 =6.34, P=0.005; Table 2B) and mean RT (F 2,30 =10.96, P=0.0003; Suppl. Table 2B). Eye movements did not differ between conditions (main effects of trial type and target location: F 2,30 =1.60, P=0.22 and F 1,15 =0.71, P=0.41, respectively). In HH, each run contained on average 91 trials with 59.7% / trials, 20.2% in/ and 20.1% /double trials and in NV each run contained on average 90 trials with 60.3% / trials, 19.8% in/ and 19.9% /double trials. Compared to controls, HH showed a pathological increase of the inity and competition effect for contralesional (t 15 =9.22, P< and t 15 =3.88, P=0.0007, respectively) but not for ipsilesional targets (P >0.40), confirming the findings from the behavioral experiment (Table 2). NV s behavioral performance did not differ significantly from controls (Table 2), in agreement with her behavioral recovery. In controls, the contrast between in/ minus / trials activated left and right TPJ and IPL, left STG, left IPS and the medial wall of SPL, among other areas (Fig. 6A, Table 3). HH showed a normal activation pattern within these regions compared to controls (contrast in/ minus / in HH versus controls P >0.35 in all regions; Fig. 6C; Table 3). The contrast of right-sided minus left-sided targets in controls activated the occipitoparietal cortex in the left hemisphere, including a posterior IPS focus corresponding to the lesion site in case HH (x=-21, y=-78, z=33, Z =4.37, P=0.004; Fig. 6B). In controls, activity 17
18 Table 3 fmri experiment: task-related fmri activity Anatomical location and statistical assessment of parietal brain areas that showed significantly stronger activation in in/ relative to / trials (voxel-level uncorrected P<0.001, cluster-level corrected P<0.05). Values in bold indicate a significant difference in the effect size of HH or NV and the healthy control group (n=16). Legend: STG, superior temporal gyrus; IPL, inferior parietal lobule; IPS, intraparietal sulcus; SPL, superior parietal lobule; TPJ, temporoparietal junction; MNI, Montreal Neurological Institute region MNI peak # voxels Z mean effect size (x,y,z) 27 mm 3 controls (s.d.) case HH case NV left STG -63,-54, (1.90) left IPL -48,-48, (3.57) left IPS -33,-60, (4.00) medial SPL 3,-63, (5.15) right TPJ 57,-45, (2.84) in this posterior IPS focus was higher for right-sided targets than left-sided targets even under double stimulation conditions (t 15 =2.35, P=0.03; Fig. 6D), confirming the presence of an attentional effect within this visually responsive region (Yantis et al., 2002; Vandenberghe et al., 2005; Silver and Kastner, 2009; Bressler and Silver, 2010). In NV, the contrast in/ minus / yielded significantly higher activity in left IPS compared to controls (t 15 =2.35, P =0.02; Fig. 6C; Table 3). HH, NV, 2 IPL cases and 62 controls also took part in a resting-state fmri study. The structural lesion of patient HH exclusively mapped onto the dorsal attention network as defined in healthy controls (lesion fraction 58%; Fig. 7B). In NV (day 4), the principal overlap was also with the dorsal attention network (70% of her structural lesion; Fig. 7B) and, through its extension into SPL, with what is called the ventral attention network (which also includes an SPL component) (lesion fraction 6%; Fig. 7A) (Fox et al., 2006; Mantini et al., 2009). The main components however of the ventral attention network are IPL and specifically TPJ. The IPL patients lesion overlapped mainly with the ventral attentional network (lesion fraction 27%; Fig. 7A) and with the dorsal attentional network (lesion fraction 12%; Fig. 7B). To evaluate functional changes of the RSNs in HH and NV, we assessed whether they could be identified in these patients and whether they corresponded in their topology to the RSNs in controls. Two IPL cases also participated as positive patient controls. The correspondence was estimated through spatial correlation across all voxels that were structurally intact in the individual patient. The correspondence between the ventral attention network in HH and NV and the ventral attention network in the group of controls (r =0.39 and r =0.38, respectively) lay well within the normal range of spatial correlations observed in healthy subjects (HH compared to controls: probability that a healthy control shows the same or a lower spatial correlation: 18

19 effect size s.e.m. % signal change A B L R L C 15 controls (n=16) case HH case NV (day 107) T-score D 0.1 T-score leftsided / in/ /double rightsided TPJ medial SPL right TPJ TPJ region-of-interest medial 5 SPL right TPJ region-of-interest left STG left IPL left IPS medial SPLright TPJ region-of-interest seconds to trial onset t IPL left IPS medial SPLright TPJ Figure 6 Task-related fmri (A) T-map, thresholded at voxel-level uncorrected P<0.001, cluster-level FWE-corrected P<0.05, obtained in 16 healthy controls corresponding to the contrast of in/ minus / trials. (B) T-map obtained in healthy controls for the contrast of right-sided minus left-sided target trials. Anatomical location of HH s lesion is marked with a black outline. (C) Effect size, defined as the weighted sum of β-values, for case HH (in blue), case NV (in green) and controls (in black) in the left STG, IPL and IPS, the medial SPL and the right TPJ. Error bars represent s.e.m. across controls. (D) Time-activity curve in healthy controls. Average over 16 controls in the area of overlap (6 voxels) between the structural lesion of HH and the activity map shown in (D). Error bars represent s.e.m. across controls. Legend: blue: /; red: in/; green: /double; solid: left-sided target; dotted line: right-sided target

20 number of controls number of controls A ventral attention network C 30 P< AN PS NV HH 5 B Z-score dorsal attention network D P<0.05 spatial correlation 10 5 NV AN HH PS Z-score case HH case NV case AN case PS spatial correlation Figure 7 Topology of RSNs in patients and healthy controls (A-B) The ventral and dorsal attention networks in 62 healthy controls are represented on fiducial cortical surfaces. The border of the lesions in HH (blue), NV (green) and 2 IPL cases (AN in black, PS in white) are superimposed on the surfaces. (C-D) For each of the RSNs, the spatial correlation of the best-matching IC in each patient with the group RSN, is compared to the distribution of correlations obtained in healthy controls using the same procedure. The distribution was described by estimating its density in a non-parametric way, shown by the black curve (Bowman and Azzalini, 1997). Pathological correlations are those in the lower 5% of the distribution. The relative threshold for pathology is indicated by a red line. 20
 Main functional connectivity within the ventral attention network, from right TPJ to")
21 Z-score % signal change A Functional connectivity of right TPJ interhemispheric fc right TPJ left TPJ B intrahemispheric fc right TPJ right IFG 8 6 interhemispheric intrahemispheric functional connectivity of right TPJ 4 controls case HH case NV Figure 8 Functional connectivity of right TPJ (A) Main functional connectivity within the ventral attention network, from right TPJ to left TPJ (interhemispheric) and to right IFG (intrahemispheric). (B) The strength of the connectivity, expressed in Z-scores, for HH (in blue) and NV (in green). Error bars represent s.e.m. across controls. Abbreviations: fc: functional connectivity. P=0.29; NV compared to controls: P=0.25; Fig. 7C). In the IPL patients, it was significantly decreased (AN: r =0.29, P =0.02; PS: r =0.31, P =0.04). The topology of the dorsal attention network was preserved in HH and the IPL patients (P>0.14) but altered in NV (r=0.28, P=0.03; Fig. 7D). We also investigated by seed-based connectivity the strength of the main functional connections of TPJ in HH and NV (Fig. 8A)(Carter et al., 2010). Interhemispheric seed-based connectivity between left and right TPJ, and intrahemispheric connectivity between right TPJ and IFG were within the normal range for HH (t 61 =0.25, P=0.40 and t 61 =-0.19, P=0.42, respectively) and NV (t 61 =0.33, P=0.37 and t 61 =0.77, P=0.22, respectively; Fig. 8B). Discussion Isolated IPS lesions are extremely rare but can be highly informative as a critical test for how essential the role of IPS is in spatially selective attention. A long-standing discrepancy exists between functional imaging data in healthy controls and lesion mapping studies of spatial attention in this respect. The former highlight the contribution of superior parietal cortex to spatial attention (Corbetta et al., 1993; Nobre et al., 1997; Gitelman et al., 1999; Molenberghs et al., 2007, 2008; Mevorach et al., 2009), along with TPJ under specific circumstances (Corbetta et al., 2000; Downar et al., 2000; Vossel et al., 2009), while the latter almost invariably point to 21
22 IPL and TPJ as the critical parietal nodes (Vallar and Perani, 1986; Mort et al., 2003; Karnath et al., 2004). In the present study, isolated lesions of the posterior and the horizontal segment of the IPS (Fig. 1A-D) resulted in deficits of spatially selective attention (Fig. 4A,B). According to advanced functional imaging techniques (Fox et al., 2006; Mantini et al., 2009; Carter et al., 2010), the attentional deficits in HH could not be attributed to secondary functional effects occurring at a distance in IPL or TPJ (Fig. 6, 7, 8): The IPS lesion in HH did not alter the task-related activation in TPJ (Fig. 6C) nor the intra- and interhemispheric functional connectivity of TPJ (Carter et al., 2010) (Fig. 8B), and did not affect the topology of the ventral attention network (Fox et al., 2006) (Fig. 7C). An unusually focal lesion in the posterior segment of the IPS (Fig. 1A,B) was sufficient to cause a significant behavioral deficit in spatial attention (Fig. 4A). The deficit occurred only when the need for spatially selective attention was high. HH performed within the normal range when a contralesional target on the cued location was presented without competing distracter (Table 2A,B). The high performance levels during / trials rule out sensory factors as an explanation. The attentional deficit was strongly lateralized. The strict laterality of the deficit excludes non-spatial attentional processes, such as oddball detection, as an explanation. At first sight the lateralization of the attentional deficit following a left-sided lesion differs from what one would predict based on the theory of right hemispheric dominance of visual attention (Weintraub and Mesulam, 1988). This theory accounts for the higher prevalence of clinical neglect following right-hemispheric lesions. HH had only mild signs of clinical neglect at initial testing. The right hemispheric dominance for spatial attention may possibly be less pronounced in the posterior part of IPS or may mainly hold for more severe degrees of clinical neglect (Mesulam, 2002). By and large, the contralateral retinotopic representations in IPS0-1 are symmetrical between left and right IPS (Silver et al., 2005) and more prominent than in more anterior parts of IPS (Silver et al., 2005; Swisher et al., 2007). The symmetrical representation in posterior IPS may therefore explain why HH s left-sided lesion provided a clearly lateralized spatial attention deficit. In the intact brain this posterior IPS segment contains multiple retinotopically organized areas, including V7 (Tootell et al., 1998) or IPS0 (Silver et al., 2005) which forms a map cluster with IPS1 sharing a common foveal representation (Swisher et al., 2007; Wandell et al., 2007; Silver and Kastner, 2009). These areas are sensitive to the direction of attention (Fig. 6D) (Yantis et al., 2002; Vandenberghe et al., 2005; Silver and Kastner, 2009; Bressler and Silver, 2010). Which exact retinotopic area HH s lesion mapped onto was not tested directly because of 22
23 the high demands to the patient of reliable retinotopic mapping in parietal cortex. It remains a topic for further investigation how the laterality of the spatial deficit is affected by the reference frame, retinotopic or nonretinotopic (Vandenberghe and Gillebert, 2009). The main lesion in our second case, NV, at day 4 lay in the right IPS, but NV also had a concomitant smaller and strictly asymptomatic lesion in the left postcentral gyrus (Suppl. Fig. 1). It is most unlikely that this lesion contributed to the behavioral deficit in NV: her symptoms were strictly left lateralized, this region has not been implicated in attentional processing before and in fact, did not overlap with any of the activity maps obtained in the task-related fmri experiment or with the RSNs. The right-hemispheric IPS lesion in NV co-localized with the area of overlap between VLSM maps in patients suffering from selective attention deficits and foci activated in healthy volunteers when subjects have to select between competing stimuli (Vandenberghe et al., 2005; Molenberghs et al., 2008). The increased competition effect for contralesional targets in NV is in line with transcranial magnetic stimulation studies, which showed that stimulation of the posterior parietal cortex can induce attentional deficits in healthy subjects in the visual field contralateral to the stimulation site under conditions of bilateral simultaneous stimulation (Pascual-Leone et al., 1994; Hung et al., 2005; Koch et al., 2005; Battelli et al., 2009). According to the MNI coordinates, the stimulation site used by Battelli et al. (2009) was centered within the middle segment of the IPS (x=25, y=-64, z=51) and corresponded to NV s lesion site. This IPS segment contains the putative homologue of area LIP, one of the key areas in the spatial attention network in monkeys (Gottlieb et al., 1998; Sereno et al., 2001; Vandenberghe and Gillebert, 2009). NV s lesion extended into the SPL (Fig. 1C,D). Her attentional deficit therefore can be partly due to the role of SPL in spatial shifting (Vandenberghe et al., 2001; Yantis et al., 2002). The SPL extension in NV overlapped with one of the activity foci obtained when in versus cueing trials were contrasted in healthy volunteers (Fig. 6A). Unlike HH in whom the attentional deficit was strictly lateralized to contralesional targets, NV demonstrated a bilateral deficit in spatial shifting, as one would predict from the bilateral activation of SPL in shifting paradigms (Vandenberghe et al., 2001; Yantis et al., 2002; Molenberghs et al., 2007). At day 107, the lesion had significantly diminished and this structural recovery was associated with a normalization of the behavioral parameters (Fig. 4B). We however still observed a relative hyperactivity in the contralesional IPS (Fig. 6C). Increased activity in the contralesional IPS therefore does not appear to be limited to the phase preceding neglect recovery (Corbetta et al., 2005; Corbetta, 2010) but may persist even when the attentional deficits have 23
Cytoarchitectonic mapping of attentional selection and reorienting in parietal cortex
 Cytoarchitectonic mapping of attentional selection and reorienting in parietal cortex Céline R. Gillebert a, Dante Mantini b, Ronald Peeters c, Patrick Dupont a, Rik Vandenberghe a,d a Laboratory for Cognitive
Control of visuo-spatial attention. Emiliano Macaluso
 Control of visuo-spatial attention Emiliano Macaluso CB demo Attention Limited processing resources Overwhelming sensory input cannot be fully processed => SELECTIVE PROCESSING Selection via spatial orienting
Voxel-based Lesion-Symptom Mapping. Céline R. Gillebert
 Voxel-based Lesion-Symptom Mapping Céline R. Gillebert Paul Broca (1861) Mr. Tan no productive speech single repetitive syllable tan Broca s area: speech production Broca s aphasia: problems with fluency,
Breakdown of Functional Connectivity in Frontoparietal Networks Underlies Behavioral Deficits in Spatial Neglect
 Article Breakdown of Functional Connectivity in Frontoparietal Networks Underlies Behavioral Deficits in Spatial Neglect Biyu J. He, 1 Abraham Z. Snyder, 1,2 Justin L. Vincent, 1 Adrian Epstein, 1 Gordon
Attention: Neural Mechanisms and Attentional Control Networks Attention 2
 Attention: Neural Mechanisms and Attentional Control Networks Attention 2 Hillyard(1973) Dichotic Listening Task N1 component enhanced for attended stimuli Supports early selection Effects of Voluntary
Twelve right-handed subjects between the ages of 22 and 30 were recruited from the
 Supplementary Methods Materials & Methods Subjects Twelve right-handed subjects between the ages of 22 and 30 were recruited from the Dartmouth community. All subjects were native speakers of English,
Supplementary Information Methods Subjects The study was comprised of 84 chronic pain patients with either chronic back pain (CBP) or osteoarthritis
 or osteoarthritis") Supplementary Information Methods Subjects The study was comprised of 84 chronic pain patients with either chronic back pain (CBP) or osteoarthritis (OA). All subjects provided informed consent to procedures
Supplementary Information Methods Subjects The study was comprised of 84 chronic pain patients with either chronic back pain (CBP) or osteoarthritis (OA). All subjects provided informed consent to procedures
A possible mechanism for impaired joint attention in autism
 A possible mechanism for impaired joint attention in autism Justin H G Williams Morven McWhirr Gordon D Waiter Cambridge Sept 10 th 2010 Joint attention in autism Declarative and receptive aspects initiating
Attention Response Functions: Characterizing Brain Areas Using fmri Activation during Parametric Variations of Attentional Load
 Attention Response Functions: Characterizing Brain Areas Using fmri Activation during Parametric Variations of Attentional Load Intro Examine attention response functions Compare an attention-demanding
Supporting Online Material for
 www.sciencemag.org/cgi/content/full/324/5927/646/dc1 Supporting Online Material for Self-Control in Decision-Making Involves Modulation of the vmpfc Valuation System Todd A. Hare,* Colin F. Camerer, Antonio
Functional topography of a distributed neural system for spatial and nonspatial information maintenance in working memory
 Neuropsychologia 41 (2003) 341 356 Functional topography of a distributed neural system for spatial and nonspatial information maintenance in working memory Joseph B. Sala a,, Pia Rämä a,c,d, Susan M.
Classification and Statistical Analysis of Auditory FMRI Data Using Linear Discriminative Analysis and Quadratic Discriminative Analysis
 International Journal of Innovative Research in Computer Science & Technology (IJIRCST) ISSN: 2347-5552, Volume-2, Issue-6, November-2014 Classification and Statistical Analysis of Auditory FMRI Data Using
Comparing event-related and epoch analysis in blocked design fmri
 Available online at www.sciencedirect.com R NeuroImage 18 (2003) 806 810 www.elsevier.com/locate/ynimg Technical Note Comparing event-related and epoch analysis in blocked design fmri Andrea Mechelli,
WHAT DOES THE BRAIN TELL US ABOUT TRUST AND DISTRUST? EVIDENCE FROM A FUNCTIONAL NEUROIMAGING STUDY 1
 SPECIAL ISSUE WHAT DOES THE BRAIN TE US ABOUT AND DIS? EVIDENCE FROM A FUNCTIONAL NEUROIMAGING STUDY 1 By: Angelika Dimoka Fox School of Business Temple University 1801 Liacouras Walk Philadelphia, PA
Interaction of Stimulus-Driven Reorienting and Expectation in Ventral and Dorsal Frontoparietal and Basal Ganglia- Cortical Networks
 4392 The Journal of Neuroscience, April 8, 2009 29(14):4392 4407 Behavioral/Systems/Cognitive Interaction of Stimulus-Driven Reorienting and Expectation in Ventral and Dorsal Frontoparietal and Basal Ganglia-
Human Paleoneurology and the Evolution of the Parietal Cortex
 PARIETAL LOBE The Parietal Lobes develop at about the age of 5 years. They function to give the individual perspective and to help them understand space, touch, and volume. The location of the parietal
Attentional Control 1. Identifying the neural systems of top-down attentional control: A meta-analytic approach
 Attentional Control 1 Identifying the neural systems of top-down attentional control: A meta-analytic approach Barry Giesbrecht & George R. Mangun Center for Mind & Brain University of California, Davis
Retinotopy & Phase Mapping
 Retinotopy & Phase Mapping Fani Deligianni B. A. Wandell, et al. Visual Field Maps in Human Cortex, Neuron, 56(2):366-383, 2007 Retinotopy Visual Cortex organised in visual field maps: Nearby neurons have
Selective bias in temporal bisection task by number exposition
 Selective bias in temporal bisection task by number exposition Carmelo M. Vicario¹ ¹ Dipartimento di Psicologia, Università Roma la Sapienza, via dei Marsi 78, Roma, Italy Key words: number- time- spatial
Neural mechanisms of top-down control during spatial and feature attention
 NeuroImage 19 (2003) 496 512 www.elsevier.com/locate/ynimg Neural mechanisms of top-down control during spatial and feature attention B. Giesbrecht, a, * M.G. Woldorff, a,b A.W. Song, a,c and G.R. Mangun
Made you look! Consciously perceived, irrelevant instructional cues can hijack the. attentional network
 Made you look! Consciously perceived, irrelevant instructional cues can hijack the attentional network Katherine Sledge Moore, Clare B. Porter, and Daniel H. Weissman Department of Psychology, University
Procedia - Social and Behavioral Sciences 159 ( 2014 ) WCPCG 2014
 WCPCG 2014") Available online at www.sciencedirect.com ScienceDirect Procedia - Social and Behavioral Sciences 159 ( 2014 ) 743 748 WCPCG 2014 Differences in Visuospatial Cognition Performance and Regional Brain Activation
Available online at www.sciencedirect.com ScienceDirect Procedia - Social and Behavioral Sciences 159 ( 2014 ) 743 748 WCPCG 2014 Differences in Visuospatial Cognition Performance and Regional Brain Activation
doi: /brain/awn350 Brain 2009: 132; Role of right posterior parietal cortex in maintaining attention to spatial locations over time
 doi:10.1093/brain/awn350 Brain 2009: 132; 645 660 645 BRAIN A JOURNAL OF NEUROLOGY Role of right posterior parietal cortex in maintaining attention to spatial locations over time Paresh Malhotra, 1,2 Elizabeth
Supplementary information Detailed Materials and Methods
 Supplementary information Detailed Materials and Methods Subjects The experiment included twelve subjects: ten sighted subjects and two blind. Five of the ten sighted subjects were expert users of a visual-to-auditory
NeuroImage 70 (2013) Contents lists available at SciVerse ScienceDirect. NeuroImage. journal homepage:
 Contents lists available at SciVerse ScienceDirect. NeuroImage. journal homepage:") NeuroImage 70 (2013) 37 47 Contents lists available at SciVerse ScienceDirect NeuroImage journal homepage: www.elsevier.com/locate/ynimg The distributed representation of random and meaningful object pairs
NeuroImage 70 (2013) 37 47 Contents lists available at SciVerse ScienceDirect NeuroImage journal homepage: www.elsevier.com/locate/ynimg The distributed representation of random and meaningful object pairs
Supplementary Information
 Supplementary Information The neural correlates of subjective value during intertemporal choice Joseph W. Kable and Paul W. Glimcher a 10 0 b 10 0 10 1 10 1 Discount rate k 10 2 Discount rate k 10 2 10
Topic 11 - Parietal Association Cortex. 1. Sensory-to-motor transformations. 2. Activity in parietal association cortex and the effects of damage
 Topic 11 - Parietal Association Cortex 1. Sensory-to-motor transformations 2. Activity in parietal association cortex and the effects of damage Sensory to Motor Transformation Sensory information (visual,
Table 1. Summary of PET and fmri Methods. What is imaged PET fmri BOLD (T2*) Regional brain activation. Blood flow ( 15 O) Arterial spin tagging (AST)
 Regional brain activation. Blood flow ( 15 O) Arterial spin tagging (AST)") Table 1 Summary of PET and fmri Methods What is imaged PET fmri Brain structure Regional brain activation Anatomical connectivity Receptor binding and regional chemical distribution Blood flow ( 15 O)
Table 1 Summary of PET and fmri Methods What is imaged PET fmri Brain structure Regional brain activation Anatomical connectivity Receptor binding and regional chemical distribution Blood flow ( 15 O)
Title:Atypical language organization in temporal lobe epilepsy revealed by a passive semantic paradigm
 Author's response to reviews Title:Atypical language organization in temporal lobe epilepsy revealed by a passive semantic paradigm Authors: Julia Miro (juliamirollado@gmail.com) Pablo Ripollès (pablo.ripolles.vidal@gmail.com)
Top-down and bottom-up attentional guidance: investigating the role of the dorsal and ventral parietal cortices
 Exp Brain Res (2010) 206:197 208 DOI 10.1007/s00221-010-2326-z RESEARCH ARTICLE Top-down and bottom-up attentional guidance: investigating the role of the dorsal and ventral parietal cortices Sarah Shomstein
Common Neural Substrates for Ordinal Representation in Short-Term Memory, Numerical and Alphabetical Cognition
 Common Neural Substrates for Ordinal Representation in Short-Term Memory, Numerical and Alphabetical Cognition Lucie Attout 1 *, Wim Fias 2, Eric Salmon 3, Steve Majerus 1 1 Department of Psychology -
Involvement of both prefrontal and inferior parietal cortex. in dual-task performance
 Involvement of both prefrontal and inferior parietal cortex in dual-task performance Fabienne Collette a,b, Laurence 01ivier b,c, Martial Van der Linden a,d, Steven Laureys b, Guy Delfiore b, André Luxen
FINAL PROGRESS REPORT
 (1) Foreword (optional) (2) Table of Contents (if report is more than 10 pages) (3) List of Appendixes, Illustrations and Tables (if applicable) (4) Statement of the problem studied FINAL PROGRESS REPORT
Supplementary Online Content
 Supplementary Online Content Green SA, Hernandez L, Tottenham N, Krasileva K, Bookheimer SY, Dapretto M. The neurobiology of sensory overresponsivity in youth with autism spectrum disorders. Published
Supplementary Online Content
 Supplementary Online Content Gregg NM, Kim AE, Gurol ME, et al. Incidental cerebral microbleeds and cerebral blood flow in elderly individuals. JAMA Neurol. Published online July 13, 2015. doi:10.1001/jamaneurol.2015.1359.
Investigations in Resting State Connectivity. Overview
 Investigations in Resting State Connectivity Scott FMRI Laboratory Overview Introduction Functional connectivity explorations Dynamic change (motor fatigue) Neurological change (Asperger s Disorder, depression)
Supplementary Online Material Supplementary Table S1 to S5 Supplementary Figure S1 to S4
 Supplementary Online Material Supplementary Table S1 to S5 Supplementary Figure S1 to S4 Table S1: Brain regions involved in the adapted classification learning task Brain Regions x y z Z Anterior Cingulate
Visualization strategies for major white matter tracts identified by diffusion tensor imaging for intraoperative use
 International Congress Series 1281 (2005) 793 797 www.ics-elsevier.com Visualization strategies for major white matter tracts identified by diffusion tensor imaging for intraoperative use Ch. Nimsky a,b,
Supplemental Information
 Current Biology, Volume 22 Supplemental Information The Neural Correlates of Crowding-Induced Changes in Appearance Elaine J. Anderson, Steven C. Dakin, D. Samuel Schwarzkopf, Geraint Rees, and John Greenwood
Resistance to forgetting associated with hippocampus-mediated. reactivation during new learning
 Resistance to Forgetting 1 Resistance to forgetting associated with hippocampus-mediated reactivation during new learning Brice A. Kuhl, Arpeet T. Shah, Sarah DuBrow, & Anthony D. Wagner Resistance to
Brief communication Contralateral visual search deficits following TMS
 501 Journal of Neuropsychology (2008), 2, 501 508 q 2008 The British Psychological Society The British Psychological Society www.bpsjournals.co.uk Brief communication Contralateral visual search deficits
Supplementary Material. Functional connectivity in multiple cortical networks is associated with performance. across cognitive domains in older adults
 Supplementary Material Functional connectivity in multiple cortical networks is associated with performance across cognitive domains in older adults Emily E. Shaw 1,2, Aaron P. Schultz 1,2,3, Reisa A.
Supporting Information
 Supporting Information Lingnau et al. 10.1073/pnas.0902262106 Fig. S1. Material presented during motor act observation (A) and execution (B). Each row shows one of the 8 different motor acts. Columns in
LOST IN SPACE THE FATE OF MEMORY REPRESENTATIONS FOR NON- NEGLECTED STIMULI
 LOST IN SPACE THE FATE OF MEMORY REPRESENTATIONS FOR NON- NEGLECTED STIMULI Susanne Ferber 1 and James Danckert 2 1 Department of Psychology, University of Toronto, Ontario, Canada 2 Department of Psychology,
Dissociation between Dorsal and Ventral Posterior Parietal Cortical Responses to Incidental Changes in Natural Scenes
 Dissociation between Dorsal and Ventral Posterior Parietal Cortical Responses to Incidental Changes in Natural Scenes Lorelei R. Howard 1, Dharshan Kumaran 2, H. Freyja Ólafsdóttir 1, Hugo J. Spiers 1
Experimental Assessment of Infarct Lesion Growth in Mice using Time-Resolved T2* MR Image Sequences
 Experimental Assessment of Infarct Lesion Growth in Mice using Time-Resolved T2* MR Image Sequences Nils Daniel Forkert 1, Dennis Säring 1, Andrea Eisenbeis 2, Frank Leypoldt 3, Jens Fiehler 2, Heinz Handels
The Role of Working Memory in Visual Selective Attention
 Goldsmiths Research Online. The Authors. Originally published: Science vol.291 2 March 2001 1803-1806. http://www.sciencemag.org. 11 October 2000; accepted 17 January 2001 The Role of Working Memory in
FRONTAL LOBE. Central Sulcus. Ascending ramus of the Cingulate Sulcus. Cingulate Sulcus. Lateral Sulcus
 FRONTAL LOBE Central Ascending ramus of the Cingulate Cingulate Lateral Lateral View Medial View Motor execution and higher cognitive functions (e.g., language production, impulse inhibition, reasoning
Supplementary materials for: Executive control processes underlying multi- item working memory
 Supplementary materials for: Executive control processes underlying multi- item working memory Antonio H. Lara & Jonathan D. Wallis Supplementary Figure 1 Supplementary Figure 1. Behavioral measures of
Supplemental Information. Triangulating the Neural, Psychological, and Economic Bases of Guilt Aversion
 Neuron, Volume 70 Supplemental Information Triangulating the Neural, Psychological, and Economic Bases of Guilt Aversion Luke J. Chang, Alec Smith, Martin Dufwenberg, and Alan G. Sanfey Supplemental Information
Effect of Pre-Presentation of a Frontal Face on the Shift of Visual Attention Induced by Averted Gaze
 Psychology, 2014, 5, 451-460 Published Online April 2014 in SciRes. http://www.scirp.org/journal/psych http://dx.doi.org/10.4236/psych.2014.55055 Effect of Pre-Presentation of a Frontal Face on the Shift
NeuroImage: Clinical
 NeuroImage: Clinical 2 (2013) 291 302 Contents lists available at ScienceDirect NeuroImage: Clinical journal homepage: www.elsevier.com/locate/ynicl Common and distinct neural mechanisms of visual and
Functional Magnetic Resonance Imaging with Arterial Spin Labeling: Techniques and Potential Clinical and Research Applications
 pissn 2384-1095 eissn 2384-1109 imri 2017;21:91-96 https://doi.org/10.13104/imri.2017.21.2.91 Functional Magnetic Resonance Imaging with Arterial Spin Labeling: Techniques and Potential Clinical and Research
Effects Of Attention And Perceptual Uncertainty On Cerebellar Activity During Visual Motion Perception
 Effects Of Attention And Perceptual Uncertainty On Cerebellar Activity During Visual Motion Perception Oliver Baumann & Jason Mattingley Queensland Brain Institute The University of Queensland The Queensland
Experimental Design. Thomas Wolbers Space and Aging Laboratory Centre for Cognitive and Neural Systems
 Experimental Design Thomas Wolbers Space and Aging Laboratory Centre for Cognitive and Neural Systems Overview Design of functional neuroimaging studies Categorical designs Factorial designs Parametric
Supplemental Information. Direct Electrical Stimulation in the Human Brain. Disrupts Melody Processing
 Current Biology, Volume 27 Supplemental Information Direct Electrical Stimulation in the Human Brain Disrupts Melody Processing Frank E. Garcea, Benjamin L. Chernoff, Bram Diamond, Wesley Lewis, Maxwell
Behavioral Task Performance
 Zacks 1 Supplementary content for: Functional Reorganization of Spatial Transformations After a Parietal Lesion Jeffrey M. Zacks, PhD *, Pascale Michelon, PhD *, Jean M. Vettel, BA *, and Jeffrey G. Ojemann,
SUPPLEMENT: DYNAMIC FUNCTIONAL CONNECTIVITY IN DEPRESSION. Supplemental Information. Dynamic Resting-State Functional Connectivity in Major Depression
 Supplemental Information Dynamic Resting-State Functional Connectivity in Major Depression Roselinde H. Kaiser, Ph.D., Susan Whitfield-Gabrieli, Ph.D., Daniel G. Dillon, Ph.D., Franziska Goer, B.S., Miranda
Supporting online material. Materials and Methods. We scanned participants in two groups of 12 each. Group 1 was composed largely of
 Placebo effects in fmri Supporting online material 1 Supporting online material Materials and Methods Study 1 Procedure and behavioral data We scanned participants in two groups of 12 each. Group 1 was
fmri and visual brain function Dr. Tessa Dekker UCL Institute of Ophthalmology
 fmri and visual brain function Dr. Tessa Dekker UCL Institute of Ophthalmology 6 th February 2018 Brief history of brain imaging 1895 First human X-ray image 1950 First human PET scan - uses traces of
Topographical functional connectivity patterns exist in the congenitally, prelingually deaf
 Supplementary Material Topographical functional connectivity patterns exist in the congenitally, prelingually deaf Ella Striem-Amit 1*, Jorge Almeida 2,3, Mario Belledonne 1, Quanjing Chen 4, Yuxing Fang
SUPPLEMENTARY INFORMATION
 doi:10.1038/nature11239 Introduction The first Supplementary Figure shows additional regions of fmri activation evoked by the task. The second, sixth, and eighth shows an alternative way of analyzing reaction
Control of Object-based Attention in Human Cortex
 Cerebral Cortex Advance Access published May 27, 2004 Control of Object-based Attention in Human Cortex John T. Serences 1, Jens Schwarzbach 2,3, Susan M. Courtney 1,4,5, Xavier Golay 4,6 and Steven Yantis
Nature Neuroscience doi: /nn Supplementary Figure 1. Characterization of viral injections.
 Supplementary Figure 1 Characterization of viral injections. (a) Dorsal view of a mouse brain (dashed white outline) after receiving a large, unilateral thalamic injection (~100 nl); demonstrating that
Group-Wise FMRI Activation Detection on Corresponding Cortical Landmarks
 Group-Wise FMRI Activation Detection on Corresponding Cortical Landmarks Jinglei Lv 1,2, Dajiang Zhu 2, Xintao Hu 1, Xin Zhang 1,2, Tuo Zhang 1,2, Junwei Han 1, Lei Guo 1,2, and Tianming Liu 2 1 School
Automated detection of abnormal changes in cortical thickness: A tool to help diagnosis in neocortical focal epilepsy
 Automated detection of abnormal changes in cortical thickness: A tool to help diagnosis in neocortical focal epilepsy 1. Introduction Epilepsy is a common neurological disorder, which affects about 1 %
Brain activity related to integrative processes in visual object recognition: bottom-up integration and the modulatory influence of stored knowledge
 Neuropsychologia 40 (2002) 1254 1267 Brain activity related to integrative processes in visual object recognition: bottom-up integration and the modulatory influence of stored knowledge C. Gerlach a,,
Role of the ventral striatum in developing anorexia nervosa
 Role of the ventral striatum in developing anorexia nervosa Anne-Katharina Fladung 1 PhD, Ulrike M. E.Schulze 2 MD, Friederike Schöll 1, Kathrin Bauer 1, Georg Grön 1 PhD 1 University of Ulm, Department
Figure 1. Excerpt of stimulus presentation paradigm for Study I.
 Transition Visual Auditory Tactile Time 14 s Figure 1. Excerpt of stimulus presentation paradigm for Study I. Visual, auditory, and tactile stimuli were presented to sujects simultaneously during imaging.
fmri and visual brain function
 fmri and visual brain function Dr Elaine Anderson (presented by Dr. Tessa Dekker) UCL Institute of Ophthalmology 28 th February 2017, NEUR3001 Brief history of brain imaging 1895 First human X-ray image
Supplementary Online Content
 Supplementary Online Content Hooshmand B, Magialasche F, Kalpouzos G, et al. Association of vitamin B, folate, and sulfur amino acids with brain magnetic resonance imaging measures in older adults: a longitudinal
Auditory fmri correlates of loudness perception for monaural and diotic stimulation
 PROCEEDINGS of the 22 nd International Congress on Acoustics Psychological and Physiological Acoustics (others): Paper ICA2016-435 Auditory fmri correlates of loudness perception for monaural and diotic
Functional MRI Mapping Cognition
 Outline Functional MRI Mapping Cognition Michael A. Yassa, B.A. Division of Psychiatric Neuro-imaging Psychiatry and Behavioral Sciences Johns Hopkins School of Medicine Why fmri? fmri - How it works Research
Distinct Value Signals in Anterior and Posterior Ventromedial Prefrontal Cortex
 Supplementary Information Distinct Value Signals in Anterior and Posterior Ventromedial Prefrontal Cortex David V. Smith 1-3, Benjamin Y. Hayden 1,4, Trong-Kha Truong 2,5, Allen W. Song 2,5, Michael L.
LEFT POSTERIOR PARIETAL CORTEX PARTICIPATES IN BOTH TASK PREPARATION AND EPISODIC RETRIEVAL. Jeffrey S. Phillips. B.A., Villanova University, 1997
 LEFT POSTERIOR PARIETAL CORTEX PARTICIPATES IN BOTH TASK PREPARATION AND EPISODIC RETRIEVAL by Jeffrey S. Phillips B.A., Villanova University, 1997 Submitted to the Graduate Faculty of the School of Arts
Methods to examine brain activity associated with emotional states and traits
 Methods to examine brain activity associated with emotional states and traits Brain electrical activity methods description and explanation of method state effects trait effects Positron emission tomography
Impaired face discrimination in acquired prosopagnosia is associated with abnormal response to individual faces in the right middle fusiform gyrus
 Impaired face discrimination in acquired prosopagnosia is associated with abnormal response to individual faces in the right middle fusiform gyrus Christine Schiltz Bettina Sorger Roberto Caldara Fatima
Structural lesion analysis: applications
 Structural lesion analysis: applications Dagmar Timmann Department of Neurology University of Duisburg-Essen, Germany Human cerebellar lesion conditions 1. Focal cerebellar lesions a. Stroke Pro s: - acute
Neural Population Tuning Links Visual Cortical Anatomy to Human Visual Perception
 Article Neural Population Tuning Links Visual Cortical Anatomy to Human Visual Perception Highlights d Variability in cortical thickness and surface area has opposite functional impacts Authors Chen Song,
Brain tissue and white matter lesion volume analysis in diabetes mellitus type 2
 Brain tissue and white matter lesion volume analysis in diabetes mellitus type 2 C. Jongen J. van der Grond L.J. Kappelle G.J. Biessels M.A. Viergever J.P.W. Pluim On behalf of the Utrecht Diabetic Encephalopathy
Color Discrimination Involves Ventral and Dorsal Stream Visual Areas
 Color Discrimination Involves Ventral and Dorsal Stream Visual Areas Kristl G. Claeys 1,2, Patrick Dupont 3, Luc Cornette 1, Stefan Sunaert 4, Paul Van Hecke 4, Erik De Schutter 2 and Guy A. Orban 1 1
 Peripheral facial paralysis (right side). The patient is asked to close her eyes and to retract their mouth (From Heimer) Hemiplegia of the left side. Note the characteristic position of the arm with
Perceptual Learning of Motion Direction Discrimination with Suppressed and Unsuppressed MT in Humans: An fmri Study
 Perceptual Learning of Motion Direction Discrimination with Suppressed and Unsuppressed MT in Humans: An fmri Study Benjamin Thompson 1 *, Bosco S. Tjan 2, Zili Liu 3 1 Department of Optometry and Vision
Statistical parametric mapping
 350 PRACTICAL NEUROLOGY HOW TO UNDERSTAND IT Statistical parametric mapping Geraint Rees Wellcome Senior Clinical Fellow,Institute of Cognitive Neuroscience & Institute of Neurology, University College
SUPPLEMENTARY METHODS. Subjects and Confederates. We investigated a total of 32 healthy adult volunteers, 16
 SUPPLEMENTARY METHODS Subjects and Confederates. We investigated a total of 32 healthy adult volunteers, 16 women and 16 men. One female had to be excluded from brain data analyses because of strong movement
QUANTIFYING CEREBRAL CONTRIBUTIONS TO PAIN 1
 QUANTIFYING CEREBRAL CONTRIBUTIONS TO PAIN 1 Supplementary Figure 1. Overview of the SIIPS1 development. The development of the SIIPS1 consisted of individual- and group-level analysis steps. 1) Individual-person
Task-specific reorganization of the auditory cortex in deaf humans
 Task-specific reorganization of the auditory cortex in deaf humans Łukasz Bola a,b,1, Maria Zimmermann a,c,1, Piotr Mostowski d, Katarzyna Jednoróg e, Artur Marchewka b, Paweł Rutkowski d, and Marcin Szwed
Selective Attention. Modes of Control. Domains of Selection
 The New Yorker (2/7/5) Selective Attention Perception and awareness are necessarily selective (cell phone while driving): attention gates access to awareness Selective attention is deployed via two modes
Selective Attention. Inattentional blindness [demo] Cocktail party phenomenon William James definition
![Selective Attention. Inattentional blindness [demo] Cocktail party phenomenon William James definition](/thumbs/74/70549966.jpg "Selective Attention. Inattentional blindness [demo] Cocktail party phenomenon William James definition") Selective Attention Inattentional blindness [demo] Cocktail party phenomenon William James definition Everyone knows what attention is. It is the taking possession of the mind, in clear and vivid form,
Selective Attention Inattentional blindness [demo] Cocktail party phenomenon William James definition Everyone knows what attention is. It is the taking possession of the mind, in clear and vivid form,
Title of file for HTML: Peer Review File Description:
 Title of file for HTML: Supplementary Information Description: Supplementary Figure, Supplementary Tables, Supplementary Methods and Supplementary References Title of file for HTML: Peer Review File Description:
Supplementary Online Content
 Supplementary Online Content Redlich R, Opel N, Grotegerd D, et al. Prediction of individual response to electroconvulsive therapy via machine learning on structural magnetic resonance imaging data. JAMA
Cortical Organization. Functionally, cortex is classically divided into 3 general types: 1. Primary cortex:. - receptive field:.
 Cortical Organization Functionally, cortex is classically divided into 3 general types: 1. Primary cortex:. - receptive field:. 2. Secondary cortex: located immediately adjacent to primary cortical areas,
Behavioral and Brain Functions
 Behavioral and Brain Functions BioMed Central Research Cortical and subcortical anatomy of chronic spatial neglect following vascular damage Laetitia Golay 1,2, Armin Schnider 1 and Radek Ptak* 1 Open
Supplemental Material
 1 Supplemental Material Golomb, J.D, and Kanwisher, N. (2012). Higher-level visual cortex represents retinotopic, not spatiotopic, object location. Cerebral Cortex. Contents: - Supplemental Figures S1-S3
The neural mechanisms of topdown
 articles The neural mechanisms of topdown attentional control J. B. Hopfinger 1, M. H. Buonocore and G. R. Mangun 3 1 Center for Neuroscience and Department of Psychology, One Shields Ave.,University of
Attention modulates spatial priority maps in the human occipital, parietal and frontal cortices
 Attention modulates spatial priority maps in the human occipital, parietal and frontal cortices Thomas C Sprague 1 & John T Serences 1,2 Computational theories propose that attention modulates the topographical
Reproducibility of Visual Activation During Checkerboard Stimulation in Functional Magnetic Resonance Imaging at 4 Tesla
 Reproducibility of Visual Activation During Checkerboard Stimulation in Functional Magnetic Resonance Imaging at 4 Tesla Atsushi Miki*, Grant T. Liu*, Sarah A. Englander, Jonathan Raz, Theo G. M. van Erp,
Combining microstimulation and fmri in an awake behaving monkey
 NEAAPM Peter Neurath Symposium Combining microstimulation and fmri in an awake behaving monkey Presented by: Leeland B. Ekstrom April 2006 Advisors: Wim Vanduffel & Bruce Rosen MGH / MIT / HMS Martinos
Nature Neuroscience: doi: /nn Supplementary Figure 1. Task timeline for Solo and Info trials.
 Supplementary Figure 1 Task timeline for Solo and Info trials. Each trial started with a New Round screen. Participants made a series of choices between two gambles, one of which was objectively riskier
fmri Evidence for Modality-Specific Processing of Conceptual Knowledge on Six Modalities
 fmri Evidence for Modality-Specific Processing of Conceptual Knowledge on Six Modalities Simmons, W.K. 1, Pecher, D. 2, Hamann, S.B. 1, Zeelenberg, R. 3, & Barsalou, L.W. 1 1 Emory University, 2 Erasmus