STAT243 LS: Intro to Probability and Statistics Quiz 1, Feb 10, 2017 KEY
|
|
|
- Griselda Wells
- 6 years ago
- Views:
Transcription
1 STAT243 LS: Intro to Probability and Statistics Quiz 1, Feb 10, 2017 KEY This is a 50-min quiz. Students may use a page of note (front and back), and a calculator, but nothing else is allowed. 1. A researcher wants to show the distribution of times it took subjects who smoke to fall asleep. Which graphic would be the best choice? A) bar graph B) time plot C) histogram D) pie chart 2. Which graphic would best display the distribution of the top ten causes of death in the United States? A) bar graph B) time plot C) histogram D) stemplot 3. Clinical trial administrator keeps a database of information on participating subjects. Which of the following variables would be considered as quantitative? A) city B) state C) zip code D) None of the above. 4. Researchers examined a new treatment for advanced ovarian cancer in a mouse model. They created a nanoparticle-based delivery system for a suicide gene therapy to be delivered directly to the tumor cells. The grafted tumors were injected either with the new treatment or with only some buffer solution to serve as a comparison. The following is a dotplot (R calls it a stripchart) for the fold increase in tumor size after two weeks in 10 mice given buffer solution. Find the midpoint. A) 5.5 B) 6.1 C) 6.8 D) 7.0
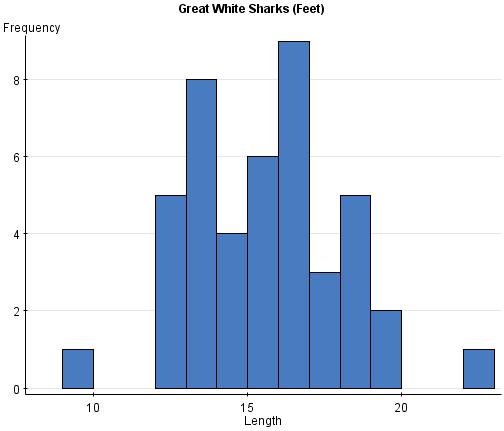
2 Fold Increase 5. Below is a histogram of the lengths, in feet, of 44 Great White Sharks. How many sharks were shorter than or equal to 15 feet? A) 24 B) 18 C) 10 D) 20
3
4 6. The level of various substances in the blood influences our health. The following table displays available information on measurements of the level of phosphate in the blood of a patient, in milligrams of phosphate per deciliter of blood, made on 6 consecutive visits to a clinic. By accident, a value was erased but the sample mean of the 6 measurements is still available, x = 5.4. Compute the x value and sample variance of the 6 values. Hint: Consider the definition of the sample mean. x i x i x (x i x ) = = = -.2 (-.2) 2 = = -.8 (-.8) 2 =.64 x = = -.5 (-.5) 2 = =.3 (.3) 2 = = = 1 Sum = 2.06 x = x x n n = x = x = 32.4, => x = 4.9 s 2 = 2.06/5 =.412 A) (x=4.9, s 2 = 0.412) B) (x=4.9, s 2 = 0.642) C) (x=4.0, s 2 = 0.412) D) (x=4.0, s 2 = 0.912)
5 7 10. The following is a boxplot of the number of seal pubs born in Alaska from 1975 to Pups Born The boxplot shows that at least 25% of the data values are or more. A) B) C) D) 34.62
6 8. The mean value would be A) less than B) greater than but less than C) great than D) none of these is true. 9. The distribution of the number of pups born is A) Symmetric B) Skewed to the left C) Skewed to the right D) Bimodal 10. Interquartile range (IQR) would be A) less than 10 B) between 10 and 15 C) between 20 and 25 D) more than Autism is a disorder of neural development characterized by impaired social interaction and communication, and by restricted and repetitive behavior. About 1 in 1000 children are born with autism. In order to compare children born with autism to those not born with autism, one would use: A) a simple random sample of children. B) a retrospective study. C) a case-control study. D) a cohort study. 12. Five different brands of headache tablets were administered to 25 subjects experiencing fevers of 100 F or more. Then the number of hours of relief were recorded. Neither the subjects nor the people administering the tablets knew who received which brand of tablet. This is an experiment because: A) it used a random sample of subjects. B) it tested medications. C) the researcher controlled who received which brand of tablet. D) it was double-blind.
7 13. In an experiment on a new drug, subjects were randomly assigned to either a placebo or the active drug. In addition, the method of delivery of the drug (pill, skin patch, or nasal mist) was considered. How many factors were there in this experiment? A) 1 B) 2 C) 3 D) One hundred volunteers who suffer from depression are available for a study involving a new drug that is thought to be effective in treating depression. The researchers want to compare the new drug to the drug currently in use. It is believed that men and women may respond differently to the drugs. Which of the following would be the most appropriate design for this experiment? A) a matched pairs design B) a completely randomized design C) a completely randomized block design
M 140 Test 1 A Name SHOW YOUR WORK FOR FULL CREDIT! Problem Max. Points Your Points Total 60
 M 140 Test 1 A Name SHOW YOUR WORK FOR FULL CREDIT! Problem Max. Points Your Points 1-10 10 11 3 12 4 13 3 14 10 15 14 16 10 17 7 18 4 19 4 Total 60 Multiple choice questions (1 point each) For questions
Chapter 1: Exploring Data
 Chapter 1: Exploring Data Key Vocabulary:! individual! variable! frequency table! relative frequency table! distribution! pie chart! bar graph! two-way table! marginal distributions! conditional distributions!
Understandable Statistics
 Understandable Statistics correlated to the Advanced Placement Program Course Description for Statistics Prepared for Alabama CC2 6/2003 2003 Understandable Statistics 2003 correlated to the Advanced Placement
Population. Sample. AP Statistics Notes for Chapter 1 Section 1.0 Making Sense of Data. Statistics: Data Analysis:
 Section 1.0 Making Sense of Data Statistics: Data Analysis: Individuals objects described by a set of data Variable any characteristic of an individual Categorical Variable places an individual into one
2.4.1 STA-O Assessment 2
 2.4.1 STA-O Assessment 2 Work all the problems and determine the correct answers. When you have completed the assessment, open the Assessment 2 activity and input your responses into the online grading
Outline. Practice. Confounding Variables. Discuss. Observational Studies vs Experiments. Observational Studies vs Experiments
 1 2 Outline Finish sampling slides from Tuesday. Study design what do you do with the subjects/units once you select them? (OI Sections 1.4-1.5) Observational studies vs. experiments Descriptive statistics
AP Stats Review for Midterm
 AP Stats Review for Midterm NAME: Format: 10% of final grade. There will be 20 multiple-choice questions and 3 free response questions. The multiple-choice questions will be worth 2 points each and the
Unit 1 Exploring and Understanding Data
 Unit 1 Exploring and Understanding Data Area Principle Bar Chart Boxplot Conditional Distribution Dotplot Empirical Rule Five Number Summary Frequency Distribution Frequency Polygon Histogram Interquartile
V. Gathering and Exploring Data
 V. Gathering and Exploring Data With the language of probability in our vocabulary, we re now ready to talk about sampling and analyzing data. Data Analysis We can divide statistical methods into roughly
CHAPTER 3 Describing Relationships
 CHAPTER 3 Describing Relationships 3.1 Scatterplots and Correlation The Practice of Statistics, 5th Edition Starnes, Tabor, Yates, Moore Bedford Freeman Worth Publishers Reading Quiz 3.1 True/False 1.
AP STATISTICS 2010 SCORING GUIDELINES (Form B)
") AP STATISTICS 2010 SCORING GUIDELINES (Form B) Question 1 Intent of Question The primary goals of this question were to assess students ability to (1) compare three distributions of a quantitative variable;
AP STATISTICS 2010 SCORING GUIDELINES (Form B) Question 1 Intent of Question The primary goals of this question were to assess students ability to (1) compare three distributions of a quantitative variable;
Section I: Multiple Choice Select the best answer for each question.
 Chapter 1 AP Statistics Practice Test (TPS- 4 p78) Section I: Multiple Choice Select the best answer for each question. 1. You record the age, marital status, and earned income of a sample of 1463 women.
q2_2 MULTIPLE CHOICE. Choose the one alternative that best completes the statement or answers the question.
 q2_2 MULTIPLE CHOICE. Choose the one alternative that best completes the statement or answers the question. A sporting goods retailer conducted a customer survey to determine its customers primary reason
PRINTABLE VERSION. Quiz 1. True or False: The amount of rainfall in your state last month is an example of continuous data.
 Question 1 PRINTABLE VERSION Quiz 1 True or False: The amount of rainfall in your state last month is an example of continuous data. a) True b) False Question 2 True or False: The standard deviation is
A) I only B) II only C) III only D) II and III only E) I, II, and III
 I only B) II only C) III only D) II and III only E) I, II, and III") AP Statistics Review Chapters 13, 3, 4 Your Name: Per: MULTIPLE CHOICE. Write the letter corresponding to the best answer. 1.* The Physicians Health Study, a large medical experiment involving 22,000 male
AP Statistics Review Chapters 13, 3, 4 Your Name: Per: MULTIPLE CHOICE. Write the letter corresponding to the best answer. 1.* The Physicians Health Study, a large medical experiment involving 22,000 male
Test 1C AP Statistics Name:
 Test 1C AP Statistics Name: Part 1: Multiple Choice. Circle the letter corresponding to the best answer. 1. At the beginning of the school year, a high-school teacher asks every student in her classes
Chapter 1. Picturing Distributions with Graphs
 Chapter 1 Picturing Distributions with Graphs Statistics Statistics is a science that involves the extraction of information from numerical data obtained during an experiment or from a sample. It involves
Identify two variables. Classify them as explanatory or response and quantitative or explanatory.
 OLI Module 2 - Examining Relationships Objective Summarize and describe the distribution of a categorical variable in context. Generate and interpret several different graphical displays of the distribution
Practice First Midterm Exam
 Practice First Midterm Exam Statistics 200 (Pfenning) This is a closed book exam worth 150 points. You are allowed to use a calculator and a two-sided sheet of notes. There are 9 problems, with point values
Example The median earnings of the 28 male students is the average of the 14th and 15th, or 3+3
 Lecture 3 Nancy Pfenning Stats 1000 We learned last time how to construct a stemplot to display a single quantitative variable. A back-to-back stemplot is a useful display tool when we are interested in
Part 1. For each of the following questions fill-in the blanks. Each question is worth 2 points.
 Part 1. For each of the following questions fill-in the blanks. Each question is worth 2 points. 1. The bell-shaped frequency curve is so common that if a population has this shape, the measurements are
Introduction to Statistical Data Analysis I
 Introduction to Statistical Data Analysis I JULY 2011 Afsaneh Yazdani Preface What is Statistics? Preface What is Statistics? Science of: designing studies or experiments, collecting data Summarizing/modeling/analyzing
AP Statistics. Semester One Review Part 1 Chapters 1-5
 AP Statistics Semester One Review Part 1 Chapters 1-5 AP Statistics Topics Describing Data Producing Data Probability Statistical Inference Describing Data Ch 1: Describing Data: Graphically and Numerically
STP226 Brief Class Notes Instructor: Ela Jackiewicz
 CHAPTER 2 Organizing Data Statistics=science of analyzing data. Information collected (data) is gathered in terms of variables (characteristics of a subject that can be assigned a numerical value or nonnumerical
MINUTE TO WIN IT: NAMING THE PRESIDENTS OF THE UNITED STATES
 MINUTE TO WIN IT: NAMING THE PRESIDENTS OF THE UNITED STATES THE PRESIDENTS OF THE UNITED STATES Project: Focus on the Presidents of the United States Objective: See how many Presidents of the United States
Chapter 1: Exploring Data
 Chapter 1: Exploring Data Section 1.1 The Practice of Statistics, 4 th edition - For AP* STARNES, YATES, MOORE Chapter 1 Exploring Data Introduction: Data Analysis: Making Sense of Data 1.1 1.2 Displaying
HW 1 - Bus Stat. Student:
 HW 1 - Bus Stat Student: 1. An identification of police officers by rank would represent a(n) level of measurement. A. Nominative C. Interval D. Ratio 2. A(n) variable is a qualitative variable such that
Class 1. b. Sampling a total of 100 Californians, where individuals are randomly selected from each major ethnic group.
 What you need to know: Class 1 Sampling Study design The goal and importance of sampling methods Bias Sampling frame Volunteer sample Convenience sample Systematic sample Volunteer response Non-response
Section 1.2 Displaying Quantitative Data with Graphs. Dotplots
 Section 1.2 Displaying Quantitative Data with Graphs Dotplots One of the simplest graphs to construct and interpret is a dotplot. Each data value is shown as a dot above its location on a number line.
3. For a $5 lunch with a 55 cent ($0.55) tip, what is the value of the residual?
 tip, what is the value of the residual?") STATISTICS 216, SPRING 2006 Name: EXAM 1; February 21, 2006; 100 points. Instructions: Closed book. Closed notes. Calculator allowed. Double-sided exam. NO CELL PHONES. Multiple Choice (3pts each). Circle
STATISTICS 216, SPRING 2006 Name: EXAM 1; February 21, 2006; 100 points. Instructions: Closed book. Closed notes. Calculator allowed. Double-sided exam. NO CELL PHONES. Multiple Choice (3pts each). Circle
Math 2200 First Mid-Term Exam September 22, 2010
 Math 2200 First Mid-Term Exam September 22, 2010 This exam has 25 questions of 4 points each. All answers have been rounded-off so if your calculated answer differs from the given options slightly, choose
Topic 5 Day 2. Homework #2: Saint John's Wort
 Today's Agenda: 1. Hand back and go over Topic 4 Quizzes 2. Hand back and go over exit slips 3. Correct and collect Activities 5 7, 5 17 & 5 23 4. Activity 5 4 5. Activity 5 8. Activity 5 7. Topic 5 Preliminaries
STOR 155 Section 2 Midterm Exam 1 (9/29/09)
") STOR 155 Section 2 Midterm Exam 1 (9/29/09) Name: PID: Instructions: Both the exam and the bubble sheet will be collected. On the bubble sheet, print your name and ID number, sign the honor pledge, also
STOR 155 Section 2 Midterm Exam 1 (9/29/09) Name: PID: Instructions: Both the exam and the bubble sheet will be collected. On the bubble sheet, print your name and ID number, sign the honor pledge, also
AP Psych - Stat 1 Name Period Date. MULTIPLE CHOICE. Choose the one alternative that best completes the statement or answers the question.
 AP Psych - Stat 1 Name Period Date MULTIPLE CHOICE. Choose the one alternative that best completes the statement or answers the question. 1) In a set of incomes in which most people are in the $15,000
Here are the various choices. All of them are found in the Analyze menu in SPSS, under the sub-menu for Descriptive Statistics :
 Descriptive Statistics in SPSS When first looking at a dataset, it is wise to use descriptive statistics to get some idea of what your data look like. Here is a simple dataset, showing three different
STT 200 Test 1 Green Give your answer in the scantron provided. Each question is worth 2 points.
 STT 200 Test 1 Green Give your answer in the scantron provided. Each question is worth 2 points. For Questions 1 & 2: It is known that the distribution of starting salaries for MSU Education majors has
3: Summary Statistics
 3: Summary Statistics Review Questions 1. List three measures of central location. 2. The two distinct measures of spread are: 3. A study shows a mean of 0.98 and median of 0.56. What does this suggest
Table of Contents. Plots. Essential Statistics for Nursing Research 1/12/2017
 Essential Statistics for Nursing Research Kristen Carlin, MPH Seattle Nursing Research Workshop January 30, 2017 Table of Contents Plots Descriptive statistics Sample size/power Correlations Hypothesis
Summarizing Data. (Ch 1.1, 1.3, , 2.4.3, 2.5)
") 1 Summarizing Data (Ch 1.1, 1.3, 1.10-1.13, 2.4.3, 2.5) Populations and Samples An investigation of some characteristic of a population of interest. Example: You want to study the average GPA of juniors
1 Summarizing Data (Ch 1.1, 1.3, 1.10-1.13, 2.4.3, 2.5) Populations and Samples An investigation of some characteristic of a population of interest. Example: You want to study the average GPA of juniors
DO NOT OPEN THIS BOOKLET UNTIL YOU ARE TOLD TO DO SO
 NATS 1500 Mid-term test A1 Page 1 of 8 Name (PRINT) Student Number Signature Instructions: York University DIVISION OF NATURAL SCIENCE NATS 1500 3.0 Statistics and Reasoning in Modern Society Mid-Term
Biostatistics. Donna Kritz-Silverstein, Ph.D. Professor Department of Family & Preventive Medicine University of California, San Diego
 Biostatistics Donna Kritz-Silverstein, Ph.D. Professor Department of Family & Preventive Medicine University of California, San Diego (858) 534-1818 dsilverstein@ucsd.edu Introduction Overview of statistical
Chapter 11: Designing experiments
 Chapter 11: Designing experiments Objective (1) Learn to distinguish between different kinds of statistical studies. (2) Learn key concepts involved in designing experiments. Concept briefs: Again there
the standard deviation (SD) is a measure of how much dispersion exists from the mean SD = square root (variance)
 is a measure of how much dispersion exists from the mean SD = square root (variance)") Normal distribution The normal distribution is also known as the Gaussian distribution or 'bell-shaped' distribution. It describes the spread of many biological and clinical measurements Properties of
Normal distribution The normal distribution is also known as the Gaussian distribution or 'bell-shaped' distribution. It describes the spread of many biological and clinical measurements Properties of
Medical Statistics 1. Basic Concepts Farhad Pishgar. Defining the data. Alive after 6 months?
 Medical Statistics 1 Basic Concepts Farhad Pishgar Defining the data Population and samples Except when a full census is taken, we collect data on a sample from a much larger group called the population.
Frequency distributions
 Applied Biostatistics distributions Martin Bland Professor of Health Statistics University of York http://www-users.york.ac.uk/~mb55/ Types of data Qualitative data arise when individuals may fall into
(Total 2 marks) Name three conditions which are controlled inside our bodies (3)
 Name three conditions which are controlled inside our bodies (3)") Q1. Name two drugs which may harm the human body. 1.... 2.... (Total 2 marks) Q2. (a) We control many conditions inside our bodies. Name three conditions which are controlled inside our bodies. 1.... 2....
Q1. Name two drugs which may harm the human body. 1.... 2.... (Total 2 marks) Q2. (a) We control many conditions inside our bodies. Name three conditions which are controlled inside our bodies. 1.... 2....
CHAPTER 1 SAMPLING AND DATA
 CHAPTER 1 SAMPLING AND DATA 1 In the first chapter we are introduced to several very important statistical terms and concepts. Warning: Notice that in the previous sentence, there is no mention of formulas
Collecting Data Example: Does aspirin prevent heart attacks?
 Collecting Data In an experiment, the researcher controls or manipulates the environment of the individuals. The intent of most experiments is to study the effect of changes in the explanatory variable
Lesson 9 Presentation and Display of Quantitative Data
 Lesson 9 Presentation and Display of Quantitative Data Learning Objectives All students will identify and present data using appropriate graphs, charts and tables. All students should be able to justify
UNIVERSITY OF TORONTO SCARBOROUGH Department of Computer and Mathematical Sciences Midterm Test February 2016
 UNIVERSITY OF TORONTO SCARBOROUGH Department of Computer and Mathematical Sciences Midterm Test February 2016 STAB22H3 Statistics I, LEC 01 and LEC 02 Duration: 1 hour and 45 minutes Last Name: First Name:
Department of Statistics TEXAS A&M UNIVERSITY STAT 211. Instructor: Keith Hatfield
 Department of Statistics TEXAS A&M UNIVERSITY STAT 211 Instructor: Keith Hatfield 1 Topic 1: Data collection and summarization Populations and samples Frequency distributions Histograms Mean, median, variance
ANOVA in SPSS (Practical)
") ANOVA in SPSS (Practical) Analysis of Variance practical In this practical we will investigate how we model the influence of a categorical predictor on a continuous response. Centre for Multilevel Modelling
ANOVA in SPSS (Practical) Analysis of Variance practical In this practical we will investigate how we model the influence of a categorical predictor on a continuous response. Centre for Multilevel Modelling
AP Psych - Stat 2 Name Period Date. MULTIPLE CHOICE. Choose the one alternative that best completes the statement or answers the question.
 AP Psych - Stat 2 Name Period Date MULTIPLE CHOICE. Choose the one alternative that best completes the statement or answers the question. 1) In a set of incomes in which most people are in the $15,000
*Karle Laska s Sections: There is NO class Thursday or Friday! Have a great Valentine s Day weekend!
 STATISTICS 100 EXAM 1 Spring 2016 PRINT NAME (Last name) (First name) NETID: CIRCLE SECTION: L1 (Laska MWF 12pm) L2 (Laska Tues/Thurs 11am) Write answers in appropriate blanks. When no blanks are provided
Table 1: One Year Net Survival Rates for All Cancers Excluding Non-Melanoma Skin Cancer:
 Task 1: Draw a bar chart of the following data. All the data must be on one graph. The data shows yearly survival rates for all types of cancers combined (except non-melanoma skin cancer). Hint: Each period
STATISTICS & PROBABILITY
 STATISTICS & PROBABILITY LAWRENCE HIGH SCHOOL STATISTICS & PROBABILITY CURRICULUM MAP 2015-2016 Quarter 1 Unit 1 Collecting Data and Drawing Conclusions Unit 2 Summarizing Data Quarter 2 Unit 3 Randomness
WDHS Curriculum Map Probability and Statistics. What is Statistics and how does it relate to you?
 WDHS Curriculum Map Probability and Statistics Time Interval/ Unit 1: Introduction to Statistics 1.1-1.3 2 weeks S-IC-1: Understand statistics as a process for making inferences about population parameters
Still important ideas
 Readings: OpenStax - Chapters 1 11 + 13 & Appendix D & E (online) Plous - Chapters 2, 3, and 4 Chapter 2: Cognitive Dissonance, Chapter 3: Memory and Hindsight Bias, Chapter 4: Context Dependence Still
Lesson 2: Describing the Center of a Distribution
 In previous work with data distributions, you learned how to derive the mean and the median of a data distribution. This lesson builds on your previous work with a center. Exploratory Challenge You will
What you should know before you collect data. BAE 815 (Fall 2017) Dr. Zifei Liu
 Dr. Zifei Liu") What you should know before you collect data BAE 815 (Fall 2017) Dr. Zifei Liu Zifeiliu@ksu.edu Types and levels of study Descriptive statistics Inferential statistics How to choose a statistical test
What you should know before you collect data BAE 815 (Fall 2017) Dr. Zifei Liu Zifeiliu@ksu.edu Types and levels of study Descriptive statistics Inferential statistics How to choose a statistical test
Statistics Success Stories and Cautionary Tales
 Course Goals STATISTICS 8 Professor Jessica Utts http://www.ics.uci.edu/~jutts/8 Help you understand and appreciate how statistics affects your daily life. Teach you tools for understanding statistics
Statistics is the science of collecting, organizing, presenting, analyzing, and interpreting data to assist in making effective decisions
 Readings: OpenStax Textbook - Chapters 1 5 (online) Appendix D & E (online) Plous - Chapters 1, 5, 6, 13 (online) Introductory comments Describe how familiarity with statistical methods can - be associated
Chapter 6. Experiments in the Real World. Chapter 6 1
 Chapter 6 Experiments in the Real World Chapter 6 1 Thought Question 1 Suppose you are interested in determining if drinking a glass of red wine each day helps prevent heartburn. You recruit 40 adults
Probability and Statistics. Chapter 1
 Probability and Statistics Chapter 1 Individuals and Variables Individuals and Variables Individuals are objects described by data. Individuals and Variables Individuals are objects described by data.
STATISTICS 8 CHAPTERS 1 TO 6, SAMPLE MULTIPLE CHOICE QUESTIONS
 STATISTICS 8 CHAPTERS 1 TO 6, SAMPLE MULTIPLE CHOICE QUESTIONS Circle the best answer. This scenario applies to Questions 1 and 2: A study was done to compare the lung capacity of coal miners to the lung
MATH 1040 Skittles Data Project
 Laura Boren MATH 1040 Data Project For our project in MATH 1040 everyone in the class was asked to buy a 2.17 individual sized bag of skittles and count the number of each color of candy in the bag. The
MULTIPLE CHOICE. Choose the one alternative that best completes the statement or answers the question.
 Statistics Final Review Semeter I Name MULTIPLE CHOICE. Choose the one alternative that best completes the statement or answers the question. Provide an appropriate response. 1) The Centers for Disease
Q1. The graph shows the risk of addiction and risk of harm to the body for some drugs.
 Q. The graph shows the risk of addiction and risk of harm to the body for some drugs. (a) (i) Name two legal recreational drugs shown in the graph. () The overall impact of legal drugs on health is much
c. Construct a boxplot for the data. Write a one sentence interpretation of your graph.
 STAT 280 Sample Test Problems Page 1 of 1 1. An English survey of 3000 medical records showed that smokers are more inclined to get depressed than non-smokers. Does this imply that smoking causes depression?
Undertaking statistical analysis of
 Descriptive statistics: Simply telling a story Laura Delaney introduces the principles of descriptive statistical analysis and presents an overview of the various ways in which data can be presented by
MA 151: Using Minitab to Visualize and Explore Data The Low Fat vs. Low Carb Debate
 MA 151: Using Minitab to Visualize and Explore Data The Low Fat vs. Low Carb Debate September 5, 2018 1 Introduction to the Data We will be working with a synthetic data set meant to resemble the weight
Section 1: Exploring Data
 Section 1: Exploring Data The following maps the videos in this section to the Texas Essential Knowledge and Skills for Mathematics TAC 111.47(c). 1.01 Introduction to Statistics 1.02 Statistics and Parameters
STT315 Chapter 2: Methods for Describing Sets of Data - Part 2
 Chapter 2.5 Interpreting Standard Deviation Chebyshev Theorem Empirical Rule Chebyshev Theorem says that for ANY shape of data distribution at least 3/4 of all data fall no farther from the mean than 2
Math 214 REVIEW SHEET EXAM #1 Exam: Wednesday March, 2007
 Math 214 REVIEW SHEET EXAM #1 Exam: Wednesday March, 2007 THOUGHT QUESTIONS: 1. Suppose you are interested in determining if women are safer drivers than men in New York. Can you go to the Dept. of Motor
LOTS of NEW stuff right away 2. The book has calculator commands 3. About 90% of technology by week 5
 1.1 1. LOTS of NEW stuff right away 2. The book has calculator commands 3. About 90% of technology by week 5 1 Three adventurers are in a hot air balloon. Soon, they find themselves lost in a canyon in
Statistical Methods Exam I Review
 Statistical Methods Exam I Review Professor: Dr. Kathleen Suchora SI Leader: Camila M. DISCLAIMER: I have created this review sheet to supplement your studies for your first exam. I am a student here at
Observational studies; descriptive statistics
 Observational studies; descriptive statistics Patrick Breheny August 30 Patrick Breheny University of Iowa Biostatistical Methods I (BIOS 5710) 1 / 38 Observational studies Association versus causation
Experiments. 22S:30/105 Statistical Methods and Computing. Recall: What is the critical difference between an experiment and an observational
 22S:30/105 Statistical Methods and Computing Designing Experiments Lecture 8 February 13, 2015 Kate Cowles 374 SH, 335-0727 kate-cowles@uiowa.edu 1 2 Experiments Recall: What is the critical difference
Creative Commons Attribution-NonCommercial-Share Alike License
 Author: Brenda Gunderson, Ph.D., 05 License: Unless otherwise noted, this material is made available under the terms of the Creative Commons Attribution- NonCommercial-Share Alike 3.0 Unported License:
Gathering. Useful Data. Chapter 3. Copyright 2004 Brooks/Cole, a division of Thomson Learning, Inc.
 Gathering Chapter 3 Useful Data Copyright 2004 Brooks/Cole, a division of Thomson Learning, Inc. Principal Idea: The knowledge of how the data were generated is one of the key ingredients for translating
Statistics is the science of collecting, organizing, presenting, analyzing, and interpreting data to assist in making effective decisions
 Readings: OpenStax Textbook - Chapters 1 5 (online) Appendix D & E (online) Plous - Chapters 1, 5, 6, 13 (online) Introductory comments Describe how familiarity with statistical methods can - be associated
STATISTICS AND RESEARCH DESIGN
 Statistics 1 STATISTICS AND RESEARCH DESIGN These are subjects that are frequently confused. Both subjects often evoke student anxiety and avoidance. To further complicate matters, both areas appear have
M 140 Test 1 A Name (1 point) SHOW YOUR WORK FOR FULL CREDIT! Problem Max. Points Your Points Total 75
 SHOW YOUR WORK FOR FULL CREDIT! Problem Max. Points Your Points Total 75") M 140 est 1 A Name (1 point) SHOW YOUR WORK FOR FULL CREDI! Problem Max. Points Your Points 1-10 10 11 10 12 3 13 4 14 18 15 8 16 7 17 14 otal 75 Multiple choice questions (1 point each) For questions
M 140 est 1 A Name (1 point) SHOW YOUR WORK FOR FULL CREDI! Problem Max. Points Your Points 1-10 10 11 10 12 3 13 4 14 18 15 8 16 7 17 14 otal 75 Multiple choice questions (1 point each) For questions
UF#Stats#Club#STA#2023#Exam#1#Review#Packet# #Fall#2013#
 UF#Stats#Club#STA##Exam##Review#Packet# #Fall## The following data consists of the scores the Gators basketball team scored during the 8 games played in the - season. 84 74 66 58 79 8 7 64 8 6 78 79 77
Statistics and Epidemiology Practice Questions
 1. Which of the following is not considered a measure of central tendency? a. Median b. Range c. Mode d. Average 2. Given the following set of values, what is the median? 4 5 9 3 8 3 7 1 5 3 a. 3 b. 5
NORTH SOUTH UNIVERSITY TUTORIAL 1
 NORTH SOUTH UNIVERSITY TUTORIAL 1 REVIEW FROM BIOSTATISTICS I AHMED HOSSAIN,PhD Data Management and Analysis AHMED HOSSAIN,PhD - Data Management and Analysis 1 DATA TYPES/ MEASUREMENT SCALES Categorical:
MCQ and EMI Self Test
 Common Foundation Programme 2002-3 Research and Critical Skills 8b 26 November 2002 MCQ and EMI Self Test At St. George's we use two types of automatically marked question. We use multiple choice questions
Describe what is meant by a placebo Contrast the double-blind procedure with the single-blind procedure Review the structure for organizing a memo
 Please note the page numbers listed for the Lind book may vary by a page or two depending on which version of the textbook you have. Readings: Lind 1 11 (with emphasis on chapters 10, 11) Please note chapter
How to interpret scientific & statistical graphs
 How to interpret scientific & statistical graphs Theresa A Scott, MS Department of Biostatistics theresa.scott@vanderbilt.edu http://biostat.mc.vanderbilt.edu/theresascott 1 A brief introduction Graphics:
Describe what is meant by a placebo Contrast the double-blind procedure with the single-blind procedure Review the structure for organizing a memo
 Please note the page numbers listed for the Lind book may vary by a page or two depending on which version of the textbook you have. Readings: Lind 1 11 (with emphasis on chapters 5, 6, 7, 8, 9 10 & 11)
Patch adhesion and local tolerability of Transdermal Delivery Systems Requirements according to the new draft EMA Guidelines
 Patch adhesion and local tolerability of Transdermal Delivery Systems Requirements according to the new draft EMA Guidelines Dr. Janet Schriever Federal Institute for Drugs (BfArM), Germany Transdermal
STATISTICS INFORMED DECISIONS USING DATA
 STATISTICS INFORMED DECISIONS USING DATA Fifth Edition Chapter 4 Describing the Relation between Two Variables 4.1 Scatter Diagrams and Correlation Learning Objectives 1. Draw and interpret scatter diagrams
CP Statistics Sem 1 Final Exam Review
 Name: _ Period: ID: A CP Statistics Sem 1 Final Exam Review Multiple Choice Identify the choice that best completes the statement or answers the question. 1. A particularly common question in the study
PubHlth Introductory Biostatistics Practice Test I (Without Unit 3 Questions)
") 1 PubHlth 540 - Introductory Biostatistics Practice Test I (Without Unit 3 Questions) 1. (10 points) In the Honolulu Heart Study, Systolic Blood Pressure was tabulated for 100 Subjects including 37 Smokers
1 PubHlth 540 - Introductory Biostatistics Practice Test I (Without Unit 3 Questions) 1. (10 points) In the Honolulu Heart Study, Systolic Blood Pressure was tabulated for 100 Subjects including 37 Smokers
Math for Liberal Arts MAT 110: Chapter 5 Notes
 Math for Liberal Arts MAT 110: Chapter 5 Notes Statistical Reasoning David J. Gisch Fundamentals of Statistics Two Definitions of Statistics Statistics is the science of collecting, organizing, and interpreting
Lesson 1: Distributions and Their Shapes
 Lesson 1 Name Date Lesson 1: Distributions and Their Shapes 1. Sam said that a typical flight delay for the sixty BigAir flights was approximately one hour. Do you agree? Why or why not? 2. Sam said that
Empirical Rule ( rule) applies ONLY to Normal Distribution (modeled by so called bell curve)
 applies ONLY to Normal Distribution (modeled by so called bell curve)") Chapter 2.5 Interpreting Standard Deviation Chebyshev Theorem Empirical Rule Chebyshev Theorem says that for ANY shape of data distribution at least 3/4 of all data fall no farther from the mean than 2
Chapter 2.5 Interpreting Standard Deviation Chebyshev Theorem Empirical Rule Chebyshev Theorem says that for ANY shape of data distribution at least 3/4 of all data fall no farther from the mean than 2
SPRING GROVE AREA SCHOOL DISTRICT. Course Description. Instructional Strategies, Learning Practices, Activities, and Experiences.
 SPRING GROVE AREA SCHOOL DISTRICT PLANNED COURSE OVERVIEW Course Title: Basic Introductory Statistics Grade Level(s): 11-12 Units of Credit: 1 Classification: Elective Length of Course: 30 cycles Periods
Still important ideas
 Readings: OpenStax - Chapters 1 13 & Appendix D & E (online) Plous Chapters 17 & 18 - Chapter 17: Social Influences - Chapter 18: Group Judgments and Decisions Still important ideas Contrast the measurement
Mathacle. PSet Stats, Concepts In Statistics Level Number Name: Date:
 II. DESIGN OF STUDIES Observational studies and experiments are two types of studies that aim to describe or explain the variation of responses under the hypothesized factors, without or with manipulation.