IMAGING DOSES IN RADIATION THERAPY FROM KILOVOLTAGE CONE-BEAM COMPUTED TOMOGRAPHY
|
|
|
- Paul Randall
- 5 years ago
- Views:
Transcription
1 IMAGING DOSES IN RADIATION THERAPY FROM KILOVOLTAGE CONE-BEAM COMPUTED TOMOGRAPHY By DANIEL ELLIS HYER A DISSERTATION PRESENTED TO THE GRADUATE SCHOOL OF THE UNIVERSITY OF FLORIDA IN PARTIAL FULFILLMENT OF THE REQUIREMENTS FOR THE DEGREE OF DOCTOR OF PHILOSOPHY UNIVERSITY OF FLORIDA
2 2010 Daniel Ellis Hyer 2
3 To my family and loving fiancée Mom, Dad, John and Laura 3
4 ACKNOWLEDGMENTS First and foremost, I would like to thank my research advisor and the chair of my supervisory committee, David Hintenlang, for his advice and guidance during my graduate studies at the University of Florida. As my advisor, David played a large role in defining my research and was always able to offer ideas and suggestions; even at times when nothing seemed to be going right! Without his instruction and most importantly his friendship, my time as a graduate student would not have been nearly as enjoyable. I would also like to thank each of the faculty members serving on my supervisory committee, including Wesley Bolch, Jonathan Li, and Hans van Oostrom. Their input and advice provided me with valuable guidance which helped keep my research focused and moving forward. I would also like to thank Chris Serago and Siyong Kim from Mayo Clinic in Jacksonville for the use of their equipment and working with me after hours to complete organ dose measurements. In addition, I would like to thank the staff in the Department of Nuclear and Radiological Engineering, for their help with everyday questions and concerns. Finally, I would like to extend a special thanks to my family and friends. I would like to give thanks to my mom and dad for instilling in me the work ethic and values I needed to succeed in life. I would like to give thanks to my brother, John, for always believing in me and encouraging me in my academic endeavors. I would also like to give thanks to all of my fellow graduate student colleagues, especially Perry Johnson and Ryan Fisher, for being there when I needed advice or just wanted to hang out. Lastly, I want to thank Laura for her everlasting love, encouragement, and support. 4
5 TABLE OF CONTENTS ACKNOWLEDGMENTS...4 LIST OF TABLES...8 LIST OF FIGURES...9 ABSTRACT...11 CHAPTER 1 INTRODUCTION...13 page Cancer...13 Radiation Therapy...13 Need for Imaging in Radiation Therapy...16 Megavoltage Cone Beam Computed Tomography (MV-CBCT)...17 CT-on-Rails...17 Kilovoltage Cone Beam Computed Tomography (kv-cbct)...18 Current State of Radiation Dosimetry in kv-cbct...20 Objectives of this Research CONSTRUCTION OF A 50 TH PERCENTILE ADULT MALE ANTHROPOMORPHIC PHANTOM...36 Introduction...36 Methods and Materials...38 Materials...38 Soft tissue-equivalent substitute (STES)...39 Lung tissue-equivalent substitute (LTES)...40 Bone tissue-equivalent substitute (BTES)...40 Phantom Construction Methodology...41 Creating soft tissue molds...42 Introduction of soft tissue...43 Introduction of bone tissue...44 Phantom assembly...45 Introduction of lung tissue...45 Results...46 Materials...46 Soft tissue-equivalent substitute...46 Lung tissue-equivalent substitute...46 Bone tissue-equivalent substitute...46 Completed Phantom...46 Discussion...47 Conclusions
6 3 CONSTRUCTION AND CHARACTERIZATION OF A WATER-EQUIVALENT FIBER OPTIC COUPLED DOSIMETER FOR USE AT DIAGNOSTIC ENERGIES...54 Introduction...54 Methods and Materials...56 FOC Dosimetry System...56 PMT Control Program...58 Exposure Measurements...59 Energy Dependence...59 Linearity...60 Reproducibility...60 Dosimeter Response versus Bend Radius...60 Angular Dependence...61 Results...61 Energy Dependence...61 Linearity...62 Reproducibility...62 Dosimeter Response versus Bend Radius...62 Angular Dependence...63 Discussion...63 Conclusions CHARACTERIZATION OF THE FIBER-OPTIC COUPLED DOSIMETER AT MEGAVOLTAGE ENERGIES...74 Introduction...74 Methods and Materials...76 FOC Dosimetry System...76 Dose Measurements...77 Linearity...77 Reproducibility...78 Dose Rate Dependence...78 Field Size Dependence...78 Results...79 Linearity...79 Reproducibility...79 Dose Rate Dependence...79 Field Size Dependence...79 Discussion...80 Conclusion AN ORGAN AND EFFECTIVE DOSE STUDY OF XVI AND OBI CONE-BEAM CT SYSTEMS...89 Introduction...89 Methods and Materials...90 CBCT Systems Evaluated
7 Anthropomorphic Phantom...92 Dosimetry System...93 Calculation of Organ Doses...95 Calculation of Effective Dose...97 Image Quality...98 Results...99 Head Chest Pelvis Discussion Conclusions ESTIMATION OF ORGAN DOSES FROM KILOVOLTAGE CONE-BEAM CT IMAGING USED DURING RADIOTHERAPY PATIENT POSITION VERIFICATION Introduction Methods and Materials CBCT Systems Evaluated Phantom Setup and Dosimetry Cone Beam Dose Index (CBDI) ImPACT Dose Calculation Results Discussion Conclusions CONCLUSION Results of this Work Opportunities for Future Work and Development Anthropomorphic Phantom Development Fiber-optic Coupled (FOC) Dosimetry System CBCT Dosimetry Final Thoughts LIST OF REFERENCES BIOGRAPHICAL SKETCH
8 LIST OF TABLES Table page 1-1 Comparison of CBDI W and RANDO phantom measurements Imaging doses from Elekta XVI and Varian OBI Varian OBI organ doses measured in standard dose mode ICRP 103 organs of interest for the calculation of effective dose and their associated weighting factors Reproducibility of measurements with FOC dosimeter at kv energies Reproducibility of measurements with FOC dosimeter at MV energies Counts from signal and reference fibers as well as output factors normalized to a 10x10 cm field size from a 200 MU irradiation Counts from each optical fiber with no scintillator during a 50 MU irradiation Counts from signal and reference fibers from a 50 MU irradiation after passing through a 400 nm high pass filter Counts from signal and reference fibers from a 50 MU irradiation free in air Nominal technical settings and measured HVLs for each imaging protocol investigated Organs investigated and number of measurement locations Weight fractions of red bone marrow, A i, and endosteum, E i, for various locations of interest of the 50th percentile adult male hybrid phantom Organ and effective doses from the Elekta XVI CBCT system Organ and effective doses from the Varian OBI CBCT system Results of image quality tests for manufacturer installed protocols Empirical ImPACT factors and normalized CBDI values for use with Equation Measured CBDI values (in mgy air ) ± 1σ Measured organ doses, in mgy tissue, taken from Chapter 5, along with organ dose estimates made using the ImPACT CT patient dose calculator, also in mgy tissue Organ dose conversion coefficients for each protocol
9 LIST OF FIGURES Figure page 1-1 Elekta Synergy linac with XVI CBCT system Varian 23iX linac with OBI CBCT system Head and body CTDI phantoms Longitudinal dose profiles across a 26 cm imaging field in a CTDI body phantom TLD measured doses (cgy) within RANDO pelvic phantom using OBI system Completed 50 th percentile hybrid computational phantom Axial image with segmented organs from the hybrid computational phantom A finished bitmap image ready to be imported into the milling software Finished soft tissue mold, ready to be poured with STES material Completed axial slice with a) STES, b) LTES, and c) BTES Torso of completed 50 th percentile physical phantom Completed FOC dosimeter. Scintillating element at left and SMA connector at right Close up of scintillating element end of dosimeter New dosimeter design with reference fiber incorporated into FOC dosimeter assembly FOC dosimetry system schematic Screenshot of PMT control program GUI Energy dependence of FOC dosimeter Energy dependence of FOC dosimeter as a function of depth in soft tissue-equivalent material Dose linearity of FOC dosimeter Response of FOC dosimeter versus the bend radius of the optical fiber Angular dependence of FOC dosimeter to an axial irradiation Angular dependence of FOC dosimeter to a normal-to-axial irradiation
10 4-1 Radiation induced light in a silica optical fiber Dose linearity of FOC dosimeter Response of FOC dosimeter versus dose rate in MU/min Scanning configuration for each imaging protocol used Schematic detailing the components of the dosimetry system Axial slice of the physical phantom with an FOC dosimeter installed in the right kidney for dose measurements Example of reconstructed images of CTP592 resolution phantom Example of reconstructed images of CTP401 low contrast phantom Dose profiles from XVI chest protocol as measured at the center and periphery of a CTDI body phantom
11 Abstract of Dissertation Presented to the Graduate School of the University of Florida in Partial Fulfillment of the Requirements for the Degree of Doctor of Philosophy IMAGING DOSES IN RADIATION THERAPY FROM KILOVOLTAGE CONE-BEAM COMPUTED TOMOGRAPHY Chair: David E. Hintenlang Major: Nuclear Engineering Sciences By Daniel Ellis Hyer May 2010 Advances in radiation treatment delivery, such as intensity modulated radiation therapy (IMRT), have made it possible to deliver large doses of radiation with a high degree of conformity. While highly conformal treatments offers the advantage of sparing surrounding normal tissue, this benefit can only be realized if the patient is accurately positioned during each treatment fraction. The need to accurately position the patient has led to the development and use of gantry mounted kilovoltage cone-beam computed tomography (kv-cbct) systems. These systems are used to acquire high resolution volumetric images of the patient which are then digitally registered with the planning CT dataset to confirm alignment of the patient on the treatment table. While kv-cbct is a very useful tool for aligning the patient prior to treatment, daily use in a high fraction therapy regimen results in a substantial radiation dose. In order to quantify the radiation dose associated with CBCT imaging, an anthropomorphic phantom representing a 50th percentile adult male and a fiber-optic coupled (FOC) dosimetry system were both constructed as part of this dissertation. These tools were then used to directly measure organ doses incurred during clinical protocols for the head, chest, and pelvis. For completeness, the dose delivered from both the X-ray Volumetric Imager (XVI, Elekta Oncology Systems, Crawley, UK) and the 11
12 On-Board Imager (OBI, Varian Medical Systems, Palo Alto, CA) were investigated. While this study provided a direct measure of organ doses for estimating risk to the patient, a practical method for estimating organ doses that could be performed with phantoms and dosimeters currently available at most clinics was also desired. To accomplish this goal, a 100 mm pencil ion chamber was used to measure the cone beam dose index (CBDI) inside standard CT dose index (CTDI) acrylic phantoms. A weighted CBDI (CBDIw), similar to the weighted CT dose index (CTDIw), was then calculated to represent the average dose in the acrylic phantom. By comparing this value to the measured organ doses, organ dose conversion coefficients were developed. These conversion coefficients allow specific organ doses to be estimated quickly and easily using readily available clinical equipment. 12
13 CHAPTER 1 INTRODUCTION Cancer Cancer refers to the group of diseases characterized by uncontrolled proliferation and spread of abnormal cells. 1 This uncontrolled proliferation commonly produces a mass of tissue called a malignant tumor. A malignant tumor may be contrasted with a non-cancerous benign tumor in that a malignancy is not self-limited in its growth, is capable of invading adjacent tissues, and may be capable of spreading to distant tissues (metastasizing), while a benign tumor has none of these properties. 2 If not controlled, the spread of cancerous cells to surrounding tissue or other parts of the body can result in death. In the United States alone, it is expected that nearly 1.5 million people will be diagnosed with cancer in 2009, resulting in approximately 560,000 deaths. 3 This ranks cancer as the second most common cause of death in the United States, exceeded only by heart disease. Once diagnosed, cancer is typically treated by surgery, chemotherapy, hormone therapy, gene therapy, radiation therapy, or a combination of these therapies depending on the specific type, location, and stage of cancer. Radiation therapy, which is of interest for the purpose of this work, will be explored in the following sections. Radiation Therapy In radiation therapy (also called radiotherapy), high-energy ionizing radiation is used to damage the genetic material (DNA) of cancer cells and stop them from growing and dividing. This ultimately helps control the spread of cancer and shrinks the size of tumors. The most common form of radiation therapy is external beam treatment, which typically uses a linear accelerator to produce a beam of x-rays that can be directed at the treatment site. The energy of the x-rays used is on the order of millions of electron volts (MeV), therefore the linear accelerator is said to produce a megavoltage (MV) beam. The MV beam of radiation has several 13
14 favorable characteristics which make it valuable for use in treating tumors. First, MV photons have sufficient energy to painlessly reach deep inside the patient. Second, skin tissue is spared with MV radiation compared to lower energy kilovoltage (kv) radiation used in diagnostic procedures. This is because secondary electrons resulting from interactions with MV photons at the surface of the patient have sufficient energy to travel away from the surface of the patient and deposit their energy at a finite depth in the patient rather than locally at the skin. Radiation therapy can also be administered internally, by placing a small radioactive source within a body cavity in close proximity to the area being treated (intracavitary brachytherapy) or by implanting small radioactive seeds directly into the tissue to be treated (interstitial brachytherapy). Some forms of radiation therapy also include directly injecting a radioactive material into the bloodstream that has been attached to a compound which is preferentially absorbed by the organ to be treated. The remainder of this section focuses on the treatment of cancer using external beam radiotherapy, laying a foundation for future discussion about the details of accurately positioning the patient on the treatment table. After diagnosis of the disease, a decision is typically made by the oncologist regarding which treatment modality(ies) will be used. If external beam radiotherapy is chosen, the first step is to develop a treatment plan. Modern treatment plans are based on computed tomography (CT) simulations, which are volumetric studies of the patient in the treatment position. 4 Before performing the CT simulation, the geometry and extent of the tumor to be treated is determined from previous diagnostic scans used to diagnose the disease. Once determined, the patient is brought in and placed on the CT table where a reference treatment isocenter is selected with the aid of a scout film. At this time, the treatment isocenter is marked on the patient using skin tattoos to aid in future alignment of the patient on the treatment table. Small metal markers are 14
15 also temporarily placed at these reference isocenter positions to serve as reference markers that are visible on the subsequent CT images. A CT scan of the region to be treated is then acquired and transferred to a computer workstation equipped with treatment planning software. At this workstation, organs near the treatment volume which could be at risk for radiation damage, referred to as organs at risk, as well as the gross visible extent of the tumor, referred to as the gross tumor volume (GTV), are localized and contoured. A margin around the GTV is then created based on the type, location, and aggressiveness of the tumor. This additional margin is known as the clinical target volume (CTV) and accounts for microscopic extensions of the disease which cannot be seen on the images but must be treated with radiation the same as the visible tumor. The CTV may include surrounding lymph nodes that have tested positive as well. An additional margin on the order of 1 cm is then drawn around the CTV, known as the planning target volume (PTV). This additional margin accounts for patient set-up uncertainties, machine variations in delivering the radiation, and intra-treatment variations that cause the treatment volume to move such as breathing. 5-7 As a consequence of creating the PTV, there may be some overlap between surrounding organs at risk and the treatment volume; ultimately restricting the dose that can be delivered to the target without causing normal tissue complications. 8, 9 However, if patient setup variations are reduced, then smaller margins can be used to create the PTV, resulting in a smaller treatment volume and potentially lowering the dose to surrounding organs at risk. 10 In an attempt to more accurately and reproducibly align the patient at each treatment session, there has been a recent trend towards the use of traditional imaging modalities in the treatment room, which is the topic of the next section. The final step in treatment planning is to determine the beam geometry and optimize the dose to the PTV using treatment planning software. The finished treatment plan is then exported 15
16 to a treatment console where it can be delivered to the patient. Treatment is typically delivered in discrete sessions, referred to as fractions, on an outpatient basis 5 days a week for several weeks. Fractions are used to exploit the differences in the ability of healthy cells to repair themselves following radiation damage while cancerous cells are not as efficient at repairing damage and subsequently die. 11 Need for Imaging in Radiation Therapy Recent advances in radiation treatment delivery such as 3D conformal radiation therapy (3DCRT) and intensity modulated radiation therapy (IMRT) have made it possible to deliver large doses of radiation to target volumes with a high degree of conformity. This is particularly true for IMRT, where very tight margins around the target volume are possible along with very steep dose gradients outside of the target volume. While a highly conformal treatment offers the advantage of sparing surrounding normal tissue, this benefit can only be realized if the patient is accurately positioned during each treatment fraction Traditionally, this is done in two steps: 1. The patient is aligned to the treatment isocenter using skin tattoos made during the CT simulation and 2. A pair of orthogonal portal images of the patient are taken using the MV treatment beam and an electronic portal imaging device (EPID). 17, 18 These portal images are then compared to digitally reconstructed radiographs (DRRs) from the CT simulation to verify the patient and tumor s position at the time of treatment at a dose of 4-16 cgy per image pair. 19 Unfortunately, the 2-D nature of projection images and the inherently low contrast of MV imaging limit the accuracy of this technique. Because soft tissue targets typically cannot be seen in the MV portal images, bony anatomy is often used as a surrogate landmark for target localization These shortcomings have led to the development of several other imaging modalities to verify patient setup based on soft tissue structures. These alternate imaging modalities are described in the following sections. 16
17 Megavoltage Cone Beam Computed Tomography (MV-CBCT) As discussed above, verification of patient setup prior to treatment typically relies on the comparison of 2-D portal images to DRRs. However, this process does not make full use of the volumetric information available from treatment planning. Because both CT simulation and treatment planning generate and utilize 3-D datasets, the logical next step is to validate the patient s position in 3-D. Megavoltage cone-beam computed tomography (MV-CBCT) utilizes the megavoltage beam and the same EPID employed for portal imaging to acquire a series of low-dose 2D projections, with the patient dose reported to be in the range of 1-10 cgy. 23 These 2D projections are then used to reconstruct 24 a 3D volumetric data set that can be registered with the planning CT to determine if the patient is properly aligned with the machine isocenter. It should also be noted that this procedure is repeated at each treatment fraction, leading to an accumulation of dose on the order of a Gy or more to tissue in the imaging field. A recent clinical study has shown that MV-CBCT images provide adequate quality for the purpose of patient positioning based on implanted metal seeds, bony landmarks, and air cavities. 25 However, the limiting factor of MV images will always be the lack of soft tissue contrast and the ability to register with the planning CT based on soft tissue landmarks. 26 CT-on-Rails The desire to achieve target localization with soft tissue contrast comparable to planning CT images has led to the development of CT-on-rails systems. 27, 28 These systems incorporate a diagnostic CT system into the treatment room that shares the same patient table with the linear accelerator. In a typical configuration, the patient table is rotated 180 o between imaging and treatment. Once the patient is positioned on the table, the CT gantry is mobilized and slides on rails, passing over the patient while scanning (rather than the table moving like in typical diagnostic CT scans). The end result is a diagnostic quality CT image that can be registered with 17
18 the planning CT. The patient table is then rotated 180 o towards the treatment gantry and the appropriate shifts are made to the patient table, as calculated from the image registration, to ensure that the patient is accurately aligned with the treatment isocenter. Imaging doses to the patient are on the order of 1-3 cgy, on par with a typical diagnostic CT exam. 23 While the CTon-rails system provides arguably the best treatment room image quality possible, it is not without its own faults. The complexity, space requirements, and cost of such a system are the most obvious criticisms and have limited its popularity with very few units in use today. 29 Kilovoltage Cone Beam Computed Tomography (kv-cbct) Kilovoltage cone-beam computed tomography (kv-cbct) combines the superior soft tissue contrast of a CT-on-rails system with the convenience of a MV-CBCT system. These systems consist of a kv generator and flat-panel detector mounted to the linac gantry using retractable arms and share a common axis of rotation with the treatment beam. This technology has gained popularity in recent years and two such systems are currently commercially available: the X-ray Volumetric Imager (XVI, Elekta Oncology Systems, Crawley, UK), seen in Figure 1-1, and the On-Board Imager (OBI, Varian Medical Systems, Palo Alto, CA), seen in Figure 1-2. Image acquisition is similar to MV-CBCT, with a number of 2D projections taken as beam rotates around the patient which are later reconstructed into a 3D volumetric data set. As a patient setup tool, a kv-cbct scan is taken after the patient is aligned to the treatment isocenter using the skin tattoos and then digitally registered with the planning CT to verify the patient s position. The use of kv-cbct yields much better image contrast over traditional MV portal images or MV-CBCT, permitting better localization of soft-tissue structures for improved patient setup accuracy. One recent publication has identified a positioning accuracy improvement, when compared to conventional MV portal images, of up to 3 mm for lung cancer patients with the use of kv-cbct. 30 The improved patient setup accuracy at each treatment fraction allows complex 18
19 radiation treatments to be delivered safely and precisely, ultimately leading to improved tumor control and reduced treatment-related toxicity. 31 While the dose from a single kv-cbct is reported to be 1-10 cgy, 23 the repeated daily use for patient setup in a high fraction therapy regimen (~40 fractions) has been projected to lead to a total dose of up to 4 Gy 32 to surrounding tissue. Unfortunately, unlike traditional MV portal images or MV-CBCT, the additional dose from daily kv-cbct image guidance cannot be taken into account using current treatment planning software. 33 This is because the imaging dose from kv-cbct is not radiobiologically equivalent to the MV dose from the treatment beam. 34 A value in the range of 2-4 has been suggested for the relative biological effectiveness (RBE) of kv versus MV radiation with chromosomal damage as the endpoint. 35 Another issue to consider is the volume of tissue irradiated by each modality. The dose from a kv-cbct will be distributed through a much larger volume than a conventional MV portal image due to the increased field of view (FOV). The FOV for CBCT can be up to 52.4 cm in diameter and 26 cm long, 36 while MV portal images are typically limited to 20x20 cm projections. 37 This large FOV results in critical structures and normal tissue well outside of the treatment volume receiving an imaging dose at every fraction. This effect is further magnified by the fact that some organs near the treatment volume typically approach institution or protocol specific dose limits from the treatment beam alone. Therefore, when the extra dose from CBCT imaging is considered, institution or protocol specific organ dose limits, which are put in place to provide a balance between tumor control and normal tissue damage, may be exceeded. This is especially of concern for serial organs such as the spinal cord where the organ can be permanently damaged by an overdose of radiation. Another concern regarding the daily use of kv-cbct imaging for patient positioning is the increased risk of inducing a secondary cancer. According to Publication 60 from the 19
20 International Commission of Radiological Protection (ICRP), the probability of inducing a fatal cancer from a single radiographic exposure is 5x10⁻⁵ per msv. 38 This value is based on a linear no-threshold model of radiation risk and is derived primarily from studies of atomic bomb survivors. A recent study reported that the effective dose from a single chest or pelvis kv-cbct was approximately 23 msv. 39 Using this value along with the risk of inducing a fatal cancer published in ICRP 60, a 35 fraction therapy regimen with daily kv-cbct imaging has been suggested to induce an additional cancer risk of up to 4%. 39 For the reasons discussed above, it is important to quantify organ doses from kv-cbct imaging in radiation therapy. In the following chapters of this dissertation, the tools necessary to perform this task are described and results are presented. However, before presenting this work, it is important to understand the current state of radiation dosimetry in kv-cbct through an extensive literature review, presented in the next section. For simplicity, when the term CBCT is used in the remainder of this dissertation, it will refer to kv-cbct unless otherwise noted. Current State of Radiation Dosimetry in kv-cbct This section begins by presenting a brief history of fan-beam CT dosimetry in order to provide a background for the discussion of the current state of CBCT dosimetry. The standard for determining radiation dose in fan-beam CT is the multiple scan average dose (MSAD). 40 The MSAD represents the average dose along the longitudinal scan axis, as measured in a standardized cylindrical acrylic phantom, which includes the primary beam contribution as well as the dose attributable to scattered radiation emanating from all adjacent slices. The MSAD can be measured directly by taking a large series of axial CT scans of a phantom with a detector remaining in the center of the scan length and summing the dose contribution from each slice. In the early days of CT, the direct measurement of MSAD was very time consuming as multiple axial scans resulted in considerable x-ray tube heating which required additional time to be taken 20
21 between scans for cooling. This led to the development of the computed tomography dose index (CTDI), a nominally equivalent method of estimating MSAD that could be performed with a single axial scan. 41 The equivalence of MSAD and CTDI requires that all contributions from the tails of the radiation dose profile be included in the CTDI dose measurement. The formal definition of CTDI is shown in Equation 1-1, where L is the nominal slice thickness, D(z) is the longitudinal dose profile, and Z is the integration range. Z 2 1 CTDI = D z dz (1-1) L Z 2 For simplicity, the integral of the dose profile is typically measured by taking a single axial slice at the center of a 100 mm long ionization chamber, and this measurement is known as CTDI 100. By definition, CTDI 100 represents the MSAD at the center of a 100 mm scan and underestimates the MSAD for longer scan lengths. This is because the contributions from the tails of the radiation dose profile beyond the 100 mm integration range are not included. In order to reflect the variation of dose deposition at depth, CTDI 100 is measured at both central and peripheral locations within a specialized phantom. The phantoms used for CTDI measurements were standardized by the Food and Drug Administration (FDA) and consist of polymethylmethacrylate (PMMA) cylinders that are 15 cm in length and either 16 or 32 cm in diameter, representing an adult head and body, respectively. 42 In the clinic, these phantoms are typically referred to as head and body CTDI phantoms. The phantoms have five holes along the longitudinal axis in which to place an ionization chamber: one in the center and four other peripheral locations 1 cm from the surface at 0 o, 90 o, 180 o, and 270 o. For clarification, both the head and body CTDI phantoms are shown in Figure 1-3. In an attempt to represent the average dose within the scan plane, the central as well as the average of the peripheral measurements are combined into the weighted CTDI (CTDI w ), as shown below in Equation 1-2. ( ) 21
22 1 2 CTDIw = CTDI100,center + CTDI100,periphery (1-2) 3 3 The advantage of CTDI w is that it provides a single CT dose parameter to compare different imaging protocols and equipment. However, it is important to note that it is not intended to represent the dose to objects substantially different than the CTDI phantom in size, shape, or attenuation or when the 100 mm integration length omits a considerable fraction of the scatter tails. 43 Additionally, it is independent of the length of the scan and therefore does not represent the total energy deposited within the scan volume. Even with these shortfalls, this technique is still routinely employed in diagnostic radiology to provide an easily measured dose metric that can be used to compare different imaging protocols and equipment. Initially, one may think that the methodology discussed above for measuring the MSAD could easily be extended to CBCT as a method of reporting radiation dose. However, this methodology is impractical for measuring radiation dose in CBCT because unlike fan-beam CT, CBCT is not a sequential, slice based technique. This means that there is not a need to consider the contribution of scattered radiation from adjacent slices contributing to the dose, which is what MSAD attempts to do. The measurement logic for CBCT simply reverts back to conventional dosimetry, where the radiation dose can be measured in a single axial rotation without worrying about collecting the entire dose profile to compensate for the contribution of scatter from adjacent slices, assuming a large enough phantom is used to produce scatter at the measurement point. 44 Unfortunately, there is not a widely accepted methodology for performing these dose measurements nor a standardized dose metric such as CTDI for use with CBCT at this time. However, several authors have begun investigating variations of CTDI for CBCT dosimetry as its use in radiation therapy continues to grow. The current state of CBCT dosimetry is reviewed in the remainder of this section. 22
23 The use of a variation of CTDI for dosimetry measurements in CBCT has been explored by Amer et al. 45 In this study, the continued use of a standard 100 mm pencil ionization chamber for CBCT dosimetry measurements is supported due to its widespread availability and because the large longitudinal beam width found in CBCT (up to 26 cm) easily exceeds its dimensions. Because the longitudinal beam width exceeds the pencil chamber dimensions, the author argues that dosimetry measurements made with the pencil chamber will provide a reasonable measure of the average dose across the central 100 mm of the FOV. During dose measurements, Amer et al. also recommends the addition of 15 cm of Plexiglass to each end of a standard CTDI head and body phantom in order to provide extra scatter medium for the primary beam. To differentiate this dose from CTDI, it was given the name of cone beam dose index (CBDI). Similar to CTDI w, CBDI w is calculated by weighting the central and peripheral dose measurements as shown in Equation 1-2. Amer et al. also addresses the fact that the average dose across the central 100 mm of the FOV as measured by the pencil chamber will be less than the maximum dose at the center of the scan plane because the longitudinal dose profile is not completely flat and decreases away from the central axis due to less scattered radiation. To quantify how much the maximum dose is underestimated by using a pencil chamber, the author measures the longitudinal dose profile from an Elekta x-ray volumetric imaging (XVI) system in both central and peripheral locations of a CTDI phantom using a small cm 3 ionization chamber. Figure 1-4 shows the measured longitudinal dose profiles for the CTDI body phantom as well as the calculated weighted dose profile. Assuming symmetry of the dose profile shown in Figure 1-4, CBDI was calculated (instead of measured with an actual 100 mm ionization chamber) from the integration of the weighted dose profile across the central 100 mm of the FOV divided by the theoretical chamber length (100 mm). It was found that the average dose 23
24 across the central 100 mm of the dose profile underestimated the maximum dose by less than 5% for the 26 cm longitudinal beam width shown in Figure 1-4. The author also repeated these measurements without the additional scatter medium at each end of the CTDI body phantom and it was found that the measurements were lower by 31% and 8% at the center and periphery, respectively. This finding demonstrates the significant contribution of scattered radiation from beyond the length of a standard CTDI phantom when dealing with enlarged longitudinal dose profiles found in CBCT. Organ dose measurements were also made using a RANDO (The Phantom Laboratory, Salem, NY) anthropomorphic phantom and thermoluminescent dosimeters (TLDs) for comparison to the measured CBDI w values. Table 1-1 summarizes both the CBDI w values as well as the measurements from the RANDO phantom. As can be seen, the CBDI w values are generally within 30% of the organ doses listed. The biggest advantage of this study was that the methodology and equipment is similar to what is used for CTDI measurements (with the exception of extra scatter medium at the ends of the CTDI phantoms). This means that performing these measurements would be feasible for most clinics as they already have the necessary equipment readily available. Therefore, the development and introduction of the quantity CBDI w provides a useful dose metric for CBCT imaging that can be used to compare different imaging protocols and systems between institutions. A recent study by Song et al. 46 developed another variation of CTDI for dosimetry measurements in CBCT. Instead of using a standard 100 mm pencil chamber for dose measurements, a small 0.6 cm 3 Farmer type ion chamber was chosen. This allows point measurements of the dose to be made rather than an average measurement over the central 100 mm of the FOV. For completeness, both the Elekta XVI and Varian OBI imaging systems were investigated. Similar to the previous study, the dose was measured at both central and peripheral 24
25 locations within cylindrical acrylic phantoms and these doses were weighted as shown in Equation 1-2. To avoid confusion with CTDI w or CBDI w, it was suggested that this dose be called the weighted cone-beam CTDI (CBCTDI w ). It should be noted that the cylindrical acrylic phantoms used in this study were not standard CTDI phantoms as was used in the previous study; instead, they were custom phantoms 25 cm long and either 18 or 30 cm in diameter, representing an adult head and body, respectively. The phantoms also had only two axial holes in which to place an ionization chamber, one at the center and one at the periphery 2 cm from the surface. One concern with this phantom is that it may not be long enough to provide enough scatter medium for the primary beam and therefore the dose at the central scan plane may be underestimated. As previously mentioned, the Elekta XVI can have a nominal beam width of up to 26 cm, exceeding the length of the 25 cm acrylic phantom used in this study. Even so, dose measurements were made in the phantoms for all clinically relevant imaging procedures and a comparison between the two CBCT systems was made. Table 1-2 summarizes the measured doses for each system with manufacturer installed protocols. From Table 1-2, it is clear that the doses measured from the manufacturer installed OBI protocols tend to be higher than XVI protocols for scanning similar body parts. The first reason for this is rather obvious: the OBI unit uses a single setting for both head and body scanning procedures which has a higher kv and mas than any of the XVI settings. The author also observed that the XVI had a greater half-value layer (HVL) than the OBI system at the same tube settings, suggesting that the beam from the XVI unit has greater filtration than the OBI unit. The lower HVL of the OBI system would be expected to result in an increased dose, even for similar mas. Unfortunately, doses within an anthropomorphic phantom were not done in this study for comparison to the measured CBCTDI w values. 25
26 While the studies presented above investigated methods of adapting CTDI type measurements to CBCT, other authors have completely abandoned this idea in lieu of dose measurements performed exclusively in realistic anthropomorphic phantoms. These authors argue that dose measurements performed in CTDI phantoms should be taken with great caution to represent patient dose as humans are substantially different in size, shape, and attenuation from the acrylic phantoms used in these studies. Therefore, the use of realistic anthropomorphic phantoms is suggested to directly measure dose metrics that relate to patient risk such as organ dose. Wen et al. 32 recently investigated doses delivered by the Varian OBI system to prostate cancer patients receiving pelvic scans for treatment positioning using a RANDO anthropomorphic phantom of the pelvis along with TLDs. The RANDO phantom is commercially available and was originally developed for therapeutic applications at MV energies. One limitation of this phantom is that it is constructed in 2.5 cm thick axial slices allowing limited options for dosimeter placement when performing organ dose measurements. The study performed by Wen et al., however, was not a thorough organ dose study, but simply a study of the dose distribution from CBCT as measured in a realistic anthropomorphic phantom. The measured doses within the phantom from a half-fan scan using the half bow-tie filter with technical settings of 125 kv and 1320 mas are shown in Figure 1-5. As can be seen in Figure 1-5, tissue and bone doses on the left side of the patient were higher than on the right side. The reason for this asymmetry is twofold: (1) there is a 10 degree rotation overlap on the left lateral side between the start and stop positions of the scan and (2) gantry rotational speed slows near the end of the scan (on the left lateral side) but the dose rate stays constant. For a typical external beam prostate treatment of 42 fractions, the total dose to the left femoral head from daily 26
27 imaging could exceed 4 Gy. The author states that even after adding this dose to the femoral dose received from the treatment beam (approximately 34 Gy) at their institution, it is still below their institutional limit of 50 Gy. The institutional limit also states that the volume of either femoral head receiving 50 Gy should be kept below 10% which is also not exceeded by the addition of the imaging dose. The most comprehensive CBCT organ dose study found in the literature today was recently published by Kan et al. 39 Organ dose measurements were performed using a RANDO female anthropomorphic phantom, with a minimum of two TLDs placed in each organ in order to determine average organ doses. All measurements were performed only for the Varian OBI system. Most of the 26 organs selected for dose measurements were based on recommendations by the International Commission on Radiation Protection (ICRP) Publication 60 for use in the determination of effective dose. 38 The organ doses were measured in two different modes, standard and low-dose mode, for three clinically relevant scan sites: head, chest, and pelvis. All CBCT scans were performed using between 650 and 700 projections with the following acquisition settings: 125 kv, 80 ma, 25 ms (standard mode) and 125 kv, 40 ma, 10 ms (lowdose mode) with a 150 cm source to imager distance. It is important to note that, at the time of this study, the manufacturer has recommended low-dose mode for use in quality assurance only. Table 1-3 summarizes the organ doses measured in standard dose mode as well as the effective dose for all three scan sites. The organ doses for low-dose mode are not shown but on average they were reduced by a factor of four to five compared to those measured using standard mode settings. This reduction in organ dose was as expected because the mas for the normal dose mode were a factor of five higher than low-dose mode. As expected, the in-field organs received the highest radiation doses while organs out-of-field received very low doses due to scatter of the 27
28 primary beam. The author also studied the positioning accuracy for both normal dose and lowdose mode and found that there was no difference in positioning accuracy between the two acquisition modes when bony anatomy was used for registration with the planning CT. In summary, a widely accepted methodology for reporting radiation dose from CBCT is not currently available in the literature. The first two studies discussed in this section perform dose measurements in cylindrical acrylic phantoms and introduced two similar competing quantities, CBDI and CBCTDI. Unfortunately, neither study makes an attempt to relate these quantities to patient doses of interest such as organ doses. The last two studies discussed perform dose measurements exclusively in anthropomorphic phantoms, but major changes to the factory installed clinical protocols since their publication makes much of the data outdated. Also, no attempt to relate these organ doses to easily measured cylindrical phantom dose measurements was made. Ultimately, it is desired to develop a method to estimate organ doses from a metric such as CBDI that can be easily measured using currently available clinical equipment. Reaching this goal is one of the objectives of this research, as discussed in the next section. Objectives of this Research The main goal of this research was to develop the tools and methods necessary to accurately quantify organ doses incurred by the patient during kilovoltage cone-beam CT imaging used in radiation therapy. To reach this goal, organ doses were first quantified from direct measurement within an anthropomorphic phantom using current manufacturer installed clinical protocols for the two commercially available CBCT systems (Elekta XVI and Varian OBI). The cone-beam dose index (CBDI) was also measured for the same clinical protocols using standard CTDI head and body phantoms along with a 100 mm pencil chamber. A ratio of measured organ doses to the weighted CBDI was then taken in order to develop organ dose conversion coefficients (ODCCs). These conversion coefficients allow organ doses to be 28
29 estimated quickly and easily without the need to repeat the time consuming anthropomorphic phantom organ dose measurements for future changes to the technical settings of scan protocols. In order to complete these tasks in a timely and organized manner, they were broken up into 4 smaller projects, each of which is presented below. 1. The first project was to construct an anthropomorphic phantom for use in organ dose measurements. In order to best represent the human population, the phantom was constructed based on a dataset representing a 50 th percentile adult male, as defined by the International Commission on Radiological Protection (ICRP) Report To accurately represent the dosimetric characteristics of a real human, three different tissue equivalent materials representing bone, lung, and soft tissue were incorporated into the construction process. To aid in dosimeter placement for organ dose measurements, organ locations were transferred onto the axial slices of the physical phantom using a permanent marker from printouts of the segmented dataset. 2. The need for a small dosimeter capable of anthropomorphic phantom absorbed dose measurements prompted the development and characterization of a new water-equivalent fiber optic coupled (FOC) dosimeter. The FOC architecture was chosen due to its small size (0.5 mm length and 2 mm diameter sensitive element) and ability to provide real-time dose information during irradiation. An array of 5 photomultiplier tubes (PMTs) and custom software was also developed to permit the simultaneous readout of multiple dosimeters. The dosimeters were fully characterized at diagnostic energies and offered excellent sensitivity, reproducibility, and dose linearity while exhibiting minimal angular and energy dependence. 3. Organ dose measurements, using the anthropomorphic phantom and FOC dosimetry system discussed above, were performed on the two CBCT systems currently available on medical linear accelerators, namely the X-ray Volumetric Imager (XVI, Elekta Oncology Systems, Crawley, UK) and the On-Board Imager (OBI, Varian Medical Systems, Palo Alto, CA). Organs chosen for investigation in this study were based on recommendations by IRCP report 103 for the calculation of effective dose. 48 For completeness, three different clinically relevant scan sites were investigated which included the head, chest, and pelvis. All scans were performed using current manufacturer installed clinical protocols and appropriate bow-tie filters. The measured organ doses were also used to calculate a reference male effective dose for each procedure. The effective dose is an important parameter because it provides a single value that permits a dosimetric comparison between different radiographic and nuclear medicine procedures. This information is expected to contribute greatly to the medical physics community because current organ dose data for CBCT imaging is very limited. 4. Due to the time consuming nature and requirement for specialized equipment involved with the direct measurement of organ doses, it was desired to develop a method for accurately estimating organ doses using dosimeters and phantoms currently found in most clinics. To accomplish this goal, the cone-beam dose index (CBDI) was measured using 29
30 standard CTDI head and body phantoms and a 100 mm pencil chamber. Organ dose conversion coefficients (ODCCs) were then developed by taking a ratio of previously measured organ doses and the weighted CBDI values measured using the same clinical protocols. These coefficients allow organ doses to be estimated from simple measurements of the weighted CBDI rather than repeating the time consuming anthropomorphic phantom measurements and accommodate future changes to the technical settings of the clinical protocols. The following chapters of this dissertation are dedicated to the discussion of each of these projects in detail. Each chapter corresponds to a particular project outlined above and gives the background, methodology, and results obtained. An extra chapter on the characterization of the FOC dosimeter at MV energies has also been included as an extension of the work outlined in the second specific aim. 30
31 31 Table 1-1. Comparison of CBDI W and RANDO phantom measurements (Adapted from: A. Amer, T. Marchant, J. Sykes, J. Czajka and C. Moore, "Imaging doses from the Elekta Synergy X-ray cone beam CT system," Br J Radiol 80, (2007), Tables 1 and 3, p. 479 and 480). Site Beam settings Collimator Phantom dimensions CBDI W Rando Position kv mas Diam [cm] Length [cm] [mgy] [mgy] 1.3 Suface (Ant) Head S Surface (Lat) 1.3 Eye lens 10 Suface (Ant) Lung S Surface (Lat) 7.2 Heart 34 Suface (Ant) Pelvis S Surface (Lat) 21 Uterus Table 1-2. Imaging doses from Elekta XVI and Varian OBI (Adapted from: W. Y. Song, S. Kamath, S. Ozawa, S. A. Ani, A. Chvetsov, N. Bhandare, J. R. Palta, C. Liu and J. G. Li, "A dose comparison study between XVI and OBI CBCT systems," Med Phys 35, (2008), Tables 2 and 3, p. 482). XVI OBI Protocol Beam settings Collimator Phantom dimensions CBCTDI W kv mas Diam [cm] Length [cm] [mgy] Head and neck S Prostate M Pelvis M Chest L Full-fan Full bow-tie Half-fan Half bow-tie
32 Table 1-3. Varian OBI organ doses measured in standard dose mode (Adapted from: M. W. Kan, L. H. Leung, W. Wong and N. Lam, "Radiation dose from cone beam computed tomography for image-guided radiation therapy," Int J Radiat Oncol Biol Phys 70, (2008), Table 4, p. 275). Mean absorbed dose (cgy) Tissue/organ Head scan Chest scan Pelvis scan Gonads (ovary) 0.02 ± ± ± 0.31 Bone marrow (whole body) 0.8 ± ± ± 2.06 Bone marrow (irradiated site) 5.89 ± ± ± 0.33 Colon 0.05 ± ± ± 0.18 Lung 0.57 ± ± ± 0.02 Stomach 0.07 ± ± ± 0.12 Bladder 0.02 ± ± ± 0.82 Breast 0.21 ± ± ± 0.04 Liver 0.07 ± ± ± 0.14 Esophagus 3.81 ± ± ± 0.04 Thyroid 11.1 ± ± ± 0.01 Skin (whole body) 0.92 ± ± ± 2.67 Skin (irradiated site) 6.66 ± ± ± 1.37 Bone surface 0.8 ± ± ± 2.06 Remainder organ Adrenals 0.05 ± ± ± 0.07 Brain 4.8 ± ± ± 0.01 Upper large intestine 0.05 ± ± ± 0.06 Small intestine 0.04 ± ± ± 0.29 Kidney 0.05 ± ± ± 0.13 Muscle 0.08 ± ± ± 2.06 Pancreas 0.04 ± ± ± 0.12 Spleen 0.06 ± ± ± 0.04 Thymus 11.1 ± ± ± 0.01 Uterus 0.02 ± ± ± 0.27 Other critical organ Rectum 0.02 ± ± ± 0.27 Lens 6.22 ± ± ± 0.02 Heart 0.2 ± ± ± 0.03 Spinal cord 4.08 ± ± ± 0.06 Effective dose (msv) 10.3 ± ± ±


33 Figure 1-1. Elekta Synergy linac with XVI CBCT system. XVI imaging system is shown in the horizontal plane with imaging detector at left and kv x-ray tube at right. Figure 1-2. Varian 23iX linac with OBI CBCT system. OBI imaging system is shown in the horizontal plane with x-ray tube at left and imaging detector at right. 33
, Figure 3, p.")
34 Figure 1-3. Head and body CTDI phantoms Figure 1-4. Longitudinal dose profiles across a 26 cm imaging field in a CTDI body phantom (Used with permission from: A. Amer, T. Marchant, J. Sykes, J. Czajka and C. Moore, "Imaging doses from the Elekta Synergy X-ray cone beam CT system," Br J Radiol 80, (2007), Figure 3, p. 479). 34
, Figure 3, p.")
35 Figure 1-5. TLD measured doses (cgy) within RANDO pelvic phantom using OBI system (Used with permission from: N. Wen, H. Guan, R. Hammoud, D. Pradhan, T. Nurushev, S. Li and B. Movsas, "Dose delivered from Varian's CBCT to patients receiving IMRT for prostate cancer," Phys Med Biol 52, (2007), Figure 3, p. 2272) 35
36 CHAPTER 2 CONSTRUCTION OF A 50 TH PERCENTILE ADULT MALE ANTHROPOMORPHIC PHANTOM Introduction Anthropomorphic phantoms constructed from tissue-equivalent materials have historically been used to provide a physical representation of the body s anatomy and attenuation characteristics for radiation dosimetry studies. Of particular interest for this study is the use of anthropomorphic phantoms for quantifying organ doses during CBCT imaging in radiation therapy; similar to previous studies performed by other authors in computed tomography (CT) and pediatric radiology. 39, 49, 50 Performing organ dose measurements in physical phantoms offers a distinct advantage over computational methods because knowledge of the exact photon energy spectrum or irradiation geometry is not required. This is especially useful considering the increasing use of proprietary equipment and scanning techniques that are difficult to model such as bow-tie filters, automatic tube-current modulation in CT, and automatic exposure control (AEC) in fluoroscopy. Currently, the majority of organ dose studies in diagnostic imaging utilize commercially available anthropomorphic phantoms such as RANDO (The Phantom Laboratory, Salem, NY) or ATOM phantoms (Computerized Imaging Reference Systems, Inc, Norfolk, VA). In order to provide an accurate representation of the human anatomy, these commercially available phantoms typically use three tissue equivalent materials imitating bone, lung, and soft tissue. To allow access to organ locations for the placement of dosimeters, the RANDO and ATOM phantoms are assembled in axial slices 2.5 cm thick. Unfortunately, the widespread clinical use of these phantoms has been limited by their prohibitive costs. To overcome this limitation, the methodology required to construct an inexpensive anthropomorphic phantom (as compared to commercially available phantoms) using readily available materials was recently developed at the University of Florida. 51 Expanding upon 36
37 methods originally published by White et al., 52, 53 and later improved upon by Jones et al., 54 the phantom was constructed using three tissue-equivalent materials: soft tissue-equivalent substitute (STES), lung tissue-equivalent substitute (LTES), and bone tissue-equivalent substitute (BTES). BTES is based on an epoxy resin which forms a hard plastic, as previously described by Jones et al. 54 STES and LTES are based on a new urethane mixture which forms a pliable compound as described by Fisher. 55 The urethane compound was chosen for ease in phantom construction, improved phantom durability, and easier accommodation of fiber optic coupled (FOC) dosimeters which will be discussed in later chapters. The anthropomorphic phantom constructed for this study was unique in several aspects. First, it was based on a hybrid computational model representing a 50 th percentile adult male. 56 In this context, hybrid refers to a cross between stylized and tomographic phantoms, exploiting the advantages of each. A hybrid phantom offers the scalability of a stylized phantom while maintaining the anthropomorphic characteristics of a tomographic phantom. The hybrid model originated from a tomographic dataset of a 36 year old Korean male (176 cm height, 73 kg weight). Using methods previously described by Lee et al. 57, 58, the tomographic dataset was imported into Rhinoceros computer software (McNeel North America, Seattle, WA) and transformed into non-uniform rational B-spline (NURBS) surfaces that could easily be manipulated. Modifications to the original dataset were done to match the anthropometric dimensions and organ masses of a 50 th percentile adult male as defined by the International Commission on Radiological Protection (ICRP) Report 89 reference data. 47 The completed 50 th percentile adult male hybrid computational phantom is shown in Figure 2-1. In order to construct the physical phantom from this data set, the hybrid computational phantom was first voxelized at a 2x2x5 mm resolution. The voxelized dataset was then imported into ImageJ computer software 37
38 (Version 1.34s, National Institute of Health, Bethesda, MD) and converted into 5 mm thick axial images. These axial images were then used as the blueprint from which to construct the physical phantom. The direct link between the computational and physical phantoms is one of the key advantages of this series; allowing the physical phantom to serve as an experimental validation for Monte Carlo codes. Additionally, the computational phantom can be used to determine pointto-organ dose scaling factors, allowing the calculation of average organ doses from simple point dose measurements made in the physical phantom. 59 In order to allow a greater variety of choices for dosimeter placement when performing internal dose measurements, the physical phantom was constructed and assembled in axial slices 5 mm thick. While the full-body data set includes 353 axial slices of this thickness, the lack of radiosensitive organs in the legs justified their exclusion from fabrication. As such, the physical phantom includes 193 axial slices, ranging from the crown of the head to mid-thigh. All internal organs in the phantom are modeled as soft tissue and therefore dosimeter placement for organ dose measurements is based solely on position of the segmented organs in the computational hybrid phantom. To aid in dosimeter placement, organ locations have been transferred onto each slice from full-scale axial printouts of the computational hybrid data set. Methods and Materials Materials The tissue-equivalent substitutes used for this undertaking were developed with two goals in mind: 1. Similar physical properties to human tissue, such as density and attenuation coefficients, and 2. Ease of integration into the phantom manufacturing process. To meet these goals, a new urethane based STES and LTES were developed by Fisher. 55 The newly developed tissue-equivalent materials were evaluated by measuring the material density and attenuation properties. The attenuation coefficient of the STES was evaluated by 38
39 measuring the attenuation from multiple thicknesses of material using a narrow beam geometry generated by clinical radiographic unit. Additionally the Hounsfield Unit (HU) values were measured in the completed phantom using a Siemens Somatom Sensation 16-slice CT scanner operated at a tube voltage of 120 kvp and employing an ma modulated exposure control. The average HU was determined from the selected regions of interest (ROI) using areas of approximately 10 cm 2. Density measurements of each sample were then taken utilizing Archimedes s principle. A cured sample of each material was weighed on a scale with gram precision to find the dry mass, m dry, of each sample. The samples were then weighed submerged in a beaker of de-ionized water to find the wet mass, m wet, of each sample. Using both these measurements, as well as the known density of the de-ionized water, ρ HO, the density of each sample was calculated using 2 Equation 2-1. ρ m dry sample= mdry mwet ρ HO 2 (2-1) Soft tissue-equivalent substitute (STES) The new urethane based STES was designed to match the x-ray attenuation and density of human soft tissue within the diagnostic energy range ( kvp). Specifically, the STES was designed to have a density similar to that of human soft tissue (1.04 g/cm 3 ) and to achieve a 55, 60 target x-ray attenuation coefficient based on the ICRU-44 reference soft tissue composition. The commercially available, two-part urethane rubber compound PMC 121/30 Dry, (Smooth- On, Easton, PA), was combined with 2.8% by weight of powdered CaCO 3 (Fisher Scientific, Hanover Park, IL) to achieve these design goals. The calcium carbonate was added to the two parts of urethane and mixed with an electric mixer, with care being taken to ensure a 39
40 homogeneous mixture with no undissolved CaCO 3. The durable, readily available urethane based compound was found to be easy to work with and did not suffer from phase separation problems frequently encountered with epoxy resin based STES. An additional advantage of the urethane based STES is the material s flexibility, which allows it to be easily removed from molds after curing. Adipose tissue was not specifically modeled in the construction of the physical or computational phantoms. The distribution of subcutaneous as well as intra-abdominal adipose tissue was initially determined to be too complicated to directly model with a specific tissue equivalent material. Thus, the STES was developed to be a homogeneous soft tissue analog that comprises skeletal muscle as well as organs, connective tissue and adipose tissue. Lung tissue-equivalent substitute (LTES) A new LTES was designed by combining uncured urethane based STES, prepared as described above, along with poly-fil polystyrene micro beads (Fairfield Processing, Danbury, CT) in a 10:1 ratio by weight. This LTES is very uniform and permits the fabrication of a range of tissue densities spanning those representative of various levels of inspiration. Since it does not rely on a tissue surfactant and foaming agent, the LTES is more uniform and reproducible than the method proposed by White et al. 61 While the density of lung tissue can vary widely depending on the level of inspiration, patients undergoing diagnostic procedures are typically asked to hold their breath during the exposure. Therefore, a value of 0.33 g/cm 3 was chosen for the LTES, representing the density of a fully inspired lung. 60 Bone tissue-equivalent substitute (BTES) The BTES used was the epoxy resin based material previously developed by Jones et al. 54 By mass, the mixture of the BTES is as follows: 36.4% Araldite GY6010 and 14.6% Jeffamine T-403 (Huntsman Corp., Woodlands, TX), as well as 25.5% Silicon Dioxide and 23.5% Calcium 40
41 Carbonate (Fisher Scientific, Hanover Park, IL). It was designed to represent a homogenous mixture of cortical and trabecular spongiosa (bone trabeculae and bone marrow). The BTES composition was adjusted to match the mass density, mass attenuation coefficients (μ/ρ), and mass energy absorption coefficients (μ en /ρ) for those defined by the Oak Ridge National Laboratory (ORNL) stylized model series 62 within the diagnostic photon energy range. The effective atomic number for the BTES (8.80) is very similar to that of the ORNL reference tissue (8.59), and it was shown that values of μ/ρ and μ en /ρ for BTES had a maximum deviation from ORNL reference values of only a few percent. 54 Phantom Construction Methodology Initially, the methodology described by Jones et al. 63 in the construction of a newborn phantom was to be used in the construction of the adult phantom series. This method involved several steps: preparing epoxy based soft tissue material in a vacuum chamber to eliminate air bubbles, pouring the material into a square mold, milling out the outer slice contour as well as appropriate voids for bone and lung tissue-equivalent material, and finally filling these voids with bone or lung tissue-equivalent material as required. However, the far greater number and size of slices required to construct an adult phantom, as compared to a newborn phantom, required many changes in the original construction methodology if a phantom was to be completed in a timely manner. To speed the construction process, an automatic machining system (VisionPro Version 7, Vision Engraving and Routing Systems, Phoenix AZ) was purchased for the purpose of creating soft tissue molds from axial images of the hybrid computational phantom. An example of an axial image with segmented organs from the hybrid computational phantom is shown in Figure 2-2. Once the phantom construction was initiated, problems were identified and overcome as they arose. The final means of production are detailed below. 41
42 Creating soft tissue molds As previously mentioned, the physical phantom was constructed based on hybrid computational phantom of a 50th percentile adult male. The original tomographic data for this phantom came from a 36 year old Korean adult male (176 cm height, 73 kg weight). The exam was performed as part of a cancer screening protocol using a Siemens Somatom Emotion Duo PET/CT system with a slice resolution of 3mm. All scans were performed at full inspiration with an in-plane matrix size of 512x512 pixels. Organ segmentation was performed manually under supervision of a radiologist. While approximately 100 different tissues were segmented in the computational data set, only the organs needed for the calculation of effective dose (with exception of muscle and lymphatic nodes) were transferred to the physical phantoms. A list of these organs and their tissue weighting factors, as outlined in ICRP 103, 48 is shown in Table 2-1. The first step in constructing the phantom was to convert the axial images from the computational data set into a form that could ultimately be read with the automated machining software. Using ImageJ software (Version 1.34s, National Institute of Health, Bethesda, MD), each segmented axial image was converted into a bitmap representing only soft tissue and voids (bone, lung, air). This was accomplished by segmenting bone, lung, and air to a single pixel value representing voids, while all remaining soft tissues were shaded with another single value representing soft tissue. Registration marks for assisting in phantom assembly and alignment were also added to each bitmap image at anterior and lateral positions. A finished bitmap image showing only soft tissue, voids, and registrations marks is shown in Figure 2-3. Once completed, the finished bitmaps were then imported into the VisionPro software. Each bitmap was adjusted to conform to the 256 value color range in the VisionPro software and vectorized in order to smooth the pixilated edges of the digital images. A speckle filter was used to eliminate tissue islands less than four pixels in area. Once these steps were complete, 42
43 engraving paths for all areas represented by the soft tissue pixel value were then created for each slice. Realizing that smaller diameter end mill bits allow finer details to be cut, a 1/8 diameter bit was selected for body engraving paths while a 1/16 diameter bit was chosen for engraving paths in more detailed regions of the head. The engraving paths were used to mill soft tissue molds in a high density foam, which could then be filled with the soft tissue substitute. Foam blanks were fastened to the engraving table and single-pass engraving paths were set with depths resulting in 5 mm thick soft tissue slices. To create clean edges in each foam mold, a perimeter engraving path was first performed at a slow feed (0.6 per second), outlining the entire perimeter of the area to be cut. This was followed by a much faster rate fill engraving path (3 per second), which removed all foam material within the perimeter engraving path. Molds for each slice could be created in approximately ten minutes using this technique. A finished foam mold is shown in Figure 2-4. After engraving was completed, the molds were checked to ensure that all areas to be filled with STES were connected to aid in future placement. In cases where an area to be filled with STES was surrounded by bone or lung, small grooves were cut in the mold with a razor blade in order to connect the soft tissue island to the main body of the slice. This is similar to a stencil where the center of the letter O must be joined with thin connectors to ensure proper orientation. Finally, the job time for each slice was recorded. The job time and feed rate was used to determine the approximate volume/weight of soft tissue equivalent material needed for each slice. Introduction of soft tissue Depending on how many soft tissue molds were being filled at a time, an appropriate amount of the urethane based STES was mixed and immediately poured into the soft tissue molds. This was done fairly rapidly (less than 30 minutes) as the STES began setting 43
44 immediately. The filled molds were covered with waxed paper and any trapped air pockets were relieved by making small slits in the waxed paper with a razor blade. A straight edge was then passed along the surface of the mold to remove any excess STES and force it out of the mold, allowing the slices to cure at the correct thickness (5 mm). After roughly three hours, the waxed paper was removed from the partially cured soft tissue slices. It is important to remove the waxed paper prior to the STES fully curing; otherwise, the STES would bond to the waxed paper and it could not be easily removed. After 24 hours, the soft tissue slice could be removed from the mold. Introduction of bone tissue The method of introducing bone into the soft tissue slices was analogous to that of Jones et al. 63 First, the bottom of each soft tissue slice was sealed using contact paper to prevent any uncured BTES from running under the slice. Any soft tissue island connectors were then removed using a razor blade. An appropriate amount of BTES was mixed to fill the voids in the soft tissue slices that were left for bone tissue. A heat gun was used to warm the BTES material in order to reduce its viscosity and make it easier to mix and pour. The BTES material was then placed in a pastry bag including a pastry tip (#12) and forced into the appropriate voids in the soft tissue slices, taking care to avoid creating any air pockets during the pouring. Air pockets that were trapped during bone insertion would typically rise to the surface, where they could be pierced and eliminated. Bone locations were slightly overfilled because it was found easier to remove excess bone than to add additional bone after curing. The segmented data set was referenced to avoid accidentally filling any voids intended to contain air. The BTES was allowed to cure for 48 hours. Finally, the contact paper masks were removed and the bone locations within each phantom slice were sanded flush with the soft tissue using a belt sander with an 80 44
45 grit belt. Figure 2-5 shows a completed slice which includes the STES, LTES, and BTES materials integrated into an axial slice of the phantom. Phantom assembly Once all the phantom slices were completed, the organs and locations of dosimetric importance were selected. Full-scale axial printouts of the segmented images were used to trace and label the organs of interest onto the physical phantom slice using a permanent marker (see Figure 2-5). Phantom slices containing locations of dosimetric interest were left unattached to a bordering slice in order to allow access for dosimeter insertion. All other slices were bonded to adjacent slices using commercially available wood glue. The glue was placed uniformly over all areas of a slice surface with the exception of air spaces. Wood glue has been found to behave radiologically similar to soft tissue at diagnostic energies. 63 Bonding slices of the phantom into sections permits easy disassembly/reassembly of selected portions of the completed phantom. During assembly, slices were aligned using registration marks and then glued together sequentially. After assembly was completed, excess wood glue and registration marks were removed with a razor blade. Introduction of lung tissue Rather than pouring the lung tissue into the each individual soft tissue slice, the LTES was introduced into the phantom after it had been glued together into sections. Each section requiring LTES was first prepared by masking off the bottom of the section with contact paper to prevent the lung tissue from escaping the voids. An adequate amount of LTES was then prepared and introduced into the voids. Unlike the STES, the LTES is not fluid and has a consistency similar to a light paste (i.e. cake frosting), therefore a wooden spoon was utilized to force the LTES into all of the corners of the lung void, working from the center of the lung and outwards towards the 45
46 perimeter. If a section was accidentally overfilled with LTES, the excess could easily be removed during introduction or sanded smooth later after curing. Results Materials Soft tissue-equivalent substitute The STES was empirically evaluated using an x-ray source (3.9 mm Al HVL at 80 kvp) to have an HVL of 25 mm at 80 kvp, and 29 mm at 120 kvp. The measured density was 1.04 g/cm 3. The average HU for the STES material was found to be 9.8, at the lower end of the widely accepted range for human muscle (10-40 HU). However, the measured value is considered acceptable because STES represents a homogenized mixture of both muscle and adipose tissue, with the latter having a HU range of -50 to Lung tissue-equivalent substitute The density of the LTES was measured to be 0.33 g/cm 3, agreeing well with the targeted lung density at full inspiration. The average HU for the LTES material is , consistent with widely accepted HU values for lung, which range from -500 to Bone tissue-equivalent substitute The BTES has been previously characterized 54 and empirically evaluated to have an HVL of 9.8 mm at 80 kvp and 13.3 mm at 120 kvp. The BTES material had an average HU of 622. This result is consistent with widely accepted HU values of bone, which range from 400 to Completed Phantom The torso of the completed 50th percentile adult male phantom is shown in Figure 2-6. Although not pictured, the phantom also includes a pelvis section which extends to mid-thigh. Surface markings seen on all phantoms (black markings) refer to slice number and were used 46
47 during the assembly process to keep slices in order. Also, the arms can easily be removed for imaging procedures where they are usually placed out of the primary radiation field. Discussion The urethane based STES has numerous advantages over the epoxy resin based soft tissue substitute originally proposed by Jones et al. 54 First, it is much less viscous than the epoxy resin soft tissue substitute, making it easier to pour into the foam molds. Once cured, it is also easily removed from the foam molds; this is not the case with the epoxy resin materials which do not release from the molds cleanly. Additionally, it requires fewer modifying constituents than epoxy resin based tissue equivalents, and therefore retains better homogeneity. The urethane based STES remains pliable and strong when cured, while the epoxy resin soft tissue substitute is brittle when cured and can break under stress or when dropped. Because of these properties, the urethane based material is more durable and unlikely to be damaged with use. Finally, STES better accommodates the insertion of FOC dosimeters, only requiring a thin slit to be cut into the material to allow passage of the optical fiber that connect the active regions of the detector to a read-out device; this avoids any potential concerns about radiation streaming along machined dosimeter channels. 63 Creating molds resulting in a uniform 5 mm thick phantom slices proved more challenging than expected. Early on, molds would occasionally display a variation in cutting depth throughout the slice. The engraving system hardware and software was initially suspected and investigated. However, it was found that this variation in cutting depth was the result of the foam template bowing upwards and losing adhesion to the engraving table during the milling process. This problem was corrected by using additional tape to hold the foam blank in place as it was being milled and replacing the tape regularly to avoid loss of adhesion. 47
48 Conclusions A unique methodology has been developed to construct anthropomorphic phantoms for use in dosimetry studies. While the value of this methodology has already been proven with the construction of this phantom, it should be noted that the same methodology could be applied to the construction of phantoms of all sizes and ages. In particular, our group plans to develop a family of phantoms that accurately represent patients of differing heights and weights. Future works also include the investigation of an adipose tissue-equivalent substitute which could be added to the existing phantoms, or included as an additional step in the construction of a new phantom, to represent subcutaneous fat in order to accurately model more obese patients. While anthropomorphic phantoms have many potential applications, this particular phantom was created to quantify organ doses from cone-beam CT procedures. It is anticipated that other institutions could create their own phantoms for dosimetry studies by following the methodology presented here and using the described tissue equivalent materials for a total material cost of less than $3500. However, equipment and labor costs must also be taken into consideration, with an initial equipment investment of approximately $10000 and labor on the order of several hundred hours per phantom. 48
49 Table 2-1. ICRP 103 organs of interest for the calculation of effective dose and their associated weighting factors Tissue Bone-marrow (red), Colon, Lung, Stomach, Breast, Remainder tissues * 0.12 Gonads 0.08 Bladder, Oesophagus, Liver, Thyroid 0.04 Bone surface, Brain, Salivary glands, Skin 0.01 * Remainder tissues: Adrenals, Extrathoracic (ET) region, Gall bladder, Heart, Kidneys, Lymphatic nodes, Muscle, Oral mucosa, Pancreas, Prostate (male), Small intestine, Spleen, Thymus, Uterus/cervix (female). w T 49


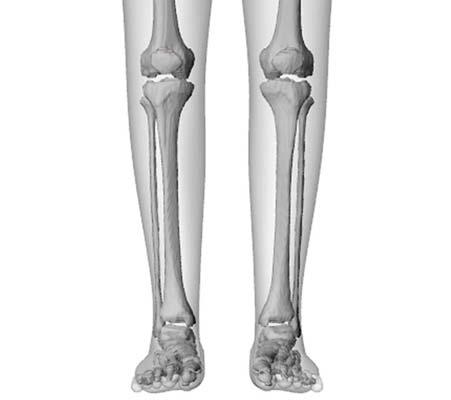
50 Figure 2-1. Completed 50 th percentile hybrid computational phantom 50
 and voids (white).")
51 Figure 2-2. Axial image with segmented organs from the hybrid computational phantom Figure 2-3. A finished bitmap image ready to be imported into the milling software showing only soft tissue (grey) and voids (white). Anterior and lateral registrations marks were also added to aid in assembly. 51

52 Figure 2-4. Finished soft tissue mold, ready to be poured with STES material. Figure 2-5. Completed axial slice with a) STES, b) LTES, and c) BTES 52


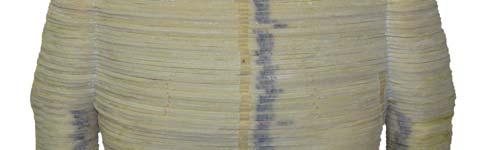


53 Figure 2-6. Torso of completed 50 th percentile physical phantom 53
54 CHAPTER 3 CONSTRUCTION AND CHARACTERIZATION OF A WATER-EQUIVALENT FIBER OPTIC COUPLED DOSIMETER FOR USE AT DIAGNOSTIC ENERGIES Introduction Interest in accurately quantifying the absorbed dose at diagnostic energies by performing in-phantom or in vivo dose measurements has prompted the development of a new fiber optic coupled (FOC) dosimeter. The FOC architecture was chosen due to its small size and ability to provide real-time dose information during irradiation. Other dosimeters commonly used at diagnostic energies, such as ionization chambers, thermoluminescent dosimeters (TLDs), or optically stimulated luminescent (OSL) dosimeters are either too large to incorporate into phantoms or require a time consuming reading process after irradiation to extract dose information. Additionally, TLDs have shown an angular dependence of up to 20%, 64 while OSLs have shown degradation with repeated exposures. 65 Metal-oxide field-effect transistors (MOSFETs) have also been investigated for use at diagnostic energies, but reproducibility variations as high as 15-30% 66 between measurements, along with metallic components which can lead to image artifacts, have limited their success. Lastly, diode detectors have been investigated but are too large for in-phantom measurements and suffer from an over-response to low energy photons when compared to an ion chamber and an angular dependence as great as 50%. 67 The over-response to low energy photons is of particular concern because low energy scatter inside a phantom could lead to inaccurate dose measurements when utilizing such a system for in-phantom dosimetry. It is important to note, however, that this characteristic is not unique to diode detectors. Any detector composed of high-z materials, including TLDs, OSLs, and MOSFETS, will over-respond to low energy photons in the diagnostic spectra due to the strong atomic number dependence of radiation interactions (mainly photoelectric) at these energies. 54
55 FOC dosimeters, utilizing a variety of sensitive elements, have seen some success in both diagnostic and therapeutic applications. They overcome many of the shortfalls of other dosimeter systems by showing little angular dependence, no detectable performance degradation over time, high reproducibility, and real-time output while maintaining a small physical size that allows measurements with high spatial resolution. In diagnostic and mammographic applications, FOC dosimeters utilizing a copper-doped quartz sensitive element have been utilized, but calibration and reproducibility concerns remain. 68, 69 In therapeutic applications, FOC dosimeters utilizing a water-equivalent plastic scintillator as the sensitive element have been used, along with gating or filters to eliminate the effects of Cerenkov radiation, for dose verification in several 70, 71 applications. This work extends the use of water-equivalent plastic scintillator based FOC dosimeters to diagnostic applications, where energies are low enough (less than 190 kev for silica) that the production of Cerenkov radiation in the optical fiber is not a concern. 72 Plastic scintillation material was chosen as the sensitive element of the FOC dosimeter in this study for two primary reasons: an adequate light output to maintain a high signal-to-noise ratio and a water-equivalent effective-z. The water-equivalent effective-z prevents image artifacts and mimics the radiation interaction properties of soft tissue, eliminating the over-response to low energy photons and producing an energy dependence that allows for easy and effective calibration. The FOC dosimeter was constructed by coupling a small cylindrical plastic scintillator, 500 µm in diameter and 2 mm in length, to a 2 meter long optical fiber, which acts as a light guide to transmit scintillation photons from the sensitive element to a photomultiplier tube (PMT). A serial port interface on the PMT permits real-time monitoring of dosimeter output via a custom computer program. To allow multiple FOC dosimeters to be monitored simultaneously, 55
56 an array of 5 PMTs was constructed. The end result of this work is a multichannel fiber optic coupled dosimetry system capable of accurately measuring in-phantom doses in the diagnostic energy range with real-time resolution. Methods and Materials FOC Dosimetry System The sensitive element of the FOC dosimeter consists of a water-equivalent plastic scintillator (BCF-12, Saint-Gobain Crystals, Nemours, France) in the shape of a cylinder with a diameter of 500 µm and a length of 2 mm. The peak emission wavelength of the scintillating element is in the visible spectrum at 435 nm. To transmit the scintillation photons from the sensitive element to a photomultiplier tube (PMT), the scintillator was mechanically coupled to an unjacketed optical fiber (400-UV, Ocean Optics Inc., Dunedin, FL) with a diameter of 400 µm and a length of 2 m (referred to as the signal fiber) using a short piece (~1 cm) of heat shrink tubing. To maximize the number of scintillation photons reaching the PMT, the coupled end of both the scintillator and signal fiber were polished, as suggested by Ayotte et al., 73 with progressively finer lapping films (12, 3, and 1 µm). The uncoupled end of the scintillator was similarly polished and then coated with a reflective paint (EJ-510, Eljen Technology, Sweetwater, TX) in order to prevent the escape of scintillation photons, effectively increasing the output of the sensitive element. 74 At the opposite end of the optical fiber, a female SMA 905 connecter (SMA-490, Ocean Optics Inc., Dunedin, FL) was installed to enable the FOC dosimeter to be connected with a PMT. Lastly, the entire FOC dosimeter was wrapped in opaque heat shrink tubing to restrict ambient light and add strength to the assembly. A completed FOC dosimeter is shown in Figure 3-1 and a close up of the scintillating end of the dosimeter is shown in Figure
57 While the majority of the light reaching the PMT is a result of photons released from the sensitive element of the FOC dosimeter, a fraction of the light is a result of the native fluorescence within the optical fiber itself. 70, 75 The fluorescence of the optical fiber is commonly referred to as the stem effect, and if not accounted for can result in significant errors in dose measurements. In order to account for this effect, a reference fiber, consisting of a second optical fiber without a sensitive element, was also constructed. For the purposes of this study, the reference fiber was placed next to the signal fiber during all exposure measurements and the stem effect was measured and subtracted from the signal fiber. As used in this study, the reference fiber typically accounted for less than 10% of the total counts measured via the signal fiber. While the use of a reference fiber effectively accounts for the stem effect, it was found to be cumbersome when performing dose measurements. This problem was solved by incorporating the reference fiber into the same heat shrink tubing that houses the signal fiber; resulting in a smaller overall package. A completed dosimeter is shown in Figure 3-3. To facilitate the simultaneous reading of multiple FOC dosimeters, an array of 5 photon counting PMTs (H7467, Hamamatsu Corporation, Bridgewater, NJ) was fabricated. The H7467 PMTs were chosen as they offer a spectral response from 300 to 650 nm with a peak efficiency at 420 nm, coinciding well with the wavelength of emission of the scintillating element. While only one FOC dosimeter was used for this study, the capability of reading multiple dosimeters simultaneously will greatly increase the speed of data collection for future work such as anthropomorphic phantom organ dose measurements. To limit the number of spurious pulses detected due to scattered x-rays reaching the PMTs and causing photocathode emissions, the box housing the PMT array was lined with 1/16 lead shielding. A male SMA optical fiber adapter (E , Hamamatsu Corporation, Bridgewater, NJ) was also fitted to each PMT to enable 57
58 connection with an FOC dosimeter. Counting data from each PMT was routed through a serialto-usb hub (UPort , Moxa Inc., Brea, CA) via RS-232 cables and subsequently transferred from the hub to a laptop computer via a USB cable. A custom MATLAB (Mathworks Inc., Natick, MA) computer program, discussed in the next section, was developed to interface with the PMT array and provide real-time monitoring of dosimeter output. A simplified schematic of the entire FOC dosimetry system is shown in Figure 3-4. Components not shown include a 5 V DC power supply for the PMT modules and a 12 V DC power supply for the serial-to-usb hub. PMT Control Program The computer program developed to interface with the PMT array was written and tested in MATLAB Release 2007a. The purpose of the program was to establish a two-way connection with each PMT for the purpose of sending and receiving information such as instructions and counting data. To aid the end user in operating the computer program, a graphical user interface (GUI) was developed using the built in MATLAB guide tool. A screenshot of the finished GUI is shown in Figure 3-5. The GUI features buttons to start and stop counting, a button to save the counting data to a tab delimited text file, and a button to disconnect from the PMT array and close all serial port connections. Radio buttons to select which PMTs to initialize are also displayed along with text box that allows the user to manually enter an integration time for the PMTs. An integration time between 10 ms and 10 s can be entered depending on the desired time resolution for the experiment being conducted. Below the control buttons, the GUI graphically displays the output from each PMT in real-time along with a numerical display of counts per integration time and a running sum of the total counts. Through calibration, the total counts can be equated to dose and therefore the FOC dosimetry system operates as a relative dosimeter. 58
59 Exposure Measurements Unless otherwise noted, the characterization of the FOC dosimeter was performed using a clinical x-ray tube with a measured half value layer of 5.76 mm of Al at 120 kvp and a fixed field size of 20x20 cm. All testing, except for the angular dependence which was done free-inair, was performed with the dosimeter placed on top of a polymethylmethacrylate (PMMA) slab to provide a backscatter medium. All measurements were repeated 5 times to reduce statistical uncertainties and provide reproducibility metrics. A 15 cm 3 pancake ion chamber and associated electrometer (chamber model 96035B, electrometer model 35050A, Keithley Instruments Inc., Cleveland, OH) were used to provide simultaneous exposure measurements. It should be noted that all results reported in this study have been corrected for the stem effect with the use of a reference fiber. A calibration between the PMT used for the signal fiber and the PMT used for the reference fiber was also performed to eliminate the influence of sensitivity differences between the two PMTs. Energy Dependence The energy dependence of the FOC dosimeter was evaluated by incrementally increasing the tube potential from 40 to 120 kvp in 10 kvp increments while maintaining the current-time product constant at 50 mas. The ion chamber was placed next to the FOC dosimeter and irradiated simultaneously to provide a reading of the air kerma from each exposure. These data were then used to plot the normalized dosimeter sensitivity, in counts/mgy, versus tube potential. To evaluate the effect of varying beam quality as a function of tissue depth due to beam hardening and scattering, varying thicknesses of soft tissue-equivalent material 55 were placed on top of both the FOC dosimeter and ion chamber and exposures were taken at 120 kvp and 50 mas with a fixed field size of 10x10 cm. These data were then used to create a plot of the 59
60 normalized dosimeter sensitivity, in counts/mgy, versus depth in the soft tissue-equivalent material. Linearity The linearity of the FOC dosimeter was evaluated by increasing the current-time product from 0.5 mas to 160 mas while keeping the tube potential constant at 120 kvp, yielding air kerma values ranging from 0.16 to mgy. The current-time product was initially varied by holding the exposure time constant and adjusting the tube-current. Unfortunately, the entire dose range desired could not be achieved with a single exposure time setting, and therefore several different exposure times were utilized (20, 50, 100, 200, and 320 ms). By holding the exposure time constant when possible, the dose rate was effectively varied and therefore the results also indicate the dose rate linearity of the FOC dosimeter. A linear fit was applied to a plot of the FOC dosimeter s counts versus measured air kerma and the correlation coefficient was used to quantify the linearity of the dosimeter. Reproducibility The reproducibility of the FOC dosimeter was evaluated using the data from the linearity experiment. Because each measurement was repeated 5 times, the data provided an adequate sample from which to take average readings and standard deviation for different exposure levels of interest in diagnostic radiology. The coefficient of variation (COV) at each exposure level was calculated to quantify the dosimeters reproducibility. Dosimeter Response versus Bend Radius The change in response of the FOC dosimeter as the optical fiber was bent to various radii was also investigated. Technique settings were fixed at 120 kvp and 50 mas. The dosimeter was first irradiated with the optical fiber straight to obtain a baseline value. The dosimeter was then irradiated with the optical fiber bent into a single loop 20 cm in radius at a distance of 40 cm 60
61 from the sensitive element of the dosimeter. Measurements were repeated with progressively smaller loop radii (10 cm, 7.5 cm, 4 cm, and 2.5 cm) to fully characterize the response of the dosimeter versus bend radius of the optical fiber. Angular Dependence The angular dependence of the FOC dosimeter was evaluated using a clinical computed tomography (CT) unit with a half value layer of 7.0 mm of Al at 120 kvp. Static shots at fixed tube angles were taken with technique settings of 120 kvp and 5 mas. A CT unit was chosen for this testing because it provided an easy method of accurately obtaining the response of the dosimeter as a function of angle of incident radiation. The dosimeter was first placed at the isocenter of the unit free-in-air with the patient table out of the beam and irradiated axially (around the cylindrical axis of the dosimeter). Measurements were made at intervals of 30 degrees all the way around the dosimeter. The dosimeter was then turned and irradiated normalto-axial where 0 o corresponds to x-rays incident on the tip of the dosimeter and 180 o corresponds to x-rays incident from the backside of the dosimeter. Again, measurements were made at intervals of 30 degrees. Results Energy Dependence Figure 3-6 plots the normalized sensitivity of the FOC dosimeter, in counts/mgy, as a function of tube potential. The results were normalized to the measurement point at 120 kv for ease in comparison. As can be seen, the energy response is fairly linear and the sensitivity of the FOC dosimeter increases an average of 6.8 % per 10 kvp across the energy range shown. Additionally, Figure 3-7 plots the normalized sensitivity of the FOC dosimeter, in counts/mgy, as a function of depth in soft tissue-equivalent material. The results were normalized to the surface measurement point, which corresponds to the 120 kv measurement 61
62 point in Figure 3-6, for ease in comparison. As the depth increases, the x-ray spectrum changes due to beam hardening and the addition of a scatter component. This effect causes the sensitivity of the dosimeter to vary due to its energy dependence. However, the variation is only 10% across the depth range investigated. Linearity Figure 3-8 plots the response of the FOC dosimeter, in counts, as a function of air kerma, in mgy. Error bars are not shown because they were too small to be displayed. A linear trend line was fitted to the data and the correlation coefficient was found to be This result demonstrates that the FOC dosimeter has a very linear response over the exposure range of interest in diagnostic radiology. Reproducibility Table 3-1 summarizes the average readings and standard deviation, in counts, over the exposure range of interest commonly used in diagnostic radiology. The coefficient of variation was less than 1% for most exposure levels, demonstrating that the FOC dosimeter is capable of highly reproducible readings. As expected, the variation was slightly higher at low exposure levels due to less total counts and more fluctuations between readings. However, the coefficient of variation was only 3.64% for even the lowest exposure level (0.16 mgy). Dosimeter Response versus Bend Radius Figure 3-9 plots the response of the FOC dosimeter as the optical fiber was bent into a single circular loop with progressively smaller radii. The response was normalized to the measurement point in which the optical fiber was straight for ease of comparison. The response of the dosimeter remained relatively constant for large bend radii and did not decrease significantly (> 10%) until a small radius of 2.5 cm was obtained. 62
63 Angular Dependence Figures 3-10 and 3-11 plot the response of the FOC dosimeter to an axial and normal-toaxial irradiation free-in-air, respectively. All data was normalized to a 0 o axial irradiation for ease of comparison. For the normal-to-axial data, 0 o corresponds to x-rays incident on the distal tip of the dosimeter and 180 o corresponds to x-rays incident from the backside of the dosimeter (see schematic in Figure 3-11). As expected due to the cylindrical geometry, the response of the dosimeter showed little angular dependence to an axial irradiation, varying by less than 5% over an entire revolution. The response of the dosimeter to a normal-to-axial irradiation showed a reduction of 97% in the number of counts detected when the x-rays were incident through a narrow range of angles directly from the back of the dosimeter (180 o ). A slight reduction in recorded counts of approximately 12% was also seen when radiation was incident on the face of the dosimeter (0 o ). Discussion The FOC dosimeter showed excellent dose linearity and reproducibility when benchmarked against an ion chamber. Additionally, there was minimal reduction in dosimeter response as the optical coupling fiber connecting the scintillator to the PMT was bent into loops of decreasing radius. At a bend radius of 2.5 cm a significant reduction was seen, but such a tight bend radius is far beyond the range expected to be encountered with normal use of the FOC dosimetry system. The FOC dosimeter exhibited positive energy dependence in the range of tube potentials evaluated ( kvp). Initially, it was thought that energy or beam quality dependent calibration factors could be used to simply correct for this effect. However, it was later realized that when using the dosimeter for in-phantom dosimetry, depth-dependent correction factors may also be needed to account for the energy dependence of the dosimeter due to variations in beam 63
64 quality at increasing depths as a result of beam hardening and the addition of a scatter component. The need for depth-dependent correction factors was evaluated, as shown in Figure 3-7, and it was found that the sensitivity of the dosimeter varied by only 10% over the depth range investigated. Much of this variation occurred between the free-in-air measurement (depth = 0) and the first data point in tissue, suggesting that the dosimeter could be calibrated under only a few cm of scattering medium to minimize the effect of the dosimeters energy dependence for in-phantom dose measurements. It should be noted that specific irradiation geometries and conditions should be evaluated similarly in order to determine the extent to which changes in the beam energy spectrum could affect the dosimeter s calibration. Also, this issue is not unique to only the FOC dosimetry system, but applies to many dosimeters commonly used in diagnostic measurements (TLDs, OSLs, MOSFETs, and diodes for example); though the issue is seldom investigated or accounted for in the current literature. The angular dependence of the FOC dosimeter was evaluated for both axial and normal-toaxial irradiation. Due to the cylindrical geometry of the dosimeter, little angular dependence was expected from an axial irradiation. Figure 3-10 demonstrates this result, showing that the dosimeter s response varied by less than 5% over an entire revolution. This small amount of variation can be attributed to the construction of the dosimeter, as it is technically difficult to ensure that the sensitive element is perfectly aligned with the optical fiber. Because angular dependence is a function of the alignment of the sensitive element, each dosimeter should be characterized prior to its initial clinical use. The response of the dosimeter to a normal-to-axial irradiation showed a reduction in counts of 97% when irradiated from the backside due to attenuation of x-rays by the optical fiber itself. Additionally, the response of the dosimeter dropped by 12% when radiation was incident on the distal tip of the dosimeter. This reduction is 64
65 attributable to the smaller solid angle provided by the cylindrical geometry of the sensitive element when viewed head on. The variations in detector response can be minimized in projection radiography with proper orientation of the dosimeter. In CT dosimetry, the effects of these variations will likely be averaged out for in-phantom measurements due to the rotation of the x-ray tube. In order to illustrate this point, the area under the curve shown in Figure 3-11 was found to be only 11% less than that of an ideal detector response with no angular dependence. In addition, the presence of scatter radiation has been found to reduce the effects of angular dependence in in-phantom dose measurements. 76 Conclusions The FOC dosimeter described in this study offers immediate readout, excellent sensitivity, linear dose response, and high reproducibility in a physical package that is small enough to be used for in-phantom or in vivo dose measurements. Additionally, the FOC dosimeter showed no significant decrease in response as the optical fiber was bent for radii commonly seen during clinical use. Drawbacks of this dosimeter include positive energy dependence and a decrease in response for irradiations incident from the back of the dosimeter. However, the energy dependence is minimized by calibrating the dosimeter under several cm of material to account for changing beam quality with depth due to beam hardening and scattering. Variations in angular response can be minimized by proper orientation of the dosimeter in projection radiography and will be negligible for in-phantom measurements in CT imaging as variations will be reduced by the presence of scatter radiation and the rotation of the x-ray tube. Overall, the FOC dosimetry system provides rapid and accurate dose measurements applicable to a range of diagnostic imaging applications, with particular utility for in-phantom organ dose measurements. For the purposes of this research, the FOC dosimeter described above and the 65
66 anthropomorphic phantom described in Chapter 2 will be used to quantify organ doses from kilovoltage CBCT. 66
67 Table 3-1. Reproducibility of measurements with FOC dosimeter at kv energies Air kerma (mgy) Mean counts (net) Standard deviation COV (%) % % % % % % % % % % 67


68 Figure 3-1. Completed FOC dosimeter. Scintillating element at left and SMA connector at right. Figure 3-2. Close up of scintillating element end of dosimeter. Area of increased diameter at distal tip is due to underlying heat shrink tubing that was used to couple the scintillating element to the optical fiber. Exterior sheath of heat shrink tubing is crimped off at distal tip to prevent ambient light from entering assembly. 68
69 Figure 3-3. New dosimeter design with reference fiber incorporated into FOC dosimeter assembly. Figure 3-4. FOC dosimetry system schematic, power supplies for serial-to-usb hub and PMTs not shown. 69

70 70 Figure 3-5. Screenshot of PMT control program GUI. Program allows user to select which PMTs to initialize, input an integration time, start and stop counting, save the counting data to a tab delimited text file, and disconnect from the PMT array which closes all serial port connections. Displays counting data from each PMT in real-time both graphically and numerically.
71 Figure 3-6. Energy dependence of FOC dosimeter. Data has been normalized to the data point at 120 kv. Error bars correspond to ± 1 standard deviation of the mean. Figure 3-7. Energy dependence of FOC dosimeter as a function of depth in soft tissue-equivalent material. Data has been normalized to the surface measurement (depth = 0), which corresponds to the 120 kv measurement in Fig. 3. Error bars correspond to ± 1 standard deviation of the mean. 71
72 Figure 3-8. Dose linearity of FOC dosimeter. Figure 3-9. Response of FOC dosimeter versus the bend radius of the optical fiber. Data has been normalized to a bend radius of infinity. Error bars correspond to ± 1 standard deviation of the mean. 72
73 a) b) Figure Angular dependence of FOC dosimeter to an axial irradiation. A) Response data has been normalized to a zero-degree axial angular response. Error bars correspond to ± 1 standard deviation of the mean. B) Experimental setup, shaded area represents a head on view of the sensitive element of the FOC dosimeter. a) b) Figure Angular dependence of FOC dosimeter to a normal-to-axial irradiation. A) Response data has been normalized to a zero-degree axial angular response. Error bars correspond to ± 1 standard deviation of the mean. B) Experimental setup, shaded area represents a side view of the sensitive element of the FOC dosimeter. 73
74 CHAPTER 4 CHARACTERIZATION OF THE FIBER-OPTIC COUPLED DOSIMETER AT MEGAVOLTAGE ENERGIES Introduction In the previous chapter, the fiber-optic coupled (FOC) dosimeter was characterized at diagnostic energies. The results from this study were very positive and a working version of the dosimeter and PMT array for dose measurements at diagnostic energies is now available. This was an important milestone as the remainder of this research relies on using the FOC dosimeter to perform organ dose measurements during kilovoltage cone-beam CT (CBCT) imaging. With the characterization of the dosimeter completed at diagnostic energies, it was suggested that the response of the FOC dosimeter also be investigated at megavoltage (MV) photon energies typically used in radiation therapy. Interest in small point dosimeters for use in radiation therapy has grown in recent years as small radiation treatment fields for IMRT and radiosurgery have become more popular. For instance, in stereotactic radiosurgery, treatment fields as small as 1-3 cm in diameter are often used to deliver large doses of radiation to treat intracranial tumors. 77 In order to accurately plan these treatments, it is essential to develop a treatment plan with knowledge of the associated percent depth dose (PDD) curves and twodimensional dose distributions in a water phantom. This information is typically obtained by direct measurement using a dosimeter such as an ionization chamber. The current gold standard for dosimetry measurements in radiation therapy is the 0.6 cc farmer type ion chamber. Unfortunately, for small field radiotherapy dosimetry, the active element of this chamber is too large and would be subject to partial volume effects. To overcome this issue, several different types of dosimeters have been developed, including small volume ion chambers, metal-oxidesemiconductor field effect transistors (MOSFETs), diamond detectors, radiographic films, and thermoluminescent detectors (TLDs). However, these dosimeters are not without their own 74
75 drawbacks. Small volume ion chambers can suffer from leakage current that can make up a substantial fraction of the signal thus affecting the accuracy of dosimetry measurements. 78 MOSFET detectors show significant angular dependence 79 and poor reproducibility for low dose fractions. 80 Diamond detectors suffer from dose-rate dependence 81 while TLD and radiographic film measurements both require post-irradiation reading which makes online dose assessment impossible. The FOC dosimeter overcomes several of these issues with one of the smallest sensitive elements of any dosimeter, the ability to display real-time dose information, and minimal angular dependence due to a cylindrically symmetric sensitive element. Additionally, FOC dosimeters do not require corrections for changes in temperature, pressure, or humidity. 82 The usual conversion of absorbed dose from one medium to another can also be avoided because the plastic scintillator material used in FOC dosimeters is water-equivalent. 83 Previous authors have characterized different variations of FOC dosimeters for dosimetry measurements at MV energies with some success Several authors have even gone as far as 71, 89 building 2-dimensional arrays of FOC dosimeters for use in IMRT quality assurance (QA). The plastic scintillator based FOC dosimeters are ideal for this application as their waterequivalence allows them to be placed in close proximity to each other for high spatial resolution measurements with minimal fluence perturbation. To date, none of the prototypes discussed in the literature have reached widespread clinical use. Nonetheless, the field of FOC dosimetry continues to move forward and grow to meet the needs of MV dosimetry in radiotherapy. This work presents on the characterization of the FOC dosimetry system first described in Chapter 3 using an MV photon beam produced by a medical linear accelerator. 75
76 Methods and Materials FOC Dosimetry System The dosimetry system used for this work was, for the most part, the same as that presented in Chapter 3. Previously, the box housing the PMT array was lined with 1/16 lead shielding to limit the number of spurious pulses detected due to scattered x-rays reaching the PMTs and causing photocathode emissions. However, at therapeutic photon energies, this shielding was not sufficient. Instead of adding additional shielding for this application, a decision was made to simply move the box out of the treatment room and into the console area. This meant that the optical fibers connecting the scintillator of each dosimeter to its respective PMT needed to be lengthened. After a quick survey of the linac vault, it was found that each dosimeter would have to be 15 m long to reach from the treatment table to the console area. While increasing the length of the optical fiber will undoubtedly result in attenuation of the light signal, previous experience from diagnostic exposures has shown that the light signal was already several orders of magnitude greater than the background signal. Therefore, the added attenuation of the light signal from a longer optical fiber was not really a concern. The new dosimeter was constructed using the same materials previously described in Chapter 3 except that instead of a 2 m long optical fiber, a 15 m long optical fiber was used. To allow subtraction of the stem effect commonly seen in FOC dosimeters, a reference fiber was also included in the FOC dosimeter assembly. It is important to note that the stem effect at MV energies is much larger than at kv energies. This is mainly due to the fact that at these energies, secondary electrons have enough energy to produce Cerenkov radiation in the silica optical fibers. 90 Cerenkov radiation is produced when charged particles, such as secondary electrons, cross a transparent medium at a speed greater than the speed of light in that material. This causes the electric dipoles of nearby molecules to oscillate and emit visible light. This light was named 76
77 Cerenkov radiation after Pavel Cerenkov, the Nobel Prize winning scientist who first characterized this phenomenon. As shown in Figure 4-1, the Cerenkov radiation in a silica optical fiber is emitted in a broad spectrum with a 1/λ 3 dependence. From this figure, it can be seen that the Cerenkov light spectrum stretches from approximately 200 to 700 nm, overlapping the scintillators emission peak at 435 nm (not shown). To overcome this issue, the measured light output of the reference fiber is subtracted from the measured light output of the signal fiber, leaving only the component of light from the scintillator itself. This method of handling the stem effect is known as background subtraction and has previously been exploited with success. 91 Dose Measurements Characterization of the FOC dosimeter at MV photon energies was carried out using an Elekta Synergy linear accelerator (Elekta Oncology Systems, Crawley, UK). An accelerating potential of 6 MV was selected for all tests as it is one of the most popular energies used in radiation therapy. The linac was calibrated to deliver 1 cgy per monitor unit (MU) at the depth of maximum dose in water (1.5 cm for 6 MV) with a 100 cm source-to-axis distance (SAD) and a 10x10 cm field. For simplicity, all measurements were performed at an SAD of 100 cm, depth of 10 cm in a solid water phantom, and a 10x10 field unless otherwise noted. All results reported in this study have been corrected for the stem effect with the use of a reference fiber. A calibration between the PMT used for the signal fiber and the PMT used for the reference fiber was also performed to eliminate the influence of sensitivity differences between the two PMTs. Linearity The linearity of the FOC dosimeter as a function of total dose was evaluated by increasing machine output from 10 to 500 MU in finite increments while holding the energy constant at 6 MV. The dose rate was also held constant at approximately 565 MU/min for this experiment. To 77
78 reduce statistical uncertainties and provide reproducibility metrics, measurements were repeated 3 times. The stability of the FOC dosimetry system was also investigated by repeating these measurements several days later and comparing the results. These data were then used to create a plot of MU versus net counts from the dosimeter. A linear fit was applied to the data and the correlation coefficient was used to quantify the linearity of the dosimeter. Reproducibility The reproducibility of the FOC dosimeter was evaluated using the data from the linearity experiment. Because each measurement was repeated three times, the data provided an adequate sample from which to take average values and standard deviation for different dose levels used in radiation therapy. The coefficient of variation (COV) at each dose level was calculated to quantify the dosimeter s reproducibility. Dose Rate Dependence The dose rate dependence of the FOC dosimeter was investigated by delivering 50 MU at several different dose rates. Clinically relevant dose rates of approximately 68, 137, 277, and 565 MU/min were investigated. Data was then normalized to the dose rate at 565 MU/min for ease in comparison. A plot of normalized dosimeter response versus dose rate was created to show the variation in response of the dosimeter to changing dose rate. Field Size Dependence The ability of the FOC dosimeter to accurately measure output factors for different field sizes was also investigated. A fixed output of 200 MU was selected and delivered at a dose rate of approximately 565 MU/min. Measurements were repeated for field sizes of 3x3, 5x5, 10x10, and 15x15 cm. These data were then normalized to the reading at a 10x10 cm field size to represent the output factor for several common field sizes used in radiation therapy. 78
79 Results Linearity Figure 4-2 plots the response of the FOC dosimeter, in counts, versus the machine output in MU. Error bars are not shown because they are too small to be displayed. A linear trend line was fitted to the data and the correlation coefficient was found to be This result demonstrated that the FOC dosimeter has a very linear response over the dose range of interest in radiation therapy. Reproducibility Table 4-1 summarizes the average readings and standard deviation, in counts, from the linearity experiment. The coefficient of variation was less than 3% for all measurements, with many readings showing a variation of less than 1%. As expected, the variation was slightly higher at low doses due to less total counts and more fluctuations between readings. Dose Rate Dependence Figure 4-3 plots the normalized response of the FOC dosimeter versus the dose rate in MU/min. The response was normalized to a dose rate of 565 MU/min for ease in comparison. The response of the dosimeter remained relatively constant with only a 4% variation across the clinical range of dose rates investigated. This result shows that the response of the dosimeter is fairly independent of dose rate and that dose rate specific calibration factors may be required for only the most demanding dosimetry measurements. Field Size Dependence Table 4-2 summarizes the output factors and net counts measured using the FOC dosimeter for field sizes of 3x3, 5x5, 10x10, and 15x15 cm. As can be seen, the net counts decreased with field size. This led to the output factor also decreasing with field size when normalized to a standard 10x10 field. This is opposite of the expected results, which is an increase in net counts 79
80 for larger field sizes due to the additional scatter along the central beam axis. Potential reasons for this discrepancy and methods to overcome this issue are discussed in the next section. Discussion The FOC dosimeter exhibited excellent dose linearity and reproducibility when exposed to 6 MV photons from a medical linear accelerator. Additionally, the response of the dosimeter was fairly independent of dose rate and varied by approximately only 4% over the range of dose rates investigated in this study. The angular dependence was not investigated as it was previously shown in Chapter 3 that there is very little variation during an axial irradiation due to the cylindrical geometry of the sensitive element. Lastly, the ability of the FOC dosimeter to measure output factors for different field sizes was investigated and very unusual results were observed. As the field size was increased, the net counts were observed to decrease as shown in Table 4-2. This result is the opposite of the expected response which is an increase in net counts due the additional scatter associated with a larger field size. Dose measurements performed with a calibrated ion chamber confirmed that the measured dose did indeed increase with increasing field size. In an attempt to overcome this issue, several possible sources of error were investigated. At first, it was thought that the PMT used to measure the light output from the signal fiber and the PMT used to measure the light output from the reference fiber could possibly exhibit different spectral responses. To test this idea, the field size dependence experiment was repeated and the light output from both signal and reference fibers were measured individually using the same PMT. The results of this experiment indicated that the net counts still decreased with increasing field size, ruling out possible response differences between the PMTs. Next, it was suspected that differences in radiation induced light output between the two optical fibers (signal and reference fibers) may be the cause for the observed discrepancy. To test 80
81 this idea, the scintillator was removed from the signal fiber and the field size dependence experiment was repeated. Again, all measurements were taken on the same PMT to rule out any response differences between the PMTs. A 50 MU exposure was delivered and the measurements were repeated 3 times to reduce statistical uncertainties. This experiment revealed that the radiation induced light output between the two optical fibers was nearly identical, as shown in Table 4-3. This result ruled out differences in radiation induced light between the two optical fibers as a potential source of error. With the most obvious solutions ruled out, we began to consider other potential sources of error. Further examination of the data in Table 4-2 revealed that the counts from the reference fiber increased more quickly with field size than the counts from the signal fiber. After some thought, a potential cause for this phenomenon was discovered. Cerenkov light produced in the reference fiber that travels down the fiber in the opposite direction of the PMT would be efficiently reflected at the glass/air interface (index of refraction for glass 1.5) present at the end of the optical fiber and ultimately reach the PMT. However, light produced in the signal fiber that traveled down the fiber in the opposite direction of the PMT would not be as efficiently reflected at the glass/scintillator interface because the plastic scintillator (n 1.5) has a similar index of refraction as the glass. Ultimately, this would account for more Cerenkov light reaching the PMT from the reference fiber than from the signal fiber as field size was increased and more Cerenkov light was produced. To test this idea, the signal and reference fibers were modified such that the interfaces at the end of the fibers were the same. This was done by attaching a scintillator to the end of both fibers. The scintillator attached to the signal fiber was made slightly longer than the reference fiber (5 mm compared 2.5 mm) so that the difference in signal between the two could be differentiated. To test this prototype, the field size dependence 81
82 experiment was repeated once again. Unfortunately, the difference in signal between the two fibers was very small. However, by repeating the measurements several times, we were able to determine a general trend and it was apparent that the net counts did indeed still decrease with increasing field size. Finally, after ruling out all other possible causes for the observed discrepancy, it was assumed that the incident spectrum of light from the optical fiber was causing an unusual response from the PMT itself. Data from the manufacturer was obtained and it was found that the PMT was sensitive to light in the nm range. From Figure 4-1, it can be seen that Cerenkov radiation is emitted throughout this range, but has the highest intensity at wavelengths shorter than 400 nm. Therefore, an optical filter was chosen to filter out these shorter wavelengths while still allowing the scintillation light (peak at 435 nm) to pass. It was hoped that by filtering out this unwanted light, the PMT would respond in a more predictable fashion. Therefore, a 400 nm high pass filter was chosen and installed at the PMT/optical fiber interface. Also, the scintillation element from the last experiment was removed from the reference fiber and the FOC dosimeter was returned to its original configuration. The field size experiment was repeated once again and data revealed that the net counts still decreased with increasing field size, as shown in Table 4-4. However, the filter did decrease the total counts registered by the PMT, indicating that the filter was indeed removing light from the spectrum. As a last resort, the energy dependence of the scintillator was considered. As the field size is increased, the photon spectrum incident on the dosimeter placed in a phantom changes due to increased scatter. If the scintillator exhibits strong energy dependence, this small change in the energy spectrum with field size could lead to the observed discrepancy. In order to test this idea, the dosimeter was placed free in air where scatter would be negligible and the field size 82
83 dependence experiment was repeated. Even in the absence of scatter, the net counts still decreased with increasing field size, as shown in Table 4-5. This finding ruled out energy dependence as a cause for the observed discrepancy. After all of these experiments, it can be concluded that the observed discrepancy during the field size dependence experiment was not a result of spectral response variations between different PMTs, differences in radiation induced light in the optical fibers, interface reflection differences, or energy dependence of the scintillator. While these causes have been ruled out, it is still unclear as to why the net counts decrease with increasing field size. Theoretically, the spectrum of light from both the reference and the signal fibers should be the same with exception of a photopeak in the signal fiber spectrum from the scintillator. A simple subtraction of the reference fiber from the signal fiber should then yield the counts only from the scintillator. One possible cause for the observed discrepancy is related to transient darkening of the optical fibers. In this case, the fiber s ability to transmit light is reduced when irradiated and the optical fiber effectively darkens, ultimately reducing the number of scintillation photons reaching the PMT. Darkening of the optical fiber when irradiated would explain why the observed counts from the signal fiber do not increase as fast as the observed counts from the reference fiber when field size is increased. However, most authors have not observed this effect at doses and dose rates produced by medical linear accelerators. Another possible cause is related to the PMT not responding in the same fashion to the two different spectrums of light from the signal and reference fibers. Most authors overcome the latter issue by using a CCD camera to readout the FOC dosimeters. A CCD camera is ideal for this application as the different color channels of the camera can be used to characterize the spectrum of light and find the contribution from only the scintillator. This technique is known as chromatic filtering and has been used with success by 83
84 several authors. 88, 91, 92 The CCD camera also offers a more cost effective solution for reading multiple dosimeters out simultaneously. Conclusion While the FOC dosimeter shows promise at MV energies, there are still some problems to be resolved. The dose linearity, reproducibility, and dose rate dependence of the FOC dosimeter at MV energies was investigated in this study and yielded very good results. The response of the dosimeter as field size was varied was also investigated and yielded peculiar results; specifically, the net counts of the dosimeter were seen to decrease with increasing field size, the exact opposite of the expected result. Several possibilities for this discrepancy were investigated to no avail. Further investigation is needed but may not be warranted as the next generation of the FOC dosimetry system is currently under development and includes a CCD camera rather than PMTs. This will allow techniques such as chromatic filtering to be used instead of just simple background subtraction to handle the Cerenkov radiation produced at MV energies. Therefore, further investigation into the characterization of the FOC dosimeter at MV energies is postponed until the CCD camera system is completed. 84
85 Table 4-1. Reproducibility of measurements with FOC dosimeter at MV energies MU Mean counts (net) Standard deviation COV (%) % % % % % % % % % % % % % % % Table 4-2. Counts from signal and reference fibers as well as output factors normalized to a 10x10 cm field size from a 200 MU irradiation. Field size (cm) Signal fiber Reference fiber Net counts Output factor 3x x x x Table 4-3. Counts from each optical fiber with no scintillator during a 50 MU irradiation Fiber 1 Fiber 2 Field size (cm) Average 1σ Average 1σ 3x x x x
86 Table 4-4. Counts from signal and reference fibers from a 50 MU irradiation after passing through a 400 nm high pass filter. Output factors normalized to a 10x10 cm field size. Field size (cm) Signal fiber Reference fiber Net counts Output factor 3x x x x Table 4-5. Counts from signal and reference fibers from a 50 MU irradiation free in air. Output factors normalized to a 10x10 cm field size. Field size (cm) Signal fiber Reference fiber Net counts Output factor 3x x x x
87 Figure 4-1. Radiation induced light in a silica optical fiber. The dashed line represents the theoretical Cerenkov spectrum. A weak luminescence signal due to impurities in the silica fiber begins at 380 nm and is superimposed on the Cerenkov light spectrum. (Used with permission from: M. R. Arnfield, "Radiation-induced light in optical fibers and plastic scintillators: Application to brachytherapy dosimetry," IEEE Trans Nucl Sci 43, (1996), Figure 1, p. 2078). 500 Counts (thousands) y = 0.923x R² = Machine output (MU) Figure 4-2. Dose linearity of FOC dosimeter. Blue squares represent data taken on day 1 and red circles represent data taken on day 2. 87
88 Dosimeter response ratio MU/min Figure 4-3. Response of FOC dosimeter versus dose rate in MU/min. Data has been normalized to a dose rate of 565 MU/min to aide in comparison. 88
89 CHAPTER 5 AN ORGAN AND EFFECTIVE DOSE STUDY OF XVI AND OBI CONE-BEAM CT SYSTEMS Introduction Advances in radiation treatment delivery, such as intensity-modulated radiation therapy (IMRT), have made it possible to deliver large doses of radiation to a treatment volume with a high degree of conformity. While a highly conformal treatment offers the advantage of sparing surrounding normal tissue, this benefit can only be realized if the patient is accurately positioned during each treatment session. The need to accurately position the patient has led to the development and use of gantry mounted kilovoltage cone-beam computed tomography (CBCT) systems. 23, 93 These systems are used to acquire high resolution volumetric images at the time of treatment, which can then be digitally registered with the planning CT in order to determine the appropriate shifts of the treatment table required to accurately align the patient. To date, two such systems are commercially available, the X-ray Volumetric Imager (XVI, Elekta Oncology Systems, Crawley, UK) and the On-Board Imager (OBI, Varian Medical Systems, Palo Alto, CA). While CBCT is a very useful tool for ensuring that a patient is properly aligned prior to treatment, daily use in a high fraction therapy regimen will result in an associated imaging radiation dose. In an effort to quantify the dose from CBCT, several authors have performed dose measurements in cylindrical acrylic phantoms, reporting measured doses as high as 10 cgy from a single scan. 34, 45, 46, 94, 95 While these studies provide useful dose metrics for which to compare different imaging protocols and equipment, the reported doses should be taken with great caution as humans are substantially different in size, shape, and attenuation from the acrylic phantoms used in these studies. 41 To more accurately quantify patient dose, several other authors have performed dose measurements within commercially available anthropomorphic 89
90 phantoms. 32, 39, The present study aims to build on these previous studies by performing a comprehensive set of organ dose measurements in an adult male anthropomorphic phantom for both the XVI and OBI CBCT systems using currently available manufacturer-installed protocols and software (Version 4.0 for the XVI and Version for the OBI). Previous studies with the XVI did not include the use of a bow-tie filter (and associated protocols to account for the filter) and a recent software upgrade to the OBI has reduced the total tube-current time product used and now offers a half rotation scan for head protocols. These technical changes to imaging parameters are intended to reduce the patient dose from cone beam imaging, which is of increasing clinical significance with daily image acquisitions. Organ doses were quantified for 26 organs using an anthropomorphic phantom. Most of the 26 organs were chosen based on recommendations by the International Commission on Radiological Protection (ICRP) Publication 103 for the evaluation of effective dose. 48 As is common in medical physics, the effective dose was adopted as a way to assess whole body dose for a specific patient and to compare different imaging protocols and equipment. 99 It is important to stress that because only a male phantom was used to derive the effective dose, and the weighting factors defined by the ICRP are sex averaged, the reader should be cautious if using this value in risk estimation models. In addition to the dosimetry measurements, a comparison of image quality for each of the factory-installed protocols was performed using a Catphan 440 image quality phantom. Methods and Materials CBCT Systems Evaluated This study evaluated dose delivered from both the Elekta XVI and Varian OBI CBCT systems. The two systems are similar in design with a kv x-ray source and flat-panel detector mounted to the gantry and sharing a common axis of rotation with the MV treatment beam. A 90
91 brief description of each system is presented in the following text; however, readers looking for a more complete description are referred to Song et al. 46 The XVI system utilizes an amorphous silicon/cesium iodide (asi/csi) flat-panel detector with a 1024x1024 array of 0.4 mm elements. The x-ray source is mounted to a retractable arm with a fixed source to isocenter distance of 100 cm and offers several different collimators and kv filter combinations which are interchangeable based on the desired volume to be scanned. For the head scan, a head and neck protocol was selected along with an S20 collimator, which yielded an axial field-of-view (FOV) of 27 cm, as shown in Figure 5-1(a), with a length of 26 cm along the longitudinal axis. Chest scans were performed with a chest protocol and an M20 collimator which yielded an axial FOV of 41 cm with a length of 26 cm. Pelvis scans were performed with a prostate protocol and an M10 collimator, which yielded an axial FOV of 41 cm with a length of 12.5 cm. In addition to changing the collimators for each protocol, the chest and pelvis scans also required that the detector panel be shifted orthogonal to the kv beam axis to achieve the increased FOV, 100 as shown in Figure 5-1(b). Additionally, a bow-tie filter (designation F1) was utilized for both the chest and pelvis scans. The OBI system utilizes an amorphous silicon (asi) flat-panel detector with a 2048x1536 array of mm elements. The x-ray source for the OBI is mounted to a retractable arm with a variable source to isocenter distance of 80 to 100 cm. However, during this study, all measurements were performed with a fixed source to isocenter distance of 100 cm. The operation of the OBI unit is similar to the XVI unit, but offers only two different scan modes: full and half-fan. In the full-fan mode, a full bow-tie filter is used and the collimation is automatically adjusted by a set of dynamic jaws mounted to the x-ray source. The resulting FOV is 25 cm with a length of 18 cm, as shown in Figure 5-1(c). In the half-fan mode, the detector 91
92 panel is shifted orthogonal to the kv beam axis and a half bow-tie filter is used; resulting in a FOV of 45 cm with a length of 16 cm, as shown in Figure 5-1(d). The full-fan scan was used for head imaging due to its smaller FOV while the half-fan scan was reserved for chest and pelvis imaging. For each machine, three clinically relevant scan sites were investigated: head, chest, and pelvis. Technical settings for each scan remained unchanged from the manufacturer-installed protocols currently used at our institutions. Table 5-1 summarizes the measured half-value layers (HVLs) in aluminum, as well as the relevant scan parameters used for each protocol. From this data, it can be seen that the manufacturers have selected widely varying technical settings, even for the same anatomical sites. Anthropomorphic Phantom The anthropomorphic phantom used in this study was based on a hybrid computational model representing a 50 th percentile adult male. In this context, hybrid refers to a cross between stylized and tomographic phantoms, exploiting the advantages of each. A hybrid phantom offers the scalability of a stylized phantom while maintaining the anthropomorphic characteristics of a tomographic phantom. The hybrid model originated from a tomographic dataset of a 36-year-old Korean male (176 cm height, 73 kg weight). Using methods previously described by Lee et al. 57, 58, the tomographic dataset was imported into Rhinoceros computer software (McNeel North America, Seattle, WA) and transformed into non-uniform rational B-spline (NURBS) surfaces that could easily be manipulated. Modifications to the original dataset were done to match the anthropometric dimensions and organ masses of a 50 th percentile adult male as defined by the International Commission on Radiological Protection (ICRP) Report 89 reference data. 47 Techniques previously described in Chapter 2 were used to construct the physical phantom from this hybrid dataset in 5 mm thick slices using three tissue-equivalent materials that mimic 92
93 the dosimetric characteristics of a real human body. These materials include soft tissueequivalent substitute (STES), lung tissue-equivalent substitute (LTES), and bone tissueequivalent substitute (BTES). While the hybrid dataset included over three-hundred 5 mm thick axial slices, the lack of radiosensitive organs in the legs justified their exclusion from fabrication. For this reason, the completed phantom includes approximately 200 slices, ranging from the crown of the head to mid-thigh. The torso of the completed phantom was previously shown in Figure 2-6. It should be noted that while the phantom is pictured with arms attached, the arms were not used during data acquisition as patients are typically positioned such that their arms are not in the radiation field during treatment. To hold the phantom together during imaging, a patient immobilization vacuum bag was utilized. Dosimetry System A fiber optic coupled (FOC) dosimetry system was used for all organ dose measurements in this study. Previously described in Chapter 3, the dosimeter consists of a water-equivalent plastic scintillator (BCF-12, Saint-Gobain Crystals, Nemours, France), 500 µm in diameter and 2 mm in length, coupled to a 400 µm diameter optical fiber that is 2 m in length (400-UV, Ocean Optics Inc., Dunedin, FL). The optical fiber acts as a light guide to transmit scintillation photons to a photomultiplier tube (PMT) (H7467, Hamamatsu Corporation, Bridgewater, NJ). A second optical fiber with no scintillator, referred to as the reference fiber, was also used to account for the stem effect commonly seen in FOC dosimeters as a result of the native fluorescence of the optical fiber itself. 70, 72, 75 This reference fiber was integrated into the FOC dosimeter assembly using a single piece of heat shrink tubing which was bifurcated at its end to allow each fiber to be connected with its respective PMT. By using a reference fiber, the fluorescence of the optical fiber itself can be quantified and subtracted from the FOC dosimeter signal (which includes components from both the plastic scintillator and optical fiber fluorescence), thus leaving only 93
94 the signal from the scintillator. Coupling the optical fibers to the readout PMTs was achieved by installing a female SMA (SubMiniature version A) connector to each fiber and a male SMA connector on the face of each PMT. For clarification, a schematic detailing the components of the dosimetry system is shown in Figure 5-2. To increase the speed of data collection, a total of two FOC dosimeters were used in this study, requiring the use of four identical PMTs. To interface with this PMT array, a custom MATLAB (MathWorks Inc., Natick, MA) computer program was also developed. Calibration of the FOC dosimeters, in net counts per unit air kerma, was performed at different depths in water using a calibrated (traceable to an accredited dosimetry laboratory) 15 cm 3 pancake ion chamber and associated electrometer (chamber model 96035B, electrometer model 35050A, Keithley Instruments Inc., Cleveland, OH). The calibration was performed at several depths in order to account for the energy dependence of the dosimeter as the beam quality changes with depth due to beam hardening and the addition of a scatter component. Results indicated that the sensitivity of the dosimeter varied by approximately 5% across the depth range investigated (surface to 16 cm). Therefore, the calibration factor measured at a depth of 8 cm was chosen for all in-phantom dose measurements as it offered a compromise between the surface and deepest calibration factors relevant to the dimensions of the phantom and also minimized the uncertainty of the dose measurements due to the energy dependence of the dosimeter (i.e. ±2.5%). Using this calibration factor, the absorbed dose to soft tissue, D abs, was calculated using Equation 5-1. D C CF μ ρ net en abs = soft tissue air (5-1) 94
95 In the above equation, C net is the net counts from the dosimeter, CF is the calibration factor measured at a depth of 8 cm in net counts per unit air kerma, and μen ρ soft tissue air is the ratio of average mass energy absorption coefficients of soft tissue to air at the measured HVL. 101 The maximum uncertainty for in-phantom FOC dosimeter measurements was estimated to be approximately 4%. Contributing factors included: (1) energy dependence of ~2.5% as the beam quality varies within the phantom due to hardening and scatter; (2) angular dependence of ~2.5% averaged over an entire revolution from a normal-to-axial irradiation in a scatter medium; (3) reproducibility variation of ~1% for diagnostic level exposures; and (4) variation of ~1.5% in the dosimeters response depending on the bend radius of the optical fiber. The full characterization of the FOC dosimeter can be found in Chapter 3. Calculation of Organ Doses To achieve clinically relevant dose values, the anthropomorphic phantom was set up and imaged in a close approximation to a real patient for the particular anatomical region being treated. For head scans, the phantom was aligned with the center of the brain at isocenter of the treatment beam. For chest scans, the isocenter was placed in the center of the body at an axial plane near the center of the lungs. For pelvis scans, the center of the prostate was placed at isocenter. To ensure reproducible results, care was always taken to accurately position the phantom on each machine before beginning data acquisition. To aid in the positioning of dosimeters, organ locations were transferred onto the phantom using a permanent marker from full-scale printouts of the hybrid dataset. Thin slits were cut into the axial slices of the phantom to allow placement of both the FOC dosimeters and passage of the optical fiber that connects the scintillator to the readout PMT (see Figure 5-3). For small organs, absorbed dose values obtained near the centroid of the organ were adopted as the organ 95
96 dose. For larger organs where dose gradients are a concern, the organ was equally subdivided and dosimeters were placed near the centroid of each of these subdivisions. The average reading from all dosimeters placed in the organ was then adopted as the average organ dose. Table 5-2 lists all of the organs investigated as well as the number of measurement locations used to evaluate the dose to each organ. In order to calculate the average dose to the red bone marrow, weighting factors were applied to individual red bone marrow sites (a total of 19 points in 12 sites) based on their percent weight contribution to the total red bone marrow, as shown in Equation 5-2. (5-2) DRBM = D i abs,i Ai In the above equation, D is the absorbed dose to soft tissue at location i and is the weight abs,i A i fraction of red bone marrow located at location i. The absorbed dose to soft tissue was used to approximate the dose to the red bone marrow because the mass energy-absorption coefficient for red bone marrow is within 5% of the mass energy-absorption coefficient for soft tissue at x-rays energies greater than 30 kev. 102 Dose to the bone surface was calculated in a similar fashion using Equation 5-2, except A was replaced with E, the weight fraction of endosteum at location i i. Table 5-3 shows weight fractions of red bone marrow and endosteum used for the bone sites investigated in this study, taken from the development of the hybrid computational phantom series. 103 i The absorbed dose to lung tissue was calculated using Equation 5-3, where μen ρ lung soft tissue is the ratio of average mass energy absorption coefficients of lung tissue to soft tissue at the measured HVL
97 D lung D μ ρ en = abs lung soft tissue (5-3) The absorbed dose to skin (for the whole body) was calculated similarly using Equation 5-4, where μen ρ skin soft tissue is the ratio of average mass energy absorption coefficients of skin to soft tissue at the measured HVL 101 and area of the entire phantom. A A irradiated total is the ratio of irradiated skin area to the gross surface D skin A μ skin irradiated en = Dabs Atotal ρ soft tissue (5-4) The gross surface area of the phantom used in this study was estimated to be 1.83 m 2 using the computational model as a reference. The irradiated area was also estimated using the computational model as a reference and values of 0.12 m 2, 0.32 m 2, and 0.20 m 2 were used for the head, chest, and pelvis scans, respectively. The absorbed dose at the surface of the phantom was evaluated by placing two dosimeters in the primary field at the anterior and left lateral sides of the phantom and averaging the readings from these two dosimeters. Calculation of Effective Dose The measured organ doses along with weighting factors from the ICRP Publication 103 were used to calculate a reference male effective dose for each protocol. Equation 5-5 shows the formula recommended for evaluating the effective dose, where w T is the tissue weighting factor and H T is the equivalent dose for each organ. In this case, the equivalent dose is simply the organ dose multiplied by a radiation weighting factor of unity for x-rays. w T T T (5-5) E = H 97
98 As previously mentioned, only a male phantom was used to derive the effective dose and the weighting factors defined by the ICRP are sex averaged. Therefore, this value is not intended for use in risk estimation models based on effective dose but rather for comparing different imaging protocols and equipment presented in this study. Similar to other authors conducting effective dose calculations from organ dose measurements within anthropomorphic phantoms, the doses to two remainder organs were not measured: lymphatic nodes and muscle. 102, 104 This was due to the fact that these organs are distributed throughout the body making it technically difficult to obtain an average organ dose measurement. Additionally, both of these organs are included in the category of remainder organs, along with 11 other organs. As a result, the dose to these two organs does not contribute greatly to the overall effective dose. Therefore, the weighting factor for remainder organs was simply applied to the average dose to the other 11 remainder organs. Image Quality It should be emphasized that the doses reported in this study result from using technical imaging settings provided by the manufacturer as their installed default protocols. No attempt was made to compare doses at the same image quality, but rather at clinically relevant scan settings. Consequently, there may be differences between the image quality achieved by the different systems, which was also evaluated. A Catphan 440 (The Phantom Laboratory, Salem, NY) image quality phantom was used to assess the image quality of each CBCT system as it is used clinically. Image quality was assessed using the following Catphan modules: CTP401 slice geometry and sensitometry module and CTP592 low and high contrast resolution module. The CTP592 module has a series of high resolution test patterns ranging from 5 through 15 lp/cm which were used for visual evaluation of spatial resolution. This module also includes a series of 0.5% low contrast targets for evaluating low-contrast detectability. Unfortunately, the 0.5% low 98
99 contrast targets were designed to evaluate fan-beam CT systems and are too demanding for CBCT image quality tests. As a result, they cannot be seen in the reconstructed CBCT images. For this reason, the CTP401 module was used as a substitute to compare the low contrast detectability of each CBCT system. This module includes five acrylic spheres of varying diameters (2, 4, 6, 8, and 10 mm diameter) that have approximately 3% contrast 105 and can be seen in the reconstructed images. By visually evaluating the smallest sphere that could be seen in the reconstructed images, the CTP401 module was effectively used to illustrate the differences in low contrast detectability between the two systems. The Catphan phantom was scanned using the same clinical protocols used during organ dose measurements. All images were reconstructed at a 5 mm slice width with a matrix size of 512x512 pixels. Results The measured organ and effective doses from the XVI and OBI are shown in Tables 5-4 and 5-5, respectively. The whole body bone marrow and bone surface doses were calculated as previously discussed while the irradiated site bone marrow and bone surface doses are an average of only the bone sites in the primary field. For head scans, this includes the cranium and cervical vertebrae; for chest scans, the proximal humerus, clavicles, scapula, ribs, sternum, and thoracic vertebrae; and for pelvis scans, the os coxae, sacrum, and proximal femur. The irradiated site skin dose is an average of the dose measured from the two dosimeters placed in the primary field on the anterior and left lateral surfaces of the phantom. The results of the image quality tests are shown in Table 5-6. Resolution was evaluated by the smallest resolution test pattern that could be visualized and low contrast detectability was evaluated by the smallest acrylic sphere that could be visualized in the image quality phantom. 99
100 Head The head scan covered the brain, salivary glands, extrathoracic region, oral mucosa, and parts of the esophagus. Of all the organs, the lens of the eye received the maximum dose of 1.07 mgy for the XVI, while the brain received the maximum dose of 3.01 mgy for the OBI. Image quality was assessed through visual evaluation of the reconstructed images of the Catphan phantom. The CTP592 resolution module was used to evaluate the spatial resolution. The 8 lp/cm pattern could be visually resolved in the OBI images while none of the test patterns could be resolved in the XVI images, the largest of which was 5 lp/cm. The CTP401 module was used to evaluate low contrast detectability, with only the largest of the acrylic spheres (10 mm diameter) being visible on the OBI images; none of the spheres were visible on the XVI images. The images from the OBI were also noticeably sharper than those from the XVI. This can be seen in Figures 5-4 and 5-5 which show an example of the reconstructed images of the CTP592 and CTP401 modules, respectively. Chest The chest scan covered the lungs, breast, heart, thymus, thyroid, and parts of the esophagus, liver, stomach and spleen. The thyroid received the maximum dose of mgy for the XVI, while the breast received the maximum dose of 5.34 mgy for the OBI. Again, the OBI showed superior spatial resolution, with the 5 lp/cm pattern visible in the reconstructed images, while none of the resolution test patterns were visible on the XVI images. The OBI also showed better low contrast detectability with the 4 mm diameter acrylic sphere being visible on the OBI images; the 6 mm diameter acrylic sphere was the smallest that could be seen on the XVI images. The reconstructed OBI images again appeared sharper overall than the XVI images. 100
101 Pelvis The pelvis scan covered the prostate, bladder, testes, and parts of the small intestine and colon. The testes received the maximum dose for both systems at 29 and mgy for the XVI and OBI, respectively. The images for the pelvis protocol appeared very similar to those seen for the chest protocol, yielding similar results for resolution and low contrast detectability. The 5 lp/cm pattern could be resolved on the OBI images while none of the test patterns could be resolved on the XVI images. For low contrast detectability, the 4 mm diameter acrylic sphere was visible on the OBI images while the 6 mm diameter acrylic sphere was the smallest that could be seen on the XVI images. The reconstructed OBI images again appeared sharper overall than the XVI images. Discussion It is important to differentiate the data presented in the current study with that which can be found in current literature. Kan et al. 39 published an organ and effective dose study performed on the OBI using a female anthropomorphic phantom and TLDs. While the study provides useful dose information for the OBI, the recent release of OBI software version includes new protocols which have not yet been investigated in the literature. Previous protocols for the OBI were all at a fixed tube voltage (125 kvp) and consisted of full rotation scans. The updated OBI protocols utilize body region specific tube voltages, with lower energies for less attenuating body regions. Tube voltages include 100 kv, 110 kv, and 125 kv for the head, chest, and pelvis, respectively. Additionally, the new head protocol for the OBI utilizes only a partial rotation rather than a full rotation for image acquisition. Lastly, the tube-current time product for all OBI protocols has been reduced substantially. All of these changes result in lower patient doses, with the dose to many organs being reduced by 50% or more from previously published works utilizing earlier versions of the manufacturer installed protocols. 39 For the XVI system, there 101
102 have been very few organ dose studies published in the literature. 45, 98 Additionally, these studies report the dose to only a limited number of organs and they were performed before the release of software version 4.0, which included the introduction of new protocols and the use of bow-tie filters. While the tube-current time product has been increased with the use of the new protocols to account for the added filtration, results indicate that individual organ doses for the XVI have remained comparable to the limited studies in the literature. An interesting similarity between the XVI and OBI is the fact that they both use partial rotation scans for their head protocols (200 o and 204 o, respectively). On the XVI, image acquisition begins at the anterior surface of the patient and rotates around the left lateral side of the head, finishing posteriorly (when the patient is placed in a supine position). On the OBI, image acquisition moves from left to right lateral (or vice-versa) while rotating around the posterior surface of the patient. Due to the choice of acquisition angles, superficial organs located on the anterior surface of the head are directly irradiated during image acquisition with the XVI but not with the OBI, resulting in comparatively higher doses to some organs for the XVI. For example, the dose to the lens of the eye on the XVI system was 52% higher than the dose to a centrally located organ such as the brain while on the OBI system the dose to the lens of the eye was approximately a factor of 5 less than the dose to the brain. This result suggests modifying the manufacturer installed head protocol on the XVI such that the x-ray tube rotates around the posterior side of the head where there are no critical organs rather than the anterior side of the head which has several superficial organs of interest. The chest protocol for each system utilized a full rotation scan. However, the beam width for the XVI was larger than the OBI, 26 cm compared to 16 cm, resulting in higher doses to organs outside of the treatment volume. The thyroid was one such organ, which is included in the 102
103 larger field of view and subsequently received the highest dose of any organ during a chest scan from the XVI but was outside of the primary field on the OBI. Contributing to the thyroid dose on the XVI was also the fact that the outer body contour was smaller in this region, resulting in less attenuation of the primary beam as the tube rotated around the body. This finding suggests reducing the beam width of the XVI in future versions if the necessary information can be gained from a narrower beam width such as what is used on the OBI to avoid unnecessarily irradiating organs outside of the treatment volume. As expected, the breast received the highest dose on the OBI due to its anatomical location at the periphery of the body. The pelvis scans for each system also utilized a full rotation. Interestingly, the OBI had organ doses similar to those measured using the XVI, even though the tube-current time product was approximately a factor of 2.4 smaller. This can be attributed to the fact that the OBI has a larger beam width (16 cm compared to 12.5), resulting in additional scattered radiation, as well as a lower HVL (see HVLs in Table 5-1). As reported by Song et al., 46 the lower HVL of the OBI results in more dose being deposited per unit mas than the XVI. Additionally, the testes were completely in the primary beam of the OBI but were only partially covered by the XVI beam because of its smaller beam width, resulting in a higher gonad dose for the OBI when compared to the XVI. Similar to the case with the chest scan, the larger beam width resulted in more organs outside of the treatment volume being irradiated and an increased scatter dose inside of the scan volume. The effective dose for each scan is also shown at the bottom of Tables 5-4 and 5-5. The head scans for both the XVI and OBI had very low effective doses (0.04 and 0.12 msv, respectively) due to the fact that the most of the organs in the primary field for a head scan have low weighting factors. The chest scan yielded effective doses of 7.15 and 1.82 msv for the XVI 103
104 and OBI respectively. The higher effective dose for the XVI chest scan was due to its larger beam width, which covered more organs, and higher tube-current time product, which resulted in higher overall organ doses. The pelvis scan for each system had similar effective doses at 3.73 and 4.34 msv for the XVI and OBI, respectively. As is evident from the data presented in this study, the effective dose for each protocol was small due to the limited number of organs involved in each scan. This is especially true for the pelvis scans, where both the gonads and prostate received doses greater than 25 mgy, but most other organs received little if any dose and therefore the effective dose was on the order of only 3-4 msv. Therefore, organ doses are likely more meaningful for predicting future risk, such as organ specific disease, but the effective dose still offers a single number to compare the different protocols and equipment quickly and easily. The image analysis performed in this study quantified the observed image quality for each system and imaging protocol; supplementing the extensive dosimetry measurements performed. Again, it is important to remember that the protocols selected for this study were those recommended by the manufacturer for clinical use. When first comparing the reconstructed OBI images to the XVI images, it was readily apparent that the XVI images were not as sharp and had more artifacts (streaking and rings). As mentioned in the results, the OBI outperformed the XVI in both observed resolution and low contrast detectability for all three protocols investigated, but also delivered higher doses for two of the three protocols. However, this increased image quality did not always come at the cost of higher dose, with the chest protocol for the OBI actually yielding lower dose and better image quality. Data presented in this study shows that daily use of CBCT for patient positioning will deliver a substantial imaging dose to organs in the primary imaging field. It should be noted that 104
105 when used for daily position verification, the organ doses listed in Tables 5-4 and 5-5 must be multiplied by the total number of fractions, which can be as high as This results in organ doses exceeding 1 Gy in some cases, such as the testes, indicating that the dose from daily CBCT imaging in a high fraction therapy regimen should be taken into consideration during the treatment planning process. Conclusions A comprehensive set of organ dose measurements were performed using an anthropomorphic phantom and fiber-optic coupled dosimetry system for the two commercially available kilovoltage CBCT systems (Elekta XVI and Varian OBI). The systems were evaluated by performing organ dose and image quality measurements for three clinically relevant scan sites (head, chest, and pelvis) using the latest manufacturer installed clinical protocols. Organ dose measurements demonstrated that the XVI yielded higher doses for a chest scan while the OBI yielded higher doses for both head and pelvis scans. The dosimetric differences between these two CBCT systems are magnified over the course of a fractionated treatment with daily imaging. Specifically, the XVI chest scan delivers a dose 30 cgy higher to the lung than the OBI chest scan during a 30 fraction regimen. For head and pelvis scans, the OBI delivers a dose 6.9 cgy higher to the brain and 16.8 cgy higher to the gonads, respectively, over the course of a 30 fraction regimen. Image quality measurements demonstrated that the OBI provided superior image quality, with both better spatial resolution and low contrast detectability when using default clinical protocols. Results also showed a decrease in organ dose for the OBI when compared to previous studies which used an earlier version of the manufacturer installed clinical protocols. The new XVI protocols yielded doses similar to previously published work, despite an increase in tube-current time product and the use of bow-tie filters. In summary, the organ doses reported in this study provide practitioners a useful measure of absorbed dose from the latest 105
106 manufacturer installed CBCT imaging protocols to weigh the added benefit of improved patient positioning against the additional radiation dose of using CBCT imaging. 106
107 Table 5-1. Nominal technical settings and measured HVLs for each imaging protocol investigated. On the XVI, F0 is the designation for no filter and F1 is the designation for a full bow-tie filter. For acquisition angle, cw means clockwise and ccw means counter-clockwise as viewed from the patient table. XVI OBI Scan site Head Chest Pelvis Head Chest Pelvis kv collimator S20 M20 M kv filter F0 F1 F1 Full Half bow-tie bow-tie kvp ma ms/projection # of projections Total mas Meaured HVL (mm Al) Acquisition angle Acquisition time Axial field of view (cm) Long. field of view (cm) Half bow-tie o -190 o cw 273 o -269 o cw 273 o -269 o cw 88 o -292 o cw/ccw 88 o -92 o cw/ccw 88 o -92 o cw/ccw ~70 s ~120 s ~120 s ~30 s ~60 s ~60 s
108 Table 5-2. Organs investigated and number of measurement locations. Tissue/organ Measurement points Brain 4 Salivary glands 6 Thyroid 1 Esophagus 6 Lung 8 Breast 2 Liver 4 Stomach 4 Colon 10 Bladder 1 Gonads (testes) 2 Bone marrow 19 Bone surface 19 Skin 2 Remainder organs Extrathoracic region 4 Oral mucosa 1 Thymus 1 Heart 1 Spleen 2 Adrenals 2 Gall bladder 1 Kidneys 2 Pancreas 1 Small intestine 6 Prostate 1 Other organs Lens 2 108
109 Table 5-3. Weight fractions of red bone marrow, A i, and endosteum, E i, for various locations of interest of the 50th percentile adult male hybrid phantom. Location A i E i Cranium Cervical vertebrae Humerus-proximal Clavicles Scapula Ribs Sternum Thoracic vertebrae Lumbar vertebrae Os coxae Sacrum Femur-proximal
110 Table 5-4. Organ and effective doses from the Elekta XVI CBCT system. Measured organ doses (mgy) Tissue/organ Head scan Chest scan Pelvis scan Brain Salivary glands Thyroid Esophagus Lung Breast Liver Stomach Colon Bladder Gonads (testes) Bone marrow (whole body) Bone marrow (irradiated site) Bone surface (whole body) Bone surface (irradiated site) Skin (whole body) Skin (irradiated site) Remainder organs Extrathoracic region Oral mucosa Thymus Heart Spleen Adrenals Gall bladder Kidneys Pancreas Small intestine Prostate Other organs Lens Effective dose (msv)
111 Table 5-5. Organ and effective doses from the Varian OBI CBCT system. Measured organ doses (mgy) Tissue/organ Head scan Chest scan Pelvis scan Brain Salivary glands Thyroid Esophagus Lung Breast Liver Stomach Colon Bladder Gonads (testes) Bone marrow (whole body) Bone marrow (irradiated site) Bone surface (whole body) Bone surface (irradiated site) Skin (whole body) Skin (irradiated site) Remainder organs Extrathoracic region Oral mucosa Thymus Heart Spleen Adrenals Gall bladder Kidneys Pancreas Small intestine Prostate Other organs Lens Effective dose (msv)
112 Table 5-6. Results of image quality tests for manufacturer installed protocols. Resolution was evaluated by the smallest pattern that could be visually resolved in the CTP592 module and detectability was evaluated by the smallest acrylic sphere that could be visually resolved in the CTP401 module. Head Chest Pelvis XVI OBI XVI OBI XVI OBI Resolution > 5 lp/cm 8 lp/cm >5 lp/cm 5 lp/cm >5 lp/cm 5 lp/cm Detectability > 10 mm 10 mm 6 mm 4 mm 6 mm 4 mm 112

113 Figure 5-1. Scanning configuration for each imaging protocol used. As seen, the collimation was changed and the detector panel was shifted orthogonal to the kv beam axis when a larger FOV was required. (a) XVI head scan, no bow-tie filter, imaging panel centered, 27 cm FOV, (b) XVI chest and pelvis scan, bow-tie filter, imaging panel shifted, 41 cm FOV, (c) OBI head scan, bow-tie filter, imaging panel centered, 25 cm FOV, and (d) OBI chest and pelvis scan, half bow-tie filter, imaging panel shifted, 45 cm FOV. 113
114 114 Figure 5-2. Schematic detailing the components of the dosimetry system. It should be noted that the exterior heat shrink tubing extends past the scintillator to restrict any ambient light from entering the assembly but is not shown to aid in visualization.

. a) b) Figure 5-4.")
115 Figure 5-3. Axial slice of the physical phantom with an FOC dosimeter installed in the right kidney for dose measurements (displayed in prone position but phantom was oriented in supine position for measurements). a) b) Figure 5-4. Example of reconstructed images of CTP592 resolution phantom from both a) XVI and b) OBI systems. 115

116 a) b) Figure 5-5. Example of reconstructed images of CTP401 low contrast phantom from both a) XVI and b) OBI systems. 116
AAPM Task Group 180 Image Guidance Doses Delivered During Radiotherapy: Quantification, Management, and Reduction
 AAPM Task Group 180 Image Guidance Doses Delivered During Radiotherapy: Quantification, Management, and Reduction Parham Alaei, Ph.D. Department of Radiation Oncology University of Minnesota NCCAAPM Fall
Managing the imaging dose during Image-guided Radiotherapy. Martin J Murphy PhD Department of Radiation Oncology Virginia Commonwealth University
 Managing the imaging dose during Image-guided Radiotherapy Martin J Murphy PhD Department of Radiation Oncology Virginia Commonwealth University Radiographic image guidance has emerged as the new paradigm
Introduction. Modalities used in imaging guidance. Flat panel detector. X-ray Imaging Dose to Patients in the Era of Image-Guided Radiation Therapy
 X-ray Imaging Dose to Patients in the Era of Image-Guided Radiation Therapy George Ding, Ron Price, Charles Coffey Vanderbilt-Ingram Cancer Center Vanderbilt University Medical Center, Nashville, TN Introduction
Managing the imaging dose during image-guided radiation therapy
 Managing the imaging dose during image-guided radiation therapy Martin J Murphy PhD Department of Radiation Oncology Virginia Commonwealth University Richmond VA Imaging during radiotherapy Radiographic
IGRT1 technologies. Paweł Kukołowicz Warsaw, Poland
 IGRT1 technologies Paweł Kukołowicz Warsaw, Poland Minimal prerequisite for good, efficient radiotherapy ICTP 2015 Paweł Kukołowicz 2/29 Minimal prerequisite for good, efficient radiotherapy Well trained
Cone Beam CT Protocol Optimisation for Prostate Imaging with the Varian Radiotherapy OBI imaging system. Dr Craig Moore & Dr Tim Wood
 Cone Beam CT Protocol Optimisation for Prostate Imaging with the Varian Radiotherapy OBI imaging system Dr Craig Moore & Dr Tim Wood Background With the increasing use of CBCT imaging alongside complex
An organ and effective dose study of XVI and OBI cone-beam CT systems
 JOURNAL OF APPLIED CLINICAL MEDICAL PHYSICS, VOLUME 11, NUMBER 2, SPRING 2010 An organ and effective dose study of XVI and OBI cone-beam CT systems Daniel E. Hyer, 1a Christopher F. Serago, 2 Siyong Kim,
Quanitative and qualitative analysis of Image Quality and Imaging Dose of KV CBCT from XVI Elekta Linac.
 IOSR Journal of Applied Physics (IOSR-JAP) e-issn: 2278-4861.Volume 9, Issue 5 Ver. IV (Sep. - Oct. 2017), PP 46-52 www.iosrjournals.org Quanitative and qualitative analysis of Image Quality and Imaging
Normal tissue doses from MV image-guided radiation therapy (IGRT) using orthogonal MV and MV-CBCT
 using orthogonal MV and MV-CBCT") Received: 28 September 2017 Revised: 17 November 2017 Accepted: 28 December 2017 DOI: 10.1002/acm2.12276 RADIATION ONCOLOGY PHYSICS Normal tissue doses from MV image-guided radiation therapy (IGRT) using
Received: 28 September 2017 Revised: 17 November 2017 Accepted: 28 December 2017 DOI: 10.1002/acm2.12276 RADIATION ONCOLOGY PHYSICS Normal tissue doses from MV image-guided radiation therapy (IGRT) using
Measurement of organ dose in abdomen-pelvis CT exam as a function of ma, KV and scanner type by Monte Carlo method
 Iran. J. Radiat. Res., 2004; 1(4): 187-194 Measurement of organ dose in abdomen-pelvis CT exam as a function of ma, KV and scanner type by Monte Carlo method M.R. Ay 1, M. Shahriari 2, S. Sarkar 3, P.
Learning objective. Outline. Acknowledgements. KV CBCT Imaging Part I. R Hammoud AAPM 2008 CE-Therapy (SAM) 1
 1") 1 2 KV CBCT Imaging Part I Rabih Hammoud, MS, DABR Henry Ford Health System Detroit, Michigan Acknowledgements Indrin Chetty, PhD Teamour Nurushev, PhD Harrison Guan, PhD Jinkoo Kim, PhD JianYue Jin, PhD
1 2 KV CBCT Imaging Part I Rabih Hammoud, MS, DABR Henry Ford Health System Detroit, Michigan Acknowledgements Indrin Chetty, PhD Teamour Nurushev, PhD Harrison Guan, PhD Jinkoo Kim, PhD JianYue Jin, PhD
CURRENT CT DOSE METRICS: MAKING CTDI SIZE-SPECIFIC
 CURRENT CT DOSE METRICS: MAKING CTDI SIZE-SPECIFIC Keith Strauss, MSc, FAAPM, FACR Cincinnati Children s Hospital University of Cincinnati College of Medicine Acknowledgments John Boone, PhD Michael McNitt-Grey,
Computed tomography Acceptance testing and dose measurements
 Computed tomography Acceptance testing and dose measurements Jonas Andersson Medical Physicist, Ph.D. Department of Radiation Sciences University Hospital of Norrland, Umeå Sweden Contents The Computed
Use of Bubble Detectors to Characterize Neutron Dose Distribution in a Radiotherapy Treatment Room used for IMRT treatments
 Use of Bubble Detectors to Characterize Neutron Dose Distribution in a Radiotherapy Treatment Room used for IMRT treatments Alana Hudson *1 1 Tom Baker Cancer Centre, Department of Medical Physics, 1331
I. Equipments for external beam radiotherapy
 I. Equipments for external beam radiotherapy 5 linear accelerators (LINACs): Varian TrueBeam 6, 10 & 18 MV photons, 6-18 MeV electrons, image-guided (IGRT) and intensity modulated radiotherapy (IMRT),
Varian Edge Experience. Jinkoo Kim, Ph.D Henry Ford Health System
 Varian Edge Experience Jinkoo Kim, Ph.D Henry Ford Health System Disclosures I participate in research funded by Varian Medical Systems. Outline of Presentation Review advanced imaging in Varian Edge Linear
Stereotactic Radiosurgery. Extracranial Stereotactic Radiosurgery. Linear accelerators. Basic technique. Indications of SRS
 Stereotactic Radiosurgery Extracranial Stereotactic Radiosurgery Annette Quinn, MSN, RN Program Manager, University of Pittsburgh Medical Center Using stereotactic techniques, give a lethal dose of ionizing
Image Guided in Radiation Therapy (IGRT) Chumpot Kakanaporn Med Phys Radiation Oncology Siriraj Hospital
 Chumpot Kakanaporn Med Phys Radiation Oncology Siriraj Hospital") Image Guided in Radiation Therapy (IGRT) Chumpot Kakanaporn Med Phys Radiation Oncology Siriraj Hospital EBT Process Diagnosis Simulation Tx Planning Tx Verification Tx Delivery X-ray CT MRI NM Patho Process
Image Guided in Radiation Therapy (IGRT) Chumpot Kakanaporn Med Phys Radiation Oncology Siriraj Hospital EBT Process Diagnosis Simulation Tx Planning Tx Verification Tx Delivery X-ray CT MRI NM Patho Process
Dosimetric characterization with 62 MeV protons of a silicon segmented detector for 2D dose verifications in radiotherapy
 Dosimetric characterization with 62 MeV protons of a silicon segmented detector for 2D dose verifications in radiotherapy C. Talamonti M. Bruzzi,M. Bucciolini, L. Marrazzo, D. Menichelli University of
Chapters from Clinical Oncology
 Chapters from Clinical Oncology Lecture notes University of Szeged Faculty of Medicine Department of Oncotherapy 2012. 1 RADIOTHERAPY Technical aspects Dr. Elemér Szil Introduction There are three possibilities
Linac or Non-Linac Demystifying And Decoding The Physics Of SBRT/SABR
 Linac or Non-Linac Demystifying And Decoding The Physics Of SBRT/SABR PhD, FAAPM, FACR, FASTRO Department of Radiation Oncology Indiana University School of Medicine Indianapolis, IN, USA Indra J. Das,
IMRT QUESTIONNAIRE. Address: Physicist: Research Associate: Dosimetrist: Responsible Radiation Oncologist(s)
") IMRT QUESTIONNAIRE Institution: Date: / / Address: Physicist: e-mail: Telephone: Fax: Research Associate: email: Telephone: Fax: Dosimetrist: email: Telephone: Fax: Responsible Radiation Oncologist(s)
IMRT QUESTIONNAIRE Institution: Date: / / Address: Physicist: e-mail: Telephone: Fax: Research Associate: email: Telephone: Fax: Dosimetrist: email: Telephone: Fax: Responsible Radiation Oncologist(s)
Lung Spine Phantom. Guidelines for Planning and Irradiating the IROC Spine Phantom. MARCH 2014
 Lung Spine Phantom Guidelines for Planning and Irradiating the IROC Spine Phantom. MARCH 2014 The study groups are requesting that each institution keep the phantom for no more than 2 week. During this
Eric E. Klein, Ph.D. Chair of TG-142
 Eric E. Klein, Ph.D. Chair of TG-142 Professor of Radiation Oncology Washington University St. Louis, MO 2010 AAPM Annual Meeting Med. Phys. 21(4) 1994 Performance-based, comprehensive guidelines for preventing
PHYS 383: Applications of physics in medicine (offered at the University of Waterloo from Jan 2015)
") PHYS 383: Applications of physics in medicine (offered at the University of Waterloo from Jan 2015) Course Description: This course is an introduction to physics in medicine and is intended to introduce
PHYS 383: Applications of physics in medicine (offered at the University of Waterloo from Jan 2015) Course Description: This course is an introduction to physics in medicine and is intended to introduce
Future upcoming technologies and what audit needs to address
 Future upcoming technologies and what audit needs to address Dr R.I MacKay History of audit Absolute dose - Simple phantom standard dose measurement Point doses in beams - Phantoms of relatively simple
Imaging of Scattered Radiation for Real Time Tracking of Tumor Motion During Lung SBRT
 Imaging of Scattered Radiation for Real Time Tracking of Tumor Motion During Lung SBRT April 25 nd, 2015 Lung Cancer Lung cancer is the most lethal cancer: Over 224,000 new diagnoses in the U.S. predicted
Intensity-Modulated and Image- Guided Radiation Treatment. Outline. Conformal Radiation Treatment
 Intensity-Modulated and Image- Guided Radiation Treatment J. Daniel Bourland, PhD Professor Departments of Radiation Oncology, Physics, and Biomedical Engineering Wake Forest University School of Medicine
Varian Acuity BrachyTherapy Suite One Room Integrated Image-Guided Brachytherapy
 Varian Acuity BrachyTherapy Suite One Room Integrated Image-Guided Brachytherapy The Acuity BrachyTherapy Suite Integrating Imaging, Planning, and Treatment in a Single Room Each component draws on the
A VMAT PLANNING SOLUTION FOR NECK CANCER PATIENTS USING THE PINNACLE 3 PLANNING SYSTEM *
 Romanian Reports in Physics, Vol. 66, No. 2, P. 401 410, 2014 A VMAT PLANNING SOLUTION FOR NECK CANCER PATIENTS USING THE PINNACLE 3 PLANNING SYSTEM * M. D. SUDITU 1,2, D. ADAM 1,2, R. POPA 1,2, V. CIOCALTEI
IMRT/IGRT Patient Treatment: A Community Hospital Experience. Charles M. Able, Assistant Professor
 IMRT/IGRT Patient Treatment: A Community Hospital Experience Charles M. Able, Assistant Professor Disclosures I have no research support or financial interest to disclose. Learning Objectives 1. Review
8/2/2017. Objectives. Disclosures. Clinical Implementation of an MR-Guided Treatment Unit
 MR-Linac is a research programme. It is not available for sale and its future availability cannot be guaranteed 8/2/2017 Clinical Implementation of an MR-Guided Treatment Unit Geoffrey S. Ibbott, Ph.D.
CT Dosimetry in the Clinical Environment: Methods and Analysis
 CT Dosimetry in the Clinical Environment: Methods and Analysis Manuel Arreola, Ph.D. DABR Associate Chair of Radiology Director, Medical Physics Graduate Program Department of Radiology University of Florida
Measurement of Dose to Critical Structures Surrounding the Prostate from. Intensity-Modulated Radiation Therapy (IMRT) and Three Dimensional
 and Three Dimensional") Measurement of Dose to Critical Structures Surrounding the Prostate from Intensity-Modulated Radiation Therapy (IMRT) and Three Dimensional Conformal Radiation Therapy (3D-CRT); A Comparative Study Erik
Measurement of Dose to Critical Structures Surrounding the Prostate from Intensity-Modulated Radiation Therapy (IMRT) and Three Dimensional Conformal Radiation Therapy (3D-CRT); A Comparative Study Erik
Credentialing for the Use of IGRT in Clinical Trials
 Credentialing for the Use of IGRT in Clinical Trials James M. Galvin, DSc Thomas Jefferson University Hospital Jefferson Medical College Philadelphia, PA and The Radiation Therapy Oncology Group RADIATION
ADVANCES IN RADIATION TECHNOLOGIES IN THE TREATMENT OF CANCER
 ADVANCES IN RADIATION TECHNOLOGIES IN THE TREATMENT OF CANCER Bro. Dr. Collie Miller IARC/WHO Based on trends in the incidence of cancer, the International Agency for Research on Cancer (IARC) and WHO
Collapsed Cone Convolution 2D illustration
 Collapsed Cone Convolution 2D illustration 8 cones Energy desposition decreases very quickly with distance Energy is absorber in blue pixels only. IGRT1 technologies Paweł Kukołowicz Warsaw, Poland IGRT
UNIVERSITY OF WISCONSIN-LA CROSSE Graduate Studies
 UNIVERSITY OF WISCONSIN-LA CROSSE Graduate Studies A SINGLE INSTITUTION S EXPERIENCE IN DEVELOPING A PURPOSEFUL AND EFFICIENT OFF-LINE TECHNIQUE FOR ADAPTIVE RADIOTHERAPY IN A CLINICAL ENVIRONMENT A Research
Outline. Chapter 12 Treatment Planning Combination of Beams. Opposing pairs of beams. Combination of beams. Opposing pairs of beams
 Chapter 12 Treatment Planning Combination of Beams Radiation Dosimetry I Text: H.E Johns and J.R. Cunningham, The physics of radiology, 4 th ed. http://www.utoledo.edu/med/depts/radther Outline Combination
A TREATMENT PLANNING STUDY COMPARING VMAT WITH 3D CONFORMAL RADIOTHERAPY FOR PROSTATE CANCER USING PINNACLE PLANNING SYSTEM *
 Romanian Reports in Physics, Vol. 66, No. 2, P. 394 400, 2014 A TREATMENT PLANNING STUDY COMPARING VMAT WITH 3D CONFORMAL RADIOTHERAPY FOR PROSTATE CANCER USING PINNACLE PLANNING SYSTEM * D. ADAM 1,2,
MAX-HD SRS PHANTOM THE COMPREHENSIVE END-TO-END SRS PHANTOM SCAN PLAN LOCALIZE TREAT. distributed by:
 SRS PHANTOM SCAN PLAN LOCALIZE TREAT THE COMPREHENSIVE END-TO-END SRS PHANTOM distributed by: Tel: +33 (0) 42 88 68 41 info@orion-france.com www.orion-france.com 2, Avenue du General Balfourier 75016 Paris,
Presentation Outline. Patient Setup Imaging in RT: Getting the Most Bang for your Buck. Main Errors in RT. Hypothetical Patient Examples
 Patient Setup Imaging in RT: Getting the Most Bang for your Buck Olivier Morin, PhD UC SF Comprehensive Cancer Center San Francisco, CA Presentation Outline Errors in RT. Radiographic films in RT. On-board
IROC Lung Phantom 3D CRT / IMRT. Guidelines for Planning and Irradiating the IROC Lung Phantom. Revised Dec 2015
 IROC Lung Phantom 3D CRT / IMRT Guidelines for Planning and Irradiating the IROC Lung Phantom. Revised Dec 2015 The IROC requests that each institution keep the phantom for no more than 2 weeks. During
In-Room Radiographic Imaging for Localization
 In-Room Radiographic Imaging for Localization Fang-Fang Yin, Zhiheng Wang, Sua Yoo, Devon Godfrey, Q.-R. Jackie Wu Department of Radiation Oncology Duke University Medical Center Durham, North Carolina
Leila E. A. Nichol Royal Surrey County Hospital
 2 nd UK and Ireland Dosimetry Check User Meeting Symposium Clatterbridge Cancer Centre, 24 th October 2012 Leila E. A. Nichol Royal Surrey County Hospital Leila.Nichol@nhs.net *My experience with Dosimetry
IROC Liver Phantom. Guidelines for Planning and Irradiating the IROC Liver Phantom. Revised July 2015
 IROC Liver Phantom Guidelines for Planning and Irradiating the IROC Liver Phantom. Revised July 2015 The study groups are requests that each institution keep the phantom for no more than 2 weeks. During
An anthropomorphic head phantom with a BANG polymer gel insert for dosimetric evaluation of IMRT treatment delivery
 An anthropomorphic head phantom with a BANG polymer gel insert for dosimetric evaluation of IMRT treatment delivery G. Ibbott a, M. Beach a, M. Maryanski b a M.D. Anderson Cancer Center, Houston, Texas,
Stereotaxy. Outlines. Establishing SBRT Program: Physics & Dosimetry. SBRT - Simulation. Body Localizer. Sim. Sim. Sim. Stereotaxy?
 Establishing SBRT Program: Physics & Dosimetry Lu Wang, Ph.D. Radiation Oncology Department Fox Chase Cancer Center Outlines Illustrate the difference between SBRT vs. CRT Introduce the major procedures
SBRT fundamentals. Outline 8/2/2012. Stereotactic Body Radiation Therapy Quality Assurance Educational Session
 Stereotactic Body Radiation Therapy Quality Assurance Educational Session J Perks PhD, UC Davis Medical Center, Sacramento CA SBRT fundamentals Extra-cranial treatments Single or small number (2-5) of
Non-target dose from radiotherapy: Magnitude, Evaluation, and Impact. Stephen F. Kry, Ph.D., D.ABR.
 Non-target dose from radiotherapy: Magnitude, Evaluation, and Impact Stephen F. Kry, Ph.D., D.ABR. Goals Compare out-of-field doses from various techniques Methods to reduce out-of-field doses Impact of
Treatment Planning Evaluation of Volumetric Modulated Arc Therapy (VMAT) for Craniospinal Irradiation (CSI)
 for Craniospinal Irradiation (CSI)") Treatment Planning Evaluation of Volumetric Modulated Arc Therapy (VMAT) for Craniospinal Irradiation (CSI) Tagreed AL-ALAWI Medical Physicist King Abdullah Medical City- Jeddah Aim 1. Simplify and standardize
Treatment Planning Evaluation of Volumetric Modulated Arc Therapy (VMAT) for Craniospinal Irradiation (CSI) Tagreed AL-ALAWI Medical Physicist King Abdullah Medical City- Jeddah Aim 1. Simplify and standardize
Calculation of Effective Doses for Radiotherapy Cone-Beam CT and Nuclear Medicine Hawkeye CT Laura Sawyer
 Calculation of Effective Doses for Radiotherapy Cone-Beam CT and Nuclear Medicine Hawkeye CT Laura Sawyer Department of Medical Physics and Bioengineering, Royal United Hospital, Bath Overview Varian Acuity
SHIELDING TECHNIQUES FOR CURRENT RADIATION THERAPY MODALITIES
 SHIELDING TECHNIQUES FOR CURRENT RADIATION THERAPY MODALITIES MELISSA C. MARTIN, M.S., FACR, FAAPM PRESIDENT AAPM - 2017 PRESIDENT - THERAPY PHYSICS INC., GARDENA, CA MELISSA@THERAPYPHYSICS.COM AAPM Spring
Implementation of full/half bowtie filter models in a commercial treatment planning system for kilovoltage cone-beam CT dose estimations
 JOURNAL OF APPLIED CLINICAL MEDICAL PHYSICS, VOLUME 17, NUMBER 2, 2016 Implementation of full/half bowtie filter models in a commercial treatment planning system for kilovoltage cone-beam CT dose estimations
FROM ICARO1 TO ICARO2: THE MEDICAL PHYSICS PERSPECTIVE. Geoffrey S. Ibbott, Ph.D. June 20, 2017
 FROM ICARO1 TO ICARO2: THE MEDICAL PHYSICS PERSPECTIVE Geoffrey S. Ibbott, Ph.D. June 20, 2017 1 DISCLOSURES My institution holds Strategic Partnership Research Agreements with Varian, Elekta, and Philips
Measurement of Dose to Implanted Cardiac Devices in Radiotherapy Patients
 Measurement of Dose to Implanted Cardiac Devices in Radiotherapy Patients Moyed Miften, PhD Professor and Chief Physicist University of Colorado Chester Reft, PhD Associate Professor University of Chicago
Can we deliver the dose distribution we plan in HDR-Brachytherapy of Prostate Cancer?
 Can we deliver the dose distribution we plan in HDR-Brachytherapy of Prostate Cancer? Dimos Baltas Dept. of Medical Physics & Engineering, Strahlenklinik, Klinikum Offenbach GmbH 63069 Offenbach, Germany
SOMATOM Drive System Owner Manual Dosimetry and imaging performance report
 www.siemens.com/healthcare SOMATOM Drive System Owner Manual Dosimetry and imaging performance report Table of contents 1 Dosimetry and imaging performance report 5 1.1 Dose information 5 1.1.1 General
Intensity Modulated Radiation Therapy: Dosimetric Aspects & Commissioning Strategies
 Intensity Modulated Radiation Therapy: Dosimetric Aspects & Commissioning Strategies ICPT School on Medical Physics for Radiation Therapy Justus Adamson PhD Assistant Professor Department of Radiation
Verification of treatment planning system parameters in tomotherapy using EBT Radiochromic Film
 Verification of treatment planning system parameters in tomotherapy using EBT Radiochromic Film E.B.Rajmohan¹, Pratik Kumar¹, Bhudatt Paliwal,² David Westerly², N.Gopishankar³, R.K.Bisht³, D.Tewatia²,
In-Room Radiographic Imaging for Localization
 In-Room Radiographic Imaging for Localization Fang-Fang Yin, Zhiheng Wang, Sua Yoo, Devon Godfrey, Q.-R. Jackie Wu Department of Radiation Oncology Duke University Medical Center Durham, North Carolina
Subject: Image-Guided Radiation Therapy
 04-77260-19 Original Effective Date: 02/15/10 Reviewed: 01/25/18 Revised: 01/01/19 Subject: Image-Guided Radiation Therapy THIS MEDICAL COVERAGE GUIDELINE IS NOT AN AUTHORIZATION, CERTIFICATION, EXPLANATION
Unrivaled, End-to-End
 PHANTOMS Unrivaled, End-to-End Stereotactic QA Industry-leading 0.1mm accuracy minimizes errors at each link in the stereotactic quality assurance chain. Stereotactic radiosurgery (SRS) is governed by
Advanced Technology Consortium (ATC) Credentialing Procedures for 3D Conformal Therapy Protocols 3D CRT Benchmark*
 Credentialing Procedures for 3D Conformal Therapy Protocols 3D CRT Benchmark*") Advanced Technology Consortium (ATC) Credentialing Procedures for 3D Conformal Therapy Protocols 3D CRT Benchmark* Purpose: To evaluate an institution s 3D treatment planning process and the institution
Advanced Technology Consortium (ATC) Credentialing Procedures for 3D Conformal Therapy Protocols 3D CRT Benchmark* Purpose: To evaluate an institution s 3D treatment planning process and the institution
Understanding Radiation Therapy. For Patients and the Public
 Understanding Radiation Therapy For Patients and the Public Introduction to Radiation Oncology Radiation has been an effective tool for treating cancer for more than 100 years. Radiation oncologists are
Spatially Fractionated Radiation Therapy: GRID Sponsored by.decimal Friday, August 22, Pamela Myers, Ph.D.
 Spatially Fractionated Radiation Therapy: GRID Sponsored by.decimal Friday, August 22, 2014 Pamela Myers, Ph.D. Introduction o o o o o Outline GRID compensator Purpose of SFRT/GRID therapy Fractionation
Implementing New Technologies for Stereotactic Radiosurgery and Stereotactic Body Radiation Therapy
 Implementing New Technologies for Stereotactic Radiosurgery and Stereotactic Body Radiation Therapy Implementation of radiosurgery and SBRT requires a fundamentally sound approach Errors don t blur out
SRS Uncertainty: Linac and CyberKnife Uncertainties
 SRS Uncertainty: Linac and CyberKnife Uncertainties Sonja Dieterich, PhD Linac/CyberKnife Technological Uncertainties 1 Linac Mechanical/Radiation Isocenters Depuydt, Tom, et al. "Computer aided analysis
ESTABLISHING DRLs in PEDIATRIC CT. Keith Strauss, MSc, FAAPM, FACR Cincinnati Children s Hospital University of Cincinnati College of Medicine
 ESTABLISHING DRLs in PEDIATRIC CT Keith Strauss, MSc, FAAPM, FACR Cincinnati Children s Hospital University of Cincinnati College of Medicine CT Dose Indices CTDI INTRODUCTION CTDI 100, CTDI w, CTDI vol
Joint ICTP/IAEA Advanced School on Dosimetry in Diagnostic Radiology and its Clinical Implementation May 2009
 2033-4 Joint ICTP/ Advanced School on Dosimetry in Diagnostic Radiology and its Clinical Implementation 11-15 May 2009 Dosimetry for General Radiology and Clinical Uncertainty Peter Homolka EFOMP Training
A Comparison of IMRT and VMAT Technique for the Treatment of Rectal Cancer
 A Comparison of IMRT and VMAT Technique for the Treatment of Rectal Cancer Tony Kin Ming Lam Radiation Planner Dr Patricia Lindsay, Radiation Physicist Dr John Kim, Radiation Oncologist Dr Kim Ann Ung,
TLD as a tool for remote verification of output for radiotherapy beams: 25 years of experience
 IAEA-CN-96-82 TLD as a tool for remote verification of output for radiotherapy beams: 25 years of experience J. Francisco Aguirre, Ramesh C. Tailor, Geoffrey S. Ibbott, Marilyn Stovall and William F. Hanson
Toshiba Aquillion 64 CT Scanner. Phantom Center Periphery Center Periphery Center Periphery
 Comparison of radiation dose and imaging performance for the standard Varian x-ray tube and the Richardson Healthcare ALTA750 replacement tube for the Toshiba Aquillion CT scanners. by Robert L. Dixon,
Simple methods to reduce patient dose in a Varian cone beam CT system for delivery verification in pelvic radiotherapy
 The British Journal of Radiology, 82 (2009), 855 859 SHORT COMMUNICATION Simple methods to reduce patient dose in a Varian cone beam CT system for delivery verification in pelvic radiotherapy 1 P ROXBY,
RPC Liver Phantom Highly Conformal Stereotactic Body Radiation Therapy
 RPC Liver Phantom Highly Conformal Stereotactic Body Radiation Therapy Guidelines for Planning and Irradiating the RPC Liver Phantom. Revised Dec 2005 Credentialing for this protocol requires four steps:
Performance Evaluation of Calypso (R) 4D Localization and Kilovoltage Image Guidance Systems for Interfraction Motion Management of Prostate Patients
 4D Localization and Kilovoltage Image Guidance Systems for Interfraction Motion Management of Prostate Patients") Performance Evaluation of Calypso (R) 4D Localization and Kilovoltage Image Guidance Systems for Interfraction Motion Management of Prostate Patients Tomi Ogunleye, Emory University Peter J Rossi, Emory
Performance Evaluation of Calypso (R) 4D Localization and Kilovoltage Image Guidance Systems for Interfraction Motion Management of Prostate Patients Tomi Ogunleye, Emory University Peter J Rossi, Emory
Introduction. Measurement of Secondary Radiation for Electron and Proton Accelerators. Introduction - Photons. Introduction - Neutrons.
 Measurement of Secondary Radiation for Electron and Proton Accelerators D. Followill, Ph.D. Radiological Physics Center U. T. M. D. Anderson Cancer Center Introduction Patients undergoing radiation therapy
A Patient s Guide to SRS
 A Patient s Guide to SRS Stereotactic Radiosurgery 230 Nebraska St. Sioux City, IA 51101 NOTES 230 Nebraska St. Sioux City, IA 51101 Contents page Introduction 1 SRS and how it works 2 The technology involved
CHAPTER 5. STUDY OF ANGULAR RESPONSE OF asi 1000 EPID AND IMATRIXX 2-D ARRAY SYSTEM FOR IMRT PATIENT SPECIFIC QA
 CHAPTER 5 STUDY OF ANGULAR RESPONSE OF asi 1000 EPID AND IMATRIXX 2-D ARRAY SYSTEM FOR IMRT PATIENT SPECIFIC QA 5.1 Introduction With the advent of new techniques like intensity modulated radiotherapy
RADIATION ONCOLOGY RESIDENCY PROGRAM Competency Evaluation of Resident
 Resident s Name: RADIATION ONCOLOGY RESIDENCY PROGRAM Competency Evaluation of Resident Rotation: PHYS 703: Clinical Rotation 2 Inclusive dates of rotation: Feb. 26, 2016 Aug. 25, 2016 Director or Associate
Helical Tomotherapy Experience. TomoTherapy Whole Brain Head & Neck Prostate Lung Summary. HI-ART TomoTherapy System. HI-ART TomoTherapy System
 The Challenges Associated with Differential Dose Delivery using IMRT Chester Ramsey, Ph.D. Director of Medical Physics Thompson Cancer Center Knoxville, Tennessee, U.S.A Collaborators Chester Ramsey, Ph.D.
D DAVID PUBLISHING. Uncertainties of in vivo Dosimetry Using Semiconductors. I. Introduction. 2. Methodology
 Journal of Life Sciences 9 (2015) 120-126 doi: 10.17265/1934-7391/2015.03.005 D DAVID PUBLISHING Uncertainties of in vivo Dosimetry Using Semiconductors Zeina Al Kattar, Hanna El Balaa and Saeed Zahran
Practical Reference Dosimetry Course April 2015 PRDC Program, at a glance. Version 1.0. Day 1 Day 2 Day 3 Day 4
 Practical Reference Dosimetry Course 21-24 April 2015 PRDC 2015 Program, at a glance Version 1.0 Day 1 Day 2 Day 3 Day 4 Quantities and Units Free air chambers Uncertainties Brachytherapy traceability
Measurements of Air Kerma Index in Computed Tomography: A comparison among methodologies
 Measurements of Air Kerma Index in Computed Tomography: A comparison among methodologies Thêssa C. Alonso 1, 2, Arnaldo P. Mourão 1, 3, Teógenes A. Da Silva 1, 2 1 Program of Nuclear Science and Techniques
State of the art and future development for standardized estimation of organ doses in CT
 State of the art and future development for standardized estimation of organ doses in CT March 2015 William J. O Connel, Dr. Ph, Senior Medical Physicist Imagination at work. Agenda Introduction Duke Florida
Dosimetric Analysis of 3DCRT or IMRT with Vaginal-cuff Brachytherapy (VCB) for Gynaecological Cancer
 for Gynaecological Cancer") Dosimetric Analysis of 3DCRT or IMRT with Vaginal-cuff Brachytherapy (VCB) for Gynaecological Cancer Tan Chek Wee 15 06 2016 National University Cancer Institute, Singapore Clinical Care Education Research
Dosimetric Analysis of 3DCRT or IMRT with Vaginal-cuff Brachytherapy (VCB) for Gynaecological Cancer Tan Chek Wee 15 06 2016 National University Cancer Institute, Singapore Clinical Care Education Research
EORTC Member Facility Questionnaire
 Page 1 of 9 EORTC Member Facility Questionnaire I. Administrative Data Name of person submitting this questionnaire Email address Function Phone Institution Address City Post code Country EORTC No Enter
IMRT - the physician s eye-view. Cinzia Iotti Department of Radiation Oncology S.Maria Nuova Hospital Reggio Emilia
 IMRT - the physician s eye-view Cinzia Iotti Department of Radiation Oncology S.Maria Nuova Hospital Reggio Emilia The goals of cancer therapy Local control Survival Functional status Quality of life Causes
An Update of VirtualDose Software Used for Assessing Patient Organ Doses from CT Examinations
 An Update of VirtualDose Software Used for Assessing Patient Organ Doses from CT Examinations Aiping Ding, X. George Xu Rensselaer Polytechnic Institute Troy, NY USA http://rrmdg.rpi.edu 1 Acknowledgements
Treatment Planning & IGRT Credentialing for NRG SBRT Trials
 Treatment Planning & IGRT Credentialing for NRG SBRT Trials Hania Al Hallaq, Ph.D. Department of Radiation & Cellular Oncology The University of Chicago Learning Objectives Explain rationale behind credentialing
8/2/2012. Transitioning from 3D IMRT to 4D IMRT and the Role of Image Guidance. Part II: Thoracic. Peter Balter, Ph.D.
 8/2/2012 Transitioning from 3D IMRT to 4D IMRT and the Role of Image Guidance Part II: Thoracic Peter Balter, Ph.D. Disclosure Dr. Balter is Physics PI on a trial comparing Cyberknife based SBRT with surgery,
CALCULATION OF OPTIMAL MARGINS BETWEEN CLINICAL TARGET VOLUME (CTV) AND PLANNING TARGET VOLUME (PTV)
 AND PLANNING TARGET VOLUME (PTV)") Available online at http://www.journalijdr.com ISSN: 2230-9926 International Journal of Development Research Vol. 07, Issue, 10, pp.15773-15779, October, 2017 ORIGINAL RESEARCH ARTICLE ORIGINAL RESEARCH
Available online at http://www.journalijdr.com ISSN: 2230-9926 International Journal of Development Research Vol. 07, Issue, 10, pp.15773-15779, October, 2017 ORIGINAL RESEARCH ARTICLE ORIGINAL RESEARCH
Herlev radiation oncology team explains what MRI can bring
 Publication for the Philips MRI Community Issue 46 2012/2 Herlev radiation oncology team explains what MRI can bring The radiotherapy unit at Herlev University Hospital investigates use of MRI for radiotherapy
Technical Study. Institution University of Texas Health San Antonio. Location San Antonio, Texas. Medical Staff. Daniel Saenz. Niko Papanikolaou.
 Technical Study Stereotactic Radiosurgery with Elekta Versa HD and Monaco Accuracy of a single isocenter, multiple brain metastases VMAT plan delivered to a pseudo-patient dosimetric gel phantom Institution
Image Registration for Radiation Therapy Applications: Part 2: In-room Volumetric Imaging
 Image Registration for Radiation Therapy Applications: Part 2: In-room Volumetric Imaging Peter Balter Ph.D University of Texas M.D. Anderson Cancer Center Houston, TX, USA Disclosure Information Peter
Dosimetric study of 2D ion chamber array matrix for the modern radiotherapy treatment verification
 JOURNAL OF APPLIED CLINICAL MEDICAL PHYSICS, VOLUME 11, NUMBER 2, SPRING 2010 Dosimetric study of 2D ion chamber array matrix for the modern radiotherapy treatment verification Sathiyan Saminathan, a Ravikumar
CyberKnife Technology in Ablative Radiation Therapy. Jun Yang PhD Cyberknife Center of Philadelphia Drexel University Jan 2017
 CyberKnife Technology in Ablative Radiation Therapy Jun Yang PhD Cyberknife Center of Philadelphia Drexel University Jan 2017 Objectives Components and work flow of CyberKnife Motion management of CyberKnife
A new geometric and mechanical verification device for medical LINACs
 JOURNAL OF APPLIED CLINICAL MEDICAL PHYSICS, VOLUME 3, NUMBER 2, SPRING 2002 A new geometric and mechanical verification device for medical LINACs Keith T. Welsh,* Robert A. Wlodarczyk, and L. E. Reinstein
Radiosurgery. Most Important! 8/2/2012. Stereotactic Radiosurgery: State of the Art Technology and Implementation Linear Accelerator Radiosurgery
 Therapy SAM Symposium: WE-A-BRCD-1 Stereotactic Radiosurgery: State of the Art Technology and Implementation Linear Accelerator Radiosurgery Kamil M. Yenice, PhD Associate Professor Chief of Clinical Physics
Accuracy Requirements and Uncertainty Considerations in Radiation Therapy
 Departments of Oncology and Medical Biophysics Accuracy Requirements and Uncertainty Considerations in Radiation Therapy Introduction and Overview 6 August 2013 Jacob (Jake) Van Dyk Conformality 18 16