Numerous hypothesis tests were performed in this study. To reduce the false positive due to
|
|
|
- Damian Fitzgerald
- 5 years ago
- Views:
Transcription
1 Two alternative data-splitting Numerous hypothesis tests were performed in this study. To reduce the false positive due to multiple testing, we are not only seeking the results with extremely small p values but also those that can be robustly found in different subsets of our dataset. To do so, we split our dataset into the discovery and validation sets as shown in Table 1. Furthermore, we performed additional two data-splitting on the same dataset. The results shown in the main text are from the original datasplitting. Presented here in Supporting Information were those from the two alternative datasplitting. The results from three data-splitting showed consistent patterns. (Tables S1-S3) Therefore, it is unlikely that our report is simply chance aberration due to particular split. Analyses of batch effect During the data preprocessing, normalization with consideration of the batch effect was performed. Even so, the association between the batch and cigarette smoking may still potentially exert undue confounding effects. Because of that, we performed the analyses with adjustment of the batch effect in the genome-wide analyses and focal copy number analyses. The corresponding analyses to Figure 1A and 1B and those to Figure 1C and 1D were shown in Tables S4 and S5, respectively. For the focal copy number-smoking association, 1,000 loci were randomly selected to perform both batch-adjusted and unadjusted analyses. P values from the two analyses were compared to see whether they follow similar distributions. Such comparisons were made for both single-marker analyses (Figure S1A) and 10-marker analyses (Figure S1B). Overall, the analyses adjusted for the batch effect did not change the pattern of the results and our conclusions.
2 Multiple-marker analyses of cigarette smoking and copy number: whole-genome, chromosome, and 10-marker focal locus We developed three methods to test the genome-wide or chromosome/arm-specific copy number patterns between heavy and light/non-smokers and one method to test the association of the chromosome/arm-specific or focal CNs and smoking pack-years. First, we calculated the total events of copy number gains and losses and compared them between the two smoking groups by the two-sided t test, which provides a convenient summary index but collapses CNAs information over the genomic locations. The second method is to apply two-sample tests for continuous copy number by calculating the standardized difference of two average copy numbers for each locus as: c i m1 i m2i v1 i n1 v2i n2 where m ji and v ji is the estimated mean and variance, respectively, of copy number for group j at locus i, and n j is the sample size in group j. We summed up c 2 i over i across the loci in the arm of a chromosome to calculate the observed total standardized squared difference (C observed ). By permuting the two groups and carrying out the above procedure for 10,000 times, we obtained a non-parametric null distribution (C null ). Then p values were obtained by comparing C observed and C null. This permutation procedure provides a valid global test for the overall difference by accounting for multiple comparisons and correlation of CNAs between different loci. The third is a similar method extended to the discrete variable of CNAs (CN 2.7 or not; CN 1.3 or not) as mentioned above, but with advantage of testing gains and losses separately. We applied two-sample tests for binomial data by calculating the standardized difference of two d p 1 p n where p ji is the 1 p p p n p 1 proportions for each locus as: i i 2i 1i 1i 1 2i 2i 2
3 estimated proportion (stabilized by adding 0.5 in the numerator) of CN gains (or losses) for group j at locus i and n j is the sample size in group j. We summed up d 2 i over i across the arm of a chromosome to calculate the observed total standardized squared difference (D observed ). Nonparametric null distribution (D null ) was approximated by 10,000 permutations, and p values were obtained by comparing D observed and D null. The above three methods require the smoking exposure to be dichotomized. To fully capture the continuous dose-response relationship between copy numbers and pack-years of cigarette smoking, we also developed a test to summarize such association in a chromosome/arm-specific fashion. We obtained the test statistics, F observed fi where f i is i the F statistics of regressing continuous copy numbers on the smoking pack-years (square-root transformed) up to the quadratic term at locus i. Again, the non-parametric null distribution (F null ) was generated by 10,000 permutations and p values were obtained as the tail probability of F observed in F null. The proposed test is equivalent to the powerful score test for testing the variance of coefficients in a multivariate regression by assuming regression coefficients have an arbitrary distribution with mean 0 and variance τ (1), in which copy numbers of a region or chromosome (as a vector) are regressed on smoking pack-years. The null hypothesis of our proposed test is that all the coefficients relating pack-years to copy numbers are zero, or equivalently, copy numbers at all loci have no association with smoking pack-years, which is equivalent to H 0 : τ=0. The alternative hypothesis would be that copy numbers at some loci have association with smoking pack-years. This variance component test is a powerful test by borrowing information
4 in multiple markers and effectively accounting for correlation among the CNVs in a marker set, and reducing the degrees of freedom of the test. To investigate the association of focal copy numbers and smoking pack-years, we analyzed copy number >2 and 2 separately. Two outliers (>2.5 standard deviations) of smoking pack-years were excluded to eliminate the potential spurious result driven by them. Square root was taken for smoking pack-years to transform a right skewed distribution into an approximately normal distribution.(2) Both multiple-marker and single-marker analyses were performed. In the multiple-marker analyses, we grouped the consecutive ten SNPs (markers) as a set and calculated F observed and F null by the methods mentioned above to obtain the p values for each set of markers. For those with F observed much greater than F null (from 10,000 permutations), the null distributions were obtained by the Satterthwaite approximation(3,4), in which the first two moments of scaled χ 2 distribution were matched with those of F null. In total, we performed 25,655 hypothesis tests for copy number >2 and 2 separately. Such multiple-marker analyses had better statistical power than the single-marker analyses when the markers were correlated, which is the case in the copy number data. Single-marker analyses of cigarette smoking and focal copy number: the dichotomous version We also pursued the single-marker analyses in a dichotomous fashion. We tabulated the copy numbers ( 2.7 vs for gains; 1.3 vs for losses) and smoking pack-years (>60 vs. 60) and tested its association by Fisher exact test for 256,554 loci. Logistic regressions were also performed with adjustment of age at diagnosis, gender, two cohorts, clinical stage and histology. The dichotomous-version analyses show that copy number gains in 15 loci and copy
5 number losses in 6 loci are associated with the heavy smoking. (Figure S9A and Table S7) These candidate loci were clustered in 8q24, 12q21, 12q23 and 17q22 (Figures S9B-E) for gains and 8p12 and 8p23 for losses (Figures S9F and G). References 1. Liu D, Lin X, & Ghosh D (2007) Semiparametric regression of multidimensional genetic pathway data: least-squares kernel machines and linear mixed models Biometrics 63, Zhou W, Liu G, Park S, Wang Z, Wain JC, et al. (2005) Gene-smoking interaction associations for the ERCC1 polymorphisms in the risk of lung cancer Cancer Epidemiol Biomarkers Prev 14, Satterthwaite FE (1946) An Approximate Distribution of Estimates of Variance Components Biometrics Bulletin 2, Kwee L, Liu D, Lin X, Ghosh D, and Epstein M. (2008) A powerful and flexible multilocus association test for quantitative traits Am J of Human Genetics, 82,
6 Table S1. P values of comparing % of probes with CN 2.7 (or <1.3) between heavy smokers and non-/light-smokers, with three different data-splitting. Main text Alternative 1 Alternative 2 % of probes with copy number 2.7 Discovery set Validation set Both sets % of probes with copy number <1.3 Discovery set Validation set Both sets 0.61
7 Table S2. P values of testing whether the mean G/T ratio is different than that at random (40.64%), with three different data-splitting. NS/LS: non-smokers/light-smokers; HS: heavy smokers. Main text Alternative 1 Alternative 2 Copy number gain NS/LS Discovery set HS NS/LS Validation set HS NS/LS 0.08 Both sets HS Copy number loss NS/LS Discovery set HS NS/LS Validation set HS NS/LS Both sets HS 0.32
8 Table S3. P values of the eleven loci presented in Table S6 from the single-marker CN-smoking analyses with three different datasplitting. Main text Alternative 1 Alternative 2 Discovery set Validation set Discovery set Validation set Discovery set Validation set Copy number >2 rs rs rs rs rs rs Copy number 2 rs rs rs rs rs
9 Table S4. P values of comparing % of probes with CN 2.7 (or <1.3) between heavy smokers and non-/light-smokers, with and without adjustment of batch effects. Unadjusted Batch-adjusted % of probes with copy number 2.7 Discovery set Validation set Both sets % of probes with copy number <1.3 Discovery set Validation set Both sets
10 Table S5. P values of testing whether the mean G/T ratio is different than that at random (40.64%), with and without adjustment of batch effects. NS/LS: non-smokers/light-smokers; HS: heavy smokers. Unadjusted Batch-adjusted Copy number gain NS/LS Discovery set HS NS/LS Validation set HS NS/LS Both sets HS Copy number loss NS/LS Discovery set HS NS/LS Validation set HS NS/LS Both sets HS
11 Table S6. Summary of eleven loci from the top 100 loci with smallest p value in the discovery set and confirmed in the validation set with p<0.05, under the continuous focal copy number-smoking analyses. Linear model with spline of Genomic Linear model with up to quadratic term of square roottransformed smoking pack-years square root-transformed smoking pack-years dbsnp ID Chromosome position Gene Adjusted p Unadjusted Adjusted p P value unadjusted for covariates r 2 (Mb) value * p value value * Discovery Validation set set Pooled Pooled Pooled Pooled Pooled Copy number >2 rs q rs q rs q IGF rs q IGF rs q rs q Copy number 2 rs q LOC rs p rs p rs p rs q * P values of smoking pack-years were calculated from linear models with either up to quadratic term or models with spline of square root-transformed smoking pack-years, adjusting for age, gender, clinical stage, two sets and cell type.
12 Table S7. Summary of twenty one loci from the top 100 loci with smallest p value in the discovery set and confirmed in the validation set with p<0.05, under the dichotomous-version of focal copy number-smoking analyses.
13 Affymetrix ID dbsnp ID Chromosome Copy number gains Position (Mb) Gene P value Discovery set Validation set Pooled OR (95% CI) * P adj value * SNP_A rs q (2.44, 10.11) SNP_A rs q (2.62, 10.52) SNP_A rs q (3.04, 13.2) SNP_A rs q (2.52, 10.48) SNP_A rs q (2.97, 11.65) SNP_A rs q (4.17, 62.11) SNP_A rs q (3.95, 97.9) SNP_A rs q (5.04, 57.23) SNP_A rs q (3.69, 41.2) SNP_A rs q (4.96, 83.89) SNP_A rs q LOC (2.84, 15.48) SNP_A rs q SKAP (2.88, 15.03) SNP_A rs q (3.35, 25.9) SNP_A rs q (3.33, 27.6) SNP_A rs q (3.56, 33.26) Copy number losses SNP_A rs p CSMD (2.89, 23.49) SNP_A rs p CSMD (2.35, 20.38) SNP_A rs p (2.98, 26.11) SNP_A rs p (2.98, 26.11) SNP_A rs p (2.98, 26.14) SNP_A rs p (3.31, 38.16) * Obtained from logistic regressions with adjustment of gender, age at surgery, two sets, clinical stage, and histology.
14 Figure S1. QQ plots of p values from batch-adjusted and unadjusted associations between focal copy numbers and pack-years of cigarette smoking. A, 1,000 p values were randomly chosen from 256,554 single-marker analyses. B, 1,000 p values were randomly chosen from 25, marker analyses.
15 A B
16 Figure S2. % of probes in genes with CNAs in heavy (>60 pack-years) and light or nonsmokers ( 60 pack-years). Proportion (%) of probes in genes with CNAs (A, gains; B, losses) events by pack-years of cigarette smoking.
17 A B
18 Figure S3. Association of cigarette smoking and chromosome/arm-specific copy numbers. A, the p values are from analyses testing the association of copy number-gain events with the smoking group (heavy vs. light-/non-smokers). B, the p values are from analyses testing the association of copy numbers (>2) with pack-years of cigarette smoking. The dashed line indicates p=0.05.
19 A B
20 Figure S4. Chromosome-specific copy number pattern between heavy and light/nonsmokers. Average copy numbers in chromosomes 1 (A), 3 (D), 7 (C), 8 (D), 10 (E), 11 (F), 12 (G), 16 (H) and 17 (I) are plotted where copy numbers greater than two are red (heavy smokers) or pink color (light/non-smokers), and those less or equal to two are blue (heavy smokers) or light blue color (light/non-smokers). Vertical dotted lines indicate the centromeres of chromosomes. P value in each plot indicates the statistical significance of testing the averaged copy numbers (across the subjects) in the chromosome between heavy and light/non-smokers.


21 A B C D E F H G I
22 Figure S5. Association of cigarette smoking and chromosome/arm-specific copy numbers. The plot illustrates the association of CNAs with heavy against light/non-smokers. Genome-wide mean CNs, genome-wide % of CN gains and total CN gains are the three indices, the difference of which between heavy and light/non-smokers is what p values intend to test (see detail in Methods and SI Appendix text). The first two indices account for the genomic position whereas the last one collapses such information. The dashed line indicates p=0.05.
23
24 Figure S6. Association of cigarette smoking and 256,554 focal copy numbers. A, A plot of -log 10 P of the association between smoking pack-years and copy number, which is analyzed for copy number >2 (upper half) and 2 (lower half), separately. Dashed lines indicate p= B, P values of probes in the 12q23.2 region ( Mb), indicated by the black arrow in a. The other two arrows indicate 3q24 and 8q24.21, of which the p values in the focal region are shown in Figure S7. Blue dots in both plots are the top 100 p values in the discovery set and confirmed in the validation set with p<0.05. The dashed lines indicate p= and IGF1, insulin-like growth factor 1; PMCH, pro-melanin-concentrating hormone; C12orf48, chromosome 12 open reading frame 48; NUP37, nucleoporin 37kDa; CCDC53, coiled-coil domain containing 53. C-F, Scatter plots of the four validated loci (a, rs ; b, rs ; c, rs ; d, rs ) in the region of 12q23.2 with predicted values from three regression models: quadratic model: ordinary least square linear models with up to quadratic term of square root-transformed smoking pack-years (solid black lines), spline: linear models with spline of pack-years (solid green lines), and LOWESS (solid red lines), and the 95% confidence intervals of predicted mean value from spline models (dashed green lines). The other seven validated loci were plotted in Figure S8.

25 A B C D E F
26 Figure S7. Two candidate regions (in addition to 12q23.2) identified from focal copy number-smoking analyses. P values of probes from the association analyses of focal copy numbers and smoking pack-years in the region of 3q24 (A) and 8q24.21 (B). Blue dots (in A, the location of rs ; in B, the location of rs ) are those in the list of top 100 p values in the discovery set and confirmed in the validation set with p<0.05. The dashed lines indicate p= and AGTR1, angiotensin II receptor, type 1; CPB1, carboxypeptidase B1 (tissue); CPA3, carboxypeptidase A3 (mast cell); LOC727677, hypothetical LOC727677; MYC, v-myc myelocytomatosis viral oncogene homolog (avian); PVT1, Pvt1 oncogene (non-protein coding).
27 A B
28 Figure S8. Scatter plot and dose-response relationship of smoking pack-years and copy numbers in the seven candidate loci (in addition to the four in 12q23 (Figure S6C-F)). Scatter plots of the loci (A, rs (at 3q24); B, rs (at 8q24.21); C, rs (11q24.2); D, rs (at 6p24.3); E, rs (at 6p24.3); F, rs (at 5p14.3); G, rs (at 17q24.3)) with predicted values from ordinary least square linear models with up to quadratic term of square root-transformed smoking pack-years (solid black lines), models with spline of pack-years (solid green lines), and LOWESS (solid red lines) and the 95% confidence intervals of predicted mean value from spline models (dashed green lines).
29 A B C D E F G
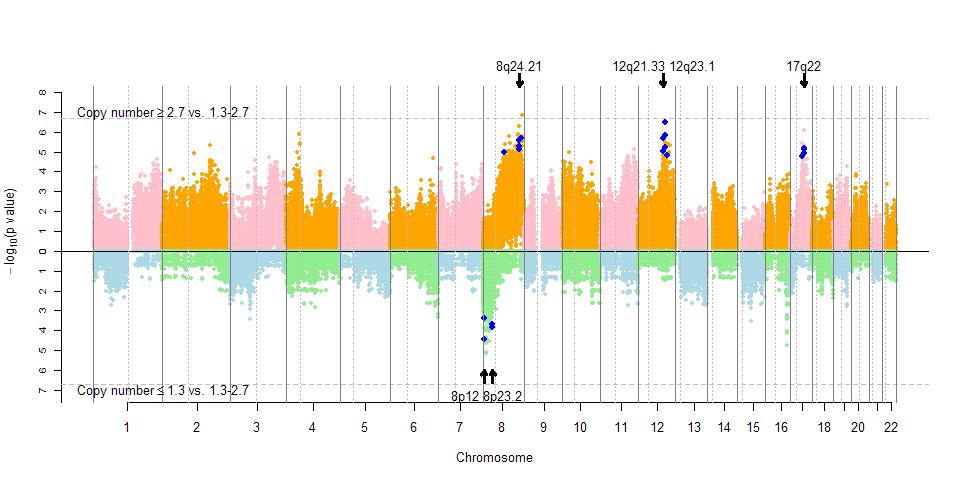
30 Figure S9. Association of dichotomous smoking pack-years (>60 vs. <60) and 256,554 focal CNAs ( 2.7 or 1.3 vs ). A, A plot of -log 10 P of the association between smoking pack-years and copy number by Fisher exact test, which is analyzed for copy number gains (upper half) and losses (lower half), separately. Dashed lines indicate p= B-G, P values of probes in the 8q q24.22 (B), 12q21.33 (C), 12q.23.1 (D), 17q q22 (E), 8p23.2 (F) and 8p12 (G), indicated by the black arrow in A. Blue dots in these plots are the top 100 p values in the discovery set and confirmed in the validation set with p<0.05. The dashed lines indicate p= and MYC, v-myc myelocytomatosis viral oncogene homolog (avian); PVT1, Pvt1 oncogene; GSDMC, gasdermin C; FAM49B, family with sequence similarity 49, member B; ASAP1, ArfGAP with SH3 domain, ankyrin repeat and PH domain 1; DUSP6, dual specificity phosphatase 6; WDR51B (POC1B), POC1 centriolar protein homolog B; ATP2B1, ATPase, Ca++ transporting, plasma membrane 1; RMST, rhabdomyosarcoma 2 associated transcript; CA10, carbonic anhydrase X; KIF2B, kinesin family member 2B; CSMD1, CUB and Sushi multiple domains 1; UNC5D, unc-5 homolog D (C. elegans).
31 A B
32 C D
33 E F
34 G
35 Figure S10. Whole-genome copy number pattern of every 10 smoking pack-years. Total probes with events of copy number gains by pack-years of cigarette smoking in the discovery set (A), the validation set (B) and both sets (C).
36 A B C
Numerous hypothesis tests were performed in this study. To reduce the false positive due to
 Two alternative data-splitting Numerous hypothesis tests were performed in this study. To reduce the false positive due to multiple testing, we are not only seeking the results with extremely small p values
Application of Local Control Strategy in analyses of the effects of Radon on Lung Cancer Mortality for 2,881 US Counties
 Application of Local Control Strategy in analyses of the effects of Radon on Lung Cancer Mortality for 2,881 US Counties Bob Obenchain, Risk Benefit Statistics, August 2015 Our motivation for using a Cut-Point
Unit 1 Exploring and Understanding Data
 Unit 1 Exploring and Understanding Data Area Principle Bar Chart Boxplot Conditional Distribution Dotplot Empirical Rule Five Number Summary Frequency Distribution Frequency Polygon Histogram Interquartile
Title: A robustness study of parametric and non-parametric tests in Model-Based Multifactor Dimensionality Reduction for epistasis detection
 Author's response to reviews Title: A robustness study of parametric and non-parametric tests in Model-Based Multifactor Dimensionality Reduction for epistasis detection Authors: Jestinah M Mahachie John
New Enhancements: GWAS Workflows with SVS
 New Enhancements: GWAS Workflows with SVS August 9 th, 2017 Gabe Rudy VP Product & Engineering 20 most promising Biotech Technology Providers Top 10 Analytics Solution Providers Hype Cycle for Life sciences
1.4 - Linear Regression and MS Excel
 1.4 - Linear Regression and MS Excel Regression is an analytic technique for determining the relationship between a dependent variable and an independent variable. When the two variables have a linear
Biostatistics II
 Biostatistics II 514-5509 Course Description: Modern multivariable statistical analysis based on the concept of generalized linear models. Includes linear, logistic, and Poisson regression, survival analysis,
Bin Liu, Lei Yang, Binfang Huang, Mei Cheng, Hui Wang, Yinyan Li, Dongsheng Huang, Jian Zheng,
 The American Journal of Human Genetics, Volume 91 Supplemental Data A Functional Copy-Number Variation in MAPKAPK2 Predicts Risk and Survival of Lung Cancer Bin Liu, Lei Yang, Binfang Huang, Mei Cheng,
Correlation and regression
 PG Dip in High Intensity Psychological Interventions Correlation and regression Martin Bland Professor of Health Statistics University of York http://martinbland.co.uk/ Correlation Example: Muscle strength
Supplement to SCnorm: robust normalization of single-cell RNA-seq data
 Supplement to SCnorm: robust normalization of single-cell RNA-seq data Supplementary Note 1: SCnorm does not require spike-ins, since we find that the performance of spike-ins in scrna-seq is often compromised,
Ecological Statistics
 A Primer of Ecological Statistics Second Edition Nicholas J. Gotelli University of Vermont Aaron M. Ellison Harvard Forest Sinauer Associates, Inc. Publishers Sunderland, Massachusetts U.S.A. Brief Contents
UNIVERSITY OF CALIFORNIA, LOS ANGELES
 UNIVERSITY OF CALIFORNIA, LOS ANGELES BERKELEY DAVIS IRVINE LOS ANGELES MERCED RIVERSIDE SAN DIEGO SAN FRANCISCO UCLA SANTA BARBARA SANTA CRUZ DEPARTMENT OF EPIDEMIOLOGY SCHOOL OF PUBLIC HEALTH CAMPUS
For more information about how to cite these materials visit
 Author(s): Kerby Shedden, Ph.D., 2010 License: Unless otherwise noted, this material is made available under the terms of the Creative Commons Attribution Share Alike 3.0 License: http://creativecommons.org/licenses/by-sa/3.0/
Analysis of gene expression in blood before diagnosis of ovarian cancer
 Analysis of gene expression in blood before diagnosis of ovarian cancer Different statistical methods Note no. Authors SAMBA/10/16 Marit Holden and Lars Holden Date March 2016 Norsk Regnesentral Norsk
Business Statistics Probability
 Business Statistics The following was provided by Dr. Suzanne Delaney, and is a comprehensive review of Business Statistics. The workshop instructor will provide relevant examples during the Skills Assessment
Biostatistics for Med Students. Lecture 1
 Biostatistics for Med Students Lecture 1 John J. Chen, Ph.D. Professor & Director of Biostatistics Core UH JABSOM JABSOM MD7 February 14, 2018 Lecture note: http://biostat.jabsom.hawaii.edu/education/training.html
Early Learning vs Early Variability 1.5 r = p = Early Learning r = p = e 005. Early Learning 0.
 The temporal structure of motor variability is dynamically regulated and predicts individual differences in motor learning ability Howard Wu *, Yohsuke Miyamoto *, Luis Nicolas Gonzales-Castro, Bence P.
List of Figures. List of Tables. Preface to the Second Edition. Preface to the First Edition
 List of Figures List of Tables Preface to the Second Edition Preface to the First Edition xv xxv xxix xxxi 1 What Is R? 1 1.1 Introduction to R................................ 1 1.2 Downloading and Installing
Statistical Assessment of the Global Regulatory Role of Histone. Acetylation in Saccharomyces cerevisiae. (Support Information)
") Statistical Assessment of the Global Regulatory Role of Histone Acetylation in Saccharomyces cerevisiae (Support Information) Authors: Guo-Cheng Yuan, Ping Ma, Wenxuan Zhong and Jun S. Liu Linear Relationship
Statistical Assessment of the Global Regulatory Role of Histone Acetylation in Saccharomyces cerevisiae (Support Information) Authors: Guo-Cheng Yuan, Ping Ma, Wenxuan Zhong and Jun S. Liu Linear Relationship
Describe what is meant by a placebo Contrast the double-blind procedure with the single-blind procedure Review the structure for organizing a memo
 Please note the page numbers listed for the Lind book may vary by a page or two depending on which version of the textbook you have. Readings: Lind 1 11 (with emphasis on chapters 10, 11) Please note chapter
Figure S2. Distribution of acgh probes on all ten chromosomes of the RIL M0022
 96 APPENDIX B. Supporting Information for chapter 4 "changes in genome content generated via segregation of non-allelic homologs" Figure S1. Potential de novo CNV probes and sizes of apparently de novo
Supplementary Figure 1. Principal components analysis of European ancestry in the African American, Native Hawaiian and Latino populations.
 Supplementary Figure. Principal components analysis of European ancestry in the African American, Native Hawaiian and Latino populations. a Eigenvector 2.5..5.5. African Americans European Americans e
A Comparison of Sample Size and Power in Case-Only Association Studies of Gene-Environment Interaction
 American Journal of Epidemiology ª The Author 2010. Published by Oxford University Press on behalf of the Johns Hopkins Bloomberg School of Public Health. This is an Open Access article distributed under
MMI 409 Spring 2009 Final Examination Gordon Bleil. 1. Is there a difference in depression as a function of group and drug?
 MMI 409 Spring 2009 Final Examination Gordon Bleil Table of Contents Research Scenario and General Assumptions Questions for Dataset (Questions are hyperlinked to detailed answers) 1. Is there a difference
Things you need to know about the Normal Distribution. How to use your statistical calculator to calculate The mean The SD of a set of data points.
 Things you need to know about the Normal Distribution How to use your statistical calculator to calculate The mean The SD of a set of data points. The formula for the Variance (SD 2 ) The formula for the
Meaning-based guidance of attention in scenes as revealed by meaning maps
 SUPPLEMENTARY INFORMATION Letters DOI: 1.138/s41562-17-28- In the format provided by the authors and unedited. -based guidance of attention in scenes as revealed by meaning maps John M. Henderson 1,2 *
Relationship between genomic features and distributions of RS1 and RS3 rearrangements in breast cancer genomes.
 Supplementary Figure 1 Relationship between genomic features and distributions of RS1 and RS3 rearrangements in breast cancer genomes. (a,b) Values of coefficients associated with genomic features, separately
Biostatistics. Donna Kritz-Silverstein, Ph.D. Professor Department of Family & Preventive Medicine University of California, San Diego
 Biostatistics Donna Kritz-Silverstein, Ph.D. Professor Department of Family & Preventive Medicine University of California, San Diego (858) 534-1818 dsilverstein@ucsd.edu Introduction Overview of statistical
bivariate analysis: The statistical analysis of the relationship between two variables.
 bivariate analysis: The statistical analysis of the relationship between two variables. cell frequency: The number of cases in a cell of a cross-tabulation (contingency table). chi-square (χ 2 ) test for
Supplementary Information Titles Journal: Nature Medicine
 Supplementary Information Titles Journal: Nature Medicine Article Title: Corresponding Author: Supplementary Item & Number Supplementary Fig.1 Fig.2 Fig.3 Fig.4 Fig.5 Fig.6 Fig.7 Fig.8 Fig.9 Fig. Fig.11
Supplemental Data. Genome-wide Association of Copy-Number Variation. Reveals an Association between Short Stature
 The American Journal of Human Genetics, Volume 89 Supplemental Data Genome-wide Association of Copy-Number Variation Reveals an Association between Short Stature and the Presence of Low-Frequency Genomic
LOGO. Statistical Modeling of Breast and Lung Cancers. Cancer Research Team. Department of Mathematics and Statistics University of South Florida
 LOGO Statistical Modeling of Breast and Lung Cancers Cancer Research Team Department of Mathematics and Statistics University of South Florida 1 LOGO 2 Outline Nonparametric and parametric analysis of
Regression Discontinuity Analysis
 Regression Discontinuity Analysis A researcher wants to determine whether tutoring underachieving middle school students improves their math grades. Another wonders whether providing financial aid to low-income
Overview of Non-Parametric Statistics
 Overview of Non-Parametric Statistics LISA Short Course Series Mark Seiss, Dept. of Statistics April 7, 2009 Presentation Outline 1. Homework 2. Review of Parametric Statistics 3. Overview Non-Parametric
Statistical Tests for X Chromosome Association Study. with Simulations. Jian Wang July 10, 2012
 Statistical Tests for X Chromosome Association Study with Simulations Jian Wang July 10, 2012 Statistical Tests Zheng G, et al. 2007. Testing association for markers on the X chromosome. Genetic Epidemiology
MULTIPLE LINEAR REGRESSION 24.1 INTRODUCTION AND OBJECTIVES OBJECTIVES
 24 MULTIPLE LINEAR REGRESSION 24.1 INTRODUCTION AND OBJECTIVES In the previous chapter, simple linear regression was used when you have one independent variable and one dependent variable. This chapter
PTHP 7101 Research 1 Chapter Assignments
 PTHP 7101 Research 1 Chapter Assignments INSTRUCTIONS: Go over the questions/pointers pertaining to the chapters and turn in a hard copy of your answers at the beginning of class (on the day that it is
Chapter 2 Organizing and Summarizing Data. Chapter 3 Numerically Summarizing Data. Chapter 4 Describing the Relation between Two Variables
 Tables and Formulas for Sullivan, Fundamentals of Statistics, 4e 014 Pearson Education, Inc. Chapter Organizing and Summarizing Data Relative frequency = frequency sum of all frequencies Class midpoint:
IAPT: Regression. Regression analyses
 Regression analyses IAPT: Regression Regression is the rather strange name given to a set of methods for predicting one variable from another. The data shown in Table 1 and come from a student project
Supplementary Figures
 Supplementary Figures Supplementary Fig 1. Comparison of sub-samples on the first two principal components of genetic variation. TheBritishsampleisplottedwithredpoints.The sub-samples of the diverse sample
Describe what is meant by a placebo Contrast the double-blind procedure with the single-blind procedure Review the structure for organizing a memo
 Business Statistics The following was provided by Dr. Suzanne Delaney, and is a comprehensive review of Business Statistics. The workshop instructor will provide relevant examples during the Skills Assessment
PubHlth Introductory Biostatistics Practice Test I (Without Unit 3 Questions)
") 1 PubHlth 540 - Introductory Biostatistics Practice Test I (Without Unit 3 Questions) 1. (10 points) In the Honolulu Heart Study, Systolic Blood Pressure was tabulated for 100 Subjects including 37 Smokers
1 PubHlth 540 - Introductory Biostatistics Practice Test I (Without Unit 3 Questions) 1. (10 points) In the Honolulu Heart Study, Systolic Blood Pressure was tabulated for 100 Subjects including 37 Smokers
Psychology Research Process
 Psychology Research Process Logical Processes Induction Observation/Association/Using Correlation Trying to assess, through observation of a large group/sample, what is associated with what? Examples:
The Loss of Heterozygosity (LOH) Algorithm in Genotyping Console 2.0
 Algorithm in Genotyping Console 2.0") The Loss of Heterozygosity (LOH) Algorithm in Genotyping Console 2.0 Introduction Loss of erozygosity (LOH) represents the loss of allelic differences. The SNP markers on the SNP Array 6.0 can be used
The Loss of Heterozygosity (LOH) Algorithm in Genotyping Console 2.0 Introduction Loss of erozygosity (LOH) represents the loss of allelic differences. The SNP markers on the SNP Array 6.0 can be used
Title: A new statistical test for trends: establishing the properties of a test for repeated binomial observations on a set of items
 Title: A new statistical test for trends: establishing the properties of a test for repeated binomial observations on a set of items Introduction Many studies of therapies with single subjects involve
Statistical Methods and Reasoning for the Clinical Sciences
 Statistical Methods and Reasoning for the Clinical Sciences Evidence-Based Practice Eiki B. Satake, PhD Contents Preface Introduction to Evidence-Based Statistics: Philosophical Foundation and Preliminaries
Mosaic loss of chromosome Y in peripheral blood is associated with shorter survival and higher risk of cancer
 Supplementary Information Mosaic loss of chromosome Y in peripheral blood is associated with shorter survival and higher risk of cancer Lars A. Forsberg, Chiara Rasi, Niklas Malmqvist, Hanna Davies, Saichand
CHILD HEALTH AND DEVELOPMENT STUDY
 CHILD HEALTH AND DEVELOPMENT STUDY 9. Diagnostics In this section various diagnostic tools will be used to evaluate the adequacy of the regression model with the five independent variables developed in
Kidane Tesfu Habtemariam, MASTAT, Principle of Stat Data Analysis Project work
 1 1. INTRODUCTION Food label tells the extent of calories contained in the food package. The number tells you the amount of energy in the food. People pay attention to calories because if you eat more
VL Network Analysis ( ) SS2016 Week 3
 SS2016 Week 3") VL Network Analysis (19401701) SS2016 Week 3 Based on slides by J Ruan (U Texas) Tim Conrad AG Medical Bioinformatics Institut für Mathematik & Informatik, Freie Universität Berlin 1 Motivation 2 Lecture
VL Network Analysis (19401701) SS2016 Week 3 Based on slides by J Ruan (U Texas) Tim Conrad AG Medical Bioinformatics Institut für Mathematik & Informatik, Freie Universität Berlin 1 Motivation 2 Lecture
Lecture Outline. Biost 590: Statistical Consulting. Stages of Scientific Studies. Scientific Method
 Biost 590: Statistical Consulting Statistical Classification of Scientific Studies; Approach to Consulting Lecture Outline Statistical Classification of Scientific Studies Statistical Tasks Approach to
White Paper Estimating Complex Phenotype Prevalence Using Predictive Models
 White Paper 23-12 Estimating Complex Phenotype Prevalence Using Predictive Models Authors: Nicholas A. Furlotte Aaron Kleinman Robin Smith David Hinds Created: September 25 th, 2015 September 25th, 2015
SGRQ Questionnaire assessing respiratory disease-specific quality of life. Questionnaire assessing general quality of life
 SUPPLEMENTARY MATERIAL e-table 1: Outcomes studied in present analysis. Outcome Abbreviation Definition Nature of data, direction indicating adverse effect (continuous only) Clinical outcomes- subjective
What you should know before you collect data. BAE 815 (Fall 2017) Dr. Zifei Liu
 Dr. Zifei Liu") What you should know before you collect data BAE 815 (Fall 2017) Dr. Zifei Liu Zifeiliu@ksu.edu Types and levels of study Descriptive statistics Inferential statistics How to choose a statistical test
What you should know before you collect data BAE 815 (Fall 2017) Dr. Zifei Liu Zifeiliu@ksu.edu Types and levels of study Descriptive statistics Inferential statistics How to choose a statistical test
TITLE: A Data-Driven Approach to Patient Risk Stratification for Acute Respiratory Distress Syndrome (ARDS)
") TITLE: A Data-Driven Approach to Patient Risk Stratification for Acute Respiratory Distress Syndrome (ARDS) AUTHORS: Tejas Prahlad INTRODUCTION Acute Respiratory Distress Syndrome (ARDS) is a condition
TITLE: A Data-Driven Approach to Patient Risk Stratification for Acute Respiratory Distress Syndrome (ARDS) AUTHORS: Tejas Prahlad INTRODUCTION Acute Respiratory Distress Syndrome (ARDS) is a condition
Discovering Meaningful Cut-points to Predict High HbA1c Variation
 Proceedings of the 7th INFORMS Workshop on Data Mining and Health Informatics (DM-HI 202) H. Yang, D. Zeng, O. E. Kundakcioglu, eds. Discovering Meaningful Cut-points to Predict High HbAc Variation Si-Chi
Basic Biostatistics. Chapter 1. Content
 Chapter 1 Basic Biostatistics Jamalludin Ab Rahman MD MPH Department of Community Medicine Kulliyyah of Medicine Content 2 Basic premises variables, level of measurements, probability distribution Descriptive
Statistics Assignment 11 - Solutions
 Statistics 44.3 Assignment 11 - Solutions 1. Samples were taken of individuals with each blood type to see if the average white blood cell count differed among types. Eleven individuals in each group were
Study Guide for the Final Exam
 Study Guide for the Final Exam When studying, remember that the computational portion of the exam will only involve new material (covered after the second midterm), that material from Exam 1 will make
RAG Rating Indicator Values
 Technical Guide RAG Rating Indicator Values Introduction This document sets out Public Health England s standard approach to the use of RAG ratings for indicator values in relation to comparator or benchmark
Still important ideas
 Readings: OpenStax - Chapters 1 11 + 13 & Appendix D & E (online) Plous - Chapters 2, 3, and 4 Chapter 2: Cognitive Dissonance, Chapter 3: Memory and Hindsight Bias, Chapter 4: Context Dependence Still
UPPER MIDWEST MARKETING AREA ANALYSIS OF COMPONENT LEVELS AND SOMATIC CELL COUNT IN INDIVIDUAL HERD MILK AT THE FARM LEVEL 2007
 UPPER MIDWEST MARKETING AREA ANALYSIS OF COMPONENT LEVELS AND SOMATIC CELL COUNT IN INDIVIDUAL HERD MILK AT THE FARM LEVEL 2007 Staff Paper 08-01 Prepared by: Corey Freije 2008 Federal Milk Market Administrator
Analysis and Interpretation of Data Part 1
 Analysis and Interpretation of Data Part 1 DATA ANALYSIS: PRELIMINARY STEPS 1. Editing Field Edit Completeness Legibility Comprehensibility Consistency Uniformity Central Office Edit 2. Coding Specifying
Medical Statistics 1. Basic Concepts Farhad Pishgar. Defining the data. Alive after 6 months?
 Medical Statistics 1 Basic Concepts Farhad Pishgar Defining the data Population and samples Except when a full census is taken, we collect data on a sample from a much larger group called the population.
Content. Basic Statistics and Data Analysis for Health Researchers from Foreign Countries. Research question. Example Newly diagnosed Type 2 Diabetes
 Content Quantifying association between continuous variables. Basic Statistics and Data Analysis for Health Researchers from Foreign Countries Volkert Siersma siersma@sund.ku.dk The Research Unit for General
Supplementary Online Content
 Supplementary Online Content Neuhouser ML, Aragaki AK, Prentice RL, et al. Overweight, obesity, and postmenopausal invasive breast cancer risk: a secondary analysis of the Women s Health Initiative randomized
Kernel Density Estimation for Random-effects Meta-analysis
 International Journal of Mathematical Sciences in Medicine (013) 1 5 Kernel Density Estimation for Random-effects Meta-analysis Branko Miladinovic 1, Ambuj Kumar 1 and Benjamin Djulbegovic 1, 1 University
From Biostatistics Using JMP: A Practical Guide. Full book available for purchase here. Chapter 1: Introduction... 1
 From Biostatistics Using JMP: A Practical Guide. Full book available for purchase here. Contents Dedication... iii Acknowledgments... xi About This Book... xiii About the Author... xvii Chapter 1: Introduction...
Contingency Tables Summer 2017 Summer Institutes 187
 Contingency Tables 87 Overview ) Types of Variables ) Comparing () Categorical Variables Contingency (two-way) tables Tests 3) x Tables Sampling designs Testing for association Estimation of effects Paired
A Brief (very brief) Overview of Biostatistics. Jody Kreiman, PhD Bureau of Glottal Affairs
 Overview of Biostatistics. Jody Kreiman, PhD Bureau of Glottal Affairs") A Brief (very brief) Overview of Biostatistics Jody Kreiman, PhD Bureau of Glottal Affairs What We ll Cover Fundamentals of measurement Parametric versus nonparametric tests Descriptive versus inferential
A Brief (very brief) Overview of Biostatistics Jody Kreiman, PhD Bureau of Glottal Affairs What We ll Cover Fundamentals of measurement Parametric versus nonparametric tests Descriptive versus inferential
CHAPTER ONE CORRELATION
 CHAPTER ONE CORRELATION 1.0 Introduction The first chapter focuses on the nature of statistical data of correlation. The aim of the series of exercises is to ensure the students are able to use SPSS to
SPRING GROVE AREA SCHOOL DISTRICT. Course Description. Instructional Strategies, Learning Practices, Activities, and Experiences.
 SPRING GROVE AREA SCHOOL DISTRICT PLANNED COURSE OVERVIEW Course Title: Basic Introductory Statistics Grade Level(s): 11-12 Units of Credit: 1 Classification: Elective Length of Course: 30 cycles Periods
S1 Appendix: Figs A G and Table A. b Normal Generalized Fraction 0.075
 Aiello & Alter (216) PLoS One vol. 11 no. 1 e164546 S1 Appendix A-1 S1 Appendix: Figs A G and Table A a Tumor Generalized Fraction b Normal Generalized Fraction.25.5.75.25.5.75 1 53 4 59 2 58 8 57 3 48
Investigating the robustness of the nonparametric Levene test with more than two groups
 Psicológica (2014), 35, 361-383. Investigating the robustness of the nonparametric Levene test with more than two groups David W. Nordstokke * and S. Mitchell Colp University of Calgary, Canada Testing
2.75: 84% 2.5: 80% 2.25: 78% 2: 74% 1.75: 70% 1.5: 66% 1.25: 64% 1.0: 60% 0.5: 50% 0.25: 25% 0: 0%
 Capstone Test (will consist of FOUR quizzes and the FINAL test grade will be an average of the four quizzes). Capstone #1: Review of Chapters 1-3 Capstone #2: Review of Chapter 4 Capstone #3: Review of
WDHS Curriculum Map Probability and Statistics. What is Statistics and how does it relate to you?
 WDHS Curriculum Map Probability and Statistics Time Interval/ Unit 1: Introduction to Statistics 1.1-1.3 2 weeks S-IC-1: Understand statistics as a process for making inferences about population parameters
Complex Trait Genetics in Animal Models. Will Valdar Oxford University
 Complex Trait Genetics in Animal Models Will Valdar Oxford University Mapping Genes for Quantitative Traits in Outbred Mice Will Valdar Oxford University What s so great about mice? Share ~99% of genes
Performance of Median and Least Squares Regression for Slightly Skewed Data
 World Academy of Science, Engineering and Technology 9 Performance of Median and Least Squares Regression for Slightly Skewed Data Carolina Bancayrin - Baguio Abstract This paper presents the concept of
Supplementary Appendix
 Supplementary Appendix This appendix has been provided by the authors to give readers additional information about their work. Supplement to: Weintraub WS, Grau-Sepulveda MV, Weiss JM, et al. Comparative
Nature Neuroscience: doi: /nn Supplementary Figure 1. Behavioral training.
 Supplementary Figure 1 Behavioral training. a, Mazes used for behavioral training. Asterisks indicate reward location. Only some example mazes are shown (for example, right choice and not left choice maze
STATISTICS AND RESEARCH DESIGN
 Statistics 1 STATISTICS AND RESEARCH DESIGN These are subjects that are frequently confused. Both subjects often evoke student anxiety and avoidance. To further complicate matters, both areas appear have
9 research designs likely for PSYC 2100
 9 research designs likely for PSYC 2100 1) 1 factor, 2 levels, 1 group (one group gets both treatment levels) related samples t-test (compare means of 2 levels only) 2) 1 factor, 2 levels, 2 groups (one
Flexible Matching in Case-Control Studies of Gene-Environment Interactions
 American Journal of Epidemiology Copyright 2004 by the Johns Hopkins Bloomberg School of Public Health All rights reserved Vol. 59, No. Printed in U.S.A. DOI: 0.093/aje/kwg250 ORIGINAL CONTRIBUTIONS Flexible
Supplementary Online Content
 Supplementary Online Content Rollman BL, Herbeck Belnap B, Abebe KZ, et al. Effectiveness of online collaborative care for treating mood and anxiety disorders in primary care: a randomized clinical trial.
Cancer outlier differential gene expression detection
 Biostatistics (2007), 8, 3, pp. 566 575 doi:10.1093/biostatistics/kxl029 Advance Access publication on October 4, 2006 Cancer outlier differential gene expression detection BAOLIN WU Division of Biostatistics,
Introduction to Discrimination in Microarray Data Analysis
 Introduction to Discrimination in Microarray Data Analysis Jane Fridlyand CBMB University of California, San Francisco Genentech Hall Auditorium, Mission Bay, UCSF October 23, 2004 1 Case Study: Van t
Assignment #6. Chapter 10: 14, 15 Chapter 11: 14, 18. Due tomorrow Nov. 6 th by 2pm in your TA s homework box
 Assignment #6 Chapter 10: 14, 15 Chapter 11: 14, 18 Due tomorrow Nov. 6 th by 2pm in your TA s homework box Assignment #7 Chapter 12: 18, 24 Chapter 13: 28 Due next Friday Nov. 13 th by 2pm in your TA
NORTH SOUTH UNIVERSITY TUTORIAL 2
 NORTH SOUTH UNIVERSITY TUTORIAL 2 AHMED HOSSAIN,PhD Data Management and Analysis AHMED HOSSAIN,PhD - Data Management and Analysis 1 Correlation Analysis INTRODUCTION In correlation analysis, we estimate
Nature Methods: doi: /nmeth.3115
 Supplementary Figure 1 Analysis of DNA methylation in a cancer cohort based on Infinium 450K data. RnBeads was used to rediscover a clinically distinct subgroup of glioblastoma patients characterized by
Simple Linear Regression the model, estimation and testing
 Simple Linear Regression the model, estimation and testing Lecture No. 05 Example 1 A production manager has compared the dexterity test scores of five assembly-line employees with their hourly productivity.
University of California, Berkeley
 University of California, Berkeley U.C. Berkeley Division of Biostatistics Working Paper Series Year 2007 Paper 221 Biomarker Discovery Using Targeted Maximum Likelihood Estimation: Application to the
STA 3024 Spring 2013 EXAM 3 Test Form Code A UF ID #
 STA 3024 Spring 2013 Name EXAM 3 Test Form Code A UF ID # Instructions: This exam contains 34 Multiple Choice questions. Each question is worth 3 points, for a total of 102 points (there are TWO bonus
SubLasso:a feature selection and classification R package with a. fixed feature subset
 SubLasso:a feature selection and classification R package with a fixed feature subset Youxi Luo,3,*, Qinghan Meng,2,*, Ruiquan Ge,2, Guoqin Mai, Jikui Liu, Fengfeng Zhou,#. Shenzhen Institutes of Advanced
Diurnal Pattern of Reaction Time: Statistical analysis
 Diurnal Pattern of Reaction Time: Statistical analysis Prepared by: Alison L. Gibbs, PhD, PStat Prepared for: Dr. Principal Investigator of Reaction Time Project January 11, 2015 Summary: This report gives
Supplementary materials for: Executive control processes underlying multi- item working memory
 Supplementary materials for: Executive control processes underlying multi- item working memory Antonio H. Lara & Jonathan D. Wallis Supplementary Figure 1 Supplementary Figure 1. Behavioral measures of
Still important ideas
 Readings: OpenStax - Chapters 1 13 & Appendix D & E (online) Plous Chapters 17 & 18 - Chapter 17: Social Influences - Chapter 18: Group Judgments and Decisions Still important ideas Contrast the measurement
chapter 1 - fig. 2 Mechanism of transcriptional control by ppar agonists.
 chapter 1 - fig. 1 The -omics subdisciplines. chapter 1 - fig. 2 Mechanism of transcriptional control by ppar agonists. 201 figures chapter 1 chapter 2 - fig. 1 Schematic overview of the different steps
Nature Neuroscience: doi: /nn Supplementary Figure 1
 Supplementary Figure 1 Illustration of the working of network-based SVM to confidently predict a new (and now confirmed) ASD gene. Gene CTNND2 s brain network neighborhood that enabled its prediction by
Describe what is meant by a placebo Contrast the double-blind procedure with the single-blind procedure Review the structure for organizing a memo
 Please note the page numbers listed for the Lind book may vary by a page or two depending on which version of the textbook you have. Readings: Lind 1 11 (with emphasis on chapters 5, 6, 7, 8, 9 10 & 11)