Statistical Assessment of the Global Regulatory Role of Histone. Acetylation in Saccharomyces cerevisiae. (Support Information)
|
|
|
- Tobias Jeffry Newman
- 6 years ago
- Views:
Transcription
1 Statistical Assessment of the Global Regulatory Role of Histone Acetylation in Saccharomyces cerevisiae (Support Information) Authors: Guo-Cheng Yuan, Ping Ma, Wenxuan Zhong and Jun S. Liu Linear Relationship between RSIR Selected Motifs and Transcription Rates Variable selection using the RSIR algorithm does not assume a linear relationship. In principle, the functional relationship can be rather general, which is not explicitly estimated by the RSIR procedure. However, in our case, a linear relationship fits the data pretty well, since a linear regression model is highly statistically significant (p-value < ) and the residuals do not show obvious nonlinear or non-gaussian pattern. Such a relationship is also suggested by the scatter plot (Figure S1). Statistical Significance of Quadratic Interaction Coefficients In the main text, we showed that including quadratic interaction terms in Eqn (2) does not lead to significant changes of R-square. We also tested the statistical significance of the regression coefficients corresponding to the quadratic interaction terms (Table S1). Without controlling the confounding effect due to sequence motif or nucleosome occupancy information, the interaction between H3K9 and is significant at the level of α = 0.05 (both for intergenic and coding regions). However, the significance of this interaction pair appears to be an artifact due to confounding, as all interaction terms are insignificant once the confounding effects are controlled (Table S1). These results further suggest that the cumulative model is justified.
2 Normalization of Kurdistani et al. s Histone Acetylation Data Kurdistani et al. [2] measured the acetylation level at eleven different sites. However, in their experiments, immunoprecipitated acetylated DNA was hybridized against genomic instead of nucleosomal DNA. As a result, the measured acetylation levels were confounded with variation of nucleosome occupancy. In order to remove this confounding effect, we normalized the raw acetylation data by fitting a linear regression model x ij = α + β w + ε (S1) j j i ij where x ij is the acetylation level at the j-th residue (log-transformed) and w i is the nucleosome density [8] (logtransformed) at gene i. The residue ε ij is retained as the normalized acetylation value. The linear between acetylation levels and nucleosome occupancy is thus removed. The validity of the above normalization method can be tested by comparing the normalized values with those measured by hybridizing acetylated DNA against nucleosomal DNA, which is not confounded by nucleosome occupancy. In fact, Pokholok et al. [8] measured the acetylation levels using both methods, i.e., hybridizing histone acetylation against either nucleosomal or genomic DNA. These data serve as a good benchmark. By applying Eqn (S1) to the confounded acetylation data, we found that the normalized data significantly improved the agreement with un-confounded data (Fig. S2). In particular, the Pearson was increased from 0.79 to More importantly, the confounded acetylation data of Kurdistani et al. shows little with transcription rates, which is clearly an artifact (Fig. S3a). After normalization, the between the two was partially recovered (Fig. S3b). Taken together, the normalization procedure for removing the nucleosome occupancy bias significantly enhanced data quality. We also caution here, however, if the un-confounded acetylation data is intrinsically correlated with nucleosome
3 occupancy due to some unknown biological mechanisms, Eqn (S1) will become invalid since it will also remove this intrinsic. Sensitivity to Motif Finding Algorithms In order to test whether our analysis is sensitive to motif finding, we repeated our analysis using an independent set of TF binding motifs and their matching scores and then applied Eqn (2). This second set of motifs (and their scores) was obtained from Beer and Tavazoie [26], who derived 666 TF binding motifs both by de novo search using AlignACE and from analyzing ChIP-chip experiments [36, 37]. We reduced this whole set of 666 motifs using our RSIR and stepwise regression procedure (see Materials and Methods). Only 15 motifs were eventually selected in our regression model. For comparison purposes, both our MDscan-based and literaturemotif-based analyses were applied to the intersection of our merged dataset (containing 3049 intergenic and 3384 coding regions, see Materials and Methods) and Beer and Tavazoie s dataset (after their tight-clustering pre-analysis, containing 1649 intergenic and 1816 coding regions). This subset contains 1468 intergenic and 1612 coding regions. Since the genes in Beer and Tavazoie s dataset are pre-selected via a tight-clustering procedure so that they have well-defined expression patterns under different growth condition, it is not surprising that the performance of Eqn (2) when applied to this subset of genes is significantly better than to the whole gene set (compare Table S2 with Table 1), even for the same set of motif scores. Strikingly, about 20% of the variance can be explained by only 15 motifs alone, without additional acetylation or nucleosome occupancy information. Note that the two motif-based models give similar results (Tables S2 and S3), suggesting that our motif-based regression analysis is rather robust. An interesting question is why the numbers of MDscan- and literature-based motifs differ substantially. First, computational methods may identify functionally redundant motifs as distinct ones, causing uncertainty in the
4 number of selected motifs. Second, the MDscan-based motifs were selected to explain genome-wide gene expression, whereas the literature-based motifs were chosen previously by other researchers based on a smaller set of genes which have nice gene expression patterns. Therefore, the MDscan-based motifs may also include those that have no regulatory role for this subset of genes. To eliminate irrelevant motifs, we selected a subset of MDscan-based motifs by stepwise regression, confining within the smaller gene set. As a result, 13 motifs were removed. Many of the remaining 20 motifs (Figure S4a) have patterns similar to the 15 motifs (Figure S4b) in the literature (Table S4), implying an intrinsic consistency between these two different motif-based methods. The slightly better performance of the literature-based motifs (Table S5) may be attributable to the authors effort to optimize the biological relevance of their motifs using extra information, e.g., tight-clustering based on 255 microarray experiments, and additional experimentally verified motifs (based on CHIP-chip data). Sensitivity to Variability among Different Genomic Data Sources Even for identical biological samples, the measured microarray data still vary among different microarray platforms or research groups [32-34]. In the main text we presented results by analyzing the histone acetylation data in Pokholok et al. [8] and the gene expression data in Bernstein et al.[1]. To ensure robustness, we repeated our analysis using independent sources of histone acetylation [2] and gene expression data [15]. First, we tested reproducibility by replacing the acetylation data with those measured in Kurdistani et al. [2], which is normalized first as discussed above. For comparison, we selected the common set of intergenic and coding regions with our main dataset, resulting in a subset containing 1026 intergenic and 1492 coding regions. We repeated our analysis using both acetylation data on this subset of regions. The results are quite consistent with that presented in our main article (Tables S6 and S7), but more refined information can be gleaned from Kurdistani et al. s data since they measured the acetylation level at eleven different acetylation sites.
5 Interestingly, the H2A and H2B acetylation levels have little with transcription rates. The acetylation level at three different acetylation sites (K9, K18, and K27) on H3 tails are significantly correlated with gene expression, after controlling for the effects of acetylation at other histones. As suggested by the partial analysis, acetylation generally has little global regulatory effect except for K16, which seems to have a negative effect. However, we caution again for over-interpretation, as these results are based on the assumption that the un-confounded histone acetylation levels are uncorrelated with nucleosome density. The validity of this assumption requires further experimental tests. Second, to test whether our results were affected by the variability of the gene expression data, we repeated our analysis using an independent gene expression dataset [15]. Notice that the microarray platforms in Holstege et al. and Bernstein et al. are different: Bernstein used spotted arrays, whereas Holstege used Affymetrix arrays. Again, we identified the subset of intergenic and coding regions in the two experiments. This subset contains 3049 intergenic and 3384 coding regions. The results from these two different gene expression datasets are similar (Tables S8 and S9).
6 Supplemental Tables Table S1. The p-values for the quadratic interaction coefficients included in the linear regression model. (a) for intergenic regions; (b) for coding regions. ( nucleosome occupancy; sequence information). (a) p-value for the interaction coefficient Interaction H3K9 and H3K9 and and (b) p-value for the interaction coefficient Interaction H3K9 and H3K9 and and
7 Table S2. Comparison between the adjusted R-squares of the linear regression model using independently derived motif scores (de novo prediction using MDscan [24] vs directly from literature [26] to control sequence dependent regulatory effects based on the common sets of intergenic or coding regions. The number of motifs has been reduced by RISR and stepwise regression procedures. (a) for intergenic regions; (b) for coding regions. (a) Acetylation sites included Model performance (adjusted R 2 ) with different covariates MDscan motif Literature motif H3K9 and , and (b) Acetylation sites included Model performance (adjusted R 2 ) with different covariates Literature MDscan motif motif H3K9 and , and
8 Table S3. Comparison between partial results using independently derived motif scores (de novo prediction using MDscan [24] and directly from literature [26] to control sequence dependent regulatory effects based on the common sets of intergenic or coding regions. The number of motifs has been reduced by RISR and stepwise regression procedures. (a) for intergenic regions; (b) for coding regions. (a) Covariate variable between covariate and transcription rates H3K variables and (MDscan) variables and (Literature motif) and (MDscan) and (Literature motif) and (MDscan) and (Literature motif)
9 (b) Covariate variable between covariate and transcription rates H3K variables and (MDscan) and (MDscan) and (MDscan) variables and (Literature motif) and (Literature motif) and (Literature motif)
10 Table S4. The corresponding MDscan motif for each of the 15 literature motifs that are selected by RSIR. Literature Motifs Motif 1 Motif 2 Motif 3 Motif 4 Motif 5 Motif 6 Motif 7 Motif 8 Motif 9 Motif 10 Motif 11 Motif 12 Motif 13 Motif 14 Motif 15 MDscan motifs Motif.N Motif.P Motif.P1.8.1 No good match Motif.P1.7.1 Motif.P Motif N Motif.P Motif.P Motif.N Motif N Motif P1.7.1 Motif.P Motif.P1.7.1 Motif.P1.7.1
11 Table S5. Same as Table S2 except for the MDscan-based motifs are further selected by a second round of stepwise regression. (a) Acetylation sites included Model performance (adjusted R 2 ) with different covariates MDscan motif Literature motif H3K9 and , and (b) Acetylation sites included Model performance (adjusted R 2 ) with different covariates MDscan motif Literature motif H3K9 and , and
12 Table S6. Comparison between the adjusted R-square for the linear regression model using different histone acetylation data (Pokholok et al. [8] and Kurdistani et al. [2]) based on the common sets of intergenic or coding regions. (a) for intergenic regions; (b) for coding regions.. (a) Acetylation sites included Model performance (adjusted R 2 ) with different covariates Pokholok et al. Kurdistani et al H2A and H2B H H3 and H3 and
13 (b) Acetylation sites included Model performance (adjusted R 2 ) with different covariates Pokholok et al. Kurdistani et al H2A and H2B H H3 and H3 and
14 Table S7. Comparison between partial results using different histone acetylation data (Pokholok et al. [8] and Kurdistani et al. [2]) based on the common sets of intergenic or coding regions. (a) for intergenic regions; (b) for coding regions. (a) between covariate and transcription rates Covariate variable variables H3K and Pokholok and et al. H H3 and H3K and and H3K and H3K and H3K and Kurdistani et al. K H3 and H3 K12 H H3 and K16 H H3 and H2AK7 H3, H3, and H2BK11 H3, H3, and H2BK16 H3, H3, and
15 (b) Covariate between covariate and transcription rates variable variables Pokholok et al. Kurdistani et al. H3K and and H H3 and H3K and and H3K and H3K and H3K and K8 H H3 and K12 H H3 and K16 H H3 and H2AK7 H3, H3, and H2BK11 H3, H3, and H2BK16 H3, H3, and
16 Table S8. Comparison between the adjusted R-squares for the linear regression model using different gene expression data sets (Bernstein et al. [1] and Holstege et al. [15]) based on the common sets of intergenic or coding regions. (a) for intergenic regions; (b) for coding regions. (a) Model performance (adjusted R 2 ) with different covariates Acetylation sites included Bernstein et al. Hostege et al H3K9 and , and
17 (b) Acetylation sites included Model performance (adjusted R 2 ) with different covariates Bernstein et al. Hostege et al H3K9 and , and
18 Table S9. Comparison between partial results using different gene expression data (Bernstein et al. [1] and Holstege et al. [15]) based on the common sets of intergenic and coding regions. (a) for intergenic regions; (b) for coding regions. (a) between covariate and transcription rates Covariate Bernstein et al. Holstege et al. variable variables variable variables H3K and and and and and and
19 (b) between covariate and transcription rates Covariate variable Bernstein et al. Holstege et al. variables variable variables H3K and and and and and and
20 Supplemental Figures Figure S1. Scatter plot of transcription rates vs the first RSIR covariates suggests linear relationship. All data are log-transformed. Transcription rate First RSIR covariate 5
21 Figure S2. (a) Scatter plot of confounded (acevswce) vs un-confounded (acevsh3) acetylation levels. (b) Scatter plot of normalized vs un-confounded acetylation levels. Data obtained from Pokholok et al. (2005) ace normalized (b) acevswce (a) acevsh acevsh3 4
22 Figure S3. Normalization procedure partially recovers between transcription rates and upstream acetylation levels. (a) Transcription rates plotted against confounded (acevswce) and unconfounded (acevswce) H3H14 acetylation levels. (b) Trandscription rates plotted against normalized and un-confounded H3H14 acetylation levels. (a) 3 (b) 3 Acevs H3 AcevsWC E Acevs H3 Ace Normalzed H3K 14 acetylation 2 1 H3K 14 acetylation T ranscription rates T ranscription rates


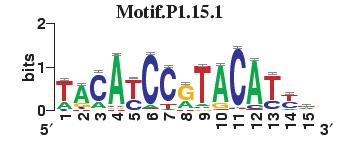
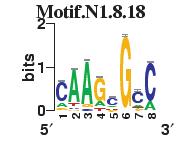
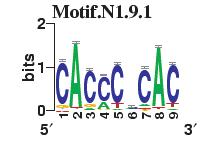
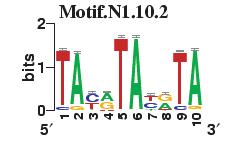
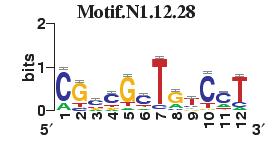
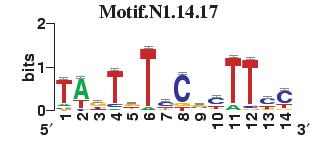
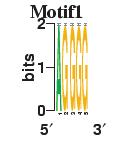
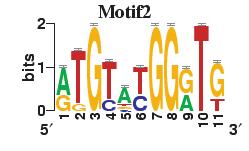
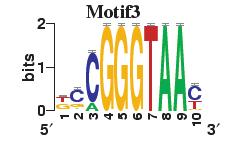
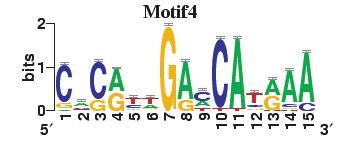
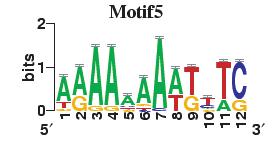
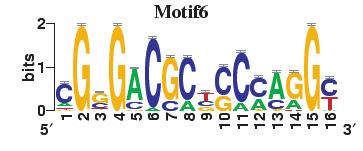
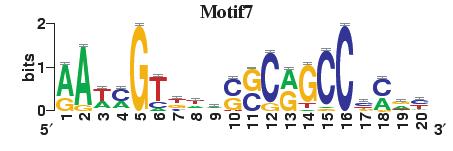
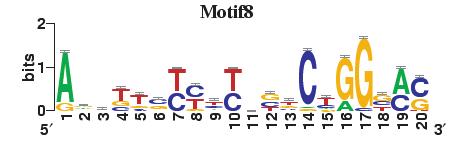
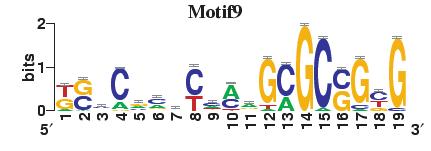
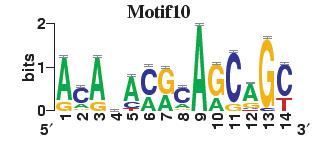
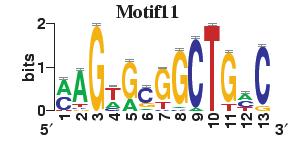
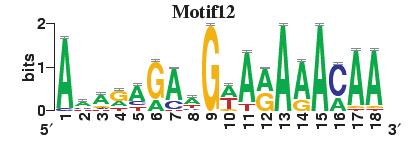
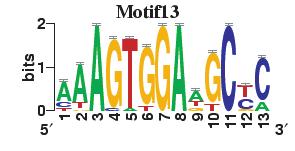
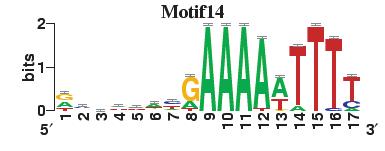
23 Figure S4. The motif patterns selected in the linear regression model. Motifs are obtained by MDscan (or literature) and further selected by RSIR and stepwise regression (see main text for details). (a) 20 MDscan motifs. (b) 15 literature motifs. (a) (b)
Statistical Assessment of the Global Regulatory Role of Histone Acetylation in Saccharomyces cerevisiae
 Statistical Assessment of the Global Regulatory Role of Histone Acetylation in Saccharomyces cerevisiae The Harvard community has made this article openly available. Please share how this access benefits
The Pretest! Pretest! Pretest! Assignment (Example 2)
") The Pretest! Pretest! Pretest! Assignment (Example 2) May 19, 2003 1 Statement of Purpose and Description of Pretest Procedure When one designs a Math 10 exam one hopes to measure whether a student s ability
The Pretest! Pretest! Pretest! Assignment (Example 2) May 19, 2003 1 Statement of Purpose and Description of Pretest Procedure When one designs a Math 10 exam one hopes to measure whether a student s ability
Discovery of Novel Human Gene Regulatory Modules from Gene Co-expression and
 Discovery of Novel Human Gene Regulatory Modules from Gene Co-expression and Promoter Motif Analysis Shisong Ma 1,2*, Michael Snyder 3, and Savithramma P Dinesh-Kumar 2* 1 School of Life Sciences, University
1.4 - Linear Regression and MS Excel
 1.4 - Linear Regression and MS Excel Regression is an analytic technique for determining the relationship between a dependent variable and an independent variable. When the two variables have a linear
Multiple Regression Analysis
 Multiple Regression Analysis Basic Concept: Extend the simple regression model to include additional explanatory variables: Y = β 0 + β1x1 + β2x2 +... + βp-1xp + ε p = (number of independent variables
Data Analysis Using Regression and Multilevel/Hierarchical Models
 Data Analysis Using Regression and Multilevel/Hierarchical Models ANDREW GELMAN Columbia University JENNIFER HILL Columbia University CAMBRIDGE UNIVERSITY PRESS Contents List of examples V a 9 e xv " Preface
Identifying the Combinatorial Effects of Histone Modifications by Association Rule Mining in Yeast
 Evolutionary Bioinformatics Original Research Open Access Full open access to this and thousands of other papers at http://www.la-press.com. Identifying the Combinatorial Effects of Histone Modifications
MMI 409 Spring 2009 Final Examination Gordon Bleil. 1. Is there a difference in depression as a function of group and drug?
 MMI 409 Spring 2009 Final Examination Gordon Bleil Table of Contents Research Scenario and General Assumptions Questions for Dataset (Questions are hyperlinked to detailed answers) 1. Is there a difference
Yingying Wei George Wu Hongkai Ji
 Stat Biosci (2013) 5:156 178 DOI 10.1007/s12561-012-9066-5 Global Mapping of Transcription Factor Binding Sites by Sequencing Chromatin Surrogates: a Perspective on Experimental Design, Data Analysis,
Nature Neuroscience: doi: /nn Supplementary Figure 1. Task timeline for Solo and Info trials.
 Supplementary Figure 1 Task timeline for Solo and Info trials. Each trial started with a New Round screen. Participants made a series of choices between two gambles, one of which was objectively riskier
7SK ChIRP-seq is specifically RNA dependent and conserved between mice and humans.
 Supplementary Figure 1 7SK ChIRP-seq is specifically RNA dependent and conserved between mice and humans. Regions targeted by the Even and Odd ChIRP probes mapped to a secondary structure model 56 of the
Numerous hypothesis tests were performed in this study. To reduce the false positive due to
 Two alternative data-splitting Numerous hypothesis tests were performed in this study. To reduce the false positive due to multiple testing, we are not only seeking the results with extremely small p values
Computational aspects of ChIP-seq. John Marioni Research Group Leader European Bioinformatics Institute European Molecular Biology Laboratory
 Computational aspects of ChIP-seq John Marioni Research Group Leader European Bioinformatics Institute European Molecular Biology Laboratory ChIP-seq Using highthroughput sequencing to investigate DNA
Processing, integrating and analysing chromatin immunoprecipitation followed by sequencing (ChIP-seq) data
 data") Processing, integrating and analysing chromatin immunoprecipitation followed by sequencing (ChIP-seq) data Bioinformatics methods, models and applications to disease Alex Essebier ChIP-seq experiment To
Processing, integrating and analysing chromatin immunoprecipitation followed by sequencing (ChIP-seq) data Bioinformatics methods, models and applications to disease Alex Essebier ChIP-seq experiment To
Identification of Tissue Independent Cancer Driver Genes
 Identification of Tissue Independent Cancer Driver Genes Alexandros Manolakos, Idoia Ochoa, Kartik Venkat Supervisor: Olivier Gevaert Abstract Identification of genomic patterns in tumors is an important
LAB ASSIGNMENT 4 INFERENCES FOR NUMERICAL DATA. Comparison of Cancer Survival*
 LAB ASSIGNMENT 4 1 INFERENCES FOR NUMERICAL DATA In this lab assignment, you will analyze the data from a study to compare survival times of patients of both genders with different primary cancers. First,
Numerous hypothesis tests were performed in this study. To reduce the false positive due to
 Two alternative data-splitting Numerous hypothesis tests were performed in this study. To reduce the false positive due to multiple testing, we are not only seeking the results with extremely small p values
MEA DISCUSSION PAPERS
 Inference Problems under a Special Form of Heteroskedasticity Helmut Farbmacher, Heinrich Kögel 03-2015 MEA DISCUSSION PAPERS mea Amalienstr. 33_D-80799 Munich_Phone+49 89 38602-355_Fax +49 89 38602-390_www.mea.mpisoc.mpg.de
Computational Analysis of UHT Sequences Histone modifications, CAGE, RNA-Seq
 Computational Analysis of UHT Sequences Histone modifications, CAGE, RNA-Seq Philipp Bucher Wednesday January 21, 2009 SIB graduate school course EPFL, Lausanne ChIP-seq against histone variants: Biological
Nature Structural & Molecular Biology: doi: /nsmb.2419
 Supplementary Figure 1 Mapped sequence reads and nucleosome occupancies. (a) Distribution of sequencing reads on the mouse reference genome for chromosome 14 as an example. The number of reads in a 1 Mb
Gene expression analysis. Roadmap. Microarray technology: how it work Applications: what can we do with it Preprocessing: Classification Clustering
 Gene expression analysis Roadmap Microarray technology: how it work Applications: what can we do with it Preprocessing: Image processing Data normalization Classification Clustering Biclustering 1 Gene
Genomic analysis of essentiality within protein networks
 Genomic analysis of essentiality within protein networks Haiyuan Yu, Dov Greenbaum, Hao Xin Lu, Xiaowei Zhu and Mark Gerstein Department of Molecular Biophysics and Biochemistry, 266 Whitney Avenue, Yale
Applications. DSC 410/510 Multivariate Statistical Methods. Discriminating Two Groups. What is Discriminant Analysis
 DSC 4/5 Multivariate Statistical Methods Applications DSC 4/5 Multivariate Statistical Methods Discriminant Analysis Identify the group to which an object or case (e.g. person, firm, product) belongs:
Supplemental Material for:
 Supplemental Material for: Transcriptional silencing of γ-globin by BCL11A involves long-range interactions and cooperation with SOX6 Jian Xu, Vijay G. Sankaran, Min Ni, Tobias F. Menne, Rishi V. Puram,
Example 7.2. Autocorrelation. Pilar González and Susan Orbe. Dpt. Applied Economics III (Econometrics and Statistics)
") Example 7.2 Autocorrelation Pilar González and Susan Orbe Dpt. Applied Economics III (Econometrics and Statistics) Pilar González and Susan Orbe OCW 2014 Example 7.2. Autocorrelation 1 / 17 Questions.
Example 7.2 Autocorrelation Pilar González and Susan Orbe Dpt. Applied Economics III (Econometrics and Statistics) Pilar González and Susan Orbe OCW 2014 Example 7.2. Autocorrelation 1 / 17 Questions.
WELCOME! Lecture 11 Thommy Perlinger
 Quantitative Methods II WELCOME! Lecture 11 Thommy Perlinger Regression based on violated assumptions If any of the assumptions are violated, potential inaccuracies may be present in the estimated regression
10. LINEAR REGRESSION AND CORRELATION
 1 10. LINEAR REGRESSION AND CORRELATION The contingency table describes an association between two nominal (categorical) variables (e.g., use of supplemental oxygen and mountaineer survival ). We have
Linear Regression in SAS
 1 Suppose we wish to examine factors that predict patient s hemoglobin levels. Simulated data for six patients is used throughout this tutorial. data hgb_data; input id age race $ bmi hgb; cards; 21 25
Simple Linear Regression the model, estimation and testing
 Simple Linear Regression the model, estimation and testing Lecture No. 05 Example 1 A production manager has compared the dexterity test scores of five assembly-line employees with their hourly productivity.
Design and Analysis Plan Quantitative Synthesis of Federally-Funded Teen Pregnancy Prevention Programs HHS Contract #HHSP I 5/2/2016
 Design and Analysis Plan Quantitative Synthesis of Federally-Funded Teen Pregnancy Prevention Programs HHS Contract #HHSP233201500069I 5/2/2016 Overview The goal of the meta-analysis is to assess the effects
EPSE 594: Meta-Analysis: Quantitative Research Synthesis
 EPSE 594: Meta-Analysis: Quantitative Research Synthesis Ed Kroc University of British Columbia ed.kroc@ubc.ca March 28, 2019 Ed Kroc (UBC) EPSE 594 March 28, 2019 1 / 32 Last Time Publication bias Funnel
Supplemental Figure S1. Expression of Cirbp mrna in mouse tissues and NIH3T3 cells.
 SUPPLEMENTAL FIGURE AND TABLE LEGENDS Supplemental Figure S1. Expression of Cirbp mrna in mouse tissues and NIH3T3 cells. A) Cirbp mrna expression levels in various mouse tissues collected around the clock
Data analysis and binary regression for predictive discrimination. using DNA microarray data. (Breast cancer) discrimination. Expression array data
 discrimination. Expression array data") West Mike of Statistics & Decision Sciences Institute Duke University wwwstatdukeedu IPAM Functional Genomics Workshop November Two group problems: Binary outcomes ffl eg, ER+ versus ER ffl eg, lymph node
West Mike of Statistics & Decision Sciences Institute Duke University wwwstatdukeedu IPAM Functional Genomics Workshop November Two group problems: Binary outcomes ffl eg, ER+ versus ER ffl eg, lymph node
Understandable Statistics
 Understandable Statistics correlated to the Advanced Placement Program Course Description for Statistics Prepared for Alabama CC2 6/2003 2003 Understandable Statistics 2003 correlated to the Advanced Placement
From Biostatistics Using JMP: A Practical Guide. Full book available for purchase here. Chapter 1: Introduction... 1
 From Biostatistics Using JMP: A Practical Guide. Full book available for purchase here. Contents Dedication... iii Acknowledgments... xi About This Book... xiii About the Author... xvii Chapter 1: Introduction...
Study of cigarette sales in the United States Ge Cheng1, a,
 2nd International Conference on Economics, Management Engineering and Education Technology (ICEMEET 2016) 1Department Study of cigarette sales in the United States Ge Cheng1, a, of pure mathematics and
Pitfalls in Linear Regression Analysis
 Pitfalls in Linear Regression Analysis Due to the widespread availability of spreadsheet and statistical software for disposal, many of us do not really have a good understanding of how to use regression
Multivariable Systems. Lawrence Hubert. July 31, 2011
 Multivariable July 31, 2011 Whenever results are presented within a multivariate context, it is important to remember that there is a system present among the variables, and this has a number of implications
Supplementary Methods
 Supplementary Methods Analysis of time course gene expression data. The time course data of the expression level of a representative gene is shown in the below figure. The trajectory of longitudinal expression
(b) empirical power. IV: blinded IV: unblinded Regr: blinded Regr: unblinded α. empirical power
 empirical power. IV: blinded IV: unblinded Regr: blinded Regr: unblinded α. empirical power") Supplementary Information for: Using instrumental variables to disentangle treatment and placebo effects in blinded and unblinded randomized clinical trials influenced by unmeasured confounders by Elias
Supplementary Information for: Using instrumental variables to disentangle treatment and placebo effects in blinded and unblinded randomized clinical trials influenced by unmeasured confounders by Elias
Content. Basic Statistics and Data Analysis for Health Researchers from Foreign Countries. Research question. Example Newly diagnosed Type 2 Diabetes
 Content Quantifying association between continuous variables. Basic Statistics and Data Analysis for Health Researchers from Foreign Countries Volkert Siersma siersma@sund.ku.dk The Research Unit for General
Heintzman, ND, Stuart, RK, Hon, G, Fu, Y, Ching, CW, Hawkins, RD, Barrera, LO, Van Calcar, S, Qu, C, Ching, KA, Wang, W, Weng, Z, Green, RD,
 Heintzman, ND, Stuart, RK, Hon, G, Fu, Y, Ching, CW, Hawkins, RD, Barrera, LO, Van Calcar, S, Qu, C, Ching, KA, Wang, W, Weng, Z, Green, RD, Crawford, GE, Ren, B (2007) Distinct and predictive chromatin
CHILD HEALTH AND DEVELOPMENT STUDY
 CHILD HEALTH AND DEVELOPMENT STUDY 9. Diagnostics In this section various diagnostic tools will be used to evaluate the adequacy of the regression model with the five independent variables developed in
Memorial Sloan-Kettering Cancer Center
 Memorial Sloan-Kettering Cancer Center Memorial Sloan-Kettering Cancer Center, Dept. of Epidemiology & Biostatistics Working Paper Series Year 2007 Paper 14 On Comparing the Clustering of Regression Models
Multiple trait model combining random regressions for daily feed intake with single measured performance traits of growing pigs
 Genet. Sel. Evol. 34 (2002) 61 81 61 INRA, EDP Sciences, 2002 DOI: 10.1051/gse:2001004 Original article Multiple trait model combining random regressions for daily feed intake with single measured performance
CHAPTER 6. Conclusions and Perspectives
 CHAPTER 6 Conclusions and Perspectives In Chapter 2 of this thesis, similarities and differences among members of (mainly MZ) twin families in their blood plasma lipidomics profiles were investigated.
On the Reproducibility of TCGA Ovarian Cancer MicroRNA Profiles
 On the Reproducibility of TCGA Ovarian Cancer MicroRNA Profiles Ying-Wooi Wan 1,2,4, Claire M. Mach 2,3, Genevera I. Allen 1,7,8, Matthew L. Anderson 2,4,5 *, Zhandong Liu 1,5,6,7 * 1 Departments of Pediatrics
Applied Medical. Statistics Using SAS. Geoff Der. Brian S. Everitt. CRC Press. Taylor Si Francis Croup. Taylor & Francis Croup, an informa business
 Applied Medical Statistics Using SAS Geoff Der Brian S. Everitt CRC Press Taylor Si Francis Croup Boca Raton London New York CRC Press is an imprint of the Taylor & Francis Croup, an informa business A
NORTH SOUTH UNIVERSITY TUTORIAL 2
 NORTH SOUTH UNIVERSITY TUTORIAL 2 AHMED HOSSAIN,PhD Data Management and Analysis AHMED HOSSAIN,PhD - Data Management and Analysis 1 Correlation Analysis INTRODUCTION In correlation analysis, we estimate
Psychology 2019 v1.3. IA2 high-level annotated sample response. Student experiment (20%) August Assessment objectives
 August Assessment objectives") Student experiment (20%) This sample has been compiled by the QCAA to assist and support teachers to match evidence in student responses to the characteristics described in the instrument-specific marking
Student experiment (20%) This sample has been compiled by the QCAA to assist and support teachers to match evidence in student responses to the characteristics described in the instrument-specific marking
MULTIPLE REGRESSION OF CPS DATA
 MULTIPLE REGRESSION OF CPS DATA A further inspection of the relationship between hourly wages and education level can show whether other factors, such as gender and work experience, influence wages. Linear
Advanced IPD meta-analysis methods for observational studies
 Advanced IPD meta-analysis methods for observational studies Simon Thompson University of Cambridge, UK Part 4 IBC Victoria, July 2016 1 Outline of talk Usual measures of association (e.g. hazard ratios)
Meta-Analysis. Zifei Liu. Biological and Agricultural Engineering
 Meta-Analysis Zifei Liu What is a meta-analysis; why perform a metaanalysis? How a meta-analysis work some basic concepts and principles Steps of Meta-analysis Cautions on meta-analysis 2 What is Meta-analysis
Choosing a Significance Test. Student Resource Sheet
 Choosing a Significance Test Student Resource Sheet Choosing Your Test Choosing an appropriate type of significance test is a very important consideration in analyzing data. If an inappropriate test is
Statistical Analysis of Single Nucleotide Polymorphism Microarrays in Cancer Studies
 Statistical Analysis of Single Nucleotide Polymorphism Microarrays in Cancer Studies Stanford Biostatistics Workshop Pierre Neuvial with Henrik Bengtsson and Terry Speed Department of Statistics, UC Berkeley
Method Comparison Report Semi-Annual 1/5/2018
 Method Comparison Report Semi-Annual 1/5/2018 Prepared for Carl Commissioner Regularatory Commission 123 Commission Drive Anytown, XX, 12345 Prepared by Dr. Mark Mainstay Clinical Laboratory Kennett Community
Experimental Design For Microarray Experiments. Robert Gentleman, Denise Scholtens Arden Miller, Sandrine Dudoit
 Experimental Design For Microarray Experiments Robert Gentleman, Denise Scholtens Arden Miller, Sandrine Dudoit Copyright 2002 Complexity of Genomic data the functioning of cells is a complex and highly
Econometric Game 2012: infants birthweight?
 Econometric Game 2012: How does maternal smoking during pregnancy affect infants birthweight? Case A April 18, 2012 1 Introduction Low birthweight is associated with adverse health related and economic
An Introduction to Modern Econometrics Using Stata
 An Introduction to Modern Econometrics Using Stata CHRISTOPHER F. BAUM Department of Economics Boston College A Stata Press Publication StataCorp LP College Station, Texas Contents Illustrations Preface
Supporting Information
 1 2 3 4 5 6 7 8 9 10 11 12 13 14 15 16 17 18 19 20 21 22 23 24 25 26 27 28 29 30 31 32 33 34 35 36 37 38 39 40 Supporting Information Variances and biases of absolute distributions were larger in the 2-line
Machine Learning! Robert Stengel! Robotics and Intelligent Systems MAE 345,! Princeton University, 2017
 Machine Learning! Robert Stengel! Robotics and Intelligent Systems MAE 345,! Princeton University, 2017 A.K.A. Artificial Intelligence Unsupervised learning! Cluster analysis Patterns, Clumps, and Joining
Biology 345: Biometry Fall 2005 SONOMA STATE UNIVERSITY Lab Exercise 5 Residuals and multiple regression Introduction
 Biology 345: Biometry Fall 2005 SONOMA STATE UNIVERSITY Lab Exercise 5 Residuals and multiple regression Introduction In this exercise, we will gain experience assessing scatterplots in regression and
EXPression ANalyzer and DisplayER
 EXPression ANalyzer and DisplayER Tom Hait Aviv Steiner Igor Ulitsky Chaim Linhart Amos Tanay Seagull Shavit Rani Elkon Adi Maron-Katz Dorit Sagir Eyal David Roded Sharan Israel Steinfeld Yossi Shiloh
Multiple Regression. James H. Steiger. Department of Psychology and Human Development Vanderbilt University
 Multiple Regression James H. Steiger Department of Psychology and Human Development Vanderbilt University James H. Steiger (Vanderbilt University) Multiple Regression 1 / 19 Multiple Regression 1 The Multiple
WDHS Curriculum Map Probability and Statistics. What is Statistics and how does it relate to you?
 WDHS Curriculum Map Probability and Statistics Time Interval/ Unit 1: Introduction to Statistics 1.1-1.3 2 weeks S-IC-1: Understand statistics as a process for making inferences about population parameters
Nature Genetics: doi: /ng Supplementary Figure 1. Assessment of sample purity and quality.
 Supplementary Figure 1 Assessment of sample purity and quality. (a) Hematoxylin and eosin staining of formaldehyde-fixed, paraffin-embedded sections from a human testis biopsy collected concurrently with
Bangor University Laboratory Exercise 1, June 2008
 Laboratory Exercise, June 2008 Classroom Exercise A forest land owner measures the outside bark diameters at.30 m above ground (called diameter at breast height or dbh) and total tree height from ground
List of Figures. List of Tables. Preface to the Second Edition. Preface to the First Edition
 List of Figures List of Tables Preface to the Second Edition Preface to the First Edition xv xxv xxix xxxi 1 What Is R? 1 1.1 Introduction to R................................ 1 1.2 Downloading and Installing
Breast cancer. Risk factors you cannot change include: Treatment Plan Selection. Inferring Transcriptional Module from Breast Cancer Profile Data
 Breast cancer Inferring Transcriptional Module from Breast Cancer Profile Data Breast Cancer and Targeted Therapy Microarray Profile Data Inferring Transcriptional Module Methods CSC 177 Data Warehousing
Ecological Statistics
 A Primer of Ecological Statistics Second Edition Nicholas J. Gotelli University of Vermont Aaron M. Ellison Harvard Forest Sinauer Associates, Inc. Publishers Sunderland, Massachusetts U.S.A. Brief Contents
Logistic regression: Why we often can do what we think we can do 1.
 Logistic regression: Why we often can do what we think we can do 1. Augst 8 th 2015 Maarten L. Buis, University of Konstanz, Department of History and Sociology maarten.buis@uni.konstanz.de All propositions
ChIP-seq analysis. J. van Helden, M. Defrance, C. Herrmann, D. Puthier, N. Servant, M. Thomas-Chollier, O.Sand
 ChIP-seq analysis J. van Helden, M. Defrance, C. Herrmann, D. Puthier, N. Servant, M. Thomas-Chollier, O.Sand Tuesday : quick introduction to ChIP-seq and peak-calling (Presentation + Practical session)
Supplement to SCnorm: robust normalization of single-cell RNA-seq data
 Supplement to SCnorm: robust normalization of single-cell RNA-seq data Supplementary Note 1: SCnorm does not require spike-ins, since we find that the performance of spike-ins in scrna-seq is often compromised,
Chapter 17 Sensitivity Analysis and Model Validation
 Chapter 17 Sensitivity Analysis and Model Validation Justin D. Salciccioli, Yves Crutain, Matthieu Komorowski and Dominic C. Marshall Learning Objectives Appreciate that all models possess inherent limitations
Please revise your paper to respond to all of the comments by the reviewers. Their reports are available at the end of this letter, below.
 Dear editor and dear reviewers Thank you very much for the additional comments and suggestions. We have modified the manuscript according to the comments below. We have also updated the literature search
Simple Linear Regression
 Simple Linear Regression Assoc. Prof Dr Sarimah Abdullah Unit of Biostatistics & Research Methodology School of Medical Sciences, Health Campus Universiti Sains Malaysia Regression Regression analysis
Describe what is meant by a placebo Contrast the double-blind procedure with the single-blind procedure Review the structure for organizing a memo
 Business Statistics The following was provided by Dr. Suzanne Delaney, and is a comprehensive review of Business Statistics. The workshop instructor will provide relevant examples during the Skills Assessment
Diurnal Pattern of Reaction Time: Statistical analysis
 Diurnal Pattern of Reaction Time: Statistical analysis Prepared by: Alison L. Gibbs, PhD, PStat Prepared for: Dr. Principal Investigator of Reaction Time Project January 11, 2015 Summary: This report gives
Aspects of Statistical Modelling & Data Analysis in Gene Expression Genomics. Mike West Duke University
 Aspects of Statistical Modelling & Data Analysis in Gene Expression Genomics Mike West Duke University Papers, software, many links: www.isds.duke.edu/~mw ABS04 web site: Lecture slides, stats notes, papers,
Regression Discontinuity Analysis
 Regression Discontinuity Analysis A researcher wants to determine whether tutoring underachieving middle school students improves their math grades. Another wonders whether providing financial aid to low-income
ChIP-seq data analysis
 ChIP-seq data analysis Harri Lähdesmäki Department of Computer Science Aalto University November 24, 2017 Contents Background ChIP-seq protocol ChIP-seq data analysis Transcriptional regulation Transcriptional
2.75: 84% 2.5: 80% 2.25: 78% 2: 74% 1.75: 70% 1.5: 66% 1.25: 64% 1.0: 60% 0.5: 50% 0.25: 25% 0: 0%
 Capstone Test (will consist of FOUR quizzes and the FINAL test grade will be an average of the four quizzes). Capstone #1: Review of Chapters 1-3 Capstone #2: Review of Chapter 4 Capstone #3: Review of
A Comparison of Robust and Nonparametric Estimators Under the Simple Linear Regression Model
 Nevitt & Tam A Comparison of Robust and Nonparametric Estimators Under the Simple Linear Regression Model Jonathan Nevitt, University of Maryland, College Park Hak P. Tam, National Taiwan Normal University
CRITERIA FOR USE. A GRAPHICAL EXPLANATION OF BI-VARIATE (2 VARIABLE) REGRESSION ANALYSISSys
 REGRESSION ANALYSISSys") Multiple Regression Analysis 1 CRITERIA FOR USE Multiple regression analysis is used to test the effects of n independent (predictor) variables on a single dependent (criterion) variable. Regression tests
Multiple Regression Analysis 1 CRITERIA FOR USE Multiple regression analysis is used to test the effects of n independent (predictor) variables on a single dependent (criterion) variable. Regression tests
The Epigenome Tools 2: ChIP-Seq and Data Analysis
 The Epigenome Tools 2: ChIP-Seq and Data Analysis Chongzhi Zang zang@virginia.edu http://zanglab.com PHS5705: Public Health Genomics March 20, 2017 1 Outline Epigenome: basics review ChIP-seq overview
Graphical assessment of internal and external calibration of logistic regression models by using loess smoothers
 Tutorial in Biostatistics Received 21 November 2012, Accepted 17 July 2013 Published online 23 August 2013 in Wiley Online Library (wileyonlinelibrary.com) DOI: 10.1002/sim.5941 Graphical assessment of
Abstract. Optimization strategy of Copy Number Variant calling using Multiplicom solutions APPLICATION NOTE. Introduction
 Optimization strategy of Copy Number Variant calling using Multiplicom solutions Michael Vyverman, PhD; Laura Standaert, PhD and Wouter Bossuyt, PhD Abstract Copy number variations (CNVs) represent a significant
The RSC Complex Localizes to Coding Sequences to Regulate Pol II and Histone Occupancy
 Article The RSC Complex Localizes to Coding Sequences to Regulate Pol II and Histone Occupancy Marla M. Spain, Suraiya A. Ansari, 2 Rakesh Pathak, Michael J. Palumbo, 2 Randall H. Morse, 2 and Chhabi K.
STATISTICS AND RESEARCH DESIGN
 Statistics 1 STATISTICS AND RESEARCH DESIGN These are subjects that are frequently confused. Both subjects often evoke student anxiety and avoidance. To further complicate matters, both areas appear have
The Insulator Binding Protein CTCF Positions 20 Nucleosomes around Its Binding Sites across the Human Genome
 The Insulator Binding Protein CTCF Positions 20 Nucleosomes around Its Binding Sites across the Human Genome Yutao Fu 1, Manisha Sinha 2,3, Craig L. Peterson 3, Zhiping Weng 1,4,5 * 1 Bioinformatics Program,
Preliminary Report on Simple Statistical Tests (t-tests and bivariate correlations)
") Preliminary Report on Simple Statistical Tests (t-tests and bivariate correlations) After receiving my comments on the preliminary reports of your datasets, the next step for the groups is to complete
Preliminary Report on Simple Statistical Tests (t-tests and bivariate correlations) After receiving my comments on the preliminary reports of your datasets, the next step for the groups is to complete
Raymond Auerbach PhD Candidate, Yale University Gerstein and Snyder Labs August 30, 2012
 Elucidating Transcriptional Regulation at Multiple Scales Using High-Throughput Sequencing, Data Integration, and Computational Methods Raymond Auerbach PhD Candidate, Yale University Gerstein and Snyder
Use Case 9: Coordinated Changes of Epigenomic Marks Across Tissue Types. Epigenome Informatics Workshop Bioinformatics Research Laboratory
 Use Case 9: Coordinated Changes of Epigenomic Marks Across Tissue Types Epigenome Informatics Workshop Bioinformatics Research Laboratory 1 Introduction Active or inactive states of transcription factor
Notes for laboratory session 2
 Notes for laboratory session 2 Preliminaries Consider the ordinary least-squares (OLS) regression of alcohol (alcohol) and plasma retinol (retplasm). We do this with STATA as follows:. reg retplasm alcohol
Basic Biostatistics. Chapter 1. Content
 Chapter 1 Basic Biostatistics Jamalludin Ab Rahman MD MPH Department of Community Medicine Kulliyyah of Medicine Content 2 Basic premises variables, level of measurements, probability distribution Descriptive
Comparison of discrimination methods for the classification of tumors using gene expression data
 Comparison of discrimination methods for the classification of tumors using gene expression data Sandrine Dudoit, Jane Fridlyand 2 and Terry Speed 2,. Mathematical Sciences Research Institute, Berkeley
Sum of Neurally Distinct Stimulus- and Task-Related Components.
 SUPPLEMENTARY MATERIAL for Cardoso et al. 22 The Neuroimaging Signal is a Linear Sum of Neurally Distinct Stimulus- and Task-Related Components. : Appendix: Homogeneous Linear ( Null ) and Modified Linear
Citation for published version (APA): Ebbes, P. (2004). Latent instrumental variables: a new approach to solve for endogeneity s.n.
: Ebbes, P. (2004). Latent instrumental variables: a new approach to solve for endogeneity s.n.") University of Groningen Latent instrumental variables Ebbes, P. IMPORTANT NOTE: You are advised to consult the publisher's version (publisher's PDF) if you wish to cite from it. Please check the document
University of Groningen Latent instrumental variables Ebbes, P. IMPORTANT NOTE: You are advised to consult the publisher's version (publisher's PDF) if you wish to cite from it. Please check the document
UNIVERSITY of PENNSYLVANIA CIS 520: Machine Learning Midterm, 2016
 UNIVERSITY of PENNSYLVANIA CIS 520: Machine Learning Midterm, 2016 Exam policy: This exam allows one one-page, two-sided cheat sheet; No other materials. Time: 80 minutes. Be sure to write your name and
AP Statistics. Semester One Review Part 1 Chapters 1-5
 AP Statistics Semester One Review Part 1 Chapters 1-5 AP Statistics Topics Describing Data Producing Data Probability Statistical Inference Describing Data Ch 1: Describing Data: Graphically and Numerically