Meaning-based guidance of attention in scenes as revealed by meaning maps
|
|
|
- Letitia Gallagher
- 6 years ago
- Views:
Transcription
1 SUPPLEMENTARY INFORMATION Letters DOI: 1.138/s In the format provided by the authors and unedited. -based guidance of attention in scenes as revealed by meaning maps John M. Henderson 1,2 * and Taylor R. Hayes 2 1 Department of Psychology, University of California, Davis, CA 95618, USA. 2 Center for Mind and Brain, University of California, Davis, CA 95618, USA. * johnhenderson@ucdavis.edu Nature Human Behaviour Macmillan Publishers Limited, part of Springer Nature. All rights reserved.
2 -Based Guidance of Attention in Scenes as Revealed by Maps John M. Henderson 1,2 and Taylor R. Hayes 2 1 Department of Psychology, University of California, Davis 2 Center for Mind and Brain, University of California, Davis
3 Supplementary Methods Analyses Excluding Map Centers To ensure that the advantage of meaning maps over saliency maps in predicting attention was not due to a center bias advantage for the meaning maps, we conducted a supplementary set of analyses in which the data from the central 3 degrees of each map was removed from consideration. Differences in map successes in this analysis could therefore not be attributed to differences in the ability of meaning maps to predict central fixations. The results of these analyses was qualitatively and quantitatively very similar to the complete analyses. Supplementary Figure 1 shows the correlation of meaning and salience for each scene. On average across all scenes the correlation was.81 (SD=.7). A one sample t-test confirmed that the correlation was significantly greater than zero, t(39) = 69.5, p <.1, 95% CI [.79,.84]. and salience also each accounted for unique variance (i.e., 34% of the variance was not shared). Supplementary Figure 2 presents the linear correlation data used to assess the degree to which meaning maps and saliency maps accounted for shared and unique variance in the attention maps data for each scene. Each data point shows the R 2 value for the prediction maps (meaning and saliency) and the observed attention maps for saliency (blue) and meaning (red). The top of Supplementary Figure 2 shows the squared linear correlations. On average across the 4 scenes, meaning accounted for 52% of the variance in fixation density (M=.52, SD=.11) and saliency account for 37% of the variance in fixation density (M =.37, SD =.13). A two-tailed t-test revealed this difference was statistically significant, t(78) = 5.53, p <.1, 95% CI [.9,.2]. To examine the unique variance in attention explained by meaning and salience when controlling for their shared variance, we computed squared semi-partial correlations. These correlations, shown in the bottom of Supplementary Figure 2, revealed that across the 4 scenes, meaning captured more than 4 times as much unique variance (M=.19, SD=.1)
4 as saliency (M =.4, SD =.4). A two-tailed t-test confirmed that this difference was statistically significant, t(78) = 8.27, p <.1, 95% CI [.11,.18]. These results confirm those of the complete analysis and indicate that meaning was better able than salience to explain the distribution of attention over scenes even when scene centers were excluded. Supplementary Figure 3 shows the temporal time-step analyses with the map centers removed. Linear correlation and semi-partial correlation were conducted as in the main time-step analyses based on a series of attention maps generated from each sequential eye fixation (1st, 2nd, 3rd, etc.) in each scene. Using the same testing and false discovery rate correction as in the main analyses, all 38 time points were significantly different in both the linear and semi-partial analyses (FDR<.5). In the linear correlation analysis (top of Supplementary Figure 3), meaning accounted for 29.8%, 32.2%, and 31.% of the variance in the first 3 fixations, whereas salience accounted for only 9.6%, 15.7%,and 17.6% of the variance in the first 3 fixations. When controlling for the correlation among the two prediction maps with semi-partial correlations, the advantage for the meaning maps observed in the overall analyses was also found to hold across time steps, as shown in the bottom of Supplementary Figure 3. accounting for 23.3%, 21.6%, and 17.8% of the unique variance in the first 3 fixations, whereas salience accounted for 3.3%, 5.%, and 4.4% of the unique variance in the first 3 fixations, respectively. Replication with Aesthetic Judgment Task To ensure that the observed results replicate over viewing instruction, we ran a second experiment using twelve of the original scenes under two viewing instructions. The twelve scenes were selected at random before the results of the main experiment were known. Subjects were instructed to memorize the scenes (memorization task) or to indicate how much they liked each scene on a 1-3 scale (aesthetic judgment task). Forty-six subjects viewed the twelve scenes, with each subject seeing six scenes in each of the instruction conditions. Each subject saw each scene once, with assignment of scene to task counterbalanced across subjects, so data for each scene in each condition was based on 23 subjects. Order of task
5 was counterbalanced across subjects. Scenes were each viewed for twelve seconds as in the main experiment. Attention maps generated from these subjects were then compared to the meaning and saliency maps as described in the main experiment. The results for the memorization and aesthetic judgment tasks are shown in Supplementary Figures 4 and 5 respectively. The new data in each figure are shown as individual data points superimposed on the data figures from the original experiment. Each data point shows the R 2 value for each prediction map (meaning and saliency) and the observed attention maps. The top panels of Supplementary Figures 4 and 5 show the squared linear correlations. For the memorization task, on average across the 12 scenes, meaning accounted for 52% of the variance in fixation density (M=.52, SD=.12) and saliency account for 3% of the variance in fixation density (M=.3, SD=.12). A two-tailed ttest revealed this difference was statistically significant, t(22) = 4.57, p <.1, 95% CI [.12,.33]. For the aesthetic judgment task, on average across the 12 scenes, meaning accounted for 57% of the variance in fixation density (M=.57, SD=.9) and saliency account for 3% of the variance in fixation density (M=.3, SD=.12). A two-tailed t-test revealed this difference was statistically significant, t(22) = 6.27, p <.1, 95% CI [.18,.37]. The bottom panels of Supplementary Figures 4 and 5 show the squared semi-partial correlations to examine the unique variance in attention explained by meaning and salience when controlling for their shared variance. For the memorization task, these correlations revealed that across the 12 scenes, meaning captured more than 2 times as much unique variance (M=.24, SD=.1) as saliency (M=.1, SD=.2). A two-tailed t-test revealed this difference was statistically significant, t(22) = 7.5, p <.1, 95% CI [.16,.28]. For the aesthetic judgment task, across the 12 scenes meaning captured more than 25 times as much unique variance (M=.29, SD=.11) as saliency (M=.1, SD=.2). A two-tailed t-test revealed this difference was statistically significant, t(22) = 8.35, p <.1, 95% CI [.21,.34]. These results confirm those of the main experiment and indicate that meaning was better able than salience to explain the distribution of attention over scenes even when scene centers were excluded.
6 Supplementary Figures Correlation Scene Number All Scenes Supplementary Figure 1 Correlation between saliency and meaning maps excluding map centers. The line plot shows the correlation between saliency and meaning maps for each scene. The scatter box plot on the right shows the corresponding grand mean (black horizontal line), 95% confidence intervals (colored box), and 1 standard deviation (black vertical line) across all 4 scenes. Linear Corr. (R 2 ) Unique Corr. (R 2 ) Scene Number All Scenes Supplementary Figure 2 Squared linear correlation and semi-partial correlation by scene and across all scenes excluding map centers. The line plots show the linear correlation (top) and semi-partial correlation (bottom) between fixation density and meaning (red) and salience (blue) by scene. The scatter box plots on the right show the corresponding grand mean (black horizontal line), 95% confidence intervals (colored box), and 1 standard deviation (black vertical line) for meaning and salience across all 4 scenes.
7 Linear Corr. (R 2 ) Unique Corr. (R 2 ) Fixation Number Supplementary Figure 3 Squared linear correlation and squared semi-partial correlation as a function of fixation number excluding map centers. The top panel shows the squared linear correlation between fixation density and meaning (red) and salience (blue) as a function of fixation order across all 4 scenes. The bottom panel shows the corresponding semi-partial correlation as a function of fixation order across all 4 scenes. Error bars represent standard error of the mean. Linear Corr. (R 2 ) Unique Corr. (R 2 ) Scene Number All Scenes Supplementary Figure 4 Squared linear correlation and semi-partial correlation by scene and across scenes for the memorization condition of the replication experiment (dark symbols) superimposed on the data from the original experiment (light lines). The plots show the linear correlation (top) and semi-partial correlation (bottom) between fixation density and meaning (red) and salience (blue) by scene. The scatter box plots on the right show the corresponding grand mean (black horizontal line), 95% confidence intervals (colored box), and 1 standard deviation (black vertical line) for meaning and salience across all 12 scenes.
8 Linear Corr. (R 2 ) Unique Corr. (R 2 ) Scene Number All Scenes Supplementary Figure 5 Squared linear correlation and semi-partial correlation by scene and across scenes for the aesthetic judgment condition of the replication experiment (dark symbols) superimposed on the data from the original experiment (light lines). The plots show the linear correlation (top) and semipartial correlation (bottom) between fixation density and meaning (red) and salience (blue) by scene. The scatter box plots on the right show the corresponding grand mean (black horizontal line), 95% confidence intervals (colored box), and 1 standard deviation (black vertical line) for meaning and salience across all 12 scenes.
9
10
11
12

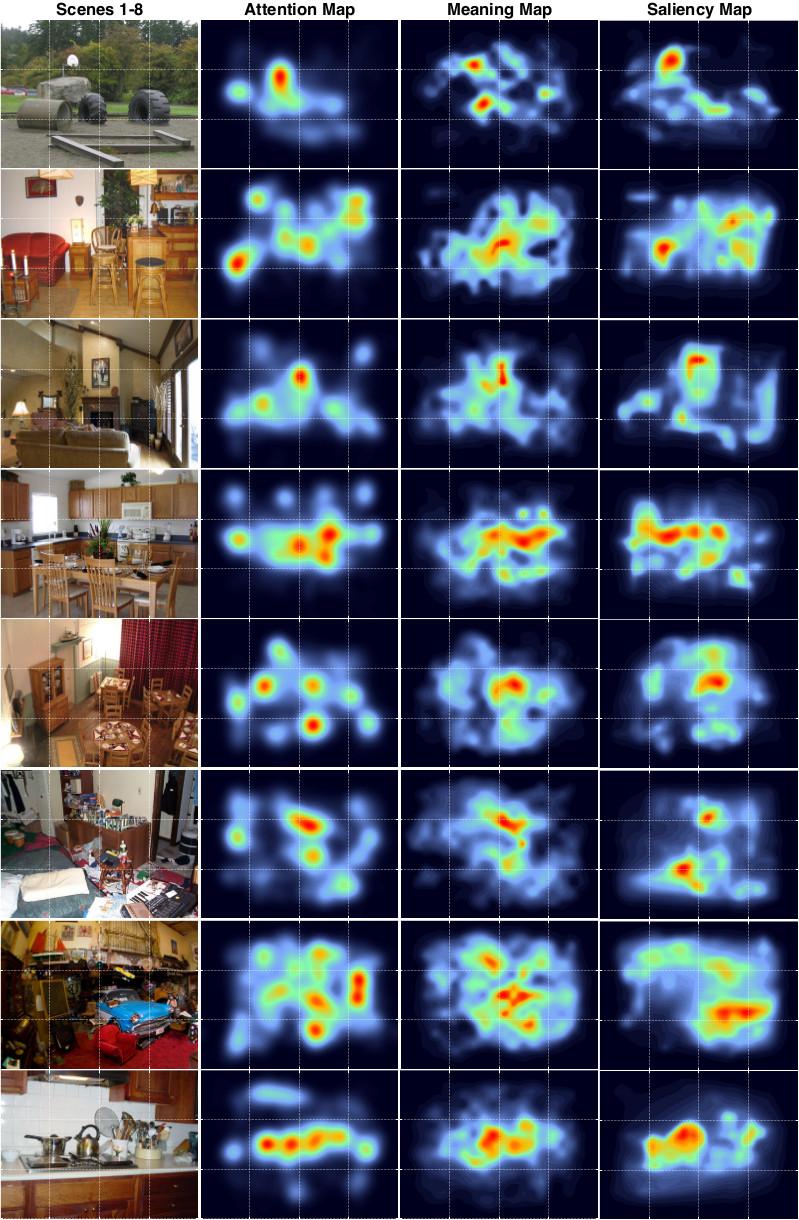
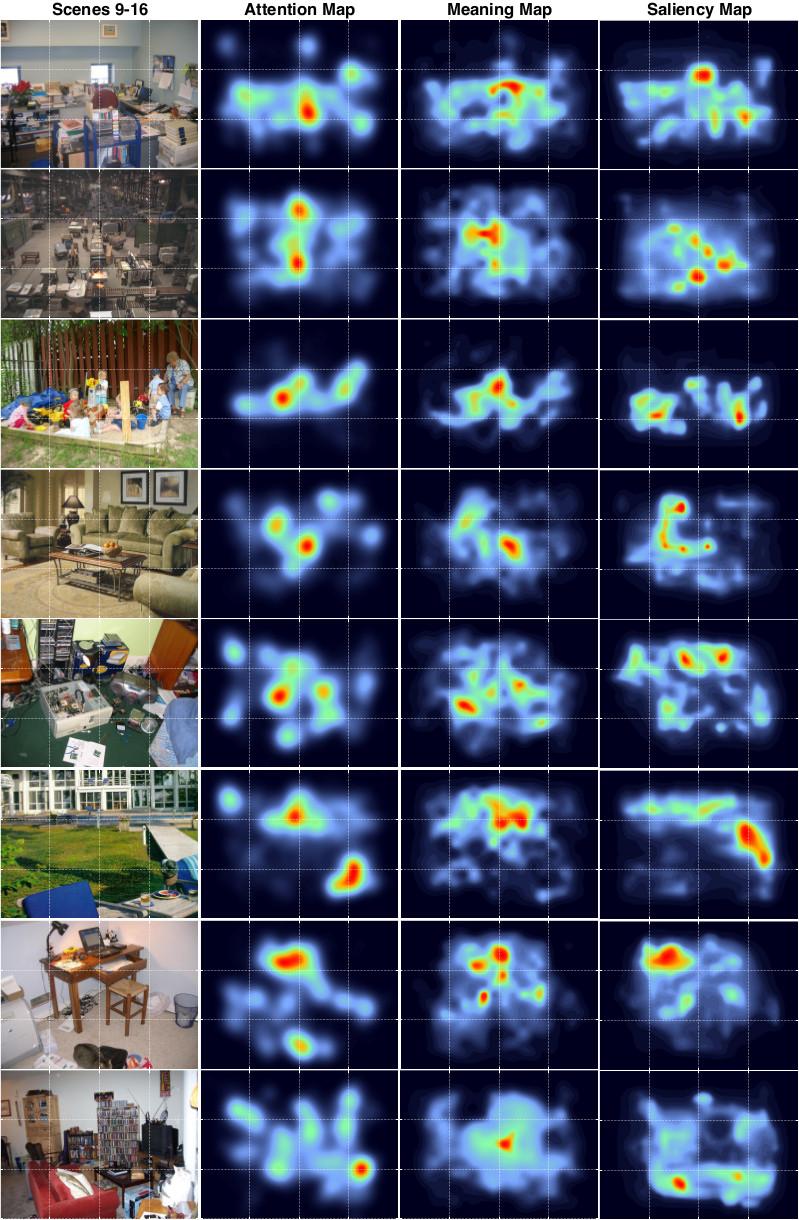
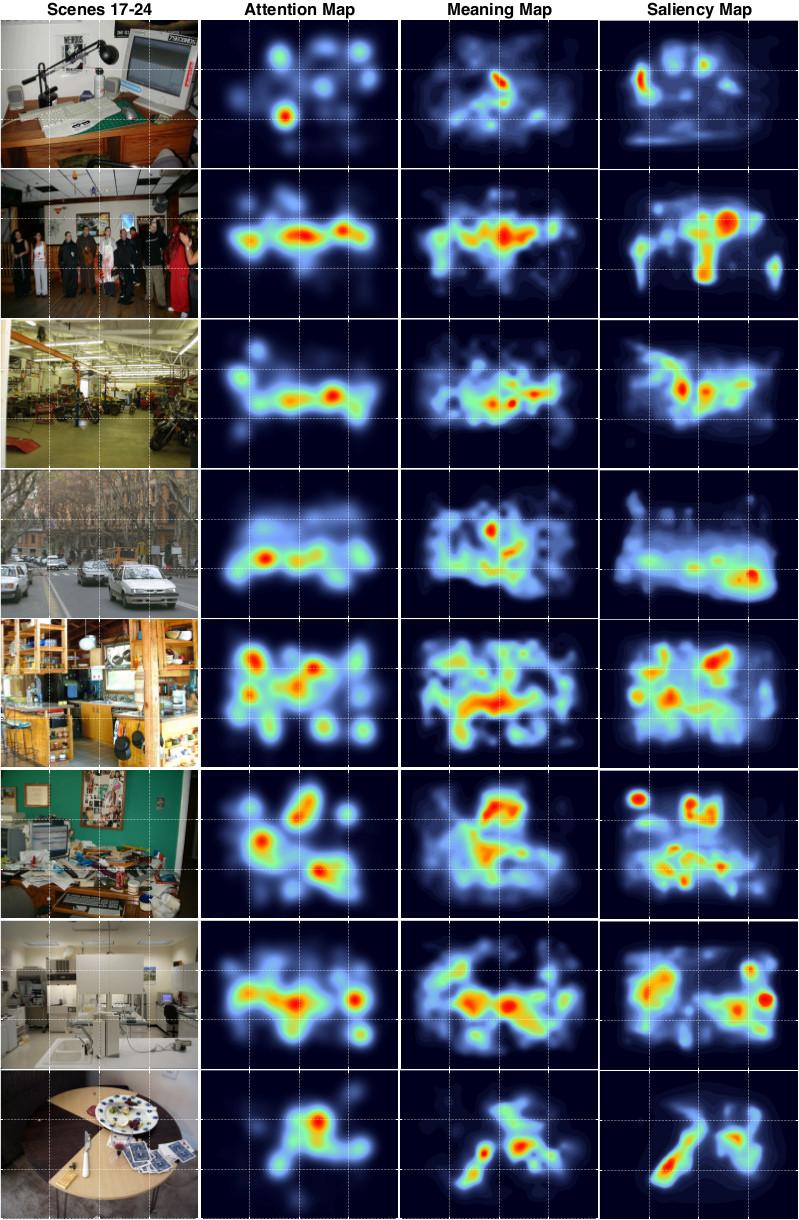
13 Supplementary Figure 6 All scenes and corresponding attention, meaning, and saliency maps. Figure by Henderson & Hayes, 217; available at under a CC- BY4. license.
Nature Structural & Molecular Biology: doi: /nsmb.2419
 Supplementary Figure 1 Mapped sequence reads and nucleosome occupancies. (a) Distribution of sequencing reads on the mouse reference genome for chromosome 14 as an example. The number of reads in a 1 Mb
Computational Cognitive Science
 Computational Cognitive Science Lecture 19: Contextual Guidance of Attention Chris Lucas (Slides adapted from Frank Keller s) School of Informatics University of Edinburgh clucas2@inf.ed.ac.uk 20 November
Daniel Boduszek University of Huddersfield
 Daniel Boduszek University of Huddersfield d.boduszek@hud.ac.uk Introduction to Correlation SPSS procedure for Pearson r Interpretation of SPSS output Presenting results Partial Correlation Correlation
Sum of Neurally Distinct Stimulus- and Task-Related Components.
 SUPPLEMENTARY MATERIAL for Cardoso et al. 22 The Neuroimaging Signal is a Linear Sum of Neurally Distinct Stimulus- and Task-Related Components. : Appendix: Homogeneous Linear ( Null ) and Modified Linear
Supplementary materials for: Executive control processes underlying multi- item working memory
 Supplementary materials for: Executive control processes underlying multi- item working memory Antonio H. Lara & Jonathan D. Wallis Supplementary Figure 1 Supplementary Figure 1. Behavioral measures of
Psychology Research Process
 Psychology Research Process Logical Processes Induction Observation/Association/Using Correlation Trying to assess, through observation of a large group/sample, what is associated with what? Examples:
Supplementary Figure 1. Localization of face patches (a) Sagittal slice showing the location of fmri-identified face patches in one monkey targeted
 Sagittal slice showing the location of fmri-identified face patches in one monkey targeted") Supplementary Figure 1. Localization of face patches (a) Sagittal slice showing the location of fmri-identified face patches in one monkey targeted for recording; dark black line indicates electrode. Stereotactic
Supplementary Figure 1. Localization of face patches (a) Sagittal slice showing the location of fmri-identified face patches in one monkey targeted for recording; dark black line indicates electrode. Stereotactic
Performance and Saliency Analysis of Data from the Anomaly Detection Task Study
 Performance and Saliency Analysis of Data from the Anomaly Detection Task Study Adrienne Raglin 1 and Andre Harrison 2 1 U.S. Army Research Laboratory, Adelphi, MD. 20783, USA {adrienne.j.raglin.civ, andre.v.harrison2.civ}@mail.mil
Simple Linear Regression the model, estimation and testing
 Simple Linear Regression the model, estimation and testing Lecture No. 05 Example 1 A production manager has compared the dexterity test scores of five assembly-line employees with their hourly productivity.
Supplementary Figure 1
 Supplementary Figure 1 5 microns C7 B6 unclassified H19 C7 signal H19 guide signal H19 B6 signal C7 SNP spots H19 RNA spots B6 SNP spots colocalization H19 RNA classification Supplementary Figure 1. Allele-specific
Supplementary Figure 1: Attenuation of association signals after conditioning for the lead SNP. a) attenuation of association signal at the 9p22.
 attenuation of association signal at the 9p22.") Supplementary Figure 1: Attenuation of association signals after conditioning for the lead SNP. a) attenuation of association signal at the 9p22.32 PCOS locus after conditioning for the lead SNP rs10993397;
Supplementary Figure 1: Attenuation of association signals after conditioning for the lead SNP. a) attenuation of association signal at the 9p22.32 PCOS locus after conditioning for the lead SNP rs10993397;
Validating the Visual Saliency Model
 Validating the Visual Saliency Model Ali Alsam and Puneet Sharma Department of Informatics & e-learning (AITeL), Sør-Trøndelag University College (HiST), Trondheim, Norway er.puneetsharma@gmail.com Abstract.
Templates for Rejection: Configuring Attention to Ignore Task-Irrelevant Features
 Journal of Experimental Psychology: Human Perception and Performance 2012, Vol. 38, No. 3, 580 584 2012 American Psychological Association 0096-1523/12/$12.00 DOI: 10.1037/a0027885 OBSERVATION Templates
Two-Way Independent Samples ANOVA with SPSS
 Two-Way Independent Samples ANOVA with SPSS Obtain the file ANOVA.SAV from my SPSS Data page. The data are those that appear in Table 17-3 of Howell s Fundamental statistics for the behavioral sciences
Incomplete immune response to Coxsackie B viruses. associates with early autoimmunity against insulin
 Incomplete immune response to Coxsackie B viruses associates with early autoimmunity against insulin Michelle P. Ashton 1, Anne Eugster 1, Denise Walther 1, Natalie Daehling 1, Stephanie Riethausen 2,
Rapid evolution of highly variable competitive abilities in a key phytoplankton species
 SUPPLEMENTARY Brief Communication INFORMATION https://doi.org/10.1038/s41559-018-0474-x In the format provided by the authors and unedited. Rapid evolution of highly variable competitive abilities in a
(Visual) Attention. October 3, PSY Visual Attention 1
 Attention. October 3, PSY Visual Attention 1") (Visual) Attention Perception and awareness of a visual object seems to involve attending to the object. Do we have to attend to an object to perceive it? Some tasks seem to proceed with little or no attention
(Visual) Attention Perception and awareness of a visual object seems to involve attending to the object. Do we have to attend to an object to perceive it? Some tasks seem to proceed with little or no attention
Research Methods in Forest Sciences: Learning Diary. Yoko Lu December Research process
 Research Methods in Forest Sciences: Learning Diary Yoko Lu 285122 9 December 2016 1. Research process It is important to pursue and apply knowledge and understand the world under both natural and social
Is the straddle effect in contrast perception limited to secondorder spatial vision?
 Journal of Vision (2018) 18(5):15, 1 43 1 Is the straddle effect in contrast perception limited to secondorder spatial vision? Norma V. Graham Department of Psychology, Columbia University, New York, NY,
Theta sequences are essential for internally generated hippocampal firing fields.
 Theta sequences are essential for internally generated hippocampal firing fields. Yingxue Wang, Sandro Romani, Brian Lustig, Anthony Leonardo, Eva Pastalkova Supplementary Materials Supplementary Modeling
PRINTABLE VERSION. Quiz 1. True or False: The amount of rainfall in your state last month is an example of continuous data.
 Question 1 PRINTABLE VERSION Quiz 1 True or False: The amount of rainfall in your state last month is an example of continuous data. a) True b) False Question 2 True or False: The standard deviation is
Nature Neuroscience: doi: /nn Supplementary Figure 1. Neuron class-specific arrangements of Khc::nod::lacZ label in dendrites.
 Supplementary Figure 1 Neuron class-specific arrangements of Khc::nod::lacZ label in dendrites. Staining with fluorescence antibodies to detect GFP (Green), β-galactosidase (magenta/white). (a, b) Class
Supplementary experiment: neutral faces. This supplementary experiment had originally served as a pilot test of whether participants
 Supplementary experiment: neutral faces This supplementary experiment had originally served as a pilot test of whether participants would automatically shift their attention towards to objects the seen
Unit 7 Comparisons and Relationships
 Unit 7 Comparisons and Relationships Objectives: To understand the distinction between making a comparison and describing a relationship To select appropriate graphical displays for making comparisons
Shining in the Center: Central Gaze Cascade Effect on Product Choice
 Shining in the Center: Central Gaze Cascade Effect on Product Choice Selin Atalay H. Onur Bodur Dina Rasolofoarison Danny Purpose: How can eye-tracking be used to explain the process underlying consumers
Supplementary Information Methods Subjects The study was comprised of 84 chronic pain patients with either chronic back pain (CBP) or osteoarthritis
 or osteoarthritis") Supplementary Information Methods Subjects The study was comprised of 84 chronic pain patients with either chronic back pain (CBP) or osteoarthritis (OA). All subjects provided informed consent to procedures
Supplementary Information Methods Subjects The study was comprised of 84 chronic pain patients with either chronic back pain (CBP) or osteoarthritis (OA). All subjects provided informed consent to procedures
Chapter 9: Comparing two means
 Chapter 9: Comparing two means Smart Alex s Solutions Task 1 Is arachnophobia (fear of spiders) specific to real spiders or will pictures of spiders evoke similar levels of anxiety? Twelve arachnophobes
Supplemental material on graphical presentation methods to accompany:
 Supplemental material on graphical presentation methods to accompany: Preacher, K. J., & Kelley, K. (011). Effect size measures for mediation models: Quantitative strategies for communicating indirect
Supplementary Material. other ethnic backgrounds. All but six of the yoked pairs were matched on ethnicity. Results
 Supplementary Material S1 Methodological Details Participants The sample was 80% Caucasian, 16.7% Asian or Asian American, and 3.3% from other ethnic backgrounds. All but six of the yoked pairs were matched
SCALAR TIMING (EXPECTANCY) THEORY: A COMPARISON BETWEEN PROSPECTIVE AND RETROSPECTIVE DURATION. Abstract
 THEORY: A COMPARISON BETWEEN PROSPECTIVE AND RETROSPECTIVE DURATION. Abstract") SCALAR TIMING (EXPECTANCY) THEORY: A COMPARISON BETWEEN PROSPECTIVE AND RETROSPECTIVE DURATION Hannes Eisler and Anna D. Eisler Department of Psychology, Stockholm University, Stockholm, Sweden he@psychology.su.se
SCALAR TIMING (EXPECTANCY) THEORY: A COMPARISON BETWEEN PROSPECTIVE AND RETROSPECTIVE DURATION Hannes Eisler and Anna D. Eisler Department of Psychology, Stockholm University, Stockholm, Sweden he@psychology.su.se
Online Appendix Material and Methods: Pancreatic RNA isolation and quantitative real-time (q)rt-pcr. Mice were fasted overnight and killed 1 hour (h)
rt-pcr. Mice were fasted overnight and killed 1 hour (h)") Online Appendix Material and Methods: Pancreatic RNA isolation and quantitative real-time (q)rt-pcr. Mice were fasted overnight and killed 1 hour (h) after feeding. A small slice (~5-1 mm 3 ) was taken
Online Appendix Material and Methods: Pancreatic RNA isolation and quantitative real-time (q)rt-pcr. Mice were fasted overnight and killed 1 hour (h) after feeding. A small slice (~5-1 mm 3 ) was taken
Pupil Dilation as an Indicator of Cognitive Workload in Human-Computer Interaction
 Pupil Dilation as an Indicator of Cognitive Workload in Human-Computer Interaction Marc Pomplun and Sindhura Sunkara Department of Computer Science, University of Massachusetts at Boston 100 Morrissey
The North Carolina Health Data Explorer
 The North Carolina Health Data Explorer The Health Data Explorer provides access to health data for North Carolina counties in an interactive, user-friendly atlas of maps, tables, and charts. It allows
Changing expectations about speed alters perceived motion direction
 Current Biology, in press Supplemental Information: Changing expectations about speed alters perceived motion direction Grigorios Sotiropoulos, Aaron R. Seitz, and Peggy Seriès Supplemental Data Detailed
The Role of Color and Attention in Fast Natural Scene Recognition
 Color and Fast Scene Recognition 1 The Role of Color and Attention in Fast Natural Scene Recognition Angela Chapman Department of Cognitive and Neural Systems Boston University 677 Beacon St. Boston, MA
Biostatistics. Donna Kritz-Silverstein, Ph.D. Professor Department of Family & Preventive Medicine University of California, San Diego
 Biostatistics Donna Kritz-Silverstein, Ph.D. Professor Department of Family & Preventive Medicine University of California, San Diego (858) 534-1818 dsilverstein@ucsd.edu Introduction Overview of statistical
Aesthetic Response to Color Combinations: Preference, Harmony, and Similarity. Supplementary Material. Karen B. Schloss and Stephen E.
 Aesthetic Response to Color Combinations: Preference, Harmony, and Similarity Supplementary Material Karen B. Schloss and Stephen E. Palmer University of California, Berkeley Effects of Cut on Pair Preference,
Understandable Statistics
 Understandable Statistics correlated to the Advanced Placement Program Course Description for Statistics Prepared for Alabama CC2 6/2003 2003 Understandable Statistics 2003 correlated to the Advanced Placement
Chapter 2--Norms and Basic Statistics for Testing
 Chapter 2--Norms and Basic Statistics for Testing Student: 1. Statistical procedures that summarize and describe a series of observations are called A. inferential statistics. B. descriptive statistics.
Automaticity of Number Perception
 Automaticity of Number Perception Jessica M. Choplin (jessica.choplin@vanderbilt.edu) Gordon D. Logan (gordon.logan@vanderbilt.edu) Vanderbilt University Psychology Department 111 21 st Avenue South Nashville,
G5)H/C8-)72)78)2I-,8/52& ()*+,-./,-0))12-345)6/3/782 9:-8;<;4.= J-3/ J-3/ "#&' "#% "#"% "#%$
H/C8-)72)78)2I-,8/52& ()*+,-./,-0))12-345)6/3/782 9:-8;<;4.= J-3/ J-3/ #&' #% #% #%$") # G5)H/C8-)72)78)2I-,8/52& #% #$ # # &# G5)H/C8-)72)78)2I-,8/52' @5/AB/7CD J-3/ /,?8-6/2@5/AB/7CD #&' #% #$ # # '#E ()*+,-./,-0))12-345)6/3/782 9:-8;;4. @5/AB/7CD J-3/ #' /,?8-6/2@5/AB/7CD #&F #&' #% #$
# G5)H/C8-)72)78)2I-,8/52& #% #$ # # &# G5)H/C8-)72)78)2I-,8/52' @5/AB/7CD J-3/ /,?8-6/2@5/AB/7CD #&' #% #$ # # '#E ()*+,-./,-0))12-345)6/3/782 9:-8;;4. @5/AB/7CD J-3/ #' /,?8-6/2@5/AB/7CD #&F #&' #% #$
Cultural Differences in Cognitive Processing Style: Evidence from Eye Movements During Scene Processing
 Cultural Differences in Cognitive Processing Style: Evidence from Eye Movements During Scene Processing Zihui Lu (zihui.lu@utoronto.ca) Meredyth Daneman (daneman@psych.utoronto.ca) Eyal M. Reingold (reingold@psych.utoronto.ca)
Integrating Episodic Memories and Prior Knowledge. at Multiple Levels of Abstraction. Pernille Hemmer. Mark Steyvers. University of California, Irvine
 Integrating Episodic Memories and Prior Knowledge at Multiple Levels of Abstraction Pernille Hemmer Mark Steyvers University of California, Irvine Address for correspondence: Pernille Hemmer University
Supplemental Information. Direct Electrical Stimulation in the Human Brain. Disrupts Melody Processing
 Current Biology, Volume 27 Supplemental Information Direct Electrical Stimulation in the Human Brain Disrupts Melody Processing Frank E. Garcea, Benjamin L. Chernoff, Bram Diamond, Wesley Lewis, Maxwell
Description of new EyeSuite visual field and trend analysis functions
 Description of new EyeSuite visual field and trend analysis functions Global Trend Graph The trend graph indicates the normality range (95%) on top as grey band. Falling below that area means falling out
Psy201 Module 3 Study and Assignment Guide. Using Excel to Calculate Descriptive and Inferential Statistics
 Psy201 Module 3 Study and Assignment Guide Using Excel to Calculate Descriptive and Inferential Statistics What is Excel? Excel is a spreadsheet program that allows one to enter numerical values or data
Unit 1 Exploring and Understanding Data
 Unit 1 Exploring and Understanding Data Area Principle Bar Chart Boxplot Conditional Distribution Dotplot Empirical Rule Five Number Summary Frequency Distribution Frequency Polygon Histogram Interquartile
Supplementary Materials
 Supplementary Materials Supplementary Figure S1: Data of all 106 subjects in Experiment 1, with each rectangle corresponding to one subject. Data from each of the two identical sub-sessions are shown separately.
Business Statistics Probability
 Business Statistics The following was provided by Dr. Suzanne Delaney, and is a comprehensive review of Business Statistics. The workshop instructor will provide relevant examples during the Skills Assessment
The influence of clutter on real-world scene search: Evidence from search efficiency and eye movements
 The influence of clutter on real-world scene search: Evidence from search efficiency and eye movements John Henderson, Myriam Chanceaux, Tim Smith To cite this version: John Henderson, Myriam Chanceaux,
Supporting Information for
 Supporting Information for Rupture of Lipid Membranes Induced by Amphiphilic Janus Nanoparticles Kwahun Lee, Liuyang Zhang, Yi Yi, Xianqiao Wang, Yan Yu* Department of Chemistry, Indiana University, Bloomington,
Supplementary Materials for
 Supplementary Materials for Folk Explanations of Behavior: A Specialized Use of a Domain-General Mechanism Robert P. Spunt & Ralph Adolphs California Institute of Technology Correspondence may be addressed
SUPPLEMENTAL MATERIAL
 1 SUPPLEMENTAL MATERIAL Response time and signal detection time distributions SM Fig. 1. Correct response time (thick solid green curve) and error response time densities (dashed red curve), averaged across
Two distinct mechanisms for experiencedependent
 SUPPLEMENTARY INFORMATION Articles https://doi.org/10.1038/s41593-018-0150-0 In the format provided by the authors and unedited. Two distinct mechanisms for experiencedependent homeostasis Michelle C.
Chapter 3: Describing Relationships
 Chapter 3: Describing Relationships Objectives: Students will: Construct and interpret a scatterplot for a set of bivariate data. Compute and interpret the correlation, r, between two variables. Demonstrate
Nature Neuroscience: doi: /nn Supplementary Figure 1. Trial structure for go/no-go behavior
 Supplementary Figure 1 Trial structure for go/no-go behavior a, Overall timeline of experiments. Day 1: A1 mapping, injection of AAV1-SYN-GCAMP6s, cranial window and headpost implantation. Water restriction
Method Comparison Report Semi-Annual 1/5/2018
 Method Comparison Report Semi-Annual 1/5/2018 Prepared for Carl Commissioner Regularatory Commission 123 Commission Drive Anytown, XX, 12345 Prepared by Dr. Mark Mainstay Clinical Laboratory Kennett Community
Supplementary Figures
 Supplementary Figures Supplementary Figure 1. Heatmap of GO terms for differentially expressed genes. The terms were hierarchically clustered using the GO term enrichment beta. Darker red, higher positive
Describe what is meant by a placebo Contrast the double-blind procedure with the single-blind procedure Review the structure for organizing a memo
 Please note the page numbers listed for the Lind book may vary by a page or two depending on which version of the textbook you have. Readings: Lind 1 11 (with emphasis on chapters 10, 11) Please note chapter
Measures of Dispersion. Range. Variance. Standard deviation. Measures of Relationship. Range. Variance. Standard deviation.
 Measures of Dispersion Range Variance Standard deviation Range The numerical difference between the highest and lowest scores in a distribution It describes the overall spread between the highest and lowest
Nature Biotechnology: doi: /nbt.3828
 Supplementary Figure 1 Development of a FRET-based MCS. (a) Linker and MA2 modification are indicated by single letter amino acid code. indicates deletion of amino acids and N or C indicate the terminus
Making Inferences from Experiments
 11.6 Making Inferences from Experiments Essential Question How can you test a hypothesis about an experiment? Resampling Data Yield (kilograms) Control Group Treatment Group 1. 1.1 1.2 1. 1.5 1.4.9 1.2
Learning to classify integral-dimension stimuli
 Psychonomic Bulletin & Review 1996, 3 (2), 222 226 Learning to classify integral-dimension stimuli ROBERT M. NOSOFSKY Indiana University, Bloomington, Indiana and THOMAS J. PALMERI Vanderbilt University,
What Case Study means? Case Studies. Case Study in SE. Key Characteristics. Flexibility of Case Studies. Sources of Evidence
 DCC / ICEx / UFMG What Case Study means? Case Studies Eduardo Figueiredo http://www.dcc.ufmg.br/~figueiredo The term case study frequently appears in title and abstracts of papers Its meaning varies a
Running head: PERCEPTUAL GROUPING AND SPATIAL SELECTION 1. The attentional window configures to object boundaries. University of Iowa
 Running head: PERCEPTUAL GROUPING AND SPATIAL SELECTION 1 The attentional window configures to object boundaries University of Iowa Running head: PERCEPTUAL GROUPING AND SPATIAL SELECTION 2 ABSTRACT When
A Model for Automatic Diagnostic of Road Signs Saliency
 A Model for Automatic Diagnostic of Road Signs Saliency Ludovic Simon (1), Jean-Philippe Tarel (2), Roland Brémond (2) (1) Researcher-Engineer DREIF-CETE Ile-de-France, Dept. Mobility 12 rue Teisserenc
Effect of Visuo-Spatial Working Memory on Distance Estimation in Map Learning
 GSTF Journal of Psychology (JPsych) Vol. No., August 5 Effect of Visuo-Spatial Working Memory on Distance Estimation in Map Learning Hironori Oto 79 Received 6 Jul 5 Accepted 9 Aug 5 Abstract This paper
Nature Immunology: doi: /ni Supplementary Figure 1
 Supplementary Figure 1 A β-strand positions consistently places the residues at CDR3β P6 and P7 within human and mouse TCR-peptide-MHC interfaces. (a) E8 TCR containing V β 13*06 carrying with an 11mer
Describe what is meant by a placebo Contrast the double-blind procedure with the single-blind procedure Review the structure for organizing a memo
 Business Statistics The following was provided by Dr. Suzanne Delaney, and is a comprehensive review of Business Statistics. The workshop instructor will provide relevant examples during the Skills Assessment
Nature Neuroscience: doi: /nn Supplementary Figure 1
 Supplementary Figure 1 Hippocampal recordings. a. (top) Post-operative MRI (left, depicting a depth electrode implanted along the longitudinal hippocampal axis) and co-registered preoperative MRI (right)
Question 1(25= )
") MSG500 Final 20-0-2 Examiner: Rebecka Jörnsten, 060-49949 Remember: To pass this course you also have to hand in a final project to the examiner. Open book, open notes but no calculators or computers allowed.
MSG500 Final 20-0-2 Examiner: Rebecka Jörnsten, 060-49949 Remember: To pass this course you also have to hand in a final project to the examiner. Open book, open notes but no calculators or computers allowed.
Supplementary Figure 1. Using DNA barcode-labeled MHC multimers to generate TCR fingerprints
 Supplementary Figure 1 Using DNA barcode-labeled MHC multimers to generate TCR fingerprints (a) Schematic overview of the workflow behind a TCR fingerprint. Each peptide position of the original peptide
Influence of Low-Level Stimulus Features, Task Dependent Factors, and Spatial Biases on Overt Visual Attention
 Influence of Low-Level Stimulus Features, Task Dependent Factors, and Spatial Biases on Overt Visual Attention Sepp Kollmorgen 1,2., Nora Nortmann 1., Sylvia Schröder 1,2 *., Peter König 1 1 Institute
Stats 95. Statistical analysis without compelling presentation is annoying at best and catastrophic at worst. From raw numbers to meaningful pictures
 Stats 95 Statistical analysis without compelling presentation is annoying at best and catastrophic at worst. From raw numbers to meaningful pictures Stats 95 Why Stats? 200 countries over 200 years http://www.youtube.com/watch?v=jbksrlysojo
Actions in the Eye: Dynamic Gaze Datasets and Learnt Saliency Models for Visual Recognition
 Actions in the Eye: Dynamic Gaze Datasets and Learnt Saliency Models for Visual Recognition Stefan Mathe, Cristian Sminchisescu Presented by Mit Shah Motivation Current Computer Vision Annotations subjectively
Supplementary Materials
 Supplementary Materials Supplementary figure 1. Taxonomic representation summarized at genus level. Fecal microbiota from a separate set of Jackson and Harlan mice prior to irradiation. A taxon was included
Results. Example 1: Table 2.1 The Effect of Additives on Daphnia Heart Rate. Time (min)
") Notes for Alphas Line graphs provide a way to map independent and dependent variables that are both quantitative. When both variables are quantitative, the segment that connects every two points on the
Notes for Alphas Line graphs provide a way to map independent and dependent variables that are both quantitative. When both variables are quantitative, the segment that connects every two points on the
Main Study: Summer Methods. Design
 Main Study: Summer 2000 Methods Design The experimental design is within-subject each participant experiences five different trials for each of the ten levels of Display Condition and for each of the three
Still important ideas
 Readings: OpenStax - Chapters 1 13 & Appendix D & E (online) Plous Chapters 17 & 18 - Chapter 17: Social Influences - Chapter 18: Group Judgments and Decisions Still important ideas Contrast the measurement
Statistics 2. RCBD Review. Agriculture Innovation Program
 Statistics 2. RCBD Review 2014. Prepared by Lauren Pincus With input from Mark Bell and Richard Plant Agriculture Innovation Program 1 Table of Contents Questions for review... 3 Answers... 3 Materials
Reward prediction based on stimulus categorization in. primate lateral prefrontal cortex
 Reward prediction based on stimulus categorization in primate lateral prefrontal cortex Xiaochuan Pan, Kosuke Sawa, Ichiro Tsuda, Minoro Tsukada, Masamichi Sakagami Supplementary Information This PDF file
Skala Stress. Putaran 1 Reliability. Case Processing Summary. N % Excluded a 0.0 Total
 Skala Stress Putaran 1 Reliability Case Processing Summary N % Cases Valid Excluded a 0.0 Total a. Listwise deletion based on all variables in the procedure. Reliability Statistics Cronbach's Alpha N of
Supporting Information
 1 2 3 4 5 6 7 8 9 10 11 12 13 14 15 16 17 18 19 20 21 22 23 24 25 26 27 28 29 30 31 32 33 34 35 36 37 38 39 40 Supporting Information Variances and biases of absolute distributions were larger in the 2-line
Measuring populations to improve vaccination coverage: Supplementary Information
 Measuring populations to improve vaccination coverage Nita Bharti 1,2*, Ali Djibo 3, Andrew J. Tatem 4,5, Bryan T. Grenfell 4,6, Matthew J. Ferrari 1,7 1 Biology Department; Center for Infectious Disease
Kidane Tesfu Habtemariam, MASTAT, Principle of Stat Data Analysis Project work
 1 1. INTRODUCTION Food label tells the extent of calories contained in the food package. The number tells you the amount of energy in the food. People pay attention to calories because if you eat more
Supplementary Material
 Supplementary Material A detailed summary of participant information is shown in Table 2. Age, body mass index (BMI), and gender are described, as well as the QIDS score for depression and the Altman score
DO STIMULUS FREQUENCY EFFECTS OCCUR WITH LINE SCALES? 1. Gert Haubensak Justus Liebig University of Giessen
 DO STIMULUS FREQUENCY EFFECTS OCCUR WITH LINE SCALES? 1 Gert Haubensak Justus Liebig University of Giessen gert.haubensak@t-online.de Abstract Two experiments are reported in which the participants judged
Gathering and Repetition of the Elements in an Image Affect the Perception of Order and Disorder
 International Journal of Affective Engineering Vol.13 No.3 pp.167-173 (2014) ORIGINAL ARTICLE Gathering and Repetition of the Elements in an Image Affect the Perception of Order and Disorder Yusuke MATSUDA
Designing Psychology Experiments: Data Analysis and Presentation
 Data Analysis and Presentation Review of Chapter 4: Designing Experiments Develop Hypothesis (or Hypotheses) from Theory Independent Variable(s) and Dependent Variable(s) Operational Definitions of each
PSYCHOLOGY 300B (A01) One-sample t test. n = d = ρ 1 ρ 0 δ = d (n 1) d
 One-sample t test. n = d = ρ 1 ρ 0 δ = d (n 1) d") PSYCHOLOGY 300B (A01) Assignment 3 January 4, 019 σ M = σ N z = M µ σ M d = M 1 M s p d = µ 1 µ 0 σ M = µ +σ M (z) Independent-samples t test One-sample t test n = δ δ = d n d d = µ 1 µ σ δ = d n n = δ
PSYCHOLOGY 300B (A01) Assignment 3 January 4, 019 σ M = σ N z = M µ σ M d = M 1 M s p d = µ 1 µ 0 σ M = µ +σ M (z) Independent-samples t test One-sample t test n = δ δ = d n d d = µ 1 µ σ δ = d n n = δ
Nature Immunology: doi: /ni Supplementary Figure 1. RNA-Seq analysis of CD8 + TILs and N-TILs.
 Supplementary Figure 1 RNA-Seq analysis of CD8 + TILs and N-TILs. (a) Schematic representation of the tumor and cell types used for the study. HNSCC, head and neck squamous cell cancer; NSCLC, non-small
Title. Author(s)Ono, Daisuke; Honma, Ken-Ichi; Honma, Sato. CitationScientific reports, 5: Issue Date Doc URL
Ono, Daisuke; Honma, Ken-Ichi; Honma, Sato. CitationScientific reports, 5: Issue Date Doc URL") Title Circadian and ultradian rhythms of clock gene expres Author(s)Ono, Daisuke; Honma, Ken-Ichi; Honma, Sato CitationScientific reports, 5: 31 Issue Date 215-7-21 Doc URL http://hdl.handle.net/2115/59574
Title Circadian and ultradian rhythms of clock gene expres Author(s)Ono, Daisuke; Honma, Ken-Ichi; Honma, Sato CitationScientific reports, 5: 31 Issue Date 215-7-21 Doc URL http://hdl.handle.net/2115/59574
Nature Medicine: doi: /nm.4084
 Supplementary Figure 1: Sample IEDs. (a) Sample hippocampal IEDs from different kindled rats (scale bar = 200 µv, 100 ms). (b) Sample temporal lobe IEDs from different subjects with epilepsy (scale bar
Mnemonic representations of transient stimuli and temporal sequences in the rodent hippocampus in vitro
 Supplementary Material Mnemonic representations of transient stimuli and temporal sequences in the rodent hippocampus in vitro Robert. Hyde and en W. Strowbridge Mossy ell 1 Mossy ell Mossy ell 3 Stimulus
Table S1. Trait summary for Northern Leaf Blight resistance in the maize nested association mapping (NAM) population and individual NAM families
 population and individual NAM families") SUPPLEMENTAL MATERIAL Supplemental Tables: Table S1. Trait summary for Northern Leaf Blight resistance in the maize nested association mapping (NAM) population and individual NAM families "#$%&' (')*'%$+,-'
SUPPLEMENTAL MATERIAL Supplemental Tables: Table S1. Trait summary for Northern Leaf Blight resistance in the maize nested association mapping (NAM) population and individual NAM families "#$%&' (')*'%$+,-'
Conjunctive Search for One and Two Identical Targets
 Journal of Experimental Psychology: Human Perception and Performance 1989, Vol. 15, No. 4, 664-672 Copyright 1989 by the American Psychological Association, Inc. 0096-1523/89/S00.75 Conjunctive Search
Meta Analysis. David R Urbach MD MSc Outcomes Research Course December 4, 2014
 Meta Analysis David R Urbach MD MSc Outcomes Research Course December 4, 2014 Overview Definitions Identifying studies Appraising studies Quantitative synthesis Presentation of results Examining heterogeneity
Active suppression after involuntary capture of attention
 Psychon Bull Rev (2013) 20:296 301 DOI 10.3758/s13423-012-0353-4 BRIEF REPORT Active suppression after involuntary capture of attention Risa Sawaki & Steven J. Luck Published online: 20 December 2012 #
The control of attentional target selection in a colour/colour conjunction task
 Atten Percept Psychophys (2016) 78:2383 2396 DOI 10.3758/s13414-016-1168-6 The control of attentional target selection in a colour/colour conjunction task Nick Berggren 1 & Martin Eimer 1 Published online:
IgG3 regulates tissue-like memory B cells in HIV-infected individuals
 SUPPLEMENTARY INFORMATION Articles https://doi.org/10.1038/s41590-018-0180-5 In the format provided by the authors and unedited. IgG3 regulates tissue-like memory B cells in HIV-infected individuals Lela