Mosaic loss of chromosome Y in peripheral blood is associated with shorter survival and higher risk of cancer
|
|
|
- Doris Casey
- 5 years ago
- Views:
Transcription
1 Supplementary Information Mosaic loss of chromosome Y in peripheral blood is associated with shorter survival and higher risk of cancer Lars A. Forsberg, Chiara Rasi, Niklas Malmqvist, Hanna Davies, Saichand Pasupulati, Geeta Pakalapati, Johanna Sandgren, Teresita Diaz de Ståhl, Ammar Zaghlool, Vilmantas Giedraitis, Lars Lannfelt, Joannah Score, Nicholas C.P. Cross, Devin Absher, Eva Tiensuu Janson, Cecilia M. Lindgren, Andrew P. Morris, Erik Ingelsson, Lars Lind, and Jan P. Dumanski Items Page/s Supplementary Fig Supplementary Fig Supplementary Fig Supplementary Fig Supplementary Fig Supplementary Fig Supplementary Fig Supplementary Fig Supplementary Fig Supplementary Fig Supplementary Fig Supplementary Fig Supplementary Fig Supplementary Fig Supplementary Fig Supplementary Table 1 30 Supplementary Table 2 31 Supplementary Table 3 32 Supplementary Table 4 33 Page 1
2 Supplementary Fig. 1 Page 2
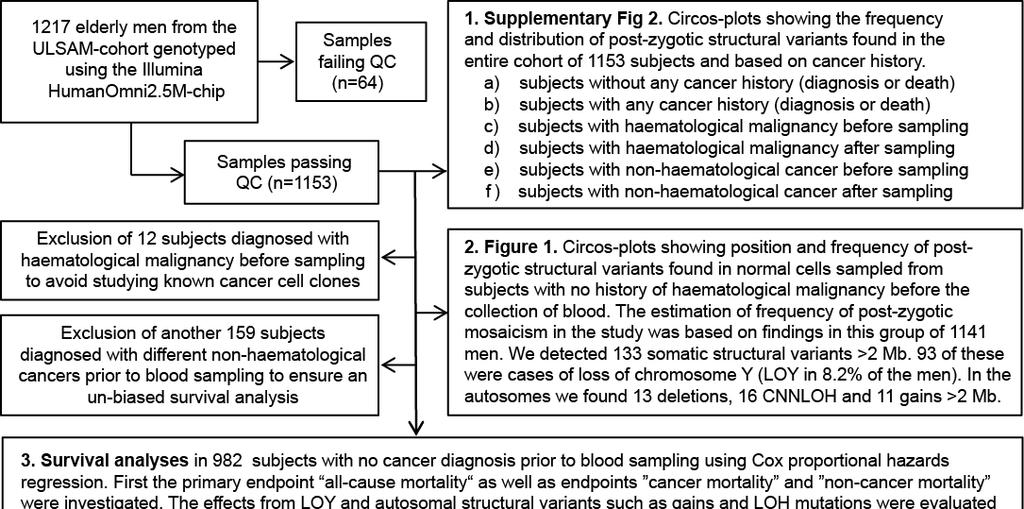
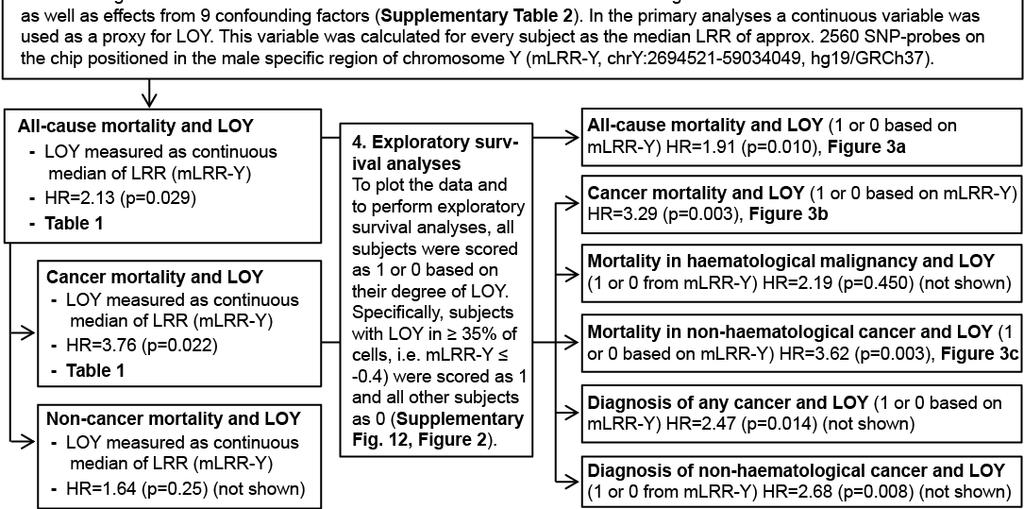
3 Supplementary Fig. 1. Flow-chart describing all steps in analysis of 1217 ULSAM participants genotyped on Illumina s 2.5MHumanOmni SNP-beadchip. This figure also summarizes major findings and refers to relevant Figures and Tables showing detailed results. Boxes with numbers 1 and 2 summarize scoring of aberrations from the cohorts of 1153 and 1141 ULSAM subjects. Boxes with numbers 3 and 4 refer to primary survival analyses, respectively, exploratory survival analyses using 982 participants. Page 3

4 Supplementary Fig. 2 Page 4
5 Supplementary Fig. 2. Circos-plots showing the structural variants found in the entire cohort of 1153 participants that were successfully genotyped on Illumina beadchips. The number of deletions, CNNLOH and gains are shown with red, green and blue bars, respectively. Panels a and b show 688 subjects without cancer history and 465 cases with cancer diagnoses, respectively. Panels c and d display 12 participants with history of haematological malignancy (HM) before blood sampling and 73 individuals with diagnoses of haematological malignancy after blood sampling. Correspondingly, panels e and f illustrate data from 162 participants with non-haematological (non-hm) malignancy diagnoses prior to blood sampling and 262 cases who received diagnoses of non-haematological cancer after sampling. Data showing LOY in panels a, b, e and f are not shown to scale (highlighted with an asterisk; *). The numbers for LOY events in these panels are 55, 38, 13, and 29, respectively. Page 5
6 Supplementary Fig. 3 Page 6
7 Supplementary Fig. 3. Estimation of the percentage of blood cells affected with loss of chromosome Y (LOY) through analysis of SNP-array data from the pseudoautosomal region 1 (PAR1) of chromosomes X/Y using MAD-software 35 in the ULSAM cohort. PAR1 is the largest of the PARs (regions with homologous sequences on chromosomes X and Y) with coordinates on Y and on X. MAD-software is a tool for detection and quantification of somatic structural variants from SNP-array data, which uses diploid B-allele frequency (BAF) for identification and Log R Ratio (LRR) for quantification of somatic variants and is not originally intended for analyses of chromosome Y data. However, by using the correlation between the LRR in the PAR1-region of Y and the dbaf (i.e. the absolute deviation from the expected BAF-value of 0.5 in heterozygous probes) of the PAR1-region of X/Y (panel a), we could use the MAD-quantification of the diploid PAR1 region on chromosomes X/Y to calculate the percentage of cells affected with LOY (panel b) in a two-step process. For example, the dbaf-value at the LRR-threshold for survival analyses (mlrr-y -0.4) can be found using the equation given in panel a (i.e ). This equation (y = x ) is describing the relationship between mlrr-y on Y and dbaf on XY for the 1141 subjects. Next, the percentage of cells affected by LOY can be found by applying the equation in panel b that describes the relationship between dbaf and the percentage of cells as estimated by the MAD software for 14 cases (y = 1.832x ). For this example, the dbaf of translates to LOY in 35% of cells. Page 7
8 Supplementary Fig. 4 Page 8
9 Supplementary Fig. 4. Validations of findings of LOY using next generation sequencing (NGS) for six candidate subjects. Low coverage whole genome sequencing was performed on 100 participants from the cohort. Among the 93 subjects with a median LRR in the male specific region on chromosome Y (mlrr-y, i.e. the median Log R Ratio for ~2560 SNPprobes in the region chry: , hg19/grch37) lower than (i.e. threshold for frequency estimation, Fig. 2), whole genome sequencing was performed in 6 participants. Panel a shows the Log R Ratio (LRR) data from the male specific region on chromosome Y (MSY) in these 6 subjects using boxplots. The rightmost box (in all panels) contains the data from the 94 sequenced individuals with an mlrr-y above the threshold for the frequency estimation. The red lines in all panels represent the expected normal state. The NGS-data from the 6 subjects and the 94 controls are plotted in panel b. The median read-depth in the MSY of the 94 subjects without LOY was 1.6 (standard deviation (SD)=0.6). The corresponding read-depth in the 6 subjects with LOY was 1.3 (SD=0.5). In comparison, the median read-depth on chromosome 22 was 3.8 (SD=1.4) in the 94 subjects without LOY and 3.8 (SD=1.2) in the 6 subjects with LOY. The read-depth data was used to estimate the ploidy of chromosome 22 and the MSY-region on chromosome Y in comparison with the rest of the genome using the FREEC software 39. The estimated ploidy is plotted in panels b and d. FREEC calculates ploidy for the regions of interest as the copy number value in each of 5 kb windows in the region of interest after GC-content read count normalization, given a normal autosomal ploidy of 2. Panel c and d show that the copy number state on chromosome 22 is normal in the participants affected with LOY and plotted in panels a and b, using SNP-array and NGS-data, respectively. Page 9

10 Supplementary Fig. 5 Page 10
11 Supplementary Fig. 5. Detailed individual validations of LOY in ULSAM subjects 98 and 279 using low coverage whole genome next generation sequencing (NGS). In panels a and b are plotted the SNP-array and NGS data from chromosomes 22, X and Y for each subject. The LRR (blue dots) and B-Allele Frequency (BAF, red dots) from the SNP-array are plotted overlaid and the percentages of cells affected were calculated using MAD-software 35. LRR values on sex chromosomes were normalized to a diploid state and chromosome X probes (residing outside PAR regions) with ambiguous clustering (scored as heterozygotes) are excluded from analyses. The ploidy-value, estimated from the NGS-data, was calculated using FREEC-software 39. Blue lines indicate the normal copy number state and red line the observed LOY. SNP-array data within MSY include clusters of probes for known highly repetitive genes/loci, e.g. the TSPYA, TSPYB and RBMY1 genes 16,17. Therefore, probes covering these loci do not reflect true copy-number state of chromosome Y. These regions are not included in mapping of the NGS sequence reads. Page 11

12 Supplementary Fig. 6 Page 12
13 Supplementary Fig. 6. Detailed individual validations of LOY in ULSAM subjects 531 and 693 using low coverage whole genome next generation sequencing (NGS). In panels a and b are plotted the SNP-array and NGS data from chromosomes 22, X and Y for each subject. The LRR (blue dots) and B-Allele Frequency (BAF, red dots) from the SNP-array are plotted overlaid and the percentages of cells affected were calculated using MAD-software 35. LRR values on sex chromosomes were normalized to a diploid state and chromosome X probes (residing outside PAR regions) with ambiguous clustering (scored as heterozygotes) are excluded from analyses. The ploidy-value, estimated from the NGS-data, was calculated using FREEC-software 39. Blue lines indicate the normal copy number state and red line the observed LOY. SNP-array data within MSY include clusters of probes for known highly repetitive genes/loci, e.g. the TSPYA, TSPYB and RBMY1 genes 16,17. Therefore, probes covering these loci do not reflect true copy-number state of chromosome Y. These regions are not included in mapping of the NGS sequence reads. Page 13

14 Supplementary Fig. 7 Page 14
15 Supplementary Fig. 7. Detailed individual validations of LOY in ULSAM subjects 1124 and 1238 using low coverage whole genome next generation sequencing (NGS). In panels a and b are plotted the SNP-array and NGS data from chromosomes 22, X and Y for each subject. The LRR (blue dots) and B-Allele Frequency (BAF, red dots) from the SNP-array are plotted overlaid and the percentages of cells affected were calculated using MAD-software 35. LRR values on sex chromosomes were normalized to a diploid state and chromosome X probes (residing outside PAR regions) with ambiguous clustering (scored as heterozygotes) are excluded from analyses. The ploidy-value, estimated from the NGS-data, was calculated using FREEC-software 39. Blue lines indicate the normal copy number state and red line the observed LOY. SNP-array data within MSY include clusters of probes for known highly repetitive genes/loci, e.g. the TSPYA, TSPYB and RBMY1 genes 16,17. Therefore, probes covering these loci do not reflect true copy-number state of chromosome Y. These regions are not included in mapping of the NGS sequence reads. Page 15

16 Supplementary Fig. 8 Page 16
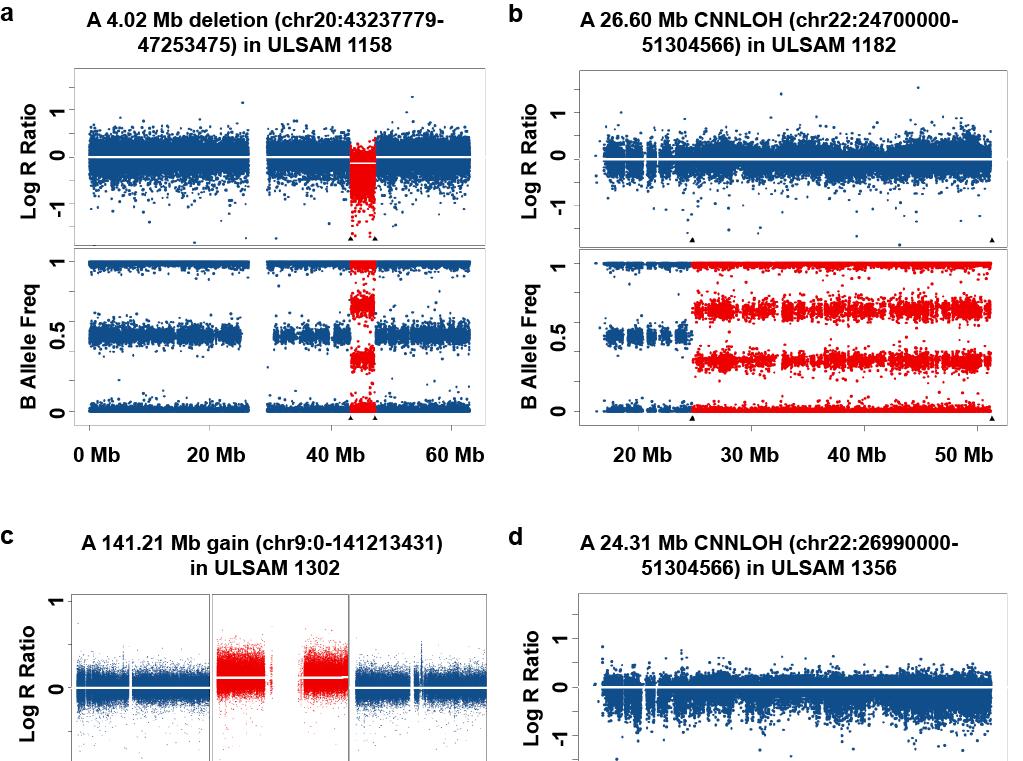
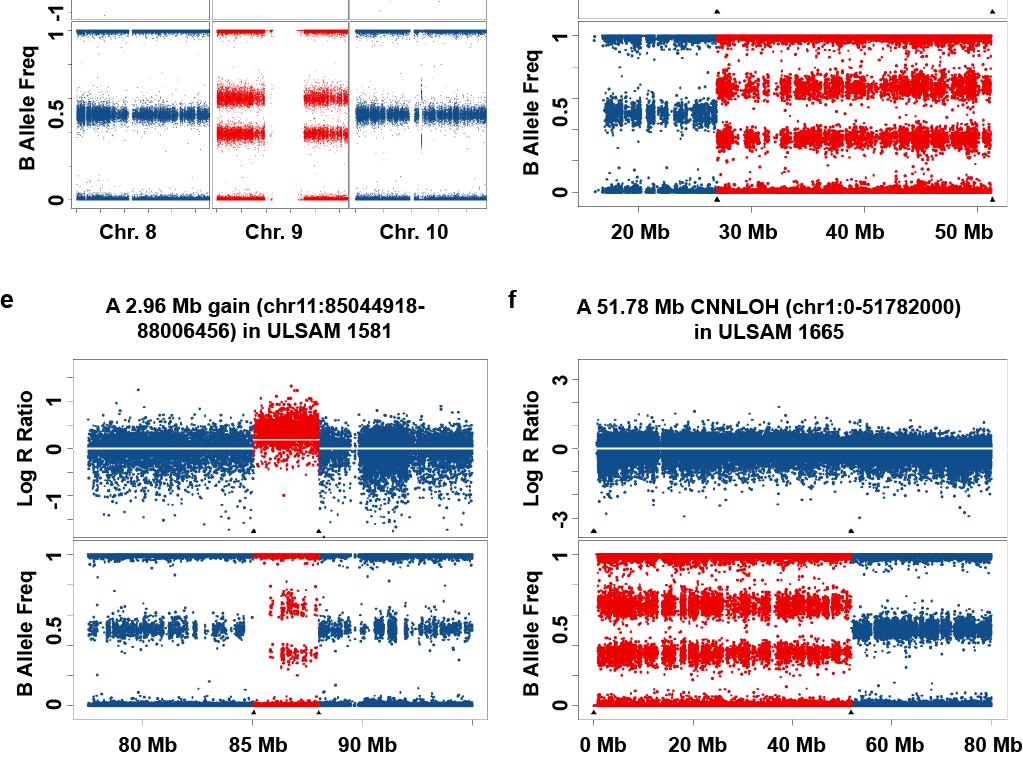
17 Supplementary Fig. 8. Examples of autosomal structural genetic aberrations >2 Mb in the ULSAM cohort. The Log R ratio (LRR) and the B allele frequency (BAF) from SNP-array as well as validations with next generation sequencing (NGS) using low coverage whole genome NGS (panel c) or exome sequencing (panels a, b, d-f) with an average coverage of 17x. Triangles indicate the positions of calls for structural variants and probes within these positions are plotted in red. Panels c and d show two examples of CNNLOH; in these cases NGS did not, as expected, detect any structural changes in these regions. Page 17

18 Supplementary Fig. 9 Page 18
19 Supplementary Fig. 9. Examples of autosomal structural genetic aberrations >2 Mb in the ULSAM cohort. In each panel the Log R ratio (LRR) and the B allele frequency (BAF) from SNP-array are plotted. Triangles indicate the positions of calls for structural variants and probes within these positions are plotted in red. Page 19
20 Supplementary Fig. 10 Page 20
21 Supplementary Fig. 10. Examples of autosomal structural genetic aberrations >2 Mb in the ULSAM cohort. In each panel the Log R ratio (LRR) and the B allele frequency (BAF) from SNP-array are plotted. Triangles indicate the positions of calls for structural variants and probes within these positions are plotted in red. Page 21
22 Supplementary Fig. 11 Page 22
23 Supplementary Fig. 11. No validation of suggested cases of gain of chromosome Y (GOY) using low coverage (~5x) whole genome next generation sequencing (NGS). Of 100 sequenced participants, 3 had a positive median Log R Ratio (LRR) on the SNP-array in the male specific part of chromosome Y (mlrr-y) indicating a possible gain of chromosome Y. In panel a-c are plotted the SNP-array and NGS data from chromosomes 22, X and Y for each of these three subjects. The LRR and B-Allele Frequency (BAF) from SNP-array are plotted overlaid and the percentages of cells affected were calculated using MAD-software 35. LRR on sex chromosomes were normalized to diploid state and chromosome X probes (residing outside PAR regions) with ambiguous clustering (scored as heterozygotes) are excluded from analyses. The ploidy estimated from the NGS-data was calculated using FREEC-software 39. Blue lines indicate the normal copy number state and red line the observed LOY. Page 23
24 Supplementary Fig. 12 Supplementary Fig. 12. Results from exploratory survival analyses in the ULSAM cohort using Cox proportional hazards regression models with different thresholds for classification of participants into groups 1 and 0, based on their level of loss of chromosome Y (LOY) measured as the median Log R Ratio (LRR) in the male specific part of chromosome Y (mlrr-y). The number of participants (n) with LOY and the minimum percentage of affected cells for each subject are given for each of the tested thresholds. The red and blue curves represent results from analyses with cancer mortality or all-cause mortality as endpoints, respectively. Models with significant effect on mortality (alpha level of 0.05) are indicated by solid black triangles and non-significant models are plotted with empty triangles. Based on these results, mlrr-y at -0.4 is the most informative threshold for survival analyses in the studied ULSAM cohort. Page 24
25 Supplementary Fig. 13 Page 25
26 Supplementary Fig. 13. LOY frequency estimation in PIVUS cohort after accounting for experimental variation. Panel a show the median Log R Ratio (LRR) in the male specific part of chromosome Y (mlrr-y) observed in all men (n=488) genotyped from this cohort. Each triangle represents one participant. Panel b show the distribution of the mlrr-y (grey bars) and the experimental noise (white bars) that were used to find the threshold for estimation of LOY frequency. The latter distribution was generated as described in online methods. The dotted black lines represent the 99% confidence intervals (CI) of the distribution of expected experimental background noise (white bars). Among the 488 men in PIVUS we found that 100 subjects (20.5%) had the mlrr-y value lower than , which represent the lowest value in the distribution of experimental noise and corresponds to >13% LOY-cells. Page 26
27 Supplementary Fig. 14 Supplementary Fig. 14. Validation of the result that men with loss of chromosome Y (LOY) are at a higher risk for all-cause mortality in an independent cohort (PIVUS). Panel a show results from Cox proportional hazards regression models with all-cause mortality as endpoint using different thresholds in analyses of 488 men. The participants were classified into groups 1 and 0 based on their degree of loss of chromosome Y (LOY) using different thresholds for mlrr-y, i.e. the median Log R Ratio (LRR) in the male specific part of chromosome Y. The number of participants (n) with LOY and the minimum percentage of affected cells for each subject are given for each of the tested thresholds. Based on these results, mlrr-y at -0.5 is the most informative threshold for survival analyses in the PIVUS cohort. Panel b shows results from a Cox proportional hazards regression model testing the effect from LOY on risk for all-cause mortality in 488 PIVUS men at the -0.5 threshold. The survival of men with LOY are represented in the red curve. Hazard ratio (HR), p-value, 95% confidence intervals (CI) and number of events and are shown. Page 27

28 Supplementary Fig. 15 Page 28
29 Supplementary Fig. 15. Comparisons of the spectrum of cancer diagnoses between ULSAM participants with and without LOY, which were successfully genotyped on Illumina beadchips and scored for structural genetic variants. The cut-off level for LOY used for these comparisons was mlrr-y <-0.139, corresponding to LOY in >18% of cells (see Fig. 2, Supplementary Fig. 3 and text). Panel a and b display cancer diagnoses for the entire cohort of 1153 men with 93 participants scored with LOY and 1060 subjects that were not scored with LOY, respectively. Panel c and d show the distribution of the cancer diagnoses in the cohort after excluding subjects with cancer before blood sampling. In the remaining 982 men, 80 subjects were scored with LOY and 902 subjects that were not scored with LOY. All cancer diagnoses were grouped into 13 categories, and for each category, the percentage of cases is shown, followed by the absolute number of patients (in parentheses) with this diagnosis category. GI gastrointestinal; ENT ear/nose/throat; CNS central nervous system. Page 29
30 Page 30
31 Page 31
32 Page 32
33 Page 33
DNA-seq Bioinformatics Analysis: Copy Number Variation
 DNA-seq Bioinformatics Analysis: Copy Number Variation Elodie Girard elodie.girard@curie.fr U900 institut Curie, INSERM, Mines ParisTech, PSL Research University Paris, France NGS Applications 5C HiC DNA-seq
Nature Genetics: doi: /ng Supplementary Figure 1. SEER data for male and female cancer incidence from
 Supplementary Figure 1 SEER data for male and female cancer incidence from 1975 2013. (a,b) Incidence rates of oral cavity and pharynx cancer (a) and leukemia (b) are plotted, grouped by males (blue),
Statistical Analysis of Single Nucleotide Polymorphism Microarrays in Cancer Studies
 Statistical Analysis of Single Nucleotide Polymorphism Microarrays in Cancer Studies Stanford Biostatistics Workshop Pierre Neuvial with Henrik Bengtsson and Terry Speed Department of Statistics, UC Berkeley
Nature Genetics: doi: /ng Supplementary Figure 1. Rates of different mutation types in CRC.
 Supplementary Figure 1 Rates of different mutation types in CRC. (a) Stratification by mutation type indicates that C>T mutations occur at a significantly greater rate than other types. (b) As for the
Supplementary Materials for
 www.sciencetranslationalmedicine.org/cgi/content/full/7/283/283ra54/dc1 Supplementary Materials for Clonal status of actionable driver events and the timing of mutational processes in cancer evolution
Nature Biotechnology: doi: /nbt.1904
 Supplementary Information Comparison between assembly-based SV calls and array CGH results Genome-wide array assessment of copy number changes, such as array comparative genomic hybridization (acgh), is
November 9, Johns Hopkins School of Medicine, Baltimore, MD,
 Fast detection of de-novo copy number variants from case-parent SNP arrays identifies a deletion on chromosome 7p14.1 associated with non-syndromic isolated cleft lip/palate Samuel G. Younkin 1, Robert
Global variation in copy number in the human genome
 Global variation in copy number in the human genome Redon et. al. Nature 444:444-454 (2006) 12.03.2007 Tarmo Puurand Study 270 individuals (HapMap collection) Affymetrix 500K Whole Genome TilePath (WGTP)
Abstract. Optimization strategy of Copy Number Variant calling using Multiplicom solutions APPLICATION NOTE. Introduction
 Optimization strategy of Copy Number Variant calling using Multiplicom solutions Michael Vyverman, PhD; Laura Standaert, PhD and Wouter Bossuyt, PhD Abstract Copy number variations (CNVs) represent a significant
Supplementary Online Content
 Supplementary Online Content Levin GP, Robinson-Cohen C, de Boer IH, Houston DK, Lohman K, Liu Y, et al. Genetic variants and associations of 25-hydroxyvitamin D concentrations with major clinical outcomes.
Interactive analysis and quality assessment of single-cell copy-number variations
 Interactive analysis and quality assessment of single-cell copy-number variations Tyler Garvin, Robert Aboukhalil, Jude Kendall, Timour Baslan, Gurinder S. Atwal, James Hicks, Michael Wigler, Michael C.
Mutation Detection and CNV Analysis for Illumina Sequencing data from HaloPlex Target Enrichment Panels using NextGENe Software for Clinical Research
 Mutation Detection and CNV Analysis for Illumina Sequencing data from HaloPlex Target Enrichment Panels using NextGENe Software for Clinical Research Application Note Authors John McGuigan, Megan Manion,
Figure S2. Distribution of acgh probes on all ten chromosomes of the RIL M0022
 96 APPENDIX B. Supporting Information for chapter 4 "changes in genome content generated via segregation of non-allelic homologs" Figure S1. Potential de novo CNV probes and sizes of apparently de novo
Whole Genome and Transcriptome Analysis of Anaplastic Meningioma. Patrick Tarpey Cancer Genome Project Wellcome Trust Sanger Institute
 Whole Genome and Transcriptome Analysis of Anaplastic Meningioma Patrick Tarpey Cancer Genome Project Wellcome Trust Sanger Institute Outline Anaplastic meningioma compared to other cancers Whole genomes
Supplementary Figure 1: Attenuation of association signals after conditioning for the lead SNP. a) attenuation of association signal at the 9p22.
 attenuation of association signal at the 9p22.") Supplementary Figure 1: Attenuation of association signals after conditioning for the lead SNP. a) attenuation of association signal at the 9p22.32 PCOS locus after conditioning for the lead SNP rs10993397;
Supplementary Figure 1: Attenuation of association signals after conditioning for the lead SNP. a) attenuation of association signal at the 9p22.32 PCOS locus after conditioning for the lead SNP rs10993397;
2) Cases and controls were genotyped on different platforms. The comparability of the platforms should be discussed.
 Cases and controls were genotyped on different platforms. The comparability of the platforms should be discussed.") Reviewers' Comments: Reviewer #1 (Remarks to the Author) The manuscript titled 'Association of variations in HLA-class II and other loci with susceptibility to lung adenocarcinoma with EGFR mutation' evaluated
Reviewers' Comments: Reviewer #1 (Remarks to the Author) The manuscript titled 'Association of variations in HLA-class II and other loci with susceptibility to lung adenocarcinoma with EGFR mutation' evaluated
LTA Analysis of HapMap Genotype Data
 LTA Analysis of HapMap Genotype Data Introduction. This supplement to Global variation in copy number in the human genome, by Redon et al., describes the details of the LTA analysis used to screen HapMap
Numerous hypothesis tests were performed in this study. To reduce the false positive due to
 Two alternative data-splitting Numerous hypothesis tests were performed in this study. To reduce the false positive due to multiple testing, we are not only seeking the results with extremely small p values
Supplementary note: Comparison of deletion variants identified in this study and four earlier studies
 Supplementary note: Comparison of deletion variants identified in this study and four earlier studies Here we compare the results of this study to potentially overlapping results from four earlier studies
Detection of aneuploidy in a single cell using the Ion ReproSeq PGS View Kit
 APPLICATION NOTE Ion PGM System Detection of aneuploidy in a single cell using the Ion ReproSeq PGS View Kit Key findings The Ion PGM System, in concert with the Ion ReproSeq PGS View Kit and Ion Reporter
Nature Structural & Molecular Biology: doi: /nsmb.2419
 Supplementary Figure 1 Mapped sequence reads and nucleosome occupancies. (a) Distribution of sequencing reads on the mouse reference genome for chromosome 14 as an example. The number of reads in a 1 Mb
Genome-wide copy-number calling (CNAs not CNVs!) Dr Geoff Macintyre
 Dr Geoff Macintyre") Genome-wide copy-number calling (CNAs not CNVs!) Dr Geoff Macintyre Structural variation (SVs) Copy-number variations C Deletion A B C Balanced rearrangements A B A B C B A C Duplication Inversion Causes
Genome-wide copy-number calling (CNAs not CNVs!) Dr Geoff Macintyre Structural variation (SVs) Copy-number variations C Deletion A B C Balanced rearrangements A B A B C B A C Duplication Inversion Causes
Supplementary Information. Supplementary Figures
 Supplementary Information Supplementary Figures.8 57 essential gene density 2 1.5 LTR insert frequency diversity DEL.5 DUP.5 INV.5 TRA 1 2 3 4 5 1 2 3 4 1 2 Supplementary Figure 1. Locations and minor
Supplementary Figure 1
 Supplementary Figure 1 Supplementary Fig. 1: Quality assessment of formalin-fixed paraffin-embedded (FFPE)-derived DNA and nuclei. (a) Multiplex PCR analysis of unrepaired and repaired bulk FFPE gdna from
Relationship between genomic features and distributions of RS1 and RS3 rearrangements in breast cancer genomes.
 Supplementary Figure 1 Relationship between genomic features and distributions of RS1 and RS3 rearrangements in breast cancer genomes. (a,b) Values of coefficients associated with genomic features, separately
202002, India Author affiliations
 Copy number variation and microdeletions of the Y chromosome linked genes and loci across different categories of Indian infertile males Anju Kumari 1, Sandeep Kumar Yadav 1, M.M. Misro 2, Jamal Ahmad
Nature Medicine: doi: /nm.3967
 Supplementary Figure 1. Network clustering. (a) Clustering performance as a function of inflation factor. The grey curve shows the median weighted Silhouette widths for varying inflation factors (f [1.6,
Supplemental Information. Molecular, Pathological, Radiological, and Immune. Profiling of Non-brainstem Pediatric High-Grade
 Cancer Cell, Volume 33 Supplemental Information Molecular, Pathological, Radiological, and Immune Profiling of Non-brainstem Pediatric High-Grade Glioma from the HERBY Phase II Randomized Trial Alan Mackay,
S1 Appendix: Figs A G and Table A. b Normal Generalized Fraction 0.075
 Aiello & Alter (216) PLoS One vol. 11 no. 1 e164546 S1 Appendix A-1 S1 Appendix: Figs A G and Table A a Tumor Generalized Fraction b Normal Generalized Fraction.25.5.75.25.5.75 1 53 4 59 2 58 8 57 3 48
Nature Genetics: doi: /ng Supplementary Figure 1. Clinical timeline for the discovery WES cases.
 Supplementary Figure 1 Clinical timeline for the discovery WES cases. This illustrates the timeline of the disease events during the clinical course of each patient s disease, further indicating the available
Supplemental Data. Genome-wide Association of Copy-Number Variation. Reveals an Association between Short Stature
 The American Journal of Human Genetics, Volume 89 Supplemental Data Genome-wide Association of Copy-Number Variation Reveals an Association between Short Stature and the Presence of Low-Frequency Genomic
Genetic alterations of histone lysine methyltransferases and their significance in breast cancer
 Genetic alterations of histone lysine methyltransferases and their significance in breast cancer Supplementary Materials and Methods Phylogenetic tree of the HMT superfamily The phylogeny outlined in the
MEDICAL GENOMICS LABORATORY. Next-Gen Sequencing and Deletion/Duplication Analysis of NF1 Only (NF1-NG)
") Next-Gen Sequencing and Deletion/Duplication Analysis of NF1 Only (NF1-NG) Ordering Information Acceptable specimen types: Fresh blood sample (3-6 ml EDTA; no time limitations associated with receipt)
Next-Gen Sequencing and Deletion/Duplication Analysis of NF1 Only (NF1-NG) Ordering Information Acceptable specimen types: Fresh blood sample (3-6 ml EDTA; no time limitations associated with receipt)
Supplementary Figure 1. Quantile-quantile (Q-Q) plots. (Panel A) Q-Q plot graphical
 plots. (Panel A) Q-Q plot graphical") Supplementary Figure 1. Quantile-quantile (Q-Q) plots. (Panel A) Q-Q plot graphical representation using all SNPs (n= 13,515,798) including the region on chromosome 1 including SORT1 which was previously
Supplementary Figure 1. Quantile-quantile (Q-Q) plots. (Panel A) Q-Q plot graphical representation using all SNPs (n= 13,515,798) including the region on chromosome 1 including SORT1 which was previously
Understanding DNA Copy Number Data
 Understanding DNA Copy Number Data Adam B. Olshen Department of Epidemiology and Biostatistics Helen Diller Family Comprehensive Cancer Center University of California, San Francisco http://cc.ucsf.edu/people/olshena_adam.php
Nature Genetics: doi: /ng Supplementary Figure 1
 Supplementary Figure 1 Replicability of blood eqtl effects in ileal biopsies from the RISK study. eqtls detected in the vicinity of SNPs associated with IBD tend to show concordant effect size and direction
Supplementary. properties of. network types. randomly sampled. subsets (75%
 Supplementary Information Gene co-expression network analysis reveals common system-level prognostic genes across cancer types properties of Supplementary Figure 1 The robustness and overlap of prognostic
Frequency(%) KRAS G12 KRAS G13 KRAS A146 KRAS Q61 KRAS K117N PIK3CA H1047 PIK3CA E545 PIK3CA E542K PIK3CA Q546. EGFR exon19 NFS-indel EGFR L858R
 KRAS G12 KRAS G13 KRAS A146 KRAS Q61 KRAS K117N PIK3CA H1047 PIK3CA E545 PIK3CA E542K PIK3CA Q546. EGFR exon19 NFS-indel EGFR L858R") Frequency(%) 1 a b ALK FS-indel ALK R1Q HRAS Q61R HRAS G13R IDH R17K IDH R14Q MET exon14 SS-indel KIT D8Y KIT L76P KIT exon11 NFS-indel SMAD4 R361 IDH1 R13 CTNNB1 S37 CTNNB1 S4 AKT1 E17K ERBB D769H ERBB
Frequency(%) 1 a b ALK FS-indel ALK R1Q HRAS Q61R HRAS G13R IDH R17K IDH R14Q MET exon14 SS-indel KIT D8Y KIT L76P KIT exon11 NFS-indel SMAD4 R361 IDH1 R13 CTNNB1 S37 CTNNB1 S4 AKT1 E17K ERBB D769H ERBB
UNIVERSITY OF CALIFORNIA, LOS ANGELES
 UNIVERSITY OF CALIFORNIA, LOS ANGELES BERKELEY DAVIS IRVINE LOS ANGELES MERCED RIVERSIDE SAN DIEGO SAN FRANCISCO UCLA SANTA BARBARA SANTA CRUZ DEPARTMENT OF EPIDEMIOLOGY SCHOOL OF PUBLIC HEALTH CAMPUS
Role of Genomics in Selection of Beef Cattle for Healthfulness Characteristics
 Role of Genomics in Selection of Beef Cattle for Healthfulness Characteristics Dorian Garrick dorian@iastate.edu Iowa State University & National Beef Cattle Evaluation Consortium Selection and Prediction
Supplementary Figure 1. Schematic diagram of o2n-seq. Double-stranded DNA was sheared, end-repaired, and underwent A-tailing by standard protocols.
 Supplementary Figure 1. Schematic diagram of o2n-seq. Double-stranded DNA was sheared, end-repaired, and underwent A-tailing by standard protocols. A-tailed DNA was ligated to T-tailed dutp adapters, circularized
Nature Genetics: doi: /ng Supplementary Figure 1. Details of sequencing analysis.
 Supplementary Figure 1 Details of sequencing analysis. (a) Flow chart showing which patients fall into each category and were used for analysis. (b) Graph showing the average and median coverage for all
Supplementary Tables. Supplementary Figures
 Supplementary Files for Zehir, Benayed et al. Mutational Landscape of Metastatic Cancer Revealed from Prospective Clinical Sequencing of 10,000 Patients Supplementary Tables Supplementary Table 1: Sample
The role of cytogenomics in the diagnostic work-up of Chronic Lymphocytic Leukaemia
 The role of cytogenomics in the diagnostic work-up of Chronic Lymphocytic Leukaemia Adrian Zordan, Meaghan Wall, Ruth MacKinnon, Pina D Achille & Lynda Campbell Victorian Cancer Cytogenetics Service (VCCS)
Supplementary information. Supplementary figure 1. Flow chart of study design
 Supplementary information Supplementary figure 1. Flow chart of study design Supplementary Figure 2. Quantile-quantile plot of stage 1 results QQ plot of the observed -log10 P-values (y axis) versus the
GENOME-WIDE ASSOCIATION STUDIES
 GENOME-WIDE ASSOCIATION STUDIES SUCCESSES AND PITFALLS IBT 2012 Human Genetics & Molecular Medicine Zané Lombard IDENTIFYING DISEASE GENES??? Nature, 15 Feb 2001 Science, 16 Feb 2001 IDENTIFYING DISEASE
Supplementary Figures
 Supplementary Figures Supplementary Figure 1. Pan-cancer analysis of global and local DNA methylation variation a) Variations in global DNA methylation are shown as measured by averaging the genome-wide
The Loss of Heterozygosity (LOH) Algorithm in Genotyping Console 2.0
 Algorithm in Genotyping Console 2.0") The Loss of Heterozygosity (LOH) Algorithm in Genotyping Console 2.0 Introduction Loss of erozygosity (LOH) represents the loss of allelic differences. The SNP markers on the SNP Array 6.0 can be used
The Loss of Heterozygosity (LOH) Algorithm in Genotyping Console 2.0 Introduction Loss of erozygosity (LOH) represents the loss of allelic differences. The SNP markers on the SNP Array 6.0 can be used
Bin Liu, Lei Yang, Binfang Huang, Mei Cheng, Hui Wang, Yinyan Li, Dongsheng Huang, Jian Zheng,
 The American Journal of Human Genetics, Volume 91 Supplemental Data A Functional Copy-Number Variation in MAPKAPK2 Predicts Risk and Survival of Lung Cancer Bin Liu, Lei Yang, Binfang Huang, Mei Cheng,
Supplementary Figures
 Supplementary Figures Supplementary Fig 1. Comparison of sub-samples on the first two principal components of genetic variation. TheBritishsampleisplottedwithredpoints.The sub-samples of the diverse sample
Nature Genetics: doi: /ng Supplementary Figure 1
 Supplementary Figure 1 Multiple samples from five patients (P4, P8, P14, P15 and P17) with Barrett s esophagus and adjacent EAC show that the poor overlap is not a result of sampling bias. Bar graphs showing
Magnetic resonance imaging, image analysis:visual scoring of white matter
 Supplemental method ULSAM Magnetic resonance imaging, image analysis:visual scoring of white matter hyperintensities (WMHI) was performed by a neuroradiologist using a PACS system blinded of baseline data.
Advance Your Genomic Research Using Targeted Resequencing with SeqCap EZ Library
 Advance Your Genomic Research Using Targeted Resequencing with SeqCap EZ Library Marilou Wijdicks International Product Manager Research For Life Science Research Only. Not for Use in Diagnostic Procedures.
Supplementary Figure 1. Recording sites.
 Supplementary Figure 1 Recording sites. (a, b) Schematic of recording locations for mice used in the variable-reward task (a, n = 5) and the variable-expectation task (b, n = 5). RN, red nucleus. SNc,
Nature Methods: doi: /nmeth.3115
 Supplementary Figure 1 Analysis of DNA methylation in a cancer cohort based on Infinium 450K data. RnBeads was used to rediscover a clinically distinct subgroup of glioblastoma patients characterized by
Implementation of the DDD/ClinGen OGT (CytoSure v3) Microarray
 Microarray") Implementation of the DDD/ClinGen OGT (CytoSure v3) Microarray OGT UGM Birmingham 08/09/2016 Dom McMullan Birmingham Women's NHS Trust WM chromosomal microarray (CMA) testing Population of ~6 million (10%)
Implementation of the DDD/ClinGen OGT (CytoSure v3) Microarray OGT UGM Birmingham 08/09/2016 Dom McMullan Birmingham Women's NHS Trust WM chromosomal microarray (CMA) testing Population of ~6 million (10%)
Dr Rick Tearle Senior Applications Specialist, EMEA Complete Genomics Complete Genomics, Inc.
 Dr Rick Tearle Senior Applications Specialist, EMEA Complete Genomics Topics Overview of Data Processing Pipeline Overview of Data Files 2 DNA Nano-Ball (DNB) Read Structure Genome : acgtacatgcattcacacatgcttagctatctctcgccag
Mangrove: Genetic risk prediction on trees
 Mangrove: Genetic risk prediction on trees Luke Jostins March 8, 2012 Abstract Mangrove is an R package for performing genetic risk prediction from genotype data. You can use it to perform risk prediction
Supplementary Figures
 Supplementary Figures Supplementary Figure 1. Heatmap of GO terms for differentially expressed genes. The terms were hierarchically clustered using the GO term enrichment beta. Darker red, higher positive
Structural Variation and Medical Genomics
 Structural Variation and Medical Genomics Andrew King Department of Biomedical Informatics July 8, 2014 You already know about small scale genetic mutations Single nucleotide polymorphism (SNPs) Deletions,
SUPPLEMENTARY INFORMATION
 doi:10.1038/nature10866 a b 1 2 3 4 5 6 7 Match No Match 1 2 3 4 5 6 7 Turcan et al. Supplementary Fig.1 Concepts mapping H3K27 targets in EF CBX8 targets in EF H3K27 targets in ES SUZ12 targets in ES
Journal: Nature Methods
 Journal: Nature Methods Article Title: Network-based stratification of tumor mutations Corresponding Author: Trey Ideker Supplementary Item Supplementary Figure 1 Supplementary Figure 2 Supplementary Figure
CHROMOSOMAL MICROARRAY (CGH+SNP)
") Chromosome imbalances are a significant cause of developmental delay, mental retardation, autism spectrum disorders, dysmorphic features and/or birth defects. The imbalance of genetic material may be due
Chromosome imbalances are a significant cause of developmental delay, mental retardation, autism spectrum disorders, dysmorphic features and/or birth defects. The imbalance of genetic material may be due
Cytogenetics 101: Clinical Research and Molecular Genetic Technologies
 Cytogenetics 101: Clinical Research and Molecular Genetic Technologies Topics for Today s Presentation 1 Classical vs Molecular Cytogenetics 2 What acgh? 3 What is FISH? 4 What is NGS? 5 How can these
University of Groningen. Metabolic risk in people with psychotic disorders Bruins, Jojanneke
 University of Groningen Metabolic risk in people with psychotic disorders Bruins, Jojanneke IMPORTANT NOTE: You are advised to consult the publisher's version (publisher's PDF) if you wish to cite from
QTL detection for traits of interest for the dairy goat industry
 QTL detection for traits of interest for the dairy goat industry 64 th Annual Meeting EAAP 2013 26 th -30 th august Nantes, France C. Maroteau, I. Palhière, H. Larroque, V. Clément, G. Tosser-Klopp, R.
A general framework for analyzing tumor subclonality using SNP array and DNA sequencing data
 Li and Li Genome Biology 2014, 15:473 METHOD A general framework for analyzing tumor subclonality using SNP array and DNA sequencing data Bo Li 1 and Jun Z Li 2 Open Access Abstract Intra-tumor heterogeneity
Whole-genome detection of disease-associated deletions or excess homozygosity in a case control study of rheumatoid arthritis
 HMG Advance Access published December 21, 2012 Human Molecular Genetics, 2012 1 13 doi:10.1093/hmg/dds512 Whole-genome detection of disease-associated deletions or excess homozygosity in a case control
AD (Leave blank) TITLE: Genomic Characterization of Brain Metastasis in Non-Small Cell Lung Cancer Patients
 TITLE: Genomic Characterization of Brain Metastasis in Non-Small Cell Lung Cancer Patients") AD (Leave blank) Award Number: W81XWH-12-1-0444 TITLE: Genomic Characterization of Brain Metastasis in Non-Small Cell Lung Cancer Patients PRINCIPAL INVESTIGATOR: Mark A. Watson, MD PhD CONTRACTING ORGANIZATION:
AD (Leave blank) Award Number: W81XWH-12-1-0444 TITLE: Genomic Characterization of Brain Metastasis in Non-Small Cell Lung Cancer Patients PRINCIPAL INVESTIGATOR: Mark A. Watson, MD PhD CONTRACTING ORGANIZATION:
Supplementary Figure 1. Principal components analysis of European ancestry in the African American, Native Hawaiian and Latino populations.
 Supplementary Figure. Principal components analysis of European ancestry in the African American, Native Hawaiian and Latino populations. a Eigenvector 2.5..5.5. African Americans European Americans e
The Biology and Genetics of Cells and Organisms The Biology of Cancer
 The Biology and Genetics of Cells and Organisms The Biology of Cancer Mendel and Genetics How many distinct genes are present in the genomes of mammals? - 21,000 for human. - Genetic information is carried
Single-strand DNA library preparation improves sequencing of formalin-fixed and paraffin-embedded (FFPE) cancer DNA
 cancer DNA") www.impactjournals.com/oncotarget/ Oncotarget, Supplementary Materials 2016 Single-strand DNA library preparation improves sequencing of formalin-fixed and paraffin-embedded (FFPE) DNA Supplementary Materials
www.impactjournals.com/oncotarget/ Oncotarget, Supplementary Materials 2016 Single-strand DNA library preparation improves sequencing of formalin-fixed and paraffin-embedded (FFPE) DNA Supplementary Materials
Nature Genetics: doi: /ng Supplementary Figure 1
 Supplementary Figure 1 Illustrative example of ptdt using height The expected value of a child s polygenic risk score (PRS) for a trait is the average of maternal and paternal PRS values. For example,
Table S1. Relative abundance of AGO1/4 proteins in different organs. Table S2. Summary of smrna datasets from various samples.
 Supplementary files Table S1. Relative abundance of AGO1/4 proteins in different organs. Table S2. Summary of smrna datasets from various samples. Table S3. Specificity of AGO1- and AGO4-preferred 24-nt
Assessment of Breast Cancer with Borderline HER2 Status Using MIP Microarray
 Assessment of Breast Cancer with Borderline HER2 Status Using MIP Microarray Hui Chen, Aysegul A Sahin, Xinyan Lu, Lei Huo, Rajesh R Singh, Ronald Abraham, Shumaila Virani, Bal Mukund Mishra, Russell Broaddus,
p.r623c p.p976l p.d2847fs p.t2671 p.d2847fs p.r2922w p.r2370h p.c1201y p.a868v p.s952* RING_C BP PHD Cbp HAT_KAT11
 ARID2 p.r623c KMT2D p.v650fs p.p976l p.r2922w p.l1212r p.d1400h DNA binding RFX DNA binding Zinc finger KMT2C p.a51s p.d372v p.c1103* p.d2847fs p.t2671 p.d2847fs p.r4586h PHD/ RING DHHC/ PHD PHD FYR N
Nature Genetics: doi: /ng Supplementary Figure 1. Somatic coding mutations identified by WES/WGS for 83 ATL cases.
 Supplementary Figure 1 Somatic coding mutations identified by WES/WGS for 83 ATL cases. (a) The percentage of targeted bases covered by at least 2, 10, 20 and 30 sequencing reads (top) and average read
Introduction to LOH and Allele Specific Copy Number User Forum
 Introduction to LOH and Allele Specific Copy Number User Forum Jonathan Gerstenhaber Introduction to LOH and ASCN User Forum Contents 1. Loss of heterozygosity Analysis procedure Types of baselines 2.
Identification of regions with common copy-number variations using SNP array
 Identification of regions with common copy-number variations using SNP array Agus Salim Epidemiology and Public Health National University of Singapore Copy Number Variation (CNV) Copy number alteration
Practical challenges that copy number variation and whole genome sequencing create for genetic diagnostic labs
 Practical challenges that copy number variation and whole genome sequencing create for genetic diagnostic labs Joris Vermeesch, Center for Human Genetics K.U.Leuven, Belgium ESHG June 11, 2010 When and
Supplement to SCnorm: robust normalization of single-cell RNA-seq data
 Supplement to SCnorm: robust normalization of single-cell RNA-seq data Supplementary Note 1: SCnorm does not require spike-ins, since we find that the performance of spike-ins in scrna-seq is often compromised,
Investigating rare diseases with Agilent NGS solutions
 Investigating rare diseases with Agilent NGS solutions Chitra Kotwaliwale, Ph.D. 1 Rare diseases affect 350 million people worldwide 7,000 rare diseases 80% are genetic 60 million affected in the US, Europe
Supplementary Figure 1: Features of IGLL5 Mutations in CLL: a) Representative IGV screenshot of first
 Representative IGV screenshot of first") Supplementary Figure 1: Features of IGLL5 Mutations in CLL: a) Representative IGV screenshot of first intron IGLL5 mutation depicting biallelic mutations. Red arrows highlight the presence of out of phase
Supplementary Figure 1: Features of IGLL5 Mutations in CLL: a) Representative IGV screenshot of first intron IGLL5 mutation depicting biallelic mutations. Red arrows highlight the presence of out of phase
cnvhap: an integrative population and haplotype based multiplatform model of SNPs and CNVs
 cnvhap: an integrative population and haplotype based multiplatform model of SNPs and CNVs Lachlan J M Coin 1, Julian E Asher, Robin G Walters, Julia S El-Sayed Moustafa, Adam J de Smith, Rob Sladek 3,
SUPPLEMENTARY INFORMATION
 CONTENTS A. AUTISM SPECTRUM DISORDER (ASD) SAMPLE AND CONTROL COLLECTIONS 4 ASD samples 4 Control cohorts 4 B. GENOTYPING AND DATA CLEANING 6 SNP quality control 6 Intensity quality control for CNV detection
Evaluation of BRCA1/2 and homologous recombination defects in ovarian cancer and impact on clinical outcomes
 Evaluation of BRCA1/2 and homologous recombination defects in ovarian cancer and impact on clinical outcomes Melinda S. Yates, PhD Department of Gynecologic Oncology & Reproductive Medicine University
Supplementary information to:
 Supplementary information to: Digital Sorting of Pure Cell Populations Enables Unambiguous Genetic Analysis of Heterogeneous Formalin-Fixed Paraffin Embedded Tumors by Next Generation Sequencing Authors
Supporting Online Material for
 www.sciencemag.org/cgi/content/full/1171320/dc1 Supporting Online Material for A Frazzled/DCC-Dependent Transcriptional Switch Regulates Midline Axon Guidance Long Yang, David S. Garbe, Greg J. Bashaw*
GENDER James Bier
 GENDER 2005-2008 James Bier Objectives 1. State the method of determining gender in several genetic systems. 2. List the three regions of the Y chromosome. 3. Describe the events that promote sexual development
The unconstrained evolution of fast and efficient antibiotic-resistant bacterial genomes
 In the format provided by the authors and unedited. VOLUME: ARTICLE NUMBER: 5 The unconstrained evolution of fast and efficient antibiotic-resistant bacterial genomes Carlos Reding-Roman, Mark Hewlett,
Challenges of CGH array testing in children with developmental delay. Dr Sally Davies 17 th September 2014
 Challenges of CGH array testing in children with developmental delay Dr Sally Davies 17 th September 2014 CGH array What is CGH array? Understanding the test Benefits Results to expect Consent issues Ethical
Enterprise Interest Thermo Fisher Scientific / Employee
 Enterprise Interest Thermo Fisher Scientific / Employee A next-generation sequencing assay to estimate tumor mutation load from FFPE research samples Fiona Hyland. Director of R&D, Bioinformatics Clinical
Supplementary Methods
 Supplementary Methods Short Read Preprocessing Reads are preprocessed differently according to how they will be used: detection of the variant in the tumor, discovery of an artifact in the normal or for
Clinical Genomics. Ina E. Amarillo, PhD FACMGG
 Clinical Genomics Ina E. Amarillo, PhD FACMGG Associate Medical Director, Cytogenetics Lab (CaTG), Lab and Genomic Medicine Assistant Professor, Pathology and Immunology Outline Clinical Genomics Testing
Multiple Copy Number Variations in a Patient with Developmental Delay ASCLS- March 31, 2016
 Multiple Copy Number Variations in a Patient with Developmental Delay ASCLS- March 31, 2016 Marwan Tayeh, PhD, FACMG Director, MMGL Molecular Genetics Assistant Professor of Pediatrics Department of Pediatrics
MRC-Holland MLPA. Description version 29; 31 July 2015
 SALSA MLPA probemix P081-C1/P082-C1 NF1 P081 Lot C1-0114. As compared to the previous B2 version (lot 0813 and 0912), 11 target probes are replaced or added, and 10 new reference probes are included. P082
Copy number and somatic mutations drive tumors
 Detection of copy number alterations, ploidy and loss of heterozygosity across the genome in FFPE specimens Utility for diagnosis and treatment with comparison to FISH-based and as a complement to sequencing
SUPPLEMENTARY INFORMATION
 SUPPLEMENTRY INFORMTION Supplementary Figure 1. Q-Q plot of RE/NIMH autism family TDT results. The quantile-quantile plot of the expected and observed P-values is shown. The blue circles represent the
Cancer Treatment by Alternating Electric Fields (TTFields); Physical Basis & Clinical Trial Results. Madrid, March 2015
; Physical Basis & Clinical Trial Results. Madrid, March 2015") 1 Cancer Treatment by Alternating Electric Fields (TTFields); Physical Basis & Clinical Trial Results Madrid, March 2015 2 Cancer Treatments Surgical - whenever possible, Effective mostly in Early stages,
1 Cancer Treatment by Alternating Electric Fields (TTFields); Physical Basis & Clinical Trial Results Madrid, March 2015 2 Cancer Treatments Surgical - whenever possible, Effective mostly in Early stages,
MRC-Holland MLPA. Description version 08; 30 March 2015
 SALSA MLPA probemix P351-C1 / P352-D1 PKD1-PKD2 P351-C1 lot C1-0914: as compared to the previous version B2 lot B2-0511 one target probe has been removed and three reference probes have been replaced.