Numerous hypothesis tests were performed in this study. To reduce the false positive due to
|
|
|
- Susanna Hodge
- 5 years ago
- Views:
Transcription
1 Two alternative data-splitting Numerous hypothesis tests were performed in this study. To reduce the false positive due to multiple testing, we are not only seeking the results with extremely small p values but also those that can be robustly found in different subsets of our dataset. To do so, we split our dataset into the discovery and validation sets as shown in Table 1. Furthermore, we performed additional two data-splitting on the same dataset. The results shown in the main text are from the original datasplitting. Presented here in Supporting Information were those from the two alternative datasplitting. The results from three data-splitting showed consistent patterns. (Tables S1-S3) Therefore, it is unlikely that our report is simply chance aberration due to particular split. Analyses of batch effect During the data preprocessing, normalization with consideration of the batch effect was performed. Even so, the association between the batch and cigarette smoking may still potentially exert undue confounding effects. Because of that, we performed the analyses with adjustment of the batch effect in the genome-wide analyses and focal copy number analyses. The corresponding analyses to Figure 1A and 1B and those to Figure 1C and 1D were shown in Tables S4 and S5, respectively. For the focal copy number-smoking association, 1,000 loci were randomly selected to perform both batch-adjusted and unadjusted analyses. P values from the two analyses were compared to see whether they follow similar distributions. Such comparisons were made for both single-marker analyses (Figure S1A) and 10-marker analyses (Figure S1B). Overall, the analyses adjusted for the batch effect did not change the pattern of the results and our conclusions.
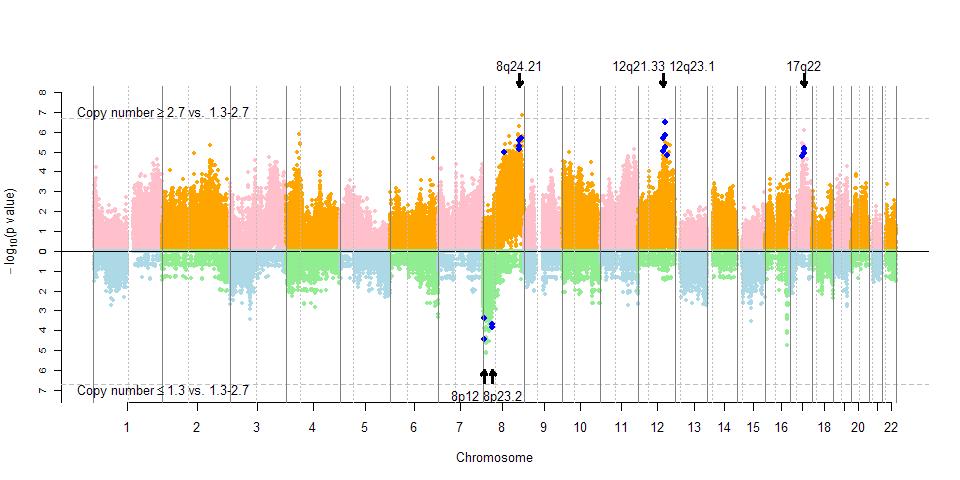
2 Single-marker analyses of cigarette smoking and focal copy number: the dichotomous version We also pursued the single-marker analyses in a dichotomous fashion. We tabulated the copy numbers ( 2.7 vs for gains; 1.3 vs for losses) and smoking pack-years (>60 vs. 60) and tested its association by Fisher exact test for 256,554 loci. Logistic regressions were also performed with adjustment of age at diagnosis, gender, two cohorts, clinical stage and histology. The dichotomous-version analyses show that copy number gains in 15 loci and copy number losses in 6 loci are associated with the heavy smoking. (Figure S8A and Table S7) These candidate loci were clustered in 8q24, 12q21, 12q23 and 17q22 (Figures S8B-S8E) for gains and 8p12 and 8p23 for losses (Figures S8F and S8G).
3 Table S1. P values of comparing % of probes with CN 2.7 (or <1.3) between heavy smokers and non-/light-smokers, with three different data-splitting. Main text Alternative 1 Alternative 2 % of probes with copy number 2.7 Discovery set Validation set Both sets % of probes with copy number <1.3 Discovery set Validation set Both sets 0.61
4 Table S2. P values of testing whether the mean G/T ratio is different than that at random (40.64%), with three different data-splitting. NS/LS: non-smokers/light-smokers; HS: heavy smokers. Main text Alternative 1 Alternative 2 Copy number gain NS/LS Discovery set HS NS/LS Validation set HS NS/LS 0.08 Both sets HS Copy number loss NS/LS Discovery set HS NS/LS Validation set HS NS/LS Both sets HS 0.32
5 Table S3. P values of the eleven loci presented in Table S6 from the single-marker CN-smoking analyses with three different datasplitting. Main text Alternative 1 Alternative 2 Discovery set Validation set Discovery set Validation set Discovery set Validation set Copy number >2 rs rs rs rs rs rs Copy number 2 rs rs rs rs rs
6 Table S4. P values of comparing % of probes with CN 2.7 (or <1.3) between heavy smokers and non-/light-smokers, with and without adjustment of batch effects. Unadjusted Batch-adjusted % of probes with copy number 2.7 Discovery set Validation set Both sets % of probes with copy number <1.3 Discovery set Validation set Both sets
7 Table S5. P values of testing whether the mean G/T ratio is different than that at random (40.64%), with and without adjustment of batch effects. NS/LS: non-smokers/light-smokers; HS: heavy smokers. Unadjusted Batch-adjusted Copy number gain NS/LS Discovery set HS NS/LS Validation set HS NS/LS Both sets HS Copy number loss NS/LS Discovery set HS NS/LS Validation set HS NS/LS Both sets HS
8 Table S6. Summary of eleven loci from the top 100 loci with smallest p value in the discovery set and confirmed in the validation set with p<0.05, under the continuous focal copy number-smoking analyses. Linear model with spline of Genomic Linear model with up to quadratic term of square roottransformed smoking pack-years square root-transformed smoking pack-years dbsnp ID Chromosome position Gene Adjusted p Unadjusted Adjusted p P value unadjusted for covariates r 2 (Mb) value * p value value * Discovery Validation set set Pooled Pooled Pooled Pooled Pooled Copy number >2 rs q rs q rs q IGF rs q IGF rs q rs q Copy number 2 rs q LOC rs p rs p rs p rs q * P values of smoking pack-years were calculated from linear models with either up to quadratic term or models with spline of square root-transformed smoking pack-years, adjusting for age, gender, clinical stage, two sets and cell type.
9 Table S7. Summary of twenty one loci from the top 100 loci with smallest p value in the discovery set and confirmed in the validation set with p<0.05, under the dichotomous-version of focal copy number-smoking analyses.
10 Affymetrix ID dbsnp ID Chromosome Copy number gains Position (Mb) Gene P value Discovery set Validation set Pooled OR (95% CI) * P adj value * SNP_A rs q (2.44, 10.11) SNP_A rs q (2.62, 10.52) SNP_A rs q (3.04, 13.2) SNP_A rs q (2.52, 10.48) SNP_A rs q (2.97, 11.65) SNP_A rs q (4.17, 62.11) SNP_A rs q (3.95, 97.9) SNP_A rs q (5.04, 57.23) SNP_A rs q (3.69, 41.2) SNP_A rs q (4.96, 83.89) SNP_A rs q LOC (2.84, 15.48) SNP_A rs q SKAP (2.88, 15.03) SNP_A rs q (3.35, 25.9) SNP_A rs q (3.33, 27.6) SNP_A rs q (3.56, 33.26) Copy number losses SNP_A rs p CSMD (2.89, 23.49) SNP_A rs p CSMD (2.35, 20.38) SNP_A rs p (2.98, 26.11) SNP_A rs p (2.98, 26.11) SNP_A rs p (2.98, 26.14) SNP_A rs p (3.31, 38.16) * Obtained from logistic regressions with adjustment of gender, age at surgery, two sets, clinical stage, and histology.
11 Figure S1. QQ plots of p values from batch-adjusted and unadjusted associations between focal copy numbers and pack-years of cigarette smoking. A, 1,000 p values were randomly chosen from 256,554 single-marker analyses. B, 1,000 p values were randomly chosen from 25, marker analyses.
12 A B
13 Figure S2. % of probes in genes with CNAs in heavy (>60 pack-years) and light or nonsmokers ( 60 pack-years). Proportion (%) of probes in genes with CNAs (A, gains; B, losses) events by pack-years of cigarette smoking.
14 A B
15 Figure S3. Chromosome-specific copy number pattern between heavy and light/nonsmokers. Average copy numbers in chromosomes 1 (A), 3 (D), 7 (C), 8 (D), 10 (E), 11 (F), 12 (G), 16 (H) and 17 (I) are plotted where copy numbers greater than two are red (heavy smokers) or pink color (light/non-smokers), and those less or equal to two are blue (heavy smokers) or light blue color (light/non-smokers). Vertical dotted lines indicate the centromeres of chromosomes. P value in each plot indicates the statistical significance of testing the averaged copy numbers (across the subjects) in the chromosome between heavy and light/non-smokers.


16 A B C D E F H G I
17 Figure S4. Association of cigarette smoking and chromosome/arm-specific copy numbers. Panel a illustrates the association of CNAs with heavy against light/non-smokers. Genome-wide mean CNs, genome-wide % of CN gains and total CN gains are the three indices, the difference of which between heavy and light/non-smokers is what p values intend to test (see detail in Methods). Panel b illustrates the association of copy numbers with the continuous smoking pack-years. The dashed line indicates p=0.05.
18 A B
19 Figure S5. Association of cigarette smoking and 256,554 focal copy numbers. A, A plot of -log 10 P of the association between smoking pack-years and copy number, which is analyzed for copy number >2 (upper half) and 2 (lower half), separately. Dashed lines indicate p= B, P values of probes in the 12q23.2 region ( Mb), indicated by the black arrow in a. The other two arrows indicate 3q24 and 8q24.21, of which the p values in the focal region are shown in Figure S6. Blue dots in both plots are the top 100 p values in the discovery set and confirmed in the validation set with p<0.05. The dashed lines indicate p= and IGF1, insulin-like growth factor 1; PMCH, pro-melanin-concentrating hormone; C12orf48, chromosome 12 open reading frame 48; NUP37, nucleoporin 37kDa; CCDC53, coiled-coil domain containing 53. C-F, Scatter plots of the four validated loci (a, rs ; b, rs ; c, rs ; d, rs ) in the region of 12q23.2 with predicted values from three regression models: quadratic model: ordinary least square linear models with up to quadratic term of square root-transformed smoking pack-years (solid black lines), spline: linear models with spline of pack-years (solid green lines), and LOWESS (solid red lines), and the 95% confidence intervals of predicted mean value from spline models (dashed green lines). The other seven validated loci were plotted in Figure S7.

20 A B C D E F
21 Figure S6. Two candidate regions (in addition to 12q23.2) identified from focal copy number-smoking analyses. P values of probes from the association analyses of focal copy numbers and smoking pack-years in the region of 3q24 (A) and 8q24.21 (B). Blue dots (in A, the location of rs ; in B, the location of rs ) are those in the list of top 100 p values in the discovery set and confirmed in the validation set with p<0.05. The dashed lines indicate p= and AGTR1, angiotensin II receptor, type 1; CPB1, carboxypeptidase B1 (tissue); CPA3, carboxypeptidase A3 (mast cell); LOC727677, hypothetical LOC727677; MYC, v-myc myelocytomatosis viral oncogene homolog (avian); PVT1, Pvt1 oncogene (non-protein coding).
22 A B
23 Figure S7. Scatter plot and dose-response relationship of smoking pack-years and copy numbers in the seven candidate loci (in addition to the four in 12q23 (Figure S5C-F)). Scatter plots of the loci (A, rs (at 3q24); B, rs (at 8q24.21); C, rs (11q24.2); D, rs (at 6p24.3); E, rs (at 6p24.3); F, rs (at 5p14.3); G, rs (at 17q24.3)) with predicted values from ordinary least square linear models with up to quadratic term of square root-transformed smoking pack-years (solid black lines), models with spline of pack-years (solid green lines), and LOWESS (solid red lines) and the 95% confidence intervals of predicted mean value from spline models (dashed green lines).
24 A B C D E F G
25 Figure S8. Association of dichotomous smoking pack-years (>60 vs. <60) and 256,554 focal CNAs ( 2.7 or 1.3 vs ). A, A plot of -log 10 P of the association between smoking pack-years and copy number by Fisher exact test, which is analyzed for copy number gains (upper half) and losses (lower half), separately. Dashed lines indicate p= B-G, P values of probes in the 8q q24.22 (B), 12q21.33 (C), 12q.23.1 (D), 17q q22 (E), 8p23.2 (F) and 8p12 (G), indicated by the black arrow in A. Blue dots in these plots are the top 100 p values in the discovery set and confirmed in the validation set with p<0.05. The dashed lines indicate p= and MYC, v-myc myelocytomatosis viral oncogene homolog (avian); PVT1, Pvt1 oncogene; GSDMC, gasdermin C; FAM49B, family with sequence similarity 49, member B; ASAP1, ArfGAP with SH3 domain, ankyrin repeat and PH domain 1; DUSP6, dual specificity phosphatase 6; WDR51B (POC1B), POC1 centriolar protein homolog B; ATP2B1, ATPase, Ca++ transporting, plasma membrane 1; RMST, rhabdomyosarcoma 2 associated transcript; CA10, carbonic anhydrase X; KIF2B, kinesin family member 2B; CSMD1, CUB and Sushi multiple domains 1; UNC5D, unc-5 homolog D (C. elegans).
26 A B
27 C D
28 E F
29 G
30 Figure S9. Whole-genome copy number pattern of every 10 smoking pack-years. Total probes with events of copy number gains by pack-years of cigarette smoking in the discovery set (A), the validation set (B) and both sets (C).
31 A B C
Numerous hypothesis tests were performed in this study. To reduce the false positive due to
 Two alternative data-splitting Numerous hypothesis tests were performed in this study. To reduce the false positive due to multiple testing, we are not only seeking the results with extremely small p values
SGRQ Questionnaire assessing respiratory disease-specific quality of life. Questionnaire assessing general quality of life
 SUPPLEMENTARY MATERIAL e-table 1: Outcomes studied in present analysis. Outcome Abbreviation Definition Nature of data, direction indicating adverse effect (continuous only) Clinical outcomes- subjective
Mosaic loss of chromosome Y in peripheral blood is associated with shorter survival and higher risk of cancer
 Supplementary Information Mosaic loss of chromosome Y in peripheral blood is associated with shorter survival and higher risk of cancer Lars A. Forsberg, Chiara Rasi, Niklas Malmqvist, Hanna Davies, Saichand
1.4 - Linear Regression and MS Excel
 1.4 - Linear Regression and MS Excel Regression is an analytic technique for determining the relationship between a dependent variable and an independent variable. When the two variables have a linear
Statistical Assessment of the Global Regulatory Role of Histone. Acetylation in Saccharomyces cerevisiae. (Support Information)
") Statistical Assessment of the Global Regulatory Role of Histone Acetylation in Saccharomyces cerevisiae (Support Information) Authors: Guo-Cheng Yuan, Ping Ma, Wenxuan Zhong and Jun S. Liu Linear Relationship
Statistical Assessment of the Global Regulatory Role of Histone Acetylation in Saccharomyces cerevisiae (Support Information) Authors: Guo-Cheng Yuan, Ping Ma, Wenxuan Zhong and Jun S. Liu Linear Relationship
UNIVERSITY OF CALIFORNIA, LOS ANGELES
 UNIVERSITY OF CALIFORNIA, LOS ANGELES BERKELEY DAVIS IRVINE LOS ANGELES MERCED RIVERSIDE SAN DIEGO SAN FRANCISCO UCLA SANTA BARBARA SANTA CRUZ DEPARTMENT OF EPIDEMIOLOGY SCHOOL OF PUBLIC HEALTH CAMPUS
S1 Appendix: Figs A G and Table A. b Normal Generalized Fraction 0.075
 Aiello & Alter (216) PLoS One vol. 11 no. 1 e164546 S1 Appendix A-1 S1 Appendix: Figs A G and Table A a Tumor Generalized Fraction b Normal Generalized Fraction.25.5.75.25.5.75 1 53 4 59 2 58 8 57 3 48
Application of Local Control Strategy in analyses of the effects of Radon on Lung Cancer Mortality for 2,881 US Counties
 Application of Local Control Strategy in analyses of the effects of Radon on Lung Cancer Mortality for 2,881 US Counties Bob Obenchain, Risk Benefit Statistics, August 2015 Our motivation for using a Cut-Point
Analysis of gene expression in blood before diagnosis of ovarian cancer
 Analysis of gene expression in blood before diagnosis of ovarian cancer Different statistical methods Note no. Authors SAMBA/10/16 Marit Holden and Lars Holden Date March 2016 Norsk Regnesentral Norsk
Introduction to Discrimination in Microarray Data Analysis
 Introduction to Discrimination in Microarray Data Analysis Jane Fridlyand CBMB University of California, San Francisco Genentech Hall Auditorium, Mission Bay, UCSF October 23, 2004 1 Case Study: Van t
Supplementary Materials
 Supplementary Materials Supplementary figure 1. Taxonomic representation summarized at genus level. Fecal microbiota from a separate set of Jackson and Harlan mice prior to irradiation. A taxon was included
Supplementary Figure 1: Attenuation of association signals after conditioning for the lead SNP. a) attenuation of association signal at the 9p22.
 attenuation of association signal at the 9p22.") Supplementary Figure 1: Attenuation of association signals after conditioning for the lead SNP. a) attenuation of association signal at the 9p22.32 PCOS locus after conditioning for the lead SNP rs10993397;
Supplementary Figure 1: Attenuation of association signals after conditioning for the lead SNP. a) attenuation of association signal at the 9p22.32 PCOS locus after conditioning for the lead SNP rs10993397;
PubHlth Introductory Biostatistics Practice Test I (Without Unit 3 Questions)
") 1 PubHlth 540 - Introductory Biostatistics Practice Test I (Without Unit 3 Questions) 1. (10 points) In the Honolulu Heart Study, Systolic Blood Pressure was tabulated for 100 Subjects including 37 Smokers
1 PubHlth 540 - Introductory Biostatistics Practice Test I (Without Unit 3 Questions) 1. (10 points) In the Honolulu Heart Study, Systolic Blood Pressure was tabulated for 100 Subjects including 37 Smokers
Supplementary Information Titles Journal: Nature Medicine
 Supplementary Information Titles Journal: Nature Medicine Article Title: Corresponding Author: Supplementary Item & Number Supplementary Fig.1 Fig.2 Fig.3 Fig.4 Fig.5 Fig.6 Fig.7 Fig.8 Fig.9 Fig. Fig.11
Relationship between genomic features and distributions of RS1 and RS3 rearrangements in breast cancer genomes.
 Supplementary Figure 1 Relationship between genomic features and distributions of RS1 and RS3 rearrangements in breast cancer genomes. (a,b) Values of coefficients associated with genomic features, separately
Early Learning vs Early Variability 1.5 r = p = Early Learning r = p = e 005. Early Learning 0.
 The temporal structure of motor variability is dynamically regulated and predicts individual differences in motor learning ability Howard Wu *, Yohsuke Miyamoto *, Luis Nicolas Gonzales-Castro, Bence P.
U118MG. Supplementary Figure 1 U373MG U118MG 3.5 A CCF-SSTG
 A172 CCF-SSTG1 15 - - - 1 1 1 2 2 3 4 6 7 8 10101112131617192022-1 1 1 2 2 3 4 6 7 8 10 10 11 12 13 16 17 19 20 22 T98G U373MG - - - 1 1 1 2 2 3 4 6 7 8 10 10 11 12 13 16 17 19 20 22-1 1 1 2 2 3 4 6 7
Expanded View Figures
 Solip Park & Ben Lehner Epistasis is cancer type specific Molecular Systems Biology Expanded View Figures A B G C D E F H Figure EV1. Epistatic interactions detected in a pan-cancer analysis and saturation
Biostatistics II
 Biostatistics II 514-5509 Course Description: Modern multivariable statistical analysis based on the concept of generalized linear models. Includes linear, logistic, and Poisson regression, survival analysis,
Genetic alterations of histone lysine methyltransferases and their significance in breast cancer
 Genetic alterations of histone lysine methyltransferases and their significance in breast cancer Supplementary Materials and Methods Phylogenetic tree of the HMT superfamily The phylogeny outlined in the
Supplementary Figure 1. Principal components analysis of European ancestry in the African American, Native Hawaiian and Latino populations.
 Supplementary Figure. Principal components analysis of European ancestry in the African American, Native Hawaiian and Latino populations. a Eigenvector 2.5..5.5. African Americans European Americans e
Plasma-Seq conducted with blood from male individuals without cancer.
 Supplementary Figures Supplementary Figure 1 Plasma-Seq conducted with blood from male individuals without cancer. Copy number patterns established from plasma samples of male individuals without cancer
ARTICLE RESEARCH. Macmillan Publishers Limited. All rights reserved
 Extended Data Figure 6 Annotation of drivers based on clinical characteristics and co-occurrence patterns. a, Putative drivers affecting greater than 10 patients were assessed for enrichment in IGHV mutated
LOGO. Statistical Modeling of Breast and Lung Cancers. Cancer Research Team. Department of Mathematics and Statistics University of South Florida
 LOGO Statistical Modeling of Breast and Lung Cancers Cancer Research Team Department of Mathematics and Statistics University of South Florida 1 LOGO 2 Outline Nonparametric and parametric analysis of
Supplement to SCnorm: robust normalization of single-cell RNA-seq data
 Supplement to SCnorm: robust normalization of single-cell RNA-seq data Supplementary Note 1: SCnorm does not require spike-ins, since we find that the performance of spike-ins in scrna-seq is often compromised,
SUPPLEMENTARY APPENDIX
 SUPPLEMENTARY APPENDIX 1) Supplemental Figure 1. Histopathologic Characteristics of the Tumors in the Discovery Cohort 2) Supplemental Figure 2. Incorporation of Normal Epidermal Melanocytic Signature
Meaning-based guidance of attention in scenes as revealed by meaning maps
 SUPPLEMENTARY INFORMATION Letters DOI: 1.138/s41562-17-28- In the format provided by the authors and unedited. -based guidance of attention in scenes as revealed by meaning maps John M. Henderson 1,2 *
Figure S2. Distribution of acgh probes on all ten chromosomes of the RIL M0022
 96 APPENDIX B. Supporting Information for chapter 4 "changes in genome content generated via segregation of non-allelic homologs" Figure S1. Potential de novo CNV probes and sizes of apparently de novo
Nature Neuroscience: doi: /nn Supplementary Figure 1. Missense damaging predictions as a function of allele frequency
 Supplementary Figure 1 Missense damaging predictions as a function of allele frequency Percentage of missense variants classified as damaging by eight different classifiers and a classifier consisting
New Enhancements: GWAS Workflows with SVS
 New Enhancements: GWAS Workflows with SVS August 9 th, 2017 Gabe Rudy VP Product & Engineering 20 most promising Biotech Technology Providers Top 10 Analytics Solution Providers Hype Cycle for Life sciences
Supplementary. properties of. network types. randomly sampled. subsets (75%
 Supplementary Information Gene co-expression network analysis reveals common system-level prognostic genes across cancer types properties of Supplementary Figure 1 The robustness and overlap of prognostic
For more information about how to cite these materials visit
 Author(s): Kerby Shedden, Ph.D., 2010 License: Unless otherwise noted, this material is made available under the terms of the Creative Commons Attribution Share Alike 3.0 License: http://creativecommons.org/licenses/by-sa/3.0/
Biostatistics for Med Students. Lecture 1
 Biostatistics for Med Students Lecture 1 John J. Chen, Ph.D. Professor & Director of Biostatistics Core UH JABSOM JABSOM MD7 February 14, 2018 Lecture note: http://biostat.jabsom.hawaii.edu/education/training.html
Supplemental Table S2: Subgroup analysis for IL-6 with BMI in 3 groups
 Supplemental Table S1: Unadjusted and Adjusted Hazard Ratios for Diabetes Associated with Baseline Factors Considered in Model 3 SMART Participants Only Unadjusted Adjusted* Baseline p-value p-value Covariate
PBZ FT01_PBZ FT01_TZ FT01_NZ. interface zone (I) tumor zone (TZ) necrotic zone (NZ)
 tumor zone (TZ) necrotic zone (NZ)") Oncotarget, Supplementary Materials www.impactjournals.com/oncotarget/ SUPPLEMENTRY FLES ndividuals factor map (P) FT_ FT_ FT_ Dim (.%) Dim (.%) >% peripheral brain zone () around % interface zone () FT
Oncotarget, Supplementary Materials www.impactjournals.com/oncotarget/ SUPPLEMENTRY FLES ndividuals factor map (P) FT_ FT_ FT_ Dim (.%) Dim (.%) >% peripheral brain zone () around % interface zone () FT
The Loss of Heterozygosity (LOH) Algorithm in Genotyping Console 2.0
 Algorithm in Genotyping Console 2.0") The Loss of Heterozygosity (LOH) Algorithm in Genotyping Console 2.0 Introduction Loss of erozygosity (LOH) represents the loss of allelic differences. The SNP markers on the SNP Array 6.0 can be used
The Loss of Heterozygosity (LOH) Algorithm in Genotyping Console 2.0 Introduction Loss of erozygosity (LOH) represents the loss of allelic differences. The SNP markers on the SNP Array 6.0 can be used
Airway epithelial gene expression in the diagnostic evaluation of smokers with suspect lung cancer
 Airway epithelial gene expression in the diagnostic evaluation of smokers with suspect lung cancer Avrum Spira, Jennifer E Beane, Vishal Shah, Katrina Steiling, Gang Liu, Frank Schembri, Sean Gilman, Yves-Martine
Supplementary Information Methods Subjects The study was comprised of 84 chronic pain patients with either chronic back pain (CBP) or osteoarthritis
 or osteoarthritis") Supplementary Information Methods Subjects The study was comprised of 84 chronic pain patients with either chronic back pain (CBP) or osteoarthritis (OA). All subjects provided informed consent to procedures
Supplementary Information Methods Subjects The study was comprised of 84 chronic pain patients with either chronic back pain (CBP) or osteoarthritis (OA). All subjects provided informed consent to procedures
Integrated Analysis of Copy Number and Gene Expression
 Integrated Analysis of Copy Number and Gene Expression Nexus Copy Number provides user-friendly interface and functionalities to integrate copy number analysis with gene expression results for the purpose
Supplementary Table 1. Baseline Characteristics by Quintiles of Systolic and Diastolic Blood Pressures
 Supplementary Data Supplementary Table 1. Baseline Characteristics by Quintiles of Systolic and Diastolic Blood Pressures Quintiles of Systolic Blood Pressure Quintiles of Diastolic Blood Pressure Q1 Q2
Supplementary Figure 1
 Supplementary Figure 1 Supplementary Fig. 1: Quality assessment of formalin-fixed paraffin-embedded (FFPE)-derived DNA and nuclei. (a) Multiplex PCR analysis of unrepaired and repaired bulk FFPE gdna from
Cancer Informatics Lecture
 Cancer Informatics Lecture Mayo-UIUC Computational Genomics Course June 22, 2018 Krishna Rani Kalari Ph.D. Associate Professor 2017 MFMER 3702274-1 Outline The Cancer Genome Atlas (TCGA) Genomic Data Commons
Regression Discontinuity Analysis
 Regression Discontinuity Analysis A researcher wants to determine whether tutoring underachieving middle school students improves their math grades. Another wonders whether providing financial aid to low-income
chapter 1 - fig. 2 Mechanism of transcriptional control by ppar agonists.
 chapter 1 - fig. 1 The -omics subdisciplines. chapter 1 - fig. 2 Mechanism of transcriptional control by ppar agonists. 201 figures chapter 1 chapter 2 - fig. 1 Schematic overview of the different steps
Supplementary Figures
 Supplementary Figures Supplementary Figure 1. Heatmap of GO terms for differentially expressed genes. The terms were hierarchically clustered using the GO term enrichment beta. Darker red, higher positive
Supplemental Data. Genome-wide Association of Copy-Number Variation. Reveals an Association between Short Stature
 The American Journal of Human Genetics, Volume 89 Supplemental Data Genome-wide Association of Copy-Number Variation Reveals an Association between Short Stature and the Presence of Low-Frequency Genomic
Supplementary materials for: Executive control processes underlying multi- item working memory
 Supplementary materials for: Executive control processes underlying multi- item working memory Antonio H. Lara & Jonathan D. Wallis Supplementary Figure 1 Supplementary Figure 1. Behavioral measures of
Statistics Assignment 11 - Solutions
 Statistics 44.3 Assignment 11 - Solutions 1. Samples were taken of individuals with each blood type to see if the average white blood cell count differed among types. Eleven individuals in each group were
Supplemental Table 1 Molecular Profile of the SCLC Cell Line Panel
 Supplemental Table 1 Molecular Profile of the SCLC Cell Line Panel p53 RB Myc Cell Line Mutation A Mutation A Amplification B COR-L103 C p.y234c p.d584e L-Myc NCI-H526 p.s33_splice None N-Myc NCI-H1048
38 Int'l Conf. Bioinformatics and Computational Biology BIOCOMP'16
 38 Int'l Conf. Bioinformatics and Computational Biology BIOCOMP'16 PGAR: ASD Candidate Gene Prioritization System Using Expression Patterns Steven Cogill and Liangjiang Wang Department of Genetics and
Patnaik SK, et al. MicroRNAs to accurately histotype NSCLC biopsies
 Patnaik SK, et al. MicroRNAs to accurately histotype NSCLC biopsies. 2014. Supplemental Digital Content 1. Appendix 1. External data-sets used for associating microrna expression with lung squamous cell
Nature Neuroscience: doi: /nn Supplementary Figure 1
 Supplementary Figure 1 Reward rate affects the decision to begin work. (a) Latency distributions are bimodal, and depend on reward rate. Very short latencies (early peak) preferentially occur when a greater
Linear Regression in SAS
 1 Suppose we wish to examine factors that predict patient s hemoglobin levels. Simulated data for six patients is used throughout this tutorial. data hgb_data; input id age race $ bmi hgb; cards; 21 25
2) Cases and controls were genotyped on different platforms. The comparability of the platforms should be discussed.
 Cases and controls were genotyped on different platforms. The comparability of the platforms should be discussed.") Reviewers' Comments: Reviewer #1 (Remarks to the Author) The manuscript titled 'Association of variations in HLA-class II and other loci with susceptibility to lung adenocarcinoma with EGFR mutation' evaluated
Reviewers' Comments: Reviewer #1 (Remarks to the Author) The manuscript titled 'Association of variations in HLA-class II and other loci with susceptibility to lung adenocarcinoma with EGFR mutation' evaluated
Figure S1. Alignment of predicted amino acid sequences of KIR3DH alleles identified in 8
 Supporting Information Figure S1. Alignment of predicted amino acid sequences of KIR3DH alleles identified in 8 unrelated rhesus monkeys. KIR3DH alleles, expressed by CD14 CD16 + NK cells that were isolated
The Chromosomes of a Frimpanzee: An Imaginary Animal
 The Chromosomes of a Frimpanzee: An Imaginary Animal Introduction By now, you have heard the terms chromosome, mitosis, and meiosis. You probably also know that chromosomes contain genetic information
egfr > 50 (n = 13,916)
") Saxagliptin and Cardiovascular Risk in Patients with Type 2 Diabetes Mellitus and Moderate or Severe Renal Impairment: Observations from the SAVOR-TIMI 53 Trial Supplementary Table 1. Characteristics according
Saxagliptin and Cardiovascular Risk in Patients with Type 2 Diabetes Mellitus and Moderate or Severe Renal Impairment: Observations from the SAVOR-TIMI 53 Trial Supplementary Table 1. Characteristics according
Nature Medicine: doi: /nm.3967
 Supplementary Figure 1. Network clustering. (a) Clustering performance as a function of inflation factor. The grey curve shows the median weighted Silhouette widths for varying inflation factors (f [1.6,
Nature Genetics: doi: /ng Supplementary Figure 1. SEER data for male and female cancer incidence from
 Supplementary Figure 1 SEER data for male and female cancer incidence from 1975 2013. (a,b) Incidence rates of oral cavity and pharynx cancer (a) and leukemia (b) are plotted, grouped by males (blue),
BIOSTATISTICAL METHODS
 BIOSTATISTICAL METHODS FOR TRANSLATIONAL & CLINICAL RESEARCH PROPENSITY SCORE Confounding Definition: A situation in which the effect or association between an exposure (a predictor or risk factor) and
Comparison And Application Of Methods To Address Confounding By Indication In Non- Randomized Clinical Studies
 University of Massachusetts Amherst ScholarWorks@UMass Amherst Masters Theses 1911 - February 2014 Dissertations and Theses 2013 Comparison And Application Of Methods To Address Confounding By Indication
Supplementary Online Content
 Supplementary Online Content Regan EA, Lynch DA, Curran-Everett D, et al; Genetic Epidemiology of COPD (COPDGene) Investigators. Clinical and radiologic disease in smokers with normal spirometry. Published
Module 3: Pathway and Drug Development
 Module 3: Pathway and Drug Development Table of Contents 1.1 Getting Started... 6 1.2 Identifying a Dasatinib sensitive cancer signature... 7 1.2.1 Identifying and validating a Dasatinib Signature... 7
Rho GTPase activating protein 8 /// PRR5- ARHGAP8 fusion
 Probe Set ID RefSeq Transcript ID Gene Title Gene Symbol 205980_s_at NM_001017526 /// NM_181334 /// NM_181335 Rho GTPase activating protein 8 /// PRR5- ARHGAP8 fusion ARHGAP8 /// LOC553158 FC ALK shrna
Correlation and regression
 PG Dip in High Intensity Psychological Interventions Correlation and regression Martin Bland Professor of Health Statistics University of York http://martinbland.co.uk/ Correlation Example: Muscle strength
Nature Neuroscience: doi: /nn Supplementary Figure 1. Task timeline for Solo and Info trials.
 Supplementary Figure 1 Task timeline for Solo and Info trials. Each trial started with a New Round screen. Participants made a series of choices between two gambles, one of which was objectively riskier
Supplementary Appendix
 Supplementary Appendix This appendix has been provided by the authors to give readers additional information about their work. Supplement to: Weintraub WS, Grau-Sepulveda MV, Weiss JM, et al. Comparative
Supplementary Figure 1. Metabolic landscape of cancer discovery pipeline. RNAseq raw counts data of cancer and healthy tissue samples were downloaded
 Supplementary Figure 1. Metabolic landscape of cancer discovery pipeline. RNAseq raw counts data of cancer and healthy tissue samples were downloaded from TCGA and differentially expressed metabolic genes
Nature Genetics: doi: /ng Supplementary Figure 1. Mutational signatures in BCC compared to melanoma.
 Supplementary Figure 1 Mutational signatures in BCC compared to melanoma. (a) The effect of transcription-coupled repair as a function of gene expression in BCC. Tumor type specific gene expression levels
IS IT GENETIC? How do genes, environment and chance interact to specify a complex trait such as intelligence?
 1 IS IT GENETIC? How do genes, environment and chance interact to specify a complex trait such as intelligence? Single-gene (monogenic) traits Phenotypic variation is typically discrete (often comparing
Nature Genetics: doi: /ng Supplementary Figure 1
 Supplementary Figure 1 Replicability of blood eqtl effects in ileal biopsies from the RISK study. eqtls detected in the vicinity of SNPs associated with IBD tend to show concordant effect size and direction
Measures of Association
 Measures of Association Lakkana Thaikruea M.D., M.S., Ph.D. Community Medicine Department, Faculty of Medicine, Chiang Mai University, Thailand Introduction One of epidemiological studies goal is to determine
Supplementary Appendix
 Supplementary Appendix This appendix has been provided by the authors to give readers additional information about their work. Supplement to: Bredel M, Scholtens DM, Yadav AK, et al. NFKBIA deletion in
Comparison of discrimination methods for the classification of tumors using gene expression data
 Comparison of discrimination methods for the classification of tumors using gene expression data Sandrine Dudoit, Jane Fridlyand 2 and Terry Speed 2,. Mathematical Sciences Research Institute, Berkeley
VL Network Analysis ( ) SS2016 Week 3
 SS2016 Week 3") VL Network Analysis (19401701) SS2016 Week 3 Based on slides by J Ruan (U Texas) Tim Conrad AG Medical Bioinformatics Institut für Mathematik & Informatik, Freie Universität Berlin 1 Motivation 2 Lecture
VL Network Analysis (19401701) SS2016 Week 3 Based on slides by J Ruan (U Texas) Tim Conrad AG Medical Bioinformatics Institut für Mathematik & Informatik, Freie Universität Berlin 1 Motivation 2 Lecture
Chapter 4 Cellular Oncogenes ~ 4.6 -
 Chapter 4 Cellular Oncogenes - 4.2 ~ 4.6 - Many retroviruses carrying oncogenes have been found in chickens and mice However, attempts undertaken during the 1970s to isolate viruses from most types of
Putative effectors for prognosis in lung adenocarcinoma are ethnic and gender specific
 /, Advance Publications 2015 Putative effectors for prognosis in lung adenocarcinoma are ethnic and gender specific Andrew Woolston 1, Nardnisa Sintupisut 1, Tzu-Pin Lu 2, Liang-Chuan Lai 3, Mong-Hsun
MULTIPLE LINEAR REGRESSION 24.1 INTRODUCTION AND OBJECTIVES OBJECTIVES
 24 MULTIPLE LINEAR REGRESSION 24.1 INTRODUCTION AND OBJECTIVES In the previous chapter, simple linear regression was used when you have one independent variable and one dependent variable. This chapter
Low cigarette consumption and risk of coronary heart disease and stroke: meta-analysis of 141 cohort studies in 55 study reports
 Low cigarette consumption and risk of coronary heart disease and stroke: meta-analysis of 141 cohort studies in 55 study reports Allan Hackshaw, 1 Joan K Morris, 2 Sadie Boniface, 3 Jin-Ling Tang, 4 Dušan
Title: Systematic review of lung function and COPD with peripheral blood DNA methylation in population based studies
 Author s response to reviews Title: Systematic review of lung function and COPD with peripheral blood DNA methylation in population based studies Authors: Matthew Machin (matthew.machin12@imperial.ac.uk)
Table of content. -Supplementary methods. -Figure S1. -Figure S2. -Figure S3. -Table legend
 Table of content -Supplementary methods -Figure S1 -Figure S2 -Figure S3 -Table legend Supplementary methods Yeast two-hybrid bait basal transactivation test Because bait constructs sometimes self-transactivate
CHILD HEALTH AND DEVELOPMENT STUDY
 CHILD HEALTH AND DEVELOPMENT STUDY 9. Diagnostics In this section various diagnostic tools will be used to evaluate the adequacy of the regression model with the five independent variables developed in
Lecture Outline. Biost 590: Statistical Consulting. Stages of Scientific Studies. Scientific Method
 Biost 590: Statistical Consulting Statistical Classification of Scientific Studies; Approach to Consulting Lecture Outline Statistical Classification of Scientific Studies Statistical Tasks Approach to
Predicting clinical outcomes in neuroblastoma with genomic data integration
 Predicting clinical outcomes in neuroblastoma with genomic data integration Ilyes Baali, 1 Alp Emre Acar 1, Tunde Aderinwale 2, Saber HafezQorani 3, Hilal Kazan 4 1 Department of Electric-Electronics Engineering,
Tutorial on Genome-Wide Association Studies
 Tutorial on Genome-Wide Association Studies Assistant Professor Institute for Computational Biology Department of Epidemiology and Biostatistics Case Western Reserve University Acknowledgements Dana Crawford
Nature Genetics: doi: /ng Supplementary Figure 1
 Supplementary Figure 1 Expression deviation of the genes mapped to gene-wise recurrent mutations in the TCGA breast cancer cohort (top) and the TCGA lung cancer cohort (bottom). For each gene (each pair
Supplementary Figure 1: Comparison of acgh-based and expression-based CNA analysis of tumors from breast cancer GEMMs.
 Supplementary Figure 1: Comparison of acgh-based and expression-based CNA analysis of tumors from breast cancer GEMMs. (a) CNA analysis of expression microarray data obtained from 15 tumors in the SV40Tag
Chapter 2 Planning Experiments
 Some Standard Designs Page 1 of 9 Chapter 2 Planning Experiments Careful planning of an experiment is crucial for good analysis with required precision. 2.2 A Checklist for Planning Experiments A. Define
Bin Liu, Lei Yang, Binfang Huang, Mei Cheng, Hui Wang, Yinyan Li, Dongsheng Huang, Jian Zheng,
 The American Journal of Human Genetics, Volume 91 Supplemental Data A Functional Copy-Number Variation in MAPKAPK2 Predicts Risk and Survival of Lung Cancer Bin Liu, Lei Yang, Binfang Huang, Mei Cheng,
EXPression ANalyzer and DisplayER
 EXPression ANalyzer and DisplayER Tom Hait Aviv Steiner Igor Ulitsky Chaim Linhart Amos Tanay Seagull Shavit Rani Elkon Adi Maron-Katz Dorit Sagir Eyal David Roded Sharan Israel Steinfeld Yossi Shiloh
Nature Structural & Molecular Biology: doi: /nsmb.2419
 Supplementary Figure 1 Mapped sequence reads and nucleosome occupancies. (a) Distribution of sequencing reads on the mouse reference genome for chromosome 14 as an example. The number of reads in a 1 Mb
CONTENT SUPPLEMENTARY FIGURE E. INSTRUMENTAL VARIABLE ANALYSIS USING DESEASONALISED PLASMA 25-HYDROXYVITAMIN D. 7
 CONTENT FIGURES 3 SUPPLEMENTARY FIGURE A. NUMBER OF PARTICIPANTS AND EVENTS IN THE OBSERVATIONAL AND GENETIC ANALYSES. 3 SUPPLEMENTARY FIGURE B. FLOWCHART SHOWING THE SELECTION PROCESS FOR DETERMINING
MULTIPLE REGRESSION OF CPS DATA
 MULTIPLE REGRESSION OF CPS DATA A further inspection of the relationship between hourly wages and education level can show whether other factors, such as gender and work experience, influence wages. Linear
National Surgical Adjuvant Breast and Bowel Project (NSABP) Foundation Annual Progress Report: 2008 Formula Grant
 Foundation Annual Progress Report: 2008 Formula Grant") National Surgical Adjuvant Breast and Bowel Project (NSABP) Foundation Annual Progress Report: 2008 Formula Grant Reporting Period July 1, 2011 December 31, 2011 Formula Grant Overview The National Surgical
National Surgical Adjuvant Breast and Bowel Project (NSABP) Foundation Annual Progress Report: 2008 Formula Grant Reporting Period July 1, 2011 December 31, 2011 Formula Grant Overview The National Surgical
Supplementary Materials
 1 Supplementary Materials Rotger et al. Table S1A: Demographic characteristics of study participants. VNP RP EC CP (n=6) (n=66) (n=9) (n=5) Male gender, n(%) 5 (83) 54 (82) 5 (56) 3 (60) White ethnicity,
of TERT, MLL4, CCNE1, SENP5, and ROCK1 on tumor development were discussed.
 Supplementary Note The potential association and implications of HBV integration at known and putative cancer genes of TERT, MLL4, CCNE1, SENP5, and ROCK1 on tumor development were discussed. Human telomerase
Protein SD Units (P-value) Cluster order
 Cluster order") SUPPLEMENTAL TABLE AND FIGURES Table S1. Signature Phosphoproteome of CD22 E12 Transgenic Mouse BPL Cells. T-test vs. Other Protein SD Units (P-value) Cluster order ATPase (Ab-16) 1.41 0.000880 1 mtor
SUPPLEMENTAL TABLE AND FIGURES Table S1. Signature Phosphoproteome of CD22 E12 Transgenic Mouse BPL Cells. T-test vs. Other Protein SD Units (P-value) Cluster order ATPase (Ab-16) 1.41 0.000880 1 mtor
MMI 409 Spring 2009 Final Examination Gordon Bleil. 1. Is there a difference in depression as a function of group and drug?
 MMI 409 Spring 2009 Final Examination Gordon Bleil Table of Contents Research Scenario and General Assumptions Questions for Dataset (Questions are hyperlinked to detailed answers) 1. Is there a difference
Name: BIOS 703 MIDTERM EXAMINATIONS (5 marks per question, total = 100 marks)
") Name: BIOS 703 MIDTERM EXAMINATIONS (5 marks per question, total = 100 marks) You will have 75 minutest to complete this examination. Some of the questions refer to Crizotinib in ROS1- Rearranged Non Small-
Name: BIOS 703 MIDTERM EXAMINATIONS (5 marks per question, total = 100 marks) You will have 75 minutest to complete this examination. Some of the questions refer to Crizotinib in ROS1- Rearranged Non Small-