THE METABOLIC CONSEQUENCES OF MOUSE BETAINE HOMOCYSTEINE S-METHYLTRNASFERASE DEFICIENCY. Ya-Wen Teng
|
|
|
- Phoebe Hall
- 5 years ago
- Views:
Transcription
1 THE METABOLIC CONSEQUENCES OF MOUSE BETAINE HOMOCYSTEINE S-METHYLTRNASFERASE DEFICIENCY Ya-Wen Teng A dissertation submitted to the faculty of the University of North Carolina at Chapel Hill in partial fulfillment of the requirements for the degree of Doctor of Philosophy in the Department of Nutrition (Biochemistry) of School of Public Health. Chapel Hill 2011 Approved by: Steven H. Zeisel Rosalind A. Coleman Timothy A. Garrow Nobuyo N. Maeda Mihai D. Niculescu
2 2011 Ya-Wen Teng ALL RIGHTS RESERVED ii
3 ABSTRACT YA-WEN TENG: The Metabolic Consequences of Mouse Betaine Homocysteine S- Methyltransferase Deficiency (Under the direction of Steven H. Zeisel) Betaine homocysteine S-methyltransferase (BHMT, EC ) catalyzes the conversion of homocysteine to methionine. Homocysteine is a potentially harmful amino acid. Its elevation is often associated with cardiovascular disease, birth defect, renal insufficiency, and age-related cognitive impairment in humans. Humans have common single nucleotide polymorphisms (SNPs) in the BHMT gene that can alter its enzyme activity and function. Elucidation of the metabolic consequences of BHMT deficiency is critical to the understanding of the relationship between BHMT mutations and diseases. To directly investigate the role of BHMT in vivo, we generated and characterized the mice with the gene encoding Bhmt deleted (Bhmt -/- ). This dissertation describes two separate projects. The first project examines the roles of BHMT in one-carbon metabolism and the development of hepatic steatosis and hepatocellular carcinoma. The second project examines the role of BHMT in energy metabolism. In the first project, we generated and characterized the Bhmt -/- mouse. We found that deletion of Bhmt resulted in elevated homocysteine concentrations, in reduced methylation potential, and in profound alterations of choline metabolites in various tissues. Bhmt -/- mice iii
4 developed fatty liver at five weeks of age due to reduced phosphatidylcholine concentration. Phosphatidylcholine is required for the synthesis of lipoproteins, which carry lipids from the liver to circulation. By one year of age, 64% of Bhmt -/- mice had visible hepatic tumors. Histopathological analysis revealed that Bhmt -/- mice developed hepatocellular carcinoma or carcinoma precursors. We observed that Bhmt -/- mice had reduced body weight from five to nine weeks of age. This observation led us to investigate the potential role of BHMT in energy metabolism. We found that the reduced body weight in Bhmt -/- mice was due to reduced fat mass. Bhmt -/- mice had smaller adipocytes, better glucose tolerance, and enhanced insulin sensitivity. Several factors contributed to the reduced adiposity phenotype observed in Bhmt -/- mice; these included increased energy expenditure, reduced mobilization of lipid from the liver to adipose tissue, decreased lipid synthesis within adipocytes, and enhanced whole-body glucose oxidation. This dissertation provides novel findings that BHMT plays critical roles in hepatocellular carcinoma development and energy metabolism. iv
5 To my grandparents, my father Shuang-Kuei Teng, my mother Hsiu-Feng Tien, my siblings, and my husband Shane Chang.. v
6 ACKNOWLEDGEMENTS I extend my deepest appreciation to my mentor, Dr. Steven Zeisel, for his guidance and support throughout my graduate career. I am extremely grateful to members of my dissertation committee: Dr. Rosalind Coleman, Dr. Timothy Garrow, Dr. Noboyo Maeda, and Dr. Mihai Niculescu, who have all taken time to provide thoughtful discussion pertaining to this work. I thank Zeisel laboratory members for their technical support, advice, and companionship. I thank Dr. Rosalind Coleman and her laboratory members for sharing their experimental expertise with me. I thank my family and my husband for all their love and encouragement. vi
7 TABLE OF CONTENTS LIST OF TABLES... x LIST OF FIGURES... xi LIST OF ABBRIVIATIONS... xii CHAPTER I: INTRODUCTION... 1 CHAPTER II: BACKGROUND General Aspects of Betaine Homocysteine Methyltransferase (BHMT) Interactions of BHMT BHMT and Choline Metabolism BHMT and Homocysteine and One-Carbon Metabolisms Physiological Implications of Betaine and BHMT Human Studies Physiological Implications of Betaine and BHMT Animal Studies One-Carbon Metabolism and Cancer Energy Metabolism and Insulin Sensitivity One-Carbon Metabolism, Energy Metabolism, and Adiposity vii
8 CHAPTER III: THE ROLE OF BHMT IN ONE-CARBON METABOLISM AND LIVER HEALTH Manuscript 1: Deletion of Betaine Homocysteine S-Methyltransferase in Mice Perturbs Choline and 1-Carbon Metabolism, Resulting in Fatty Liver and Hepatocellular Carcinoma Abstract Introduction Experimental Procedures Results Discussion Figures Tables Supplement CHAPTER IV: THE ROLE OF BHMT IN ENERGY HOMEOSTASIS Manuscript 2: Mouse Betaine Homocysteine S-Methyltransferase Deficiency Reduces Body Fat via Increasing Energy Expenditure and Impairing Fuel Usage and Storage Abstract Introduction Experimental Procedures Results Discussion Figures Tables viii
9 CHAPTER V: SYNTHESIS Overview Bhmt deficiency caused hyperhomocysteinemia Bhmt deficiency disturbed choline metabolites Bhmt deficiency altered hepatic health Bhmt deficiency altered methylation potential Bhmt deficiency altered fuel metabolism within adipocytes Bhmt deficiency altered glucose metabolism Bhmt deficiency increased energy expenditure Are Bhmt -/- mice resistant to high fat diet? Public Health Significance REFERENCES ix
10 LIST OF TABLES Table 2.1 BHMT and BHMT2 activities in mouse liver and kidney... 5 Table 2.2 Effect of betaine on carcass composition in pigs and poultry Table 2.3 Effect of betaine on hormone levels in pigs and poultry Table 3.1 Table 3.2 Deletion of Bhmt results in altered choline metabolites in various tissues Deletion of Bhmt results in reduced methylation potential and increased homocyteine concentrations Table 3.3 Deletion of Bhmt results in altered metabolic markers Table 3.4 Pathology in livers from a subset of 1 year old Bhmt +/+ and Bhmt -/- mice Table 3.5 Metabolites in 1 year old Bhmt mouse tissues Table 3.6 Choline metabolites in Bhmt +/- tissues Table 3.7 Other metabolites in Bhmt +/- tissues Table 4.1 Metabolites and gene expression of Bhmt +/+ and Bhmt -/- mice in different tissues Table 4.2 Bile acids and sterols in Bhmt mouse liver and adipose tissue Table 5.1 Glutathione levels in Bhmt mouse liver x
11 LIST OF FIGURES Figure 2.1 Action of BHMT... 3 Figure 2.2 Structure of BHMT... 4 Figure 2.3 Metabolism of choline and betaine and its relationship to one-carbon metabolism... 7 Figure 2.4 Homocysteine metabolism Figure 3.1 Confirmation of Bhmt -/- mice Figure 3.2 Figure 3.3 Bhmt -/- mice have altered activities of enzymes involved in one-carbon metabolism Bhmt -/- mice have fatty liver and reduced hepatic phospholipid concentrations Figure 3.4 Bhmt deletion results in liver tumors at 1 year of age Figure 3.5 Changes in one-carbon metabolism due to Bhmt deletion Figure 4.1 Bhmt -/- mice have reduced adiposity and better insulin & glucose sensitivities Figure 4.2 Bhmt -/- mice have altered energy metabolism Figure 4.3 Bhmt -/- mice are cold sensitive Figure 4.4 Bhmt -/- mice have altered TAG synthesis and glucose oxidation Figure 4.5 Overview of metabolic disturbances in Bhmt -/- mice Figure 5.1 Plasma total homocysteine of Bhmt +/+ or Bhmt -/- mice on varying folate diets Figure 5.2 Ratio between methylated and total DNA in Bhmt +/+ or Bhmt -/- mice Figure 5.3 Insulin receptor α and ß in Bhmt mouse liver xi
12 LIST OF ABBREVIATIONS BHMT AdoHcy/SAH AdoMet/SAM ALT ASM BA BADH BAT Bet BSA BUN CBHcy CBS CCT CHDH CHK Chol CHOP CK CL CMP Betaine homocysteine S-methyltransferase Adenosylhomocysteine Adenosylmethionine Alanine transaminase Acid soluble metabolites Bile acid Betaine aldehyde dehydrogenase Brown adipose tissue Betaine Bovine serum albumin Blood urea nitrogen S-(δ-carboxybutyl)-DL-homocysteine Cystathionine ß-synthase CTP-phosphocholine cytidylyltransferase Choline dehydrogenase Choline kinase Cholesterol C/EBP homologous protein Creatinine kinase CL Cytidine monophosphate xii
13 CpG CPT CTP CγL CYP7A1 DAG DDH DHF Cytosine guanosine CDP choline: diacylglycerol choline phosphotransferase Cytidine triphosphate Cystathionine γ-lase Cholesterol 7α hydroxylase Diacylglycerol Dimethylglycine dehydrogenase Dihydrofolate Dio2 Deiodinase 2 DMG dtmp ER ERK FA FFF-BSA Dimethylglycine Deoxythymidine monophosphate Endoplasmic reticulum Extracellular signal-regulated kinases Fatty acids Fatty acid free bovine serum albumin FGF21 Fibroblast growth factor 21 FLP FOXO1 FRT G-6-P GC/MS Flippase Forkhead box protein O1 Flippase recognition target Glucose-6-phosphate Gas chromatography/mass spectrometry ggt1 Gamma glutamyltransferase 1 GH Growth hormone xiii
14 Glu Glucose GLUT4 Glucose transporter 4 Gly GSK3ß GNMT GPCho Glycine Glycogen synthase kinase 3ß Glycine N-methyltransferase Glycerophosphocholine GRP78 Glucose regulated protein 78 GSH GSSG GWAT HCA HCC Hcy HDL HHcy HPLC Glutathione Glutathione disulfide Gonadal white adipose tissue Hepatocellular adenoma Hepatocellular carcinoma Homocysteine High density lipoprotein Hyperhomocysteinemia High pressure liquid chromatography IGF-1 Insulin-like growth factor 1 IRS Iso IWAT KO LC/MS LDH Insulin receptor substrate Isoproterenol Inguinal white adipose tissue Knockout Liquid chromatography/mass spectrometry Lactate dehydrogenase xiv
15 LDL loxp LPL MAT MCDD Low density lipoprotein locus of X-over P1 Lipoprotein lipase Methionine adenosyltransferase Methionine choline deficient diet MCPT1 Muscle carnitine palmitoyl transferase 1 Met MRI MTA MTHF/methyleneTHF mthf/methylthf MTR/MS NAFLD NASH NEFA Neo PCho PEMT PEPCK PGC1α PKB/Akt PKC PPAR Methionine Magnetic resonance image Methylthioadenosine Methylenetetrahydrofolate 5-methyltetrahydrofolate Methionine synthase Nonalcoholic fatty liver disease Nonalcoholic steatohepatitis Non esterified fatty acid Neomycin Phosphocholine Phosphatidylethanolamine N-methyltransferase Phosphoenolpyruvate carboxykinase Pparγ coactivator 1α Protein kinase B Protein kinase C Peroxisome proliferator activated receptor xv
16 PtdCho/PC PtdCho/PE PtdIns PtdSer RER ROSs SAHH Sarc SDH Ser SHMT SM SMM SNPs SREBP1C T3 T4 TAG TH THF TLC TNF-α TR Phosphatidylcholine Phosphatidylethanolamine Phosphatidylinositol Phosphatidylserine Respiratory exchange ratio Reactive oxygen species S-Adenosylhomocysteine hydrolase Sarcosine Sarcosine dehydrogenase Serine Serine hydroxymethyltransferase Sphingomyelin S methylmethionine Single nucleotide polymorphisms Sterol response element binding protein 1C Triiodothyronine Thyroxine Triacylglycerol Thyroid hormone Tetrahydrofolate Thin layer chromatography Tumor necrosis factor-α Thyroid hormone receptor xvi
17 UCP1 Uncoupling protein 1 VLDL WAT WT Very low density lipoprotein White adipose tissue Wildtype xvii
18 CHAPTER I INTRODUCTION One-carbon metabolism is a network of interrelated biological reactions that donate, accept, and regenerate the one-carbon moieties (-CH 3, methyl group) needed for numerous cellular processes. Over the past few years, one-carbon metabolism has received increasing attention due to its involvement in epigenetic modification and cancer risk. One-carbon metabolism includes both the choline and the homocysteine pathways. Betaine homocysteine S-methyltransferase (BHMT) is the enzyme that integrates these pathways. BHMT uses a methyl group from the choline-metabolite betaine to methylate homocysteine. Homocysteine becomes methionine, the precursor of S-adenosylmethionine that is the universal methyl donor for most cellular methylation processes. While the importance of one-carbon metabolism in human diseases is being gradually elucidated, we have very limited information on BHMT, a key enzyme in one-carbon metabolism. Humans have common single nucleotide polymorphisms (SNPs) in the BHMT gene that can alter its enzyme activity and function. SNPs are identified in several epidemiological studies in humans as bring associated with the altered risks of various diseases. The epidemiological evidence regarding the functional effects of BHMT SNPs, however, remains controversial. The goal of this dissertation is to elucidate the metabolic consequences of
19 BHMT deficiency in order to understand the relationship between BHMT mutations and diseases. To achieve this goal, we generated the mouse model with the gene encoding Bhmt deleted (Bhmt -/- ). We found that Bhmt deficiency resulted in one-carbon metabolism distortion with elevated homocysteine concentrations, altered choline metabolites, and reduced methylation potential. Bhmt deficiency disturbed hepatic health as these mice developed fatty liver at five weeks of age and hepatocellular carcinoma at one year of age. Bhmt deficiency also affected growth. Compared to the controls, Bhmt -/- mice had reduced body weight, which was due to decreased fat mass. Bhmt deficiency reduced adiposity by increasing energy expenditure, reducing lipid mobilization from the liver to adipose tissue, limiting lipid synthesis within adipocytes, and enhancing whole body glucose metabolism. This dissertation affirms the critical role of BHMT in one-carbon metabolism. It also provides novel and convincing data that BHMT is involved in hepatocellular carcinogenesis and energy metabolism. Liver cancer is among one of the most lethal cancers. Fatty liver and obesity are highly prevalent in the United States. This work has identified a new mechanism potentially involved in these diseases. Specific Aims: 1. Generate the mouse with the gene encoding Bhmt deleted globally. 2. Determine the role of Bhmt deficiency in one-carbon metabolism and in hepatic health. 3. Determine the role of Bhmt deficiency in energy metabolism. 2
20 CHAPTER II BACKGROUND 2.1 General Aspects of Betaine Homocysteine S-Methyltransferase (BHMT) Betaine homocysteine S-methyltransferase (BHMT, EC ) is a zinc-dependent cytosolic enzyme found in the choline oxidation pathway. BHMT catalyzes the transfer of a methyl group (-CH 3 ) from betaine (also known as N,N,N-trimethylglycine or glycine betaine) to homocysteine (Hcy). The products of this reaction are dimethylglycine and methionine (Figure 2.1). This reaction follows an ordered Bi-Bi mechanism with Hcy being the first substrate to bind and methionine being the final product off [1, 2]. Figure 2.1 Action of BHMT. BHMT converts betaine and homocysteine to dimethylglycine and methionine respectively. BHMT, betaine homocysteine S-methyltransferase; Hcy, homocysteine; DMG, dimethylglycine. Figure from Teng Y. J. Biol. Chem. 2011; 286(42):
![In mammals, BHMT protein is detected as early as day 10 of gestation [11, 12], and is present in adults [13].](/docs-images/89/100958780/images/21-0.jpg "BHMT is found in liver, kidney, brain and lenses of humans, and in liver and kidney of rodents [14]. It is one of the most abundant proteins in mammalian liver; BHMT is estimated to account for 0.6-1.")
![6% of the total protein in the liver [14]. On the other hand, its activity is low in the human kidney and extremely low in the rodent kidney (Table 2.1) [13, 15].](/docs-images/89/100958780/images/21-1.jpg "BHMT gene expression and BHMT activity increase when dietary choline and betaine are abundant, and when methionine is limited [3, 16, 17].")
21 In mammals, BHMT protein is detected as early as day 10 of gestation [11, 12], and is present in adults [13]. BHMT is found in liver, kidney, brain and lenses of humans, and in liver and kidney of rodents [14]. It is one of the most abundant proteins in mammalian liver; BHMT is estimated to account for % of the total protein in the liver [14]. On the other hand, its activity is low in the human kidney and extremely low in the rodent kidney (Table 2.1) [13, 15]. BHMT gene expression and BHMT activity increase when dietary choline and betaine are abundant, and when methionine is limited [3, 16, 17]. BHMT activity is subject to feedback inhibition, as it is strongly inhibited by dimethylglycine and weakly inhibited by methionine [2]. Figure 2.2 Structure of BHMT. (a) Structure of the rat liver BHMT tetramer. The asymmetric unit contains four molecules. Zinc atoms are represented as grey spheres at each active-site. (b) Electron density map showing the three essential cysteine residues coordinated to the zinc atom. Figures from Evans J. Structure. 2002; 10(9), Gozalez B. J. Mol. Biol. 2004; 338,
![Recently, betaine homocysteine methyltransferase 2 (BHMT2, EC 2.1.1.5) has been identified to also methylate Hcy to methionine [18, 19]. The human BHMT2 gene is located 22.](/docs-images/89/100958780/images/22-0.jpg "3 kb 5 of BHMT and encodes a protein that is 73% identical to that of BHMT. Unlike BHMT, BHMT2 cannot use betaine but uses S-methylmethionine (SMM) as the methyl donor [18, 20].")
22 Recently, betaine homocysteine methyltransferase 2 (BHMT2, EC ) has been identified to also methylate Hcy to methionine [18, 19]. The human BHMT2 gene is located 22.3 kb 5 of BHMT and encodes a protein that is 73% identical to that of BHMT. Unlike BHMT, BHMT2 cannot use betaine but uses S-methylmethionine (SMM) as the methyl donor [18, 20]. BHMT2 protein degrades rapidly unless it is bound to BHMT and stabilized by Hcy [18, 20]. In mouse liver, BHMT2 activity is very low, with activity less than 5% of that of BHMT (Table 2.1) [18]. As with BHMT, there have been low amounts of BHMT2 activity detected in mouse kidney [18]. No BHMT2 activity has been detected in the heart, skeletal muscle, spleen, brain, small intestine, or lung [18]. The role and the significance of BHMT2 remain to be determined. Table 2.1 BHMT and BHMT2 activities in mouse liver and kidney. Table from Szegedi S. J. Biol. Chem. 2008; 283 (14),
23 2.2 Interactions of BHMT BHMT and Choline Metabolism Betaine, the methyl donor for BHMT, was first isolated from sugar beets (Beta vulgaris) by Scheibler, a German Chemist, in the 1860s [21, 22]. Scheibler named it Betaine, and showed that it has the structure of a trimethylglycine (Figure 2.1). Aside from sugar beets high levels of betaine can be found in foods such as wheat germ, shrimp, and spinach [23]. Betaine is rapidly absorbed in the ileum via transporters, and its bioavailability is assumed to be close to 100% [24]. The estimated dietary intake of betaine ranges from mg/day [25]. However, a recommended daily intake of betaine has not been established since betaine can also be produced endogenously from an essential nutrient, choline. Choline dehydrogenase (CHDH, EC ) oxidizes choline to betaine aldehyde in the inner mitochondrial membrane (Figure 2.3). Betaine aldehyde dehydrogenase (BADH, EC ) then transforms betaine aldehyde to betaine in the mitochondrial matrix [26, 27]. Betaine moves from mitochondria to cytosol, where BHMT is active. This movement is believed to be accomplished by passive diffusion as no active transport process has been identified. The liver and the kidney cortex are the principal sites for choline oxidation. Since betaine cannot be reduced back to choline, this oxidation pathway commits choline to be used for methylation. 6


; SDH, sarcosine dehydrogenase; Ser, serine; SHMT, serine")
24 Figure 2.3 Metabolism of choline and betaine and its relationship to one-carbon metabolism. AdoHcy, S-adenosylhomocysteine; AdoMet, S-adenosylmethionine; BADH, betaine aldehyde dehydrogenase; Bet, betaine; BHMT, betaine homocysteine S- methyltransferase; CCT, CTP-phosphocholine cytidylyltransferase; CHK, choline kinase; CHDH, choline dehydrogenase; CPT, cytidine 5-diphosphate (CDP) choline: diacylglycerol choline phosphotransferase; DDH, dimethylglycine dehydrogenase; DMG, dimethylglycine; Gly, glycine; GNMT, glycine N-methyltransferase; Hcy, homocysteine; Met, methionine; mthf, 5-methyltetrahydrofolate; MTHF, methylenetetrahydrofolate; MTR, methionine synthase; PC, phosphatidylcholine; PE, phosphatidylethanolamine; PEMT, phosphatidylethanolamine N-methyltransferase; Sarc, sarcosine (monomethylglycine); SDH, sarcosine dehydrogenase; Ser, serine; SHMT, serine hydroxymethyltransferase; THF, tetrahydrofolate. Figure from Ueland P. J. Inherit. Metab. Dis. 2011; 34,
25 Choline, the precursor of betaine, comes from the diet or de novo synthesis in tissues. Excellent sources of dietary choline are foods that contain membranes, such as eggs and liver. The recommended daily intake for choline is 550 mg/day for men and 425 mg/day for women [28]. Choline exists in foods as free choline or choline esters, from which choline is freed by pancreatic enzymes. These choline esters include phosphocholine, glycerophosphocholine, phosphatidylcholine (PtdCho), and sphingomyelin [26]. Choline is absorbed in the small intestine. Free choline enters the portal circulation and is mostly taken up by the liver [29], whereas lipid-soluble PtdCho and sphingomyelin enter via lymph and bypass the liver. Therefore, different forms of choline may have different bioavailability [30]. In addition, choline can be formed endogenously (mainly in the liver) by the enzyme phosphatidylethanolamine-n-methyltransferase (PEMT, EC ). PEMT catalyzes the conversion of phosphatidylethanolamine (PtdEtn) to PtdCho using three S- adenosylmethionine (AdoMet) molecules. PtdCho is either incorporated into cell membranes or degraded to regenerate choline through phospholipase D (EC ) [31]. PtdCho serves as the reservoir for choline, accounting for 95% of the total choline pool in mammalian tissues. The remaining 5% includes choline species such as choline, phosphocholine, glycerophosphocholine, cytidine 5-diphosphocholine, and acetylcholine [27, 32]. Choline is a water-soluble nutrient that is often grouped with the Vitamin B complex. However, because it is not catalytic in function and is used as a substrate, it is not truly a vitamin. Choline is crucial for the normal function of all cells [26]. As mentioned above, choline can be converted to betaine, the carrier of methyl groups. Choline is used to form the neurotransmitter acetylcholine, the main mediator of the parasympathetic nervous system. 8
26 Choline is needed for membrane phospholipid formation. Choline enters the CDP-choline (Kennedy) pathway, forming phosphocholine and ultimately PtdCho (Figure 2.3 & 2.4), which accounts for over 50% of the phospholipids in mammalian membranes. Thereby, choline ensures the structural integrity and the signaling function of cell membranes [26, 33]. PtdCho is involved in the assembly and the secretion of the very low density lipoproteins (VLDLs), which export fat from the liver to circulation [26]. Choline deficient humans develop fatty liver [27] due to the lack of PtdCho to export triacylglycerol from the liver [34]. Choline deficiency in humans is also associated with liver damage [27], muscle damage [35], lymphocyte DNA damage and apoptosis [36] and elevated plasma Hcy after a methionine load [37]. As mentioned before, PtdCho can also be formed by the action of PEMT from PtdEtn in three steps using AdoMet molecules as the methyl donors [38]. The PEMT pathway generates approximately 30% of the PtdCho in the liver, while the CDP-choline pathway generates the other 70% [39]. Mice that lack the Pemt gene develop fatty liver and severe liver damage, and die after 3 days when fed a choline-deficient diet; choline supplementation prevents this [40]. Pemt -/- mice have lower choline pools in the liver despite being fed sufficient or supplemental choline, suggesting that choline production by PEMT in the liver is a significant source of choline relative to dietary choline [41]. AdoMet, the methyl donor required for PEMT action, is a product of BHMT (as discussed below). BHMT could potentially affect PtdCho synthesis via both CDP-Choline and PEMT pathways. 9
27 2.2.2 BHMT and Homocysteine and One-Carbon Metabolism Homocysteine is a thiol-containing amino acid that is potentially harmful. Humans who have plasma total homocysteine (thcy) of 10 to 100 µmol/l are considered to be moderately hyperhomocysteinemic, while thcy >100 µmol/l is considered to be severe hyperhomocysteinemic [42]. Elevation of thcy is associated with cardiovascular disease, neural tube defects, renal insufficiency, Alzheimer s, and cognitive impairment in the elderly [43]. Moderate hyperhomocysteinemia (HHcy) is common in humans. It is detected in 10-20% of the general population as a result of genetic or non-genetic factors (such as diet, drugs, and impaired renal function) [43]. It is detected in up to 20-40% of patients with cardiovascular complications [42]. Hcy is metabolized by both transsulfuration and transmethylation processes. In the transsulfuration pathway, Hcy forms cystathionine and then cysteine in reactions catalyzed by the enzymes cystathionine-β-synthase (CBS, EC ) and cystathionine-γ-lyase (CγL, EC ), respectively (Figure 2.4). Both enzymes require vitamin B 6. Cystathionine-βsynthase also requires AdoMet as the allosteric activator. Cysteine is the precursor to the osmolyte taurine and the antioxidant glutathione. In the transmethylation pathway, Hcy is remethylated to methionine by three reactions. BHMT and BHMT2 remethylate Hcy using betaine and S-methylmethionine as the methyl donor respectively. Methionine synthase (MS, EC ) catalyzes the other reaction using methyl-tetrahydrofolate (MTHF) as the methyl donor. MTHF is supplied by methyl-tetrahydrofolate reductase (MTHFR, EC ) [44]. Methionine synthase also requires vitamin B 12 as a cofactor. BHMT processes an estimated 50% of the Hcy methylated capacity in an in vitro model of rat liver [45]. 10
28 Figure 2.4 Homocysteine metabolism. Enzymes that catalyze the reactions: (1) methionine adenosyltransferase (MAT); (2) different methyltransferases, particularly glycine N- methyltransferase (GNMT); (3) SAH hydrolase (SAHH); (4) methionine synthase (MS); (5) betaine-homocysteine methyltransferase (BHMT); (5.2) betaine-homocysteine methyltransferase 2 (BHMT2); (6) cystathionine β-synthase (CBS); (7) cystathionase; (8) methylene-thf synthase (methyl-thf); (9) methyl-thf reductase (MTHFR); (10) thymidine synthase; (12) choline dehydrogenase (CHDH) and betaine aldehyde dehydrogenase (BADH) ; (13) thiolactone synthase; (14) adenosine kinase. Abbreviations: SAMe, S-adenosylmethionine; MTA, methylthioadenosine; SAH, S-adenosylhomocysteine; GSH, glutathionine; THF, tetrahydrofolate; methylene-thf, 5,10-methylene-tetrahydrofolate; methyl-thf, 5-methyl-tetrahydrofolate; dtmp, deoxythymidine monophosphate; DHF, dihydrofolate. Figure from Mato, J. Annu. Rev. Nutr. 2008; 28,
29 Methionine, coming from either diet or the actions of MS and BHMTs, is the precursor of AdoMet. AdoMet is the principal biological methyl donor required for various cellular events, including the methylation of DNA, histones, phospholipids, biogenic amines, and other proteins. AdoMet is required for the synthesis of methylglycine from glycine by glycine N-methyltransferase (GNMT); for the formation of PtdCho from PtdEtn by PEMT; for the synthesis of cysteine and ultimately glutathione by the transsulfuration pathway; and many other methylation reactions (Figure 2.3 & 2.4). S-adenosylhomocysteine (AdoHcy) is formed after AdoMet donates its methyl group to diverse biological acceptors. AdoHcy then is hydrolyzed to form Hcy and adenosine by a reaction catalyzed by S-adenosylhomocysteine hydrolase (SAHH, EC ) [46]. This reaction is reversible, but it favors the synthesis of AdoHcy, a potent inhibitor of many methylation reactions [46]. The ratio between AdoMet and AdoHcy (AdoMet:AdoHcy) estimates the methylation potential, as AdoMet is the universal methyl donor, while AdoHcy is an inhibitor for many known methyltransferases. Several pathways are evolutionarily conserved to maintain a normal level of Hcy and an adequate supply of AdoMet, suggesting the significance of these compounds. Animal models of HHcy have been produced either through dietary modifications (by limiting dietary choline, vitamin B 6, vitamin B 12, or methyl-folate) or through genetic approaches (Cbs -/-, Mthfr -/-, Ms -/- mouse models) [42]. Perturbations of these pathways have resulted in elevated plasma thcy levels [47], in reduced methylation potential (AdoMet:AdoHcy) [48], and in compensatory changes of other Hcy pathways [49, 50]. During choline and betaine deprivation, more 5-methyltetrahydrofolate is used for Hcy remethylation. Conversely, during folate deficiency, methyl groups from choline and betaine are used for Hcy 12
30 remethylation, thereby increasing choline and betaine requirements. BHMT interrelates with the transsulfuration and methylfolate pathways at the removal of Hcy. The Bhmt -/- mouse model was not created until this work was done. The lack of attention to BHMT s role in Hcy removal is probably due to the assumption that the alternative pathways could replace BHMT. 2.3 Physiological Implications of Betaine and BHMT Human Studies Reduced choline or methylation potential levels are associated with increased risk of cancer (as discussed below), while elevated Hcy levels are associated with increased risks of cardiovascular disease and neural tube defects. BHMT is the enzyme that integrates these pathways. Thus, epidemiological studies have focused on investigating the associations of human BHMT mutations with these diseases. Common single nucleotide polymorphisms (SNPs) in the BHMT gene in humans have been identified. These SNPs can alter BHMT protein level and enzyme activity [12]. The BHMT SNP rs (c.716g>a) is common; 41% of the NC population have 1 variant allele, and 8% have 2 alleles [51]. This SNP has been associated with increased risk [52], decreased risk [53], and no change in risk [54] of having babies with neural tube defects. Humans with the BHMT SNP rs have reduced risk [55], or no change in risk [56, 57] of developing cardiovascular disease. The Long Island Breast Cancer Study Project (LIBSP) finds that patients with this SNP have no change in risk of breast cancer [58], but have reduced breast cancer-specific mortality [59]. The epidemiological evidence regarding the functional effects of BHMT SNPs remains controversial. 13
31 While some epidemiological studies focus on genetic interactions in the etiology of diseases, others focus on the nutrients in diets. Many studies examine the effect of dietary betaine in reducing plasma thcy that could potentially contribute to vascular complications. Fifty percent of patients with classical genetic homocystinuria have an adverse vascular event before they reach 30 years of age [60]. A study with 15 patients who are supplemented with 6-9 g betaine per day (average betaine intakes range from mg/day) shows a 74% reduction in plasma thcy levels and no vascular events over the course of a total of 258 studied patient years [61]. Other studies using patients with inborn errors of Hcy metabolism, particularly errors in CBS and MTHFR, have reaffirmed this beneficial effect of betaine supplementation [62-65]. It is pertinent to note that betaine therapy could result in hypermethioninemia, causing cerebral edema in some patients [66, 67]. Aside from treating patients with genetic homocystinuria, betaine also reduces plasma thcy in the general population with mild hyperhomocysteinemia. One study demonstrates that a dose of 6g betaine per day reduces plasma thcy level by approximately 20% in normal adults [68]. Another study demonstrates that 95% of patients with premature peripheral or cerebral occlusive arterial disease respond to betaine (6g/day) with a normal level of thcy [69]. While many studies have shown the effectiveness of betaine in reducing plasma thcy levels [68, 70-72], it remains a question whether betaine supplementation can serve as a preventative regimen for vascular dysfunction. Short or long-term betaine supplementation do not improve endothelial function in healthy subjects despite the reduced thcy levels [72, 73]. A study on 3,000 healthy Greek men and women demonstrates that individuals with high intake of choline and betaine have low plasma levels of inflammatory markers, such as C reactive protein, interleukin-6, and tumor necrosis factor-α, suggesting a protective effect of choline 14
32 and betaine against cardiovascular disease [74]. However, two large prospective studies, Dutch PROSPECT-EPIC cohort and Atherosclerosis Risk in Communities (ARIC) study, find no association between the intake of choline and betaine and cardiovascular disease [75, 76]. The protective role of betaine against vascular dysfunction requires future study. In addition to regulating Hcy levels, betaine appears to modify plasma lipid profiles, which further contributes to its potential role in altering cardiovascular risk. Recently, two independent cross-sectional studies reveal that increased plasma betaine is correlated with reduced plasma triacylglycerol and non-high density lipoprotein (non-hdl) cholesterol, which are the preferred plasma lipid profiles [77, 78]. In addition, in both studies, increased plasma betaine is associated with lower BMI in the study populations, suggesting a potential role of betaine in altering adiposity (as discussed below). In contrast, some studies argue that betaine supplementation increases plasma low density lipoprotein (LDL) cholesterol and triacylglycerol concentrations [70, 72, 79], effects that may counterbalance its Hcy lowering effects. However, the rise in LDL concentration may be an artifact of betaine increasing VLDL and triacylglycerol excretion from fatty liver to plasma, which is not an adverse outcome [80]. Nonalcoholic fatty liver disease (NAFLD) is the most common liver disease and is associated with components of the metabolic syndrome [81]. Betaine treatment of NAFLD has been evaluated in three human studies. When treated with betaine, patients with nonalcoholic steatohepatitis have improved liver function, including reduced hepatic steatosis and attenuated hepatic or plasma aminotransferases [82-84]. Information on the relationship 15
33 of dietary betaine and cancer risk in humans is scarce, because food composition data have not been available until recently. The Long Island Breast Cancer Study Project finds that high choline consumption reduces breast cancer risk [58], and high choline and betaine consumption reduces breast cancer mortality [59]. However, two later reports find no association between betaine and choline intake and cancer, either breast cancer [85] or ovarian cancer [86]. There are no data on the effect of betaine supplementation on cancer risk. The evidence from human studies regarding the functional effects of BHMT mutations and dietary betaine intake in diseases remains controversial and warrants more studies. Nevertheless, these data suggest the importance of betaine/bhmt in the etiology and as a potential treatment of these diseases. 2.4 Physiological Implications of Betaine and BHMT Animal Studies Betaine is known for ameliorating the adverse effects of both nonalcoholic and alcoholic induced fatty liver. Fatty liver may progress to severe liver damage such as fibrosis and cirrhosis [87]. Alcoholic fatty liver is induced by excessive alcohol intake and is often associated with disturbed Hcy metabolism [88-90]. Betaine supplementation mitigates the adverse effects of alcoholic fatty liver, including reducing steatosis and maintaining Hcy and AdoMet levels [91-94]. Transgenic mice overexpressing human BHMT are resistant to alcohol-induced hepatic hyperhomocysteinemia and steatosis [95]. On the other hand, nonalcoholic fatty liver is commonly associated with obesity [96], insulin resistance, and diabetes [97]. Mice fed a high fat diet develop nonalcoholic fatty liver and insulin resistance, while betaine supplementation ameliorates these outcomes [98, 99]. 16
34 The mechanisms by which betaine/bhmt improves hepatic steatosis are not thoroughly understood. Several mechanisms have been proposed. Betaine supplementation and its consequent BHMT induction generate AdoMet. AdoMet supplies the methyl groups needed for the synthesis of PtdCho from PtdEtn by PEMT. PtdCho enables the generation of VLDL, needed for secreting fat from the liver, thus ameliorating hepatic steatosis [100]. In addition, cultured hepatocytes overexpressing Bhmt, and rat livers following an in vivo induction of Bhmt, have increased apolipoprotein B expression [ ]. These data suggest that betaine/bhmt might have multiple beneficial effects in lipoprotein synthesis. Others propose a role of betaine in reducing cellular stress [93, 104]. The antioxidant glutathione comes from cysteine, the generation of which requires AdoMet (Figure 2.4). Glutathione scavenges free radicals and is particularly important in mitochondria. The mitochondria are the primary intracellular site of oxygen consumption and the major source of reactive oxygen species (ROS) [105]. Glutathione maintains the redox balance and protects cells from oxidative stress [105]. One proposed mechanism is that betaine/bhmt restores AdoMet and glutathione concentrations, attenuates oxidative stress, and prevents further liver damage [104, 106, 107]. A growing body of evidence demonstrates that high Hcy induces ER stress [93, 95, 101, 108]. ER is an essential organelle, which provides a specialized environment for the production and post-translational modifications of secretory and membrane proteins. One proposed mechanism suggests that Hcy can be wrongly incorporated to proteins, causing protein misfolding and unfolding in the ER [93, 95, 101, 108]. An accumulation of these wrongly folded proteins then induces ER stress. ER stress activates Srebp1c (sterol regulatory element binding protein 1c), an ER bound transcription factor that induces lipid 17
35 synthesis. Activation of Srebp1c further contributes to the development of fatty liver [108]. Betaine/BHMT system may protect liver through reducing HHcy induced ER stress. Hepatocytes overexpressing Bhmt and transgenic mice expressing human BHMT were resistant to HHcy induced ER stress and cell death [95, 101]. In addition to reducing hepatic steatosis and preventing further liver damage, betaine/bhmt has a potential role in enhancing insulin sensitivity. Betaine supplementation alleviates insulin resistance and reduces hepatic steatosis in a high-fat-fed mouse model [99]. When supplemented with betaine, epidermal fat pad and adipocytes isolated from high-fatfed mice have increased activation (phosphorylation) of protein kinase B (PKB/Akt) and extracellular signal-regulated kinases (ERK) that are normally suppressed by high-fat-diet [99]. PKB/Akt and ERK are two principal downstream kinases in the insulin-signaling pathway. This finding suggests that betaine could ameliorate fatty liver by improving insulin function in adipose tissue. Another study demonstrates that betaine treatment reverses the inhibition of hepatic insulin signaling in high-fat-fed mice and insulin-resistant HepG2 cells [98]. Betaine supplementation increases the activation of insulin receptor substrate 1 (IRS1), leading to enhanced glycogen synthesis and reduced gluconeogenesis. Taken together, these studies suggest roles for betaine/bhmt in alleviating fatty liver, fatty liver related cellular injury and insulin resistance. An alternative way to study gene function is by studying the engineered knockout (deletion) mouse models. A Bhmt knockout mouse model was not available until now. Previously, a potent inhibitor of BHMT, S-(δ-carboxybutyl)-DL-homocysteine (CBHcy), was 18
36 administered intraperitoneally to mice [109] or fed to rats [110] to study the physiological implications of BHMT deficiency. Administration of CBHcy causes an elevation of plasma thcy concentration and a reduction in hepatic AdoMet:AdoHcy ratio, reaffirming the role of BHMT in regulating Hcy and methyl donors. In these studies, inhibition of Bhmt does not affect markers of hepatic health such as fatty liver and plasma alanine transaminase. The lack of effects is probably due to a short term or an incomplete inhibition of BHMT. 2.5 One-Carbon Metabolism and Cancer In 2008, the American Cancer Society ( projected that about 780,300 people worldwide would have new liver cancer cases, and about 695,500 people would die from liver cancer. In 2011, an estimated 26,190 new cases of liver cancer and 19,590 liver cancer deaths are expected in the United States alone. Hepatocellular carcinoma (HCC) accounts for >80% of liver cancer cases. Liver cancer is among the most lethal cancers (fiveyear survival rates under 14%), making it the fifth most frequent cause of cancer death in American men and the ninth in American women [111]. The incidence rates are highest among Asian Americans/Pacific Islanders and Hispanics [111]. Mouse models for HCC are used to understand the molecular mechanisms underlying the pathogenesis of HCC. These mouse models are often genetically modified or cancers are induced by agents such as diethylnitrosamine, aflatoxin, and phenobarbital. Choline is the only nutritional deficiency that causes liver cancer without any known carcinogen [112]. In rodents, choline deficiency results in a higher incidence of spontaneous HCC [112]. Cancer 19
37 initiates with DNA damage within cells. Cancer ensues when these cells fail to repair and to recognize the DNA damage, and fail to die by apoptosis. Several mechanisms have been suggested for choline deficiency s carcinogenic effects. One proposed mechanism is based on the observation that rats fed a choline-deficient diet have increased lipid peroxidation in the liver [113]. Lipid peroxidation refers to the oxidative degradation of lipids, producing free radicals that can modify DNA in the nucleus and induce carcinogenesis. Another proposed mechanism is that choline deficiency perturbs signaling transduction. Large amounts of PtdCho are synthesized from choline and diacylglycerol (DAG) in cells. In cased of choline deficiency, PtdCho synthesis is diminished and DAG accumulates. DAG activates protein kinase C signaling cascades, resulting in altered cell proliferation signals and cell apoptosis and finally in carcinogenesis [114]. Methyl deficiency may also mediate the mechanisms that underlie the etiology of cancers. As discussed previously, AdoMet is required for the synthesis of the antioxidant glutathione, which attenuates oxidative stress by scavenging free radicals, protecting cells from DNA damage. Methyl deficiency may also affect DNA via epigenetic modification, such as DNA and histone methylation. DNA methylation predominantly involves the covalent addition of a methyl group to the 5 position of cytosine that precedes a guanosine (CpG) in the DNA sequence. This is referred to as an epigenetic modification since it does not change the coding sequence of the DNA. When DNA methylation occurs in the promoter regions, the expression of the associated gene is altered [115, 116]. Methylated CpG prevents the binding of the transcription factors, while unmethylated CpG allows the binding of the transcription factors to the gene [115, 116]. These actions alter gene expression based on the 20
38 roles of the transcription factors. For example, if the binding of the transcription factor is associated with inducing gene expression, then DNA methylation will result in gene silencing, and vice versa. Although there are exceptions, increased DNA methylation is usually associated with gene silencing, while decreased methylation usually associates with increased gene expression [117]. AdoMet is required for DNA methylation, while AdoHcy inhibits the methyltransferases. Methyl deficiency may alter epigenetic machinery by hypomethylating and paradoxically hypermethylating specific genes (e.g. tumor suppressor genes). Consequently, the expression of tumor suppressor genes responsible for DNA repair (BRCA1, hmlh1), cell cycle regulation (p15, p16), carcinogenesis metabolism (GSTP1), hormonal response (RARβ2), apoptosis (DAPK, APAF-1), cell adherence (CDH1, CDH3) [ ] are silenced, leading to tumor development. Two mouse models with disturbed methyl group metabolism demonstrate the importance of methyl groups in cancer etiology. Methionine adenosyltranferase 1A knockout mouse model (cannot make AdoMet from methionine) has a persistent decrease in AdoMet concentration in the liver, leading to the development of HCC [121]. Glycine N-methyltransferase (GNMT) catabolizes AdoMet to AdoHcy, hence regulates the ratio of AdoMet/AdoHcy. The GNMT knockout mouse model has liver AdoHcy concentration 71 times higher than that of controls. These mice have steatosis and liver fibrosis after 3 months [122], and develope multifocal HCC at 8 months [123]. Together, these data demonstrate the importance of DNA methylation in cancer etiology. 21
39 2.6 Energy Metabolism and Insulin Sensitivity The pathogenesis of obesity is complex, involving multiple organs and endocrine systems. Liver, white adipose tissue and brown adipose tissue are the key regulators of energy homeostasis. During glucose abundance (feeding), both adipose and liver can utilize glucose to synthesize lipid in the form of triacylglycerol [124]. Glucose provides glycerol phosphate, the backbone for triacylglycerol synthesis [124]. Excess glucose also forms acetyl CoA for de novo fatty acid synthesis [124]. Liver does not usually store lipid. Therefore, the synthesized TAG is packaged into VLDL and transported from the liver to circulation, where FA are taken up and stored in adipose tissue [87]. Liver can also store glucose as glycogen. White adipose tissue serves as an energy reservoir [125, 126]. It stores fuel in the form of triacylglycerol during energy excess and breaks down triacylglycerol and releases glycerol and fatty acids during energy deprivation [125, 126]. Glycerol and fatty acids from lipolysis then serve as fuels for organs. Fatty acids can be catabolized by β oxidation in the mitochondria, a step in which carnitine is required. White adipose tissue also acts as an endocrine organ; it may regulate glucose balance by secreting glucose regulating factors such as leptin, adiponectin, and tumor necrosis factor-α (TNF-α) [125, 126]. Brown adipose tissue functions to regulate thermogenesis, providing heat to mammals during cold exposure to maintain body temperature. Different from white adipose tissue, brown adipose tissue contains multi-locular lipid droplets, a high abundance of mitochondria, and a large amount of uncoupling protein 1 (UCP1) [127]. UCP1 allows the hydrogen ions to pump through the electron transport chain and release as heat instead of ATP [127]. Finally, the brain can sense nutrient availability and respond by altering food intake and stimulating the release of factors that regulate energy metabolism [128]. Taken together, homeostasis of energy stores is 22
40 regulated by mechanisms including modulation of metabolic rate and thermogenesis, regulation of metabolite fluxes among various organs, and modulation of fuel synthesis and usage within adipose tissue. Alteration in fat stores in organs is associated with altered insulin sensitivity and glucose balance [126]. Insulin is a peptide hormone that is secreted by pancreatic β cells in response to elevated glucose levels after feeding [124, 129]. Insulin regulates blood glucose concentration via increasing glucose uptake by adipose tissue and muscle and inhibiting hepatic glucose production [124, 129]. Insulin also promotes the storage of glucose as glycogen in liver, and as triacylglycerol in adipose tissue. Insulin binds to the insulin receptor on cells. The receptor s tyrosine kinase activity autophosphorylates and activates the receptor, leading to recruitment and activation of insulin receptor substrate proteins (IRS) [124, 129]. IRS proteins initiate signaling cascades that mediate a variety of cellular processes, including glycogen synthesis and gluconeogenesis. IRS activates PKB/Akt (protein kinase B) via phosphorylation. PKB/Akt then inactivates (phosphorylates) GSK3β (glycogen synthase kinase 3β), which functions to inhibit glycogen synthase activity [124, 129]. Therefore, insulin s inhibition of GSK3β leads to enhanced glycogen synthesis [124, 129]. PKB/Akt also inactivates (phosphorylates) FoxO1 (Forkhead box protein O1), which normally induces Pepck (phosphoenolpyruvate carboxykinase), a gene involved in gluconeogenesis [124, 129]. Insulin reverses this induction, leading to suppressed gluconeogenesis [124, 129]. In adipose tissue, insulin enhances glucose uptake by stimulating glucose transporter 4 (GLUT4) and induces the expression of several lipogenic enzymes, leading to increased fatty acid and triacylglycerol synthesis [124, 129]. Insulin also inhibits lipolysis in adipocytes through the 23
41 inhibition of hormone sensitive lipase [124, 129]. Alterations in insulin receptor concentrations, IRS proteins concentrations, the translocation of glucose transporters, and the activities of various kinases and intracellular enzymes all contribute to insulin sensitivity and adiposity. Several hormones and growth factors have been identified as important regulators of energy homeostasis and glucose metabolism. In this dissertation, we observed changes in the thyroid hormone, bile acids and fibroblast growth factor 21 (FGF21), all of which are associated with increased energy expenditure. The thyroid hormone has long been accepted to have a major impact on the basal metabolic rate [130]. The thyroid gland secretes two forms of thyroid hormone - the predominant but inactive form, thyroxine (T4), and the active form, triiodothyronine (T3). Thyroid hormone binds to its receptors. There are two forms of thyroid hormone receptor (TR) TRα1 is typically found in adipose tissue, muscle, brain and heart tissues, while TRß is in liver and kidney tissues [131]. Within the cell, the inactive prohormone T4 is converted to T3 by the enzyme deiodinase II, which is induced by bile acid [132, 133]. In adipose tissue, thyroid hormone functions to stimulate thermogenesis, lipolysis and lipogenesis simultaneously [134]. With these processes, thyroid hormone results in increased oxygen consumption and metabolic rate. Thyroid hormone also regulates glucose metabolism via enhancing glucose transporter GLUT4 expression [135]. In the liver, thyroid hormone induces HMG-CoA reductase, the rate-limiting enzyme for de novo cholesterol synthesis [130]. This results in an enhanced synthesis of cholesterol in hyperthyroidism. However, there is an inverse relationship between thyroid hormone and serum cholesterol [136] because thyroid hormone may simultaneously affect the synthesis and degradation of 24
42 LDL cholesterol [137]. Thyroid hormone also induces cholesterol 7α hydroxylase (CYP7A1), the rate-limiting enzyme in bile-acid synthesis from cholesterol [138, 139]. This results in an enhanced synthesis of bile acids from cholesterol in hyperthyroidism. Taken together, thyroid hormone induces cholesterol turnover and bile acids synthesis. A novel concept indicating a signaling role of bile acids (BAs) in the control of energy metabolism has emerged [132, 133]. CYP7A1 catalyzes the conversion of cholesterol to 7α hydroxycholesterol, which is subsequently converted to bile acids. Cholic acid and chenodeoxycholic acid are the primary bile acids and often conjugate with taurine (as taurocholate or taurochenodeoxycholate) or glycine (as glycocholate or glycochenodeoxycholate) forming bile salts. Mice fed a cholic acid supplemented diet have increased energy expenditure, and are protected from diet-induced obesity and insulin resistance [133]. On the contrary, mice that have reduced bile acids have decreased energy expenditure and increased body fat [132]. Although debatable, it is suggested that bile acids increase energy expenditure via inducing deiodinase 2, the enzyme that converts T4 to T3 within cells. It is interesting to note the interactions between thyroid hormone and bile acids. Thyroid hormone induces the synthesis of bile acids from cholesterol in the liver [138, 139]. In return, bile acids induce energy metabolism, perhaps through the activation of thyroid hormone [132, 133]. Fibroblast growth factor 21 (FGF21) is a member of the FGF superfamily that is synthesized predominantly in the liver and released into circulation [140]. FGF21 plays a critical role in energy metabolism. In mice, hepatic Fgf21 expression is induced by fasting 25
43 and is regulated by Pparα (peroxisome proliferator activated receptor α), Pparγ, and ChREBP (carbohydrate response element binding protein) [ ]. FGF21 increases glucose uptake [142, 144] and decreases intracellular TAG content in adipocytes [144]; it lowers plasma glucose and TAG when administered to diabetic mice [142]; and it increases energy expenditure and improves insulin sensitivity in diet-induced obese mice [145, 146]. Like bile acids, FGF21 appears to interact with thyroid hormone. Thyroid hormone treatment induces hepatic Fgf21 expression in a Pparα dependent manner [147]. FGF21 also appears to interact with bile acids. The evidence comes from recent studies carried out in patients with nonalcoholic steatohepatitis (NASH). These studies demonstrate that plasma bile acids and FGF21 concentrations are elevated in patients with NASH [148, 149]. The authors suggest that bile acids induce hepatic Pparα, which activates Fgf21, resulting in increased hepatic fatty acid oxidation in NASH patients [148, 149]. FGF21, bile acids and thyroid hormone all induce similar metabolic changes such as energy expenditure and glucose uptake. All of these molecules are altered in the Bhmt -/- mice. The interactions between these molecules and Bhmt deficiency remain to be elucidated. 2.7 One-Carbon Metabolism, Energy Metabolism, and Adiposity There has been no direct evidence that BHMT is involved in energy metabolism. However, there is accumulating data that BHMT s substrate betaine and betaine s precursor choline may be involved in energy metabolism. Diets deficient in choline alone, or both choline and methionine, have been used to investigate aspects of metabolic syndrome, particularly non-alcoholic fatty liver and insulin resistance. Mice fed a methionine and choline deficient (MCDD) diet develop hepatic steatosis due to impaired PtdCho 26
44 biosynthesis. Compared to controls, MCDD-fed mice have a 37% increase in metabolic rate, leading to a 26% loss of body weight [150]. Peripheral insulin action has been reported to be normal [151] or improved [152, 153] in MCDD-fed rodents. Mice fed a high fat diet without choline (but with methionine) have better insulin sensitivity and improved glucose tolerance compared to high-fat-choline-fed mice [154]. Mice with the Pemt (making PtdCho from PtdEtn) gene deleted have normal metabolic parameters on a regular chow diet compared to wildtype controls [155]. However, when fed a high fat diet, they have increased energy expenditure, accumulate less body fat, and have increased glucose sensitivity [155]. The lack of weight gain in Pemt -/- mice disappears when mice are fed a diet supplemented with choline. These observations suggest a potential role of choline deficiency in modulating energy metabolism and insulin sensitivity. Betaine is widely discussed as a carcass modifier due to its lipotropic and growthpromoting effects, generating leaner meat [156]. Betaine was originally introduced to the feed industry as a substitute for methionine and choline in diets for livestock. This was done based on economic interest and the possibility that betaine may enhance methionine and choline availability. Numerous investigations have been carried out to evaluate the effectiveness of dietary betaine supplementation on livestock (Table 2.2) [ ]. In poultry, betaine supplementation resultes in reduced abdominal fat [ ]. In pigs, betaine supplementation reduces carcass fat by 10-18% and increases lean mass by 4-8% [ ]. The reduction of total carcass fat content is reflected by reduction in backfat thickness in pigs [ ]. 27
45 Information on the mechanisms of how betaine reduces the fat content of animals is scarce, though some mechanisms have been proposed. Betaine supplementation may increase the availability of methionine, perhaps explaining the increased protein production [156]. Betaine may enhance the synthesis of carnitine (a methylated compound formed from methionine and lysine), which is required for transporting long-chain fatty acids into mitochondria, where fatty acid oxidation takes place. Carnitine in liver and muscle increases from 9% to 53% in betaine supplemented poultry and pigs [156, 175]. However, there is no evidence that increased carnitine concentration translates into increased fatty acid oxidation. One study shows that betaine has no significant impact on β-oxidation in either in vivo or in vitro system in pigs [182]. Other studies suggest that betaine supplementation reduces body fat via reducing lipid synthesis and/or enhancing lipid breakdown. Betaine supplementation decreases the activities and the gene expressions of fatty acid synthesis, acetyl-coa carboxylase, and malic enzyme (enzymes involved in lipogenesis) in the subcutaneous adipose tissue in pigs [183, 184]. In addition, betaine supplementation increases hormone sensitive lipase activity (enzyme involved in lipolysis) in broilers [185] and pigs [183]. In the agouti mouse model, the transgenerational amplification of obesity is prevented when mice are fed a diet high in betaine and choline, suggesting that epigenetic methylation is involved [186]. Most studies show interactions of betaine with growth-regulating and metabolic factors (Table 2.3) [172, 175, 179, 181, ]. Betaine supplementation elevates the plasma growth hormone (GH) level between 46 to 102%, and the insulin-like growth factor 1 (IGF-1) level between 39 to 75 % in pigs and poultry [156]. The dietary supplementation of betaine also increases serum levels of triiodothyronine (T3) and thyroxine (T4) in pigs and poultry [156]. The direct interactions of betaine with these 28
46 hormones are not fully understood. However, there is evidence that betaine is linked to thyroid hormone (T3 and T4) secretion, since thyroidectomy induces an increase in the activity of BHMT [192]. Betaine supplementation has been advertised to humans due to its potential role in reducing obesity. However, its lipotropic property has not been demonstrated in humans. A 12-week study of betaine supplementation finds no effect on body fat and resting energy expenditure in obese adult subjects [70]. Alternatively, in a population-based study, plasma betaine is inversely related to the components of metabolic syndrome (BMI, % body fat, waist circumference, glucose, non-hdl cholesterol) and positively related to HDL cholesterol [77, 193]. These data suggest that BHMT and its metabolites, such as choline and betaine, may have a role in the regulation of energy metabolism and adiposity. 29
47 Table 2.2 Effect of betaine on carcass composition in pigs and poultry 30 Table from Eklund M. Nutrition Research Reviews 2005; 18,
48 Table 2.3 Effect of betaine on hormone levels in pigs and poultry 31 Table from Eklund M. Nutrition Research Reviews 2005; 18, 31-48
49 CHAPTER III THE ROLE OF BHMT IN ONE-CARBON METABOLISM AND LIVER HEALTH DELETION OF BETAINE-HOMOCYSTEINE S-METHYLTRANSFERASE IN MICE PERTURBS CHOLINE AND 1-CARBON METABOLISM, RESULTING IN FATTY LIVER AND HEPATOCELLULAR CARCINOMA 1 Ya-Wen Teng, Mihai G. Mehedint, Timothy A. Garrow, and Steven H. Zeisel 3.1 ABSTRACT Betaine-homocysteine S-methyltransferase (BHMT) uses betaine to catalyze the conversion of homocysteine (Hcy) to methionine. There are common genetic polymorphisms in the BHMT gene in humans that can alter its enzymatic activity. We generated the first Bhmt -/- mouse to model the functional effects of mutations that result in reduced BHMT activity. 1 Teng, Y., Mehedint, M.G., Garrow, T.A., and Zeisel, S.H. (2011). Deletion of Murine Betaine-Homocysteine S-Methyltransferase in Mice Perturbs Choline and 1-Carbon Metabolism, Resulting in Fatty Liver and Hepatocellular Carcinoma. JBC. 286(42):
50 Deletion of Bhmt resulted in a 6-fold increase (p<0.01) in hepatic and an 8-fold increase (p<0.01) in plasma total Hcy concentrations. Deletion of Bhmt resulted in a 43% reduction in hepatic S-adenosylmethionine (AdoMet) (p<0.01) and a 3-fold increase in hepatic S- adenosylhomocysteine (AdoHcy) (p<0.01) concentrations, resulting in a 75% reduction in methylation potential (AdoMet:AdoHcy) (p<0.01). Bhmt -/- mice accumulated betaine in most tissues, including a 21-fold increase in the liver concentration compared to wildtype (WT) (p<0.01). These mice had lower concentrations of choline, phosphocholine, glycerophosphocholine, phosphatidylcholine and sphingomyelin in several tissues. At 5 weeks of age, Bhmt -/- mice had 36% lower total hepatic phospholipid concentrations and a 6- fold increase in hepatic triacyglycerol concentrations compared to WT (p<0.01), which was due to a decrease in the secretion of very low density lipoproteins. At 1 year of age, 64% of Bhmt -/- mice had visible hepatic tumors. Histopathological analysis revealed that Bhmt -/- mice developed hepatocellular carcinoma (HCC) or carcinoma precursors. These results indicate that BHMT has an important role in Hcy, choline and one-carbon homeostasis. A lack of Bhmt also affects susceptibility to fatty liver and HCC. We suggest that functional polymorphisms in BHMT that significantly reduce activity may have similar effects in humans. 33
51 3.2 INTRODUCTION Betaine-homocysteine S-methyltransferase (BHMT) is a zinc dependent cytosolic enzyme that catalyzes the transfer of a methyl group from betaine to homocysteine (Hcy) forming dimethylglycine (DMG) and methionine (Met). Humans have common single nucleotide polymorphisms (SNPs) in the BHMT gene that alter BHMT enzyme activity and function [12]. A common BHMT SNP rs (41% of NC population has 1 variant allele, and 8% have 2 alleles [51]) was associated with increased risk for having babies with neural tube defects (NTDs) [53], decreased risk for developing cardiovascular disease [55] and reduced risk for breast cancer-specific mortality [59]. The epidemiological evidence suggests the importance of SNPs in the gene. However, the metabolic consequences of having null mutations of BHMT gene have not been thoroughly-investigated. To directly investigate the role of BHMT in vivo, we generated and characterized mice in which the gene encoding Bhmt was deleted (Bhmt -/- ). BHMT activity is found at high levels in the liver and kidney, and low levels in the brain, lenses and other human tissues. In rodents, high levels of BHMT activity are only found in the liver [18]. Betaine, the methyl donor for BHMT, comes from either dietary sources or from oxidation of choline (an irreversible reaction) by choline dehydrogenase (CHDH). Alternatively, choline can be used to form the phospholipid phosphatidylcholine (PtdCho) or the neurotransmitter acetylcholine [194]. The product of BHMT, methionine, is the precursor for S-adenosylmethionine (AdoMet), the major methyl donor for most biological methylations, including DNA and histone methylation, the conversion of glycine 34
52 to methylglycine (catalyzed by glycine methyltransferase (GNMT)), and the methylation of phosphatidylethanolamine (PtdEtn) to form PtdCho (catalyzed by phosphatidylethanolamine- N-methyltransferase (PEMT)). The other substrate for BHMT is Hcy, a thiol-containing amino acid, which, when elevated in plasma, is associated with cardiovascular diseases, pregnancy complications, renal insufficiency and cognitive impairment [43]. Hcy is converted to methionine by BHMT or by methionine synthase (MS), the latter of which uses methyltetrahydrofolate (methylthf) as the methyl donor (supplied by methylenetetrahydrofolate reductase (MTHFR)) [195]. Alternatively, Hcy is removed by the trans-sulfuration pathway, forming cystathionine and cysteine catalyzed by the enzymes cystathionine-β-synthase (CBS) and cystathionine-γ-lyase (CγL), respectively [195]. Both enzymes require vitamin B 6 ; CBS also requires AdoMet as the allosteric activator [195]. All the above pathways might be perturbed with the deletion of Bhmt. Here, we report on the metabolic phenotype of the first Bhmt knockout mouse created. 35
53 3.3 EXPERIMENTAL PROCEDURES Generation of Bhmt -/- mice - The gene targeting vector was designed to remove exons 6 and 7, the zinc binding domains of the gene (Figure 3.1A). The targeting vector was constructed by placing a MC1-neomycin (Neo) selectable marker flanked by 2 flippase (FLP) recognition target (FRT) sites and 1 locus of X-over P1 (loxp) site ~330 bp downstream of exon 7. A second loxp site was introduced ~240 bp upstream of exon 6. The vector was electroporated into E14Tg2A embryonic stem (ES) cells. Targeted cells were screened by PCR, confirmed by Southern-blot analysis, and injected into blastocysts derived from mouse strain C57Bl/6 to create Bhmt transmitting chimeras. Neo deleted mice were generated by crossing the transmitting chimeras with Flpe deleters (#003800, Jackson Laboratory, Bar Harbor, ME), which expressed Flpe recombinase that recognized FRT sites and deleted the Neo cassette. Bhmt knockout (KO) mice were generated by crossing the Neo deleted mice with Cre deleters (#003724, Jackson Laboratory), which expressed Cre recombinase that recognized loxp sites and deleted exons 6 and 7. Bhmt KO mice were continuously backcrossed to C57Bl/6 mice. Generations F1 to F4 were used in this study. For all experiments, Bhmt +/+, Bhmt +/-, and Bhmt -/- littermates born of Bhmt +/- mating pairs were used to control the mixed genetic background. Mice were genotyped by PCR using TaKaRa Ex Taq DNA polymerase (TaKaRa Bio USA, Madison, WI) and the following primer sequences: Bhmt +/+ forward 5 -GACTTTTAAAGAGTGGTGGTACATACCTTG-3, Bhmt +/+ reverse 5 -TCTCTCTGCAGCCACATCTGAACTTGTCTG-3, Bhmt -/- forward 5 TTAACTCAACATCACAACAACAGATTTCAG-3, Bhmt -/- reverse 5 - TTGTCGACGGATCCATAACTTCGTATAAT-3. PCR conditions were as follows: 94 C 36
54 for 2 min; 40 cycles of 94 C for 30 sec, 64 C for 2 min, and 72 C for 2 min; and 72 C for 6 min. Bhmt +/+ PCR product was 1.6 kb in size, while Bhmt -/- was 545 bp (Figure 3.1B). The animals were kept in a temperature-controlled environment at 24 C and exposed to a 12h light and dark cycle. All animals received AIN-76A pelleted diet with 1.1 g/kg choline chloride (Dyets, Bethlehem, PA). The Institutional Animal Care and Use Committee of the University of North Carolina at Chapel Hill approved all experimental protocols. Reproducibility, viability, body weight, body length, and life span - Pairs of Bhmt +/+, Bhmt +/-, and Bhmt -/- parents were bred to assess their reproductive potential. Sizes, genotype distribution, and gender distribution of litters were recorded. Body weights and lengths (nose to hip, nose to tail) of Bhmt +/+, Bhmt +/-, and Bhmt -/- mice were measured from age 3.5 to 20 weeks old using a scale and a ruler respectively. Eleven Bhmt +/+, and fourteen Bhmt -/- mice were maintained over the course of a year to determine one-year survival rates. Western blot and enzymatic assay - Mice were anesthetized by inhalation of isoflurane (Hospira, Lake Forest, IL). Tissues were harvested, weighted, snap frozen, pulverized under liquid nitrogen and stored at -80 o C until used. Western blot analysis of BHMT was performed in liver homogenate as previously described [196]. For all enzymatic assays, pulverized liver from 5-week-old mice were homogenized in buffer using a motorized tissue homogenizer (Talboys Engineering Corporation, Montrose, PA). BHMT activity was measured as the conversion of [ 14 C]betaine to [ 14 C]methionine and [ 14 C]dimethylglycine as previously described [14]. CHDH activity was measured as the conversion of [ 14 C]choline to [ 14 C]betaine as previously described [197] using high pressure liquid chromatography (HPLC) 37
55 on a Varian ProStar HPLC system (PS-210, Varian Inc., Palo Alto, CA) with a Pecosphere Silica column, 4.6mm x 83 mm (Perkin Elmer, Norwalk, CA) and a Berthold LB506 C-1 radiodetector (Oak Ridge, TN). GNMT activity was measured as the conversion of [ 3 H]AdoMet to [ 3 H]methylglycine using the charcoal absorption method as previously described [198]. PEMT activity was measured as the conversion of [ 3 H]AdoMet to [ 3 H]PtdCho as previously described [199, 200]. Protein concentrations were measured using the Bradford Assay [201]. Choline and homocysteine metabolites - Tissues from 5-week-old animals were harvested as described above. Blood was collected via cardiac puncture, and plasma isolated by centrifugation at 3000 rpm for 5 min at room temperature. The concentrations of choline metabolites were measured by liquid chromatography-electrospray ionization-isotope dilution mass spectrometry (LC ESI IDMS) as previously described [202]. The concentration of AdoMet and S-adenosylhomocysteine (AdoHcy) were measured using the Varian ProStar HPLC system as previously described [203, 204] with an Ultrasphere ODS 5µm C18 column, 4.6mm x 25cm (#235329, Fullerton, CA) and a UV/VIS detector (model 118, Gilson, Middleton, WI). Plasma total Hcy (thcy) and cysteine were measured after derivatizing 50 µl of plasma with 7-fluorobenzofurazan-4-sulfonic acid. The derivatized products were measured as previously described [205] using the Varian ProStar HPLC system with a Microsorb-MV 5µm C18 column, 4.6mm x 25cm (Varian) and a Prostar model 360 fluorescence detector (Varian). Mercaptopropinylglycine (10 µm) was used as an internal standard. Hepatic thcy, cystathionine, methionine, cysteine, methylglycine, dimethylglycine, and glycine were measured as previously described [206] using capillary 38
56 stable isotope dilution gas chromatography/mass spectrometry (Hewlett-Packard Co., Pal Alto, CA). Plasma total folate was measured using Lactobacillus casei assay as previously described [207]. Clinical analysis - Concentrations of plasma urea nitrogen (BUN) and creatinine as well as activities of lactate dehydrogenase (LDH), alanine transaminase (ALT), and creatinine kinase (CK) were measured using an automatic chemical analyzer (Johnson and Johnson VT250, Rochester, NY) at the Animal Clinical Chemistry and Gene Expression Facility, UNC- Chapel Hill. Urine specific gravity was measured using a refractometer (AO Instrument Company, Buffalo, NY) at the Department of Laboratory Animal Medicine Veterinary and Technical Services Facility, UNC- Chapel Hill. Plasma triacylglycerol (TAG), β- hydroxybutyrate (Stanbio, Boerme, TX), cholesterol, high density lipoprotein cholesterol (HDL-C), non-esterified fatty acids (NEFA), and glucose (Wako, Richmond, VA) were measured colorimetrically per manufacturers instructions. Triacylglycerol, phospholipids, and cholesterol - PtdCho, PtdEtn, phosphatidylserine (PtdSer) and phosphatidylinositol (PtdIns) were extracted from 5-week-old mouse liver using the Bligh and Dyer method [208], and isolated by thin layer chromatography (TLC) [209]. Concentrations were determined using a phosphate assay [210]. TAG was extracted from liver samples using the Folch method [211] and measured colorimetrically as described above. 39
57 In vivo VLDL secretion rate - 5-week-old animals were fasted for 4 hours. 500 mg/kg BW of Triton WR1339 (as a 7.5% solution dissolved in in PBS) was injected retro-orbitally. Blood samples were taken using heparinized capillary tubes retro-orbitally at 2, 30, 60, and 120 min after Triton WR1339 injection for TAG measurement as an indicator of the secretion rate of the very low density lipoprotein (VLDL). Tissue histology - Liver was harvested and fixed in 4% paraformaldehyde/0.2% gluteraldehyde for 48 hours. Liver was processed, paraffin embedded, sectioned at 5 µm, and stained with hemotoxylin and eosin as previously described [212]. For tumor analysis, whole liver was sectioned serially, and multiple sections per sample were examined by 2 veterinary pathologists from the Department of Laboratory Animal Medicine, UNC-Chapel Hill. High resolution images were collected using a Zeiss Axiovision A1 upright microscope. Gamma Glutamyltransferase 1 (ggt1) - ggt1 levels were determined using ELISA (Cedarlane, Burlington, NC). Frozen liver samples from 1-yr-old mice were homogenized in ice cold PBS at ph 7.0 containing 10% protease inhibitors (Sigma) using an ultrasonic cell disruptor. The resulting suspension was centrifuged and protein levels were determined by the Lowry method [213]. Equal amounts of proteins were loaded onto the ELISA plate according to manufacturer s protocol. The optical density was read at 450nm on a Synergy 2 microplate reader (Biotek, Vermont). Statistics - Statistical differences were determined using ANOVA, Tukey-Kramer HSD, and Student s t-test JMP version 6.0; SAS Institute, Cary, NC) and reported as means ± SEM. 40
58 3.4 RESULTS Generation and validation of Bhmt knockout mice - Bhmt -/- mice were generated using a cre/loxp system to delete exons 6 and 7, which contain the zinc binding domain essential for BHMT activity. The mouse genotype was confirmed by PCR using genomic DNA (Figure 3.1B). Bhmt -/- mice also were validated by assaying hepatic BHMT activity (Figure 3.1C) and by Western blot (Figure 3.1D). Deletion of 1 allele of Bhmt resulted in a 46% reduction of activity, while deletion of both alleles resulted in the absence of activity. BHMT protein is predominantly found in mouse liver and was absent in Bhmt -/- liver. Bhmt deletion had no effect on reproductive capacity or fetal viability - Mating pairs of Bhmt +/+, Bhmt +/-, and Bhmt -/- mice produced offspring with similar litter size (7.5 pups/litter) with evenly distributed genders. Bhmt +/- breeding pairs were used to generate littermates of Bhmt +/+, Bhmt +/-, and Bhmt -/- mice for all experiments. Bhmt +/- breeding pairs produced offspring at the expected Mendelian ratio, with 24.5% Bhmt +/+, 49.7% Bhmt +/-, and 25.8% Bhmt -/- mice. The Bhmt +/+ and Bhmt -/- mice appeared healthy and lived for at least 1 year. Bhmt -/- mice had reduced body weight at early age - Body length and weight of pups were monitored from 3.5 to 20 weeks of age. There was no significant difference in body length among Bhmt +/+, Bhmt +/-, and Bhmt -/- mice (data not shown), and in body weight between Bhmt +/+ and Bhmt +/- mice (Figure 3.1E). Bhmt -/- mice started with similar body weights as did Bhmt +/+ mice at weaning (3.5 wk), but gained less weight between 5 to 9 weeks of age (p<0.05). The weight difference did not persist after 9 weeks of age. 41
59 Bhmt deletion resulted in altered concentrations of choline and its metabolites - Bhmt is predominantly found in the liver, however, complete deletion of Bhmt (Bhmt -/- ) resulted in a substantial increase in concentrations of betaine in liver (by 21-fold; p<0.001), kidney (by 5- fold; p<0.001), heart (by 14-fold; p<0.001), brain (by 5-fold; p<0.001), muscle (by 12-fold; p<0.001), adipose (by 2-fold; p<0.001), lung (by 11-fold; p<0.001), and plasma (by 16-fold; p<0.001) compared to Bhmt +/+ mice (Table 3.1). Deletion of Bhmt resulted in reduced concentrations of choline in liver (by 82%; p<0.01), kidney (by 38%; p<0.01), heart (by 42%; p<0.05), and adipose (by 53%; p<0.01) compared to Bhmt +/+ mice. Deletion of Bhmt resulted in reduced concentrations of PtdCho in liver (by 26%; p<0.01), kidney (by 21%; p<0.05), heart (by 25%; p<0.01), muscle (by 25%; p<0.05), and plasma (by 31%; p<0.001) compared to Bhmt +/+ mice. Deletion of Bhmt resulted in reduced concentrations of phosphocholine (PCho) in liver (by 72%; p<0.01), heart (by 24%; p<0.05), muscle (by 65%; p<0.001), and adipose (by 68%; p<0.01) compared to Bhmt +/+ mice. Deletion of Bhmt resulted in reduced concentrations of glycerophosphocholine (GPCho) in liver (p<0.01), kidney (p<0.05), heart (p<0.001), adipose (p<0.05) and lung (p<0.01), as well as reduced concentrations of sphingomyelin (SM) in kidney (p<0.05) and heart (p<0.001) compared to Bhmt +/+ mice. In testis, there was no change in any choline metabolites in Bhmt -/- mice. Deletion of 1 copy of Bhmt (Bhmt +/- ) resulted in choline metabolite concentrations in tissues similar to those of Bhmt +/+ mice (Table 3.6). Bhmt deletion resulted in altered concentrations of Hcy, AdoMet, AdoHcy and related metabolites - In liver, complete deletion of Bhmt resulted in a 43% decrease in AdoMet 42
60 concentrations (p<0.01), and a 2.6-fold increase in AdoHcy concentrations (p<0.01), resulting in a 76% reduction in methylation potential (AdoMet:AdoHcy) ratios (0.9 ± 0.1 in Bhmt -/- vs 3.6 ± 0.2 in Bhmt +/+ ; p<0.01) (Table 3.2). Bhmt -/- mice also had reduced hepatic concentrations of DMG (by 95%; p<0.001), but had increased hepatic concentrations of thcy (by 6-fold; p<0.01) and methylglycine (by 2.6-fold; p<0.05) compared to Bhmt +/+ mice. Hepatic cystathionine, cysteine, methionine, and glycine did not differ among genotypes. In plasma, deletion of Bhmt resulted in increased concentrations of thcy (by 7.8-fold; p<0.001), decreased concentrations of cysteine (by 48%; p<0.01), and decreased concentrations of total folate (by 35%; p<0.01) compared to plasma from Bhmt +/+ mice. Deletion of 1 copy of Bhmt (Bhmt +/- ) did not result in changes in hepatic methylation potential, plasma thcy, or plasma total folate compared to Bhmt +/+ mice (Table 3.7). Bhmt +/- had plasma cysteine concentrations between those of Bhmt +/+ and Bhmt -/- mice. Bhmt deletion resulted in altered activities of enzymes involved in one-carbon metabolism - Since Bhmt -/- mice (but not Bhmt +/- mice) had altered one-carbon metabolites, enzymes involved in one-carbon metabolism were measured in Bhmt +/+ and Bhmt -/- mouse liver. Complete deletion of Bhmt resulted in increased hepatic CHDH (by 1.33 fold; p<0.05) and GNMT (by 1.13 fold; p<0.05) activities (Figure 3.2). Hepatic PEMT activity was not affected by Bhmt deletion. Bhmt deletion resulted in increased hepatic fat accumulation and decreased phospholipids - At 5 weeks of age, hepatic TAG concentrations were 6.5-fold higher in Bhmt -/- mice than in Bhmt +/+ mice (p<0.05) (Figure 3.3C). Bhmt +/- mice had similar hepatic 43
61 TAG concentrations compared to that of Bhmt +/+ mice (8.96 ± 1.92 ug/mg tissue in Bhmt +/- vs ± 0.99 ug/mg tissue in Bhmt +/+ ). The difference in hepatic steatosis between Bhmt +/+ and Bhmt -/- mice was easily visible at the microscopic level (Figure 3.3B). Hepatic and plasma phospholipids were measured in Bhmt +/+ and Bhmt -/- mouse liver due to their involvement with hepatic lipid storage and release. Bhmt -/- mice had lower concentrations of phospholipids in liver than did Bhmt +/+ mice (Figure 3.3A); with a 40% reduction in PtdCho (p<0.01), and a 60% reduction in PtdIns (p<0.01). Bhmt -/- mice also had a 31% reduction in plasma concentrations of PtdCho compared to Bhmt +/+ mice (p<0.01) (Table 3.1). PtdEth concentrations in liver and plasma were the same for both genotypes. Bhmt -/- mice had significantly reduced VLDL secretion rate (Figure 3.3D). Bhmt deletion resulted in altered clinical analyses - Plasma alanine aminotransferase activity, a measure of liver damage, was modestly increased in Bhmt -/- mice (34.7 ± 4.4 U/l in Bhmt -/- vs 20.6 ± 4.9 U/l in Bhmt +/+ ; p<0.05) (Table 3.3). Plasma BUN, creatinine, CK, and LDH, tests of kidney and muscle function, showed no changes in the Bhmt -/- mice. Urine specific gravity was significantly reduced in Bhmt -/- mice (1.020 ± mg/dl in Bhmt -/- vs ± mg/dl in Bhmt +/+ ; p<0.01). Plasma TAG, glucose, NEFA, and β- hydroxybutyrate concentrations did not differ between genotypes. Compared to wildtype littermates, Bhmt -/- mice had significantly lower plasma total cholesterol concentrations (by 45%, p<0.01) and HDL-C (by 38%, p<0.01). Heterozygous mice had similar plasma ALT, BUN, creatinine, LDH, CK, TAG, glucose, NEFA, and β-hydroxybutyrate concentrations compared to wildtype mice (Table 3.7). Heterozygous mice had no change in plasma cholesterol and HDL-C concentrations compared to Bhmt +/+ mice. 44
62 Bhmt deletion resulted in preneoplastic, neoplastic, and regenerative lesions in the mouse liver - Eleven Bhmt +/+, and fourteen Bhmt -/- mice were maintained over the course of a year to determine one-year survival rates. At time of sacrifice, 64% (9 out of 14) of Bhmt -/- mice and 0% (0 out of 11) of Bhmt +/+ mice had visible hepatic tumors (Figure 3.4a). Tumors observed in Bhmt -/- mice were solitary or multifocal, found in multiple liver lobes. The average liver weight of Bhmt -/- mice was heavier than that of Bhmt +/+ mice (6.22 ± 2.11 %BW in Bhmt -/- vs 4.36 ± 0.26 %BW in Bhmt +/+ ; p<0.001), attributable to tumor mass. A subset of the liver samples (4 out of 11 Bhmt +/+ livers, 6 out of 9 Bhmt -/- livers with tumors, and 4 out of 5 Bhmt -/- livers without tumors) were serial-sectioned entirely, stained with H&E, and send to two veterinary pathologists for diagnosis. Microscopic analysis depicted a series of histological abnormalities from preneoplastic lesions (acidophilic/eosinophilic cell foci) to frank neoplasia visible only in the Bhmt -/- mice (Table 3.4 & Figure 3.4b). Hepatocellular adenomas (HCA) were found in 30% (3 out of 10) of the analyzed Bhmt -/- livers and none were found in the control animals. These benign lesions were represented by single or multiple nodules, sharply demarcated from the surrounding tissues, with a mild to moderate compression border and loss of lobular structure. Hepatocellular carcinomas (HCC) were found in 50% (5 out of 10) of the analyzed Bhmt -/- livers. HCC were represented by nodules of atypical, megalo-hepatocytes that were vacuolated or contained hyaline droplets. Indicative of malignancy, these lesions were organized in cords that were 5-6 cells wide, had poor or nonexisting interface with the surrounding tissues, and compressed mildly the adjacent normal cords. The portal triads and sinusoids were poorly or non-distinguishable in most of the nodules. Formation of HCA and HCC in Bhmt -/- mice were accompanied by 45
63 macro and micro vesicular steatosis, and stellate (Ito) cell and/or oval (bililary) cell hyperplasia (Table 3.4). We did not study Bhmt +/- mouse survival or carcinogenesis. Bhmt deletion resulted in elevated gamma glutamyltransferase 1 in livers - ggt1 is a highly sensitive marker of chronic liver disease, neoplasia. and HCC [214]. Bhmt -/- mice had hepatic ggt1 concentrations 3.3 fold higher than that of the control mice (0.815 ± ng/mg tissue in Bhmt -/- vs ± ng/mg tissue in Bhmt +/+ ; p<0.01). Changes in choline and one-carbon metabolites at 5 weeks persisted at 1 year old Bhmt - /- mice - Choline deficiency and reduced methylation potential have been hypothesized as mechanisms underlying development of HCC. Compared to wildtype mice, Bhmt -/- mice had a 91% reduction in hepatic methylation potential (AdoMet:AdoHcy) compared to Bhmt +/+ mice (p<0.001) at 1 year (Table 3.5), which was greater than the 76% reduction seen at 5 weeks of age (Table 3.2). The reduced methylation potential was due to reduced hepatic AdoMet (by 50%; p<0.01) and to elevated AdoHcy (by 5.5 fold; p<0.001) concentrations in Bhmt -/- mice compared to Bhmt +/+ mice. Compared to wildtype littermates, Bhmt -/- mice had a 30-fold increase in hepatic betaine, a 73% reduction in GPCho, a 64% reduction in PCho, and an 18.8% reduction in PtdCho concentrations. At 1 yr old, Bhmt -/- mice still had elevated plasma thcy concentration (by 6.9-fold; p<0.01), but no longer had decreased plasma cysteine concentration. 46
64 3.5 DISCUSSION To our knowledge, this is the first report of the successful creation of Bhmt -/- mice. Deletion of Bhmt gene resulted in the complete loss of BHMT activity in liver, the organ where nearly all of activity resides in mice. Heterozygous mice had 53% of the hepatic BHMT activity measured in Bhmt +/+, suggesting that the Bhmt gene is biallelically expressed. Mating pairs of Bhmt +/+, Bhmt +/-, and Bhmt -/- produced offspring with normal number of pups and evenly distributed genders, suggesting that BHMT is not essential for reproduction. This is interesting because mice in which choline dehydrogenase (Chdh; form betaine from choline, immediately upstream from Bhmt in choline pathway, Figure 3.5) was deleted are infertile [215]. Fetuses from heterozygous (Bhmt +/- ) mating pairs were born at the expected Mendelian ratio; they were viable and survived to at least one year of age, suggesting that BHMT is not essential for embryonic development or for the viability of mice. Though a Bhmt knockout mouse has not been previously created, when S-(δcarboxybutyl)-DL-homocysteine (CBHcy; a potent and specific inhibitor of BHMT) was administered intraperitoneally to wildtype mice [109] or fed to rats [110], it caused an elevation of plasma Hcy concentrations and a reduction in hepatic AdoMet:AdoHcy ratio. Our current study confirms the finding that inhibiting or ablating flux through BHMT affects one carbon metabolism. The changes are summarized in Figure 3.5. As expected, Bhmt -/- mice had significantly higher concentrations of the substrates for this enzyme (betaine and Hcy) in various tissues as compared to Bhmt +/+ mice. Our data show that the transsulfuration and methionine synthase pathways do not have the capacity to remove the excess thcy that 47
65 accumulates when BHMT is not present, indicating that BHMT has a critical role in Hcy homeostasis. Bhmt -/- mice also had a significant reduction in hepatic dimethylglycine concentrations, one of the products of BHMT. Methionine, the other reaction product, was not affected by the gene deletion, probably because dietary methionine and protein stores of methionine are so large that the loss of BHMT-catalyzed biosynthesis does not alter overall concentrations of this amino acid. However, AdoMet concentration, which is formed from methionine, was reduced in livers of Bhmt -/- mice, while AdoHcy concentrations were elevated. AdoMet is used by glycine N-methyltransferase (GNMT), to form methylglycine from glycine [216] (Figure 3.5). Methylglycine is also formed from dimethylglycine, the product of the BHMT catalyzed reaction. Since Bhmt -/- mice do not accumulate dimethylglycine, the elevated methylglycine observed in Bhmt -/- mice likely comes from the action of GNMT. GNMT is allosterically inhibited by methylthf [198], which serves as the methyl-donor for methionine synthase, a parallel pathway to BHMT that catalyzes the conversion of Hcy to methionine [195]. It is possible that the Bhmt -/- mice rely heavily on the use of methylthf to form the needed methionine. Hence, GNMT is released from methylthf inhibition, resulting in increased methylglycine, reduced AdoMet and increased AdoHcy concentrations that we observed. This hypothesis is supported by elevated hepatic GNMT activity in Bhmt -/- mice (Figure 3.2), as well as the reduction in plasma concentrations of total folate (the predominant form contributing to plasma total folate is methylthf) (Table 3.2). AdoHcy is cleaved by AdoHcy hydrolase, producing Hcy and adenosine. This reaction is reversible and thermodynamically favors the synthesis of AdoHcy [217]; this should occur in the presence of the high thcy concentrations present in the Bhmt -/- mice. 48
66 Despite high plasma thcy concentrations, Bhmt -/- mice had significantly lower plasma cysteine concentrations; we observed no differences in hepatic cysteine concentrations. Normally, high Hcy would be expected to result in increased cystathionine and cysteine concentrations. For example, MTHFR deficient mice had elevated plasma Hcy, accompanied by elevated plasma cysteine [218]. Supplemental betaine has been shown to increase the activity of liver CBS [219], thus the accumulation of this metabolite as well as thcy in Bhmt - /- mice would be expected to increase concentrations of cysteine. However, AdoMet is an allosterically activator of CBS [220], and we suggest that reduced hepatic AdoMet concentrations inhibit the transsulfuration pathway. The flux of cysteine from liver to plasma must be rapid, perhaps explaining why plasma and not hepatic cysteine concentrations are altered. Deletion of Bhmt results in a substantial accumulation of betaine in most tissues except testis. Betaine is either used as a methyl donor (which is blocked by Bhmt deletion) or as an osmolyte that regulates cellular volume and fluid balance. The accumulation of betaine in Bhmt -/- mice may affect osmoregulation. Tests of kidney function did not reveal any malfunction (Table 3.3). However, Bhmt -/- mice had reduced urinary specific gravity (USG) compared to that of Bhmt +/+ mice (Table 3.3), suggesting reduced reabsorption of water by the kidney tubule. This finding is puzzling since high betaine should result in increased reabsorption of water and increased urine osmolality. 49
67 Surprisingly, the deletion of Bhmt does not result in accumulation of choline, the precursor of betaine. Choline is either oxidized to form betaine by the enzyme CHDH or it is used to form PtdCho. Since Bhmt -/- mice cannot utilize betaine, we expected to see product inhibition of CHDH resulting in increased choline availability for use in PtdCho synthesis. We observed the opposite, with lower choline and PtdCho concentrations in a number of tissues. Bhmt -/- mice had elevated hepatic expression of Chdh (data not shown) and hepatic CHDH activity (Figure 3.2), suggesting that this gene is induced by some factor in Bhmt -/- mice, possibly explaining increased use of choline to form betaine. The regulatory mechanisms for such an effect are not known. At 5 weeks of age, Bhmt -/- mice developed a fatty liver, and had elevated plasma ALT activity (a measure of hepatic damage). The fatty liver is the result of decreased synthesis of PtdCho, which is essential for the secretion of VLDL from liver [221]. These findings are consistent with the literature. Rodents and humans fed a choline deficient diet develop fatty liver [222, 223], and have elevated plasma ALT activity because choline deficiency induces hepatocytes apoptosis [35]. Consistent with these observations in Bhmt -/- mice, others have reported administration of betaine or the induction of BHMT activity prevents fatty liver in Mthfr -/- mice [218], in non-alcoholic fatty liver [107] and in alcohol induced fatty livers [91, 100] in rodents. Together, these data suggest the importance of BHMT activity in modulating hepatic steatosis. In addition, Bhmt -/- mice had reduced plasma total cholesterol and HDL-C. The role of Bhmt deletion in cholesterol and lipoprotein homeostasis warrants further studies. 50
68 At 1 year of age, 64% of Bhmt -/- mice developed hepatic tumors. Histopathology confirmed that these tumors were either hepatocellular adenomas or carcinomas. Even those that did not have visible tumors had higher incidence of fat accumulation, cellular alteration and hyperplasia when compared to Bhmt +/+ livers. Histological modifications were accompanied by elevation in ggt1 levels, a highly sensitive marker of HCC. In rodents, choline deficiency results in a higher incidence of spontaneous hepatocellular carcinomas [112]. Several mechanisms are suggested for these carcinogenic effects. Choline deficiency increases lipid peroxidation in the liver [113], which is a source of free radicals in the nucleus that could modify DNA and cause carcinogenesis. Choline deficiency perturbs protein kinase C (PKC) signaling, resulting in altered cell proliferation signals and cell apoptosis and eventually in carcinogenesis [114]. Methyl deficiency may also mediate the mechanisms that underlie the etiology of cancers. AdoMet level controls cell growth, and a persistent decrease in AdoMet concentrations leads to the development of HCC as observed in methionine adenosyltranferase 1A knockout mouse model (cannot make AdoMet from Met) [121]. Methyl deficiency may also alter epigenetic machinery by hypomethylating some genes but paradoxically hypermethylating specific genes (tumor suppressor genes) and consequently increasing the recruitment of methyl-binding proteins to the CpG islands. Consequently, the expression of tumor suppressor genes responsible for DNA repair (BRCA1, hmlh1), cell cycle regulation (p15, p16), carcinogenesis metabolism (GSTP1), hormonal response (RARβ2), apoptosis (DAPK, APAF-1), cell adherence (CDH1, CDH3) [ ] are silenced, leading to tumor development. All the above mechanisms are potentially the underlying causes of HCC observed in Bhmt -/- mice since these mice are 51
69 essentially choline and methyl-group deficient. We plan to investigate each of these hypotheses in ongoing work in our laboratory. Hepatocellular carcinoma is the fifth most common type of cancer worldwide [224]. In mouse models harboring genetic defects, HCC occurs spontaneously in a very limited number of cases [225]. For the first time, we present evidence that the Bhmt gene dysfunction links a metabolic defect to spontaneous neoplastic transformation in rodent livers. Bhmt -/- mice model marks the upper boundary for an effect of a lost-of-function gene variant in humans. Our studies in the Bhmt -/- mice suggest that humans with lost-of-function mutation in the BHMT gene may have important consequences, including hyperhomocysteinemia, altered choline metabolites, fatty liver, and hepatocellular carcinomas. It would be interesting to explore whether enhanced BHMT activity would reverse these symptoms. 52
70 3.6 FIGURES Figure 3.1. Confirmation of Bhmt -/- mice. A. Bhmt chimeric mice were generated using a gene targeting vector that removed exons 6 and 7 of the gene as described under Experimental Procedures. loxp, locus of X-over P1; frt, flippase recognition target; neo, neomycin cassette; flp, flippase recombination enzyme; cre, cyclization recombination enzyme. B. PCR analysis of genomic DNA isolated from Bhmt +/+, Bhmt +/-, and Bhmt -/- mice. The PCR product of the WT allele was 1600 bp, while the KO allele was 545 bp. C. Hepatic BHMT activity was measured using a radiometric assay in Bhmt +/+ (black bar), Bhmt +/- (hatched bar), and Bhmt -/- (white bar) mice. Data are presented as mean ± SEM, n=4-8 per group. Different letters differ significantly (p<0.01) by ANOVA and Tukey-Kramer HSD test. D. BHMT protein in liver from Bhmt +/+ and Bhmt -/- mice were probed by Western blot analysis. The size of BHMT protein is 45 kda. E. Body weights of Bhmt +/+ (black square), Bhmt +/- (grey square), and Bhmt -/- (white square) mice were measured using a scale from age 3.5 to 20 weeks old. Data are presented as mean ± SEM, n=10-25 per group.*p<0.05, different from Bhmt +/+ by Students t test. 53
71 54
72 Figure 3.2. Bhmt -/- mice have altered activities of enzymes involved in one-carbon metabolism. CHDH, GNMT and PEMT activities were measured in 5 week old Bhmt +/+ (black bar) and Bhmt -/- mice (white bar) mouse liver using radiometric assays. Data are presented as mean ± SEM, n=6-8 per group. *p<0.05, different from Bhmt +/+ by Students t test. CHDH, choline dehydrogenase; GNMT, glycine-n-methyltransferase; PEMT, phosphatidylethanolamine methyltransferase. 55
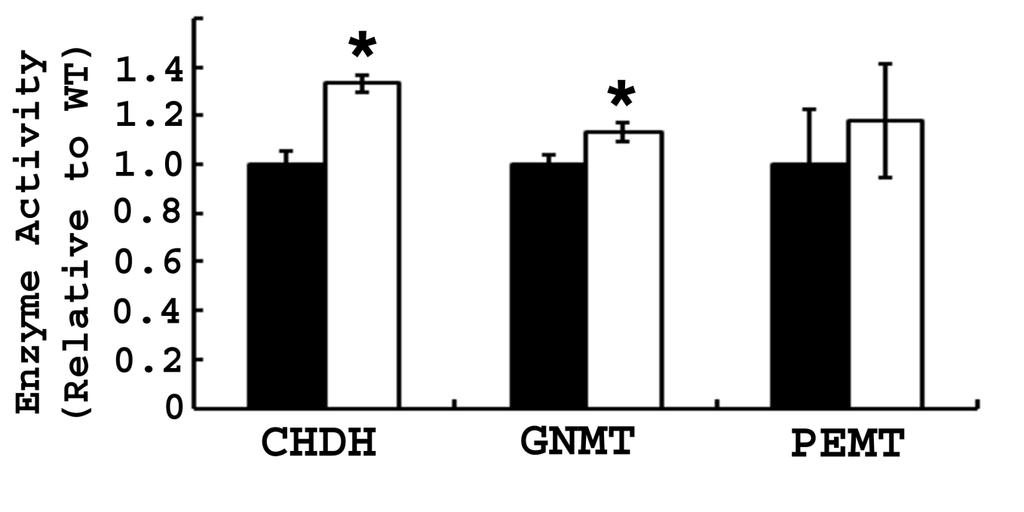
73 56
74 Figure 3.3. Bhmt -/- mice have fatty liver and reduced hepatic phospholipid concentrations. A. Hepatic phospholipids of 5 week Bhmt +/+ (black bar) and Bhmt -/- mice (white bar) mice were analyzed by a thin layer chromatography - phosphate assay method. Data are presented as mean ± SEM, n=5 per group. *p<0.01, different from Bhmt +/+ by Students t test. B. Morphology of liver from 5 week old mice was shown by hematoxylin-eosin (H&E) staining at 100X magnification. Scale bar = 50 µm. C. Hepatic TAG of 5 week old Bhmt +/+ (black bar) and Bhmt -/- (white bar) mice was extracted and quantitated by a colorimetric assay. Data are presented as mean ± SEM, n=6-8 per group. *p<0.05, different from Bhmt +/+ by Students t test. D. VLDL secretion rate of 5 week old Bhmt +/+ (black square) and Bhmt -/- (white square) mice was determined by measuring the plasma TAG after lipoprotein lipase inhibitor injection. Data are presented as mean ± SEM, n=6 per group. *p<0.05, different from Bhmt +/+ by Students t test. TAG, triacylglycerol; PLs, phospholipids; PtdCho, phosphatidylcholine; PtdEth, phosphatidylethanolamine; PtdIns, phosphatidylinositol; PtdSer, phosphatidylserine; VLDL, very low density lipoprotein 57
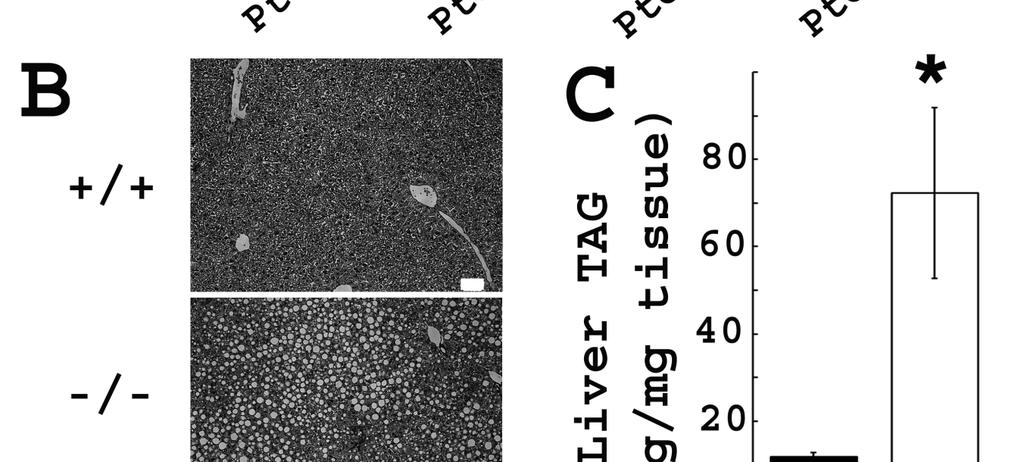
75 58
76 Figure 3.4. Bhmt deletion results in liver tumors at 1 year of age. A. Visible hepatic tumors in one year old Bhmt -/- male mice. The inspection of liver specimens at 4X magnification revealed single or multiple nodules up to 8 mm in diameter. B. H&E images of tumor bearing livers at 400X magnification, showing representative hepatocellular carcinoma and adenoma morphology. Scale bar = 50 µm. 1. Regenerative hyperplastic nodule containing streams of proliferative oval and biliary cells; 2. Hepatocellular adenoma (* - center of the nodule) well-circumscribed with lobular structure absent, compressive borders, eosinophilic hepatocytes; 3. Hepatocellular carcinoma represented by a large mass of abnormal vacuolated hepatocytes, containing poorly demarcated areas of smaller hepatocytes with less vacuolization, amphophilic cytoplasm, and a streaming growth pattern (arrow); 4. Hepatocellular carcinoma nodule of variably sized hepatocytes exhibiting cytomegaly with hyaline droplets, small hepatocytes with streaming growth pattern, oval cell proliferation, Ito cell proliferation between cords (unlabeled arrow), infiltration of leukocytes. 59
77 60
78 Figure 3.5. Changes in one-carbon metabolism due to Bhmt deletion. Deletion of Bhmt resulted in changes in the concentrations of the metabolites or activities of enzymes involved in homocysteine and one-carbon metabolism in tissues. AdoMet, S- adenosylmethionine; AdoHcy, S-adenosylhomocysteine; PtdCho, phosphatidylcholine; PtdEth, phosphatidylethanolamine; BHMT, betaine homocysteine methyl-transferase; PEMT, phosphatidylethanolamine methyltransferase; GNMT, glycine methyltransferase; CHDH, choline dehydrogenase. 61
79 62
80 3.7 TABLES Table 3.1. Deletion of Bhmt results in altered choline metabolites in various tissues. Tissues were harvested from 5 week old Bhmt +/+ and Bhmt -/- mice. Choline metabolites were extracted and quantified by liquid chromatography-electrospray ionization-isotope dilution mass spectrometry (LC ESI IDMS). Data are presented as mean ± SEM, n=5-10 animals/group. *p<0.05, p<0.01, p<0.001 different from Bhmt +/+ by Students t test. Concentrations are expressed as nmol/g, except for plasma, which is nmol/ml. PCho, phosphocholine; PtdCho, phosphatidylcholine; GPho, glycerophosphocholine; SM,sphingomyelin; ND, not detected. 63 Betaine Choline GPCho PCho PtdCho SM Liver Bhmt +/+ 1,321 ± ± 36 1,730 ± ± 67 15,897 ± 1,200 1,018 ± 131 Bhmt -/- 27,314 ± 2, ± ± ± 7 11,686 ± ± 37 Kidney Bhmt +/+ 1,151 ± ± 60 15,608 ± 1, ± 37 16,088 ± 1,025 3,373 ± 277 Bhmt -/- 5,424 ± ± 48 10,948 ± 672* 792 ± 41 12,707 ± 304* 2,685 ± 74* Heart Bhmt +/+ 77 ± ± ± ± 12 11,111 ± ± 50 Bhmt -/- 1,070 ± ± 6* 88 ± ± 14* 8,381 ± ± 44 Brain Bhmt +/+ 22 ± ± 26 1,208 ± ± 33 22,856 ± 1,147 2,191 ± 149 Bhmt -/- 100 ± ± 15 1,120 ± ± 9 21,020 ± 271 1,834 ± 52 Muscle Bhmt +/+ 44 ± 3 67 ± ± 4 51 ± 6 7,893 ± ± 15 Bhmt -/- 529 ± ± 3* 58 ± 6 18 ± 3 5,942 ± 238* 390 ± 13 Adipose Bhmt +/+ 142 ± ± ± ± 6 2,500 ± ± 14 Bhmt -/- 284 ± ± ± 79* 29 ± 7* 2,288 ± ± 18 Lung Bhmt +/+ 206 ± ± 24 3,586 ± ± 26 14,693 ± 344 2,389 ± 65 Bhmt -/- 2,237 ± ± 23 2,063 ± ± 42 14,437 ± 192 2,387 ± 47 Plasma Bhmt +/+ 48 ± 3 20 ± 4 ND ND 1,590 ± ± 10 Bhmt -/- 772 ± ± 2 ND ND 1,098 ± ± 77 Testis Bhmt +/+ 2,014 ± ± ± 26 3,831 ± 270 5,760 ± ± 74 Bhmt -/- 2,018 ± ± ± 47 3,706 ± 234 5,942 ± ± 38
81 Table 3.2. Deletion of Bhmt results in reduced methylation potential and increased homocyteine concentrations. Tissues were harvested from 5 week old Bhmt +/+ and Bhmt -/- mice. Hepatic homocysteine metabolites were quantified by capillary stable isotope dilution gas chromatography/mass spectrometry. Hepatic AdoMet, AdoHcy and plasma total homocysteine and cysteine were quantified by high pressure liquid chromatography. Plasma total folate was quantified by a microbial (Lactobacillus casei) assay. Data are presented as mean± SEM, n=5-6 per group. *p<0.05, **p<0.01, different from Bhmt +/+ by Students t test. AdoMet, S- adenosylmethionine; AdoHcy, S-adenosylhomocysteine. Organ Metabolites Bhmt +/+ Bhmt -/- Liver AdoMet [nmol/g tissue] 76.4 ± ± 5.7** AdoHcy [nmol/g tissue] 21.8 ± ± 7.7** AdoMet:AdoHcy 3.6 ± ± 0.1** thomocysteine [nmol/g tissue] 4.2 ± ± 5.5** Methionine [nmol/g tissue] 223 ± ± 23 Dimethylglycine [nmol/g tissue] 48.2 ± ± 0.2** Methylglycine [nmol/g tissue] 20.2 ± ± 12.2* Cystathionine [nmol/g tissue] 32.0 ± ± 5.8 Cysteine [nmol/g tissue] 247 ± ± 25 Glycine [nmol/g tissue] 1,659 ± 128 1,561 ± 135 Plasma thomocysteine [µm] 6.5 ± ± 5.9** Cysteine [µm] ± ± 9.3** tfolate [ng/ml] 81.7 ± ± 5.1** 64
82 Table 3.3. Deletion of Bhmt results in altered metabolic markers Plasma was collected from 5 week old Bhmt +/+ and Bhmt -/- mice after 4 h fasting. Concentrations of plasma ALT, BUN, creatinine and activities of LDH and CK were quantitated by the Animal Clinical Chemistry and Gene Expression Facility, UNC-Chapel Hill. Plasma triacylglycerol, cholesterol, HDL cholesterol, glucose, NEFA, hydroxybutyrate were measured colorimetrically. Urine specific gravity was measured by the Department of Laboratory Animal Medicine Veterinary and Technical Services Facility, UNC- Chapel Hill. Data are presented as mean ± SEM, n=5-7 per group. *p<0.05, **p<0.01, different from Bhmt +/+ by Students t test. ALT, alanine transaminase; BUN, plasma urea nitrogen; LDH, lactate dehydrogenase; CK, creatinine kinase; HDL-C, high density lipoprotein cholesterol; NEFA, non-esterified fatty acids. Organ Clinical Markers Bhmt +/+ Bhmt -/- Plasma ALT [U/I] 20.6 ± ± 4.4* BUN [mg/dl] 12.5 ± ± 1.8 Creatinine [mg/dl] <0.1 <0.1 LDH [U/I] 841 ± ± 80 CK [U/I] 741 ± ± 147 Triacylglycerol [mg/dl] 60.9 ± ± 7.9 Cholesterol [mg/dl] 57.8 ± ± 4.3** HDL-Cholesterol [mg/dl] 45.8 ± ± 5.7** Glucose [mg/dl] ± ± 15.9 NEFA [mm] 0.44 ± ± 0.07 Hydroxybutyrate [mm] 0.39 ± ± 0.03 Urine Specific Gravity [mg/dl] ± ± 0.002** 65
83 Table 3.4. Pathology in livers from a subset of 1 year old Bhmt +/+ and Bhmt -/- mice. A subset of 1 year old Bhmt +/+ (4 out of 11, none had visible tumors) and Bhmt -/- mouse liver (6 out of 9 that had visible tumors, 4 out of 5 that did not have visible tumors) were serialsectioned, H&E stained, and send to 2 veterinary pathologists for diagnosis. Dots indicated the changes observed in a particular sample. HCA, hepatocellular adenoma; HCC, hepatocellular carcinoma; Fat Accu., fat accumulation. Genotype Visible HCA HCC Fat Cellular Hyperplasia Tumor Accu. Alteration Bhmt +/+ Bhmt +/+ Bhmt +/+ Bhmt +/+ Bhmt -/- Bhmt -/- Bhmt -/- Bhmt -/- Bhmt -/- Bhmt -/- Bhmt -/- Bhmt -/- Bhmt -/- Bhmt -/- 66
84 Table 3.5. Metabolites in 1-yr-old mouse tissues Tissues were harvested from 1 year old Bhmt +/+ and Bhmt -/- mice. Hepatic AdoMet, AdoHcy and plasma homocysteine and cysteine were quantified by high pressure liquid chromatography. Choline metabolites were extracted and quantified by liquid chromatography-electrospray ionization-isotope dilution mass spectrometry (LC ESI IDMS). Data are presented as mean± SEM, n=8 per group. **p<0.01, different from Bhmt +/+ by Students t test. AdoMet, S-adenosylmethionine; AdoHcy, S-adenosylhomocysteine; GPCho, glycerophosphocholine; PC, phosphocholine; PtdCho, phosphatidylcholine; SM, sphingomyeline. Organ Metabolites Bhmt +/+ Bhmt -/- Liver AdoMet [nmol/g tissue] ± ± 3.9** AdoHcy [nmol/g tissue] 31.9 ± ± 22.1** AdoMet:AdoHcy 4.05 ± ± 0.03** Betaine [nmol/g tissue] 1,158 ± ,976 ± 2,700** Choline [nmol/g tissue] 84 ± ± 26 GPCho [nmol/g tissue] 803 ± ± 21** PC [nmol/g tissue] 674 ± ± 59** PtdCho [nmol/g tissue] 17,317 ± ,075 ± 795** SM [nmol/g tissue] 1,788 ± 127 1,976 ± 85 Plasma thomocysteine [µm] 5.5 ± ± 8.6** Cysteine [µm] ± ±
85 3.8 SUPPLEMENTS Table 3.6. Choline metabolites in Bhmt +/- tissues Tissues were harvested from 5 week old Bhmt +/- mice. Data are presented as mean ± SEM, n=6 animals. *p<0.05, different from Bhmt +/+ by Students t test. Concentrations are expressed as nmol/g. PCho, phosphocholine; PtdCho, phosphatidylcholine; GPho, glycerophosphocholine; SM,sphingomyelin; ND, not detected. Choline metabolites in adipose and plasma were not measured in Bhmt +/- mice. 68 Betaine Choline GPCho PCho PtdCho SM Liver 1,923 ± ± 36 1,730 ± ± 67 15,897 ± 1,200 1,018 ± 131 Kidney 1,296 ± ± 28 15,786 ± ± 31 14,035 ± 420 2,768 ± 60 Heart 95 ± ± ± ± 13 9,877 ± ± 48 Muscle 49 ± 4 67 ± ± ± 8 6,388 ± 174* 397 ± 11 Brain 18 ± ± 36 1,322 ± ± 35 20,441 ± 402 1,869 ± 84 Lung 239 ± ± 26 3,432 ± ± 20 14,777 ± 343 2,415 ± 63 Testis 2,334 ± ± ± 157 4,495 ± 193 6,581 ± 490 1,039 ± 61
86 Table 3.7. Other metabolites in Bhmt +/- tissues Tissues were harvested from 5 week old Bhmt +/- mice. Data are presented as mean± SEM, n=3-6 per group. *p<0.05, different from Bhmt +/+ by Students t test. # p<0.05, different from Bhmt -/- by Students t test. AdoMet, S-adenosylmethionine; AdoHcy, S- adenosylhomocysteine. ALT, alanine transaminase; BUN, plasma urea nitrogen; LDH, lactate dehydrogenase; CK, creatinine kinase; HDL-C, high density lipoprotein cholesterol; NEFA, non-esterified fatty acids. Organ Metabolites Bhmt +/- Liver AdoMet [nmol/g tissue] 86.3 ± 22.8 AdoHcy [nmol/g tissue] 35.4 ± 12.1 AdoMet:AdoHcy 2.9 ± 0.4 Plasma thomocysteine [µm] 6.3 ± 0.3 Cysteine [µm] ± 8.4* # Total folate [ng/ml] 81.3 ± 17.7 ALT [U/I] 31.0 ± 1.6 BUN [mg/dl] ± 0.3 Creatinine [mg/dl] <0.1 LDH [U/I] ± CK [U/I] ± 51.3 Triacylglycerol [mg/dl] 71.2 ± 5.8 Cholesterol [mg/dl] 48.7 ± 20.1 HDL-Cholesterol [mg/dl] 37.9 ± 14.9 Glucose [mg/dl] ± 13.1 NEFA [mm] 0.29 ± 0.04 Hydroxybutyrate [mm] 0.39 ±
87 CHAPTER IV THE ROLE OF BHMT IN ENERGY HOMEOSTASIS MOUSE BETAINE-HOMOCYSTEINE S-METHYLTRANSFERASE DEFICIENCY REDUCES BODY FAT VIA INCREASING ENERGY EXPENDITURE AND IMPAIRING FUEL USAGE AND STORAGE 1 Ya-Wen Teng, Jessica M. Ellis, Rosalind A. Coleman, and Steven H. Zeisel 4.1 ABSTRACT Betaine-homocysteine S-methyltransferase (BHMT) catalyzes the synthesis of methionine from homocysteine. In our initial report, we observed a reduced body weight in Bhmt -/- mice. We initiated this study to investigate the potential role of BHMT in energy metabolism. Compared to the controls (Bhmt +/+ ), Bhmt -/- mice had less fat mass, smaller adipocytes, and better glucose and insulin sensitivities. 1 Teng, Y., Ellis, J.M., Coleman, R.A., and Zeisel, S.H. (2011). Deletion of Murine Betaine- Homocysteine S-Methyltransferase Results in Decreased Body Fat Via Altering Energy Metabolism. Under Revision in JBC.
88 Compared to the controls, Bhmt -/- mice had increased energy expenditure and respiratory exchange ratio, with no changes in food intake, fat uptake or absorption, or in locomotor activity. The reduced adiposity in Bhmt -/- mice was not due to hyperthermogenesis. Bhmt -/- mice failed to maintain a normal body temperature upon cold exposure. In vivo and ex vivo tests showed that Bhmt -/- mice had normal lipolytic function. The rate of [ 14 C] fatty acid incorporated into [ 14 C] triacylglycerol was the same in Bhmt +/+ and Bhmt -/- gonadal fat depots (GWAT), but was 62% lower in Bhmt -/- inguinal fat depots (IWAT) compared to that of Bhmt +/+ mice. The rate of [ 14 C] fatty acid oxidation was the same in both GWAT and IWAT from Bhmt +/+ and Bhmt -/- mice. At basal level, Bhmt -/- GWAT had the same [ 14 C] glucose oxidation as did the controls. When stimulated with insulin, Bhmt -/- GWAT oxidized 2.4-fold more glucose than did the controls. Compared to the controls, the rate of [ 14 C] glucose oxidation was 2.4 and 1.8 fold higher respectively in Bhmt -/- IWAT without or with insulin stimulus. Our results show for the first time a role for BHMT in energy homeostasis. 4.2 INTRODUCTION Betaine-homocysteine S-methyltransferase (BHMT) catalyzes the formation of methionine from homocysteine using the choline metabolite betaine as the methyl donor. BHMT is an enzyme predominantly found in liver in rodents [18], and plays an essential role in regulating homocysteine, choline, and one-carbon metabolism. BHMT also influences hepatic lipid accumulation via altering phosphatidylcholine (PtdCho) concentration. BHMT exerts this effect through two mechanisms. Firstly, choline, the precursor of betaine, can 71
89 alternatively be used to make PtdCho via Kennedy pathway. Secondly, methionine, the end product of BHMT, is the precursor of S-adenosylmethionine (AdoMet), which is required for the synthesis of PtdCho from phosphatidylethanolamine (PtdEtn) by the enzyme PtdEtn methyltransferase (PEMT). BHMT overexpression increases PtdCho synthesis, leading to reduced hepatic lipid accumulation [95], while BHMT deficiency leads to fatty liver [226]. While the role of BHMT in hepatic lipid metabolism has been elucidated, there is no evidence that BHMT plays a role in whole body energy metabolism and adiposity. We observed that Bhmt deficient (Bhmt -/- ) mice had a lower body weight from 5 to 9 weeks of age compared to wildtype littermates [226]. Magnetic resonance image (MRI) analysis and dissection of adipose fat depots revealed that the reduced body weight observed in Bhmt -/- mice was due to reduced fat depots. These results suggested that Bhmt deficient mice might have problems with whole-body energy and lipid metabolism. This study aims to investigate the metabolic perturbations that lead to the reduced adiposity observed in Bhmt -/- mice. Homeostasis of energy stores is regulated by mechanisms including modulation of metabolic rate and thermogenesis, control of metabolite fluxes among various organs, and modulation of fuel synthesis and use within adipose tissue. We present evidence that Bhmt -/- mice have reduced adiposity due to increased whole-body metabolic rate, impaired triglyceride synthesis and enhanced glucose oxidation in white adipose tissue (WAT). 4.3 EXPERIMENTAL PROCEDURES Generation and Maintenance of Mice The strategy used to generate Bhmt -/- mice was as previously described [226]. Bhmt -/- mice and their wildtype littermates were of a C57Bl/6 x 72
90 sv 129 genetic background and were continuously backcrossed to C57Bl/6 mice. Generations F3 to F5 were used in this study. The animals were kept in a temperature-controlled environment at 24 C and exposed to a 12 hr light and dark cycle. All animals received AIN- 76A pelleted diet with 1.1 g/kg choline chloride (Dyets, Bethlehem, PA). The Institutional Animal Care and Use Committee of the University of North Carolina at Chapel Hill approved all experimental protocols. BHMT Western Blot - Mice were anesthetized by inhalation of isoflurane (Hospira, Lake Forest, IL). Tissues were harvested, snap frozen, pulverized under liquid nitrogen and stored at -80 o C until used. Western blot analysis was performed in liver and adipose homogenates as previously described [196]. Metabolic Studies - Body composition was determined in 14-wk-old mice by MRI (EchoMRI-100, Echo Medical Systems, LLC, Houston). Core temperature was measured in 7-wk-old mice using a rectal probe thermometer (Thermalert TH-5, Physitemp, Clifton, NJ). Food intake, oxygen consumption (VO 2 ), carbon dioxide release (VCO 2 ), heat production, and locomotor activity were measured every 27 minutes from individually housed mice (7- wk-old) using indirect calorimetry (TSE Systems, Germany) with an airflow of 0.25 liter/min. Locomotor activity was measured using infrared technology as the counts of three dimensional beam breaking (X total, Y total and Z total). Respiratory exchange ratio (RER) was calculated as VCO 2 /VO 2. Mice were acclimated to the chambers for 24 hr, and data were collected during the following 24 hr. Stool samples were collected, and TAG was extracted using the Folch method [211] and measured colorimetrically (Sigma, St. Louis, MO). For 73
91 cold tolerance tests, 7-wk-old mice were fasted for 4 hr before being exposed to cold (4 C) without food or bedding. Core temperature was measured using a rectal probe thermometer (Thermalert TH-5) at baseline and every 15 min. Mice were removed from the cold-room when body temperature dropped below 28 C. Biochemical Assays An oral fat load test was performed by gavaging 7-wk-old mice with 10 µl/g B.W. olive oil after an overnight fast. Blood was collected retroorbitally at baseline, 1, 2, 4, and 6 hr, and plasma triacylglycerol (TAG) was measured with a colorimetric assay (Sigma). Glucose and insulin tolerance tests were performed by intraperitoneally injecting either glucose (2.5 g/kg B.W.) or human insulin (1 U/kg B.W., Novo Nordisk Inc., Princeton, NJ) to 7-wk-old mice after a 6 or 4 hr fast, respectively. Blood glucose was measured at baseline, 15, 30, 60, and 120 min by tail nick using a glucometer (One Touch Ultra, LifeScan, Inc., Milpitas, CA). Plasma Metabolites - Plasma insulin (Ultra-Sensitive Mouse Insulin ELISA Kit, Crystal Chem Inc., Downers Grove, IL), total thyroxine (T4), total triiodothyronine (T3) (Alpha Diagnostic International, San Antonio, TX), and growth hormone (Millipore) levels were determined using commercially available ELISA kits according to the manufacturer s protocol. Plasma fibroblast growth factor 21 (FGF21) was determined using an RIA kit (Phoenix Pharmaceuticals Inc., Burlingame, CA) according to the manufacturer s protocol. Plasma creatine kinase (CK) was measured using an automatic chemical analyzer (Johnson and Johnson VT250, Rochester, NY) at the Animal Clinical Chemistry and Gene Expression Facility, UNC-Chapel Hill. Plasma TAG, glycerol (Sigma), and non-esterified fatty acids 74
92 (NEFA) (Wako, Richmond, VA) were measured colorimetrically per manufacturers instructions. Plasma glucose was measured using a glucometer (One Touch Ultra). Tissue Metabolites Hepatic free glucose and glycogen were measured using an adopted acid hydrolysis method [227]. Liver was collected from 5-wk-old or 48-wk-old mice after a 4 hr fast. Briefly, 40 mg pulverized liver was homogenized in 1 ml of 1N HCl. Half of the homogenate was neutralized with 0.5 ml of 1M NaOH (non-hydrolyzed group). The other half was incubated at 95 C for 90 min before being neutralized with NaOH (hydrolyzed group). Glucosyl units released in both groups were measured using a colorimetrical glucose kit (Wako). Non-hydrolyzed group represented the free glucose measurement, while the difference between the hydrolyzed and the non-hydrolyzed groups represented the glycogen measurement. For bile acids and steroids, liver and gonadal fat pads were collected from 5- wk-old mice after a 4 hr fast. Tissues were sent to Metabolon (Research Triangle Park, NC), where the metabolites were measured using gas chromatography/mass spectrometry (GC/MS) and liquid chromatography/mass spectrometry (LC/MS) platforms as previously described [ ]. Data was extracted and analyzed by Metabolon, and expressed as fold change relative to wildtype controls. For ATP/AMP/ADP, tissues were collected from 7-wk-old mice and immediately snap frozen in liquid nitrogen. Tissues were processed, and ATP, AMP and ADP measured using a high pressure liquid chromatography (HPLC) method as previously described [232]. Reverse Transcription-PCR Total RNA was isolated from tissue using RNeasy Mini kit (Qiagen, Valencia, CA), and cdna was synthesized using high-capacity cdna reverse 75
93 transcription kit (Applied Biosystems, Calsbad, CA). cdna was amplified by real-time PCR using SsoFast EvaGreen Supermix (Bio-Rad, Hercules, CA) with primers specific to the gene of interest. Results were normalized to the housekeeping genes (cyclophilin A or GAPDH) and calculated relatively to the controls by the 2 - CT method. For mitochondrial DNA analysis, genomic DNA was isolated by phenol/chloroform/isoamyl alcohol extraction. Relative amounts of mitochondria and nuclear DNA were determined by real-time PCR using cytochrome b and H19 respectively using genomic DNA as template. Lipolysis For in vivo lipolysis, mice were injected intraperitoneally with lipolytic stimuli (10 mg isoproterenol/1 kg B.W. or 1 mg CL316243/1 kg B.W.) (Sigma). Plasma was collected retroorbitally at baseline and 1.5 hr after injection. Plasma glycerol (Sigma) and NEFA (Wako) were measured colorimetrically, and glucose measured using a glucometer (One Touch Ultra). Gonadal and inguinal adipose explants were used for ex vivo lipolysis measurement as previously described [233, 234]. Briefly, pieces of fat explants (20 mg) were incubated in 0.5 ml Krebs Ringer Buffer (KRB) (12 mm HEPES, 121 mm NaCl, 4.9 mm KCl, 1.2 mm MgSO 4, and 0.33 mm CaCl 2 ) supplemented with 3.5% fatty acid free bovine serum albumin (FFF-BSA) and 0.1% glucose with or without 10 µm isoproterenol at 37 C. Twenty-five µl of buffer was collected at various time points to measure the release of glycerol colorimetrically (Sigma). Adipocyte Isolation Mature adipocytes were isolated from gonadal or inguinal fat depots from wk-old mice and used for incorporation and oxidation studies [235]. Briefly, gonadal or inguinal fat depots were removed under sterile conditions, minced and incubated 76
94 at 37 C with shaking for 1 hr in KRB supplemented with 1% FFF-BSA, 2.5 mm glucose, and 200 nm adenosine, containing 1 mg/ml collagenase I. The digested tissues were filtered through a sterile 250 µm mesh and washed 3 times with supplemented KRB. Adipocytes were diluted with supplemented KRB to reach 10% adipocytes solution, and maintained for 30 min in polypropylene tube before the start of the assay. Due to the small fat mass in Bhmt - /- mice, the same fat depots from two Bhmt -/- mice were pooled together to get enough adipocytes per sample. Incorporation and Oxidation - For fatty acid incorporation into TAG, 500 µl of 10% adipocyte solution were incubated with a 125 µl reaction mixture containing 15 µm [1-14 C] oleate (50 µci/500 µl; Perkin Elmer) and 200 µm unlabeled oleate complexed to BSA for 2 hr at 37 C. [ 14 C] TAG was extracted [236], isolated by TLC, and detected and quantified with a Bioscan AR2000 Image System (Bioscan Inc., Washington, DC). The chromatoplate was run in chloroform/methanol/ammonium hydroxide (65:25:4; v:v:v) to 8 cm from the top. After residual solvents evaporated, the plate was rerun in heptane/isopropyl ether/acetic acid (60:40:4; v:v:v) to the top of the plate. For oxidation, 250 µl of 10% adipocytes solution were incubated with a 125 µl reaction mixture containing either 15 µm [1-14 C] oleate and 200 µm unlabeled oleate or 4 µm [ 14 C] glucose (50 µci/500 µl; Perkin Elmer) and 4 mm unlabeled glucose (in KRB) for 1.5 hr at 37 C. The reaction mixture was incubated in a 13 ml polypropylene tube that contained a center well filled with folded filter paper. The tube was sealed with a rubber stopper. After 1.5 hr incubation, the reaction mixture was acidified with 150 µl of 70% perchloric acid, and 300 µl of 1 M NaOH was added to the center well. The sealed tubes were incubated at RT for an additional 45 min. The center well (containing 77
95 [ 14 C] CO 2 trapped by base) was then collected and placed into scintillation fluid and counted. The acidified reaction mixture (~400 µl) was incubated overnight at 4 C with 200 µl of 20% BSA. The mixture was centrifuged at 13,200 rpm for 20 min, and an aliquot of the supernatant was counted to determine [ 14 C]-labeled acid soluble metabolites (ASM). [ 14 C] CO 2 represents complete fatty acid or glucose oxidation, and [ 14 C] ASM represents incomplete fatty acid oxidation. For some experiments, 0.01 U insulin (Novo Nordisk Inc., Princeton, NJ) was added. Tissue histology - Adipose tissues were collected from 12-wk-old mice and fixed in 4% paraformaldehyde in 0.1M phosphate buffer for 24 hr. Tissues were processed, paraffin embedded, sectioned at 5 µm, and stained with hemotoxylin and eosin as previously described [212]. For adipocyte size analysis, three images (200X) per sample were taken, and the average adipocyte cell areas were analyzed using AxioVision 4.8 software (Zeiss, USA). Statistics - Statistical differences were determined using ANOVA, Tukey-Kramer HSD, and Student s t-test (JMP version 6.0; SAS Institute, Cary, NC) and reported as means ± SEM. 78
96 4.4 RESULTS BHMT Deficiency Resulted in Reduced Fat Mass and Smaller Adipocytes Our previous publication reported that Bhmt -/- mice gained less body weight between 5 to 9 weeks of age than did their wildtype littermates (p<0.05) [226]. To determine whether the reduced weight gain of Bhmt -/- mice was associated with reduced fat or lean mass, we measured body composition of these mice using MRI scan analysis. Bhmt -/- mice had 30% less fat mass than did Bhmt +/+ mice (p<0.01), with no difference in lean mass (Figure 4.1A). The difference in fat mass was confirmed by collecting the individual fat pads. The two major white adipose tissues (WAT), gonadal (GWAT) and inguinal (IWAT), of Bhmt -/- mice were significantly smaller than those of Bhmt +/+ mice at all ages (Figure 4.1B). The disparity in fat mass was exacerbated as mice aged, such that by 48 weeks of age, Bhmt -/- mice had a fat mass that was 41% of that of Bhmt +/+ mice. To determine whether the reduced fat mass in Bhmt -/- mice was due to fewer fat cells and/or smaller fat cells, the sizes of individual adipocytes in GWAT and IWAT of Bhmt +/+ and Bhmt -/- mice were analyzed. Histological images showed that both GWAT and IWAT from Bhmt -/- mice contained a larger number of smaller adipocytes (Figure 4.1C). We observed a 43% reduction in adipocyte size in GWAT (p<0.05) and an 80% reduction in adipocyte size in IWAT (p<0.001) in Bhmt -/- mice compared to those of Bhmt +/+ mice (Figure 4.1D). These data suggested that Bhmt -/- mice likely had normal adipocyte differentiation, and that the Bhmt -/- adipocytes either stored less and/or used more lipids than did Bhmt +/+ adipocytes. Bhmt is predominantly expressed in rodent liver. Western blotting confirmed that BHMT protein was specific to the liver and was absent in the adipose 79
97 tissue from both Bhmt +/+ and Bhmt -/- mice (Figure 4.1E), suggesting that the reduced fat mass in Bhmt -/- mice was due to an indirect effect of the lack of hepatic BHMT activity. BHMT Deficiency Resulted in Enhanced Glucose Tolerance and Insulin Sensitivity - Changes in adiposity are often associated with alterations in glucose and insulin homeostasis. Bhmt -/- mice had normal basal blood glucose levels (Figure 4.1F, 4.1G). Upon intraperitoneal injection of either glucose (Figure 4.1F) or insulin (Figure 4.1G), Bhmt -/- mice exhibited a faster glucose removal rate than did wildtype controls. Bhmt -/- mice also had a basal plasma insulin concentration that was 50% of that of the controls (p<0.05) (Table 4.1), indicating enhanced insulin sensitivity. Bhmt -/- Mice Had Increased Energy Expenditure To investigate the mechanisms that elicit the reduced fat mass in Bhmt -/- mice, elements of energy metabolism, including food intake, lipid uptake and absorption, body temperature, energy expenditure and activity, were determined. Bhmt +/+ and Bhmt -/- mice consumed similar amounts of food per day (Figure 4.2A). Fat load test (Figure 4.2B) and fecal lipid content (Figure 4.2C), tests for lipid uptake and absorption respectively, displayed no differences between Bhmt +/+ and Bhmt -/- mice. Bhmt +/+ and Bhmt -/- mice had similar rectal temperatures (Figure 4.2D). Compared to wildtype controls, Bhmt -/- mice had increased O 2 consumption (Figure 4.2E), increased CO 2 release (Figure 4.2F) and increased heat production (Figure 4.2G) throughout the light and dark phases. Bhmt -/- mice were not hyperactive (Figure 4.2I), suggesting that the increase in metabolic rate was independent of activity. The respiratory exchange ratio (RER), an indicator of metabolic fuel preference, was significantly elevated in Bhmt -/- mice during the 80
98 light phase (and there was a trend of increasing RER during the dark phase), (Figure 4.2H), implying that Bhmt -/- mice may rely more on the oxidation of glucose and less on fatty acids, consistent with improved insulin sensitivity and glucose tolerance. Thermogenesis Was Not Increased in Bhmt -/- Mice We next investigated whether the reduced adiposity observed in Bhmt -/- mice was due to increased thermogenesis. We predicted that Bhmt -/- mice would maintain a higher body temperature during a cold challenge if they had increased thermogenesis. After 6 hours of cold exposure, the wildtype controls dropped body temperature by 7.4% (from ± 0.14 ºC to ± 0.07 ºC), while Bhmt -/- mice dropped body temperature by 28.9% (from ± 0.09 ºC to ± 2.15 ºC) (Figure 4.3A). Mice were removed from the cold room when body temperature was less than 28 ºC. Brown adipose tissue (BAT) is a major site of nonshivering adaptive thermogenesis. We found no significant difference in the morphology or the weight of interscapular BAT between wildtype and knockout mice (data not shown). Real-time PCR analysis revealed normal thermogenic gene responses in Bhmt -/- BAT tissue during cold exposure, with elevated Pgc1 (peroxisome proliferator activated receptor γ coactivator), Lpl (lipoprotein lipase), Ucp1 (uncoupling protein 1), and Mcpt1 (muscle-type carnitine palmitoyltransferase 1) expression levels similar to those of Bhmt +/+ mice (Figure 4.3B), indicating that the adrenergic signaling was intact and similar between genotypes. Bhmt +/+ and Bhmt -/- mice had similar BAT TAG concentration before and after cold exposure, suggesting similar fuel storage and usage (Figure 4.3C). Mice were also able to maintain body temperature using exogenous fuels derived from organs such as white adipose tissue and liver, and through adaptive thermogenesis involving shivering in skeletal muscle to increase energy output. 81
99 Upon cold exposure, Bhmt -/- mice had significantly lower plasma glucose (by 46%), glycerol (by 46%), and NEFA (by 17%) concentrations compared to those of wildtype controls (Figure 4.3D-F), suggesting a restricted supply of exogenous fuels. Bhmt -/- mice also had a significantly elevated plasma creatine kinase activity (by 1.76 fold), a marker for muscle breakdown, perhaps because of increased shivering (Figure 4.3G). BHMT Deficiency Resulted in Altered Clinical Measurements in Plasma - We examined whether genotypic differences in energy balance were accompanied by changes in plasma clinical measurements. Basal plasma glycerol, NEFA, glucose, and TAG concentrations were similar for the two genotypes (Figure 4.3D-4.3F) as previously published [226]. Basal plasma insulin concentration was 50% lower in Bhmt -/- mice than in controls (p<0.05) (Table 4.1). Because of the prominent role of thyroid hormone in controlling metabolic rate, we investigated whether increased thyroid hormone concentration contributed to the hypermetabolic phenotype in Bhmt -/- mice. Indeed, Bhmt -/- mice had a 33% increase in plasma T4 (the major form of thyroid hormone in blood) concentration compared to that of wildtype controls (p<0.05). Concentration of fibroblast growth factor 21 (FGF21), a recently discovered metabolic and glucose regulator, was found to be 1.75-fold higher in Bhmt -/- plasma than in Bhmt +/+ plasma (p<0.01). The increase in plasma FGF21 concentration observed in Bhmt -/- mice was accompanied by a 3.35-fold increase in hepatic Fgf21 expression (where FGF21 is predominantly produced) compared to that of Bhmt +/+ mice (p<0.05). Growth hormone and T3 concentrations were not different between genotypes. 82
100 BHMT Deficiency Resulted in Increased Bile Acids in Liver and Adipose Tissue A novel concept indicating a signaling role of bile acids (BAs) in the control of energy metabolism has emerged [132, 133]. Increasing BA pool size in mice increased energy expenditure [133], while decreasing BA pool size reduced energy expenditure, resulting in weight gain and insulin resistance [132]. Since Bhmt -/- mice had reduced plasma cholesterol (the precursor of BAs) [226], we investigated whether Bhmt deletion altered the concentrations of BAs. Cholic acid and chenodeoxycholic acid are the primary BAs and often conjugated with taurine (as taurocholate or taurochenodeoxycholate) or glycine (as glycocholate or glycochenodeoxycholate) forming bile salts. Compared to wildtype littermates, Bhmt deletion resulted in 9.50-fold and 3.41-fold increases respectively in cholate (p<0.01) and taurocholate (p<0.05) in adipose tissue, and in 2.33-fold and 1.62-fold increases respectively in taurocholate (p<0.05) and glycocholate (p<0.01) in liver (Table 4.2). Cholesterol is hydrolyzed to form 7 hydroxycholesterol, the precursor of bile acids. Compared to the controls, Bhmt -/- mice had reduced cholesterol (by 20%, p<0.05) and increased 7-β-hydroxycholesterol (by 2.98-fold, p<0.05) concentrations in the liver, and increased 7-α-hydroxycholesterol (by 2.17-fold, p<0.01) concentrations in the adipose tissue. These data suggested that Bhmt deletion enhanced the synthesis of bile acids from cholesterol, and that the bile acids may contribute to the increased energy expenditure observed in Bhmt -/- mice. BHMT Deficiency Resulted in Reduced Cellular ATP/AMP Ratio in Liver But Not in Adipose Tissues, and in Reduced Hepatic Glucose and Glycogen Because Bhmt -/- mice displayed signs of lipodystrophy (fatty liver [226] and reduced fat pads), we measured ATP 83
101 and AMP in these organs (Table 4.1). Bhmt +/+ and Bhmt -/- mice had the same energy levels (ATP, AMP, ATP/AMP) in both GWAT and IWAT. However, in the liver, where Bhmt is predominantly expressed, Bhmt -/- mice had a reduced ATP/AMP level (by 65.7%, p<0.05) compared to Bhmt +/+ mice. The reduced ATP/AMP ratio was due to a 42% reduction in ATP concentration and a 61% increase in AMP concentration in Bhmt -/- liver compared to those of Bhmt +/+ liver (p<0.05). The reduced ATP/AMP ratio in Bhmt -/- liver was not due to decreased mitochondria content as there was no difference in mitochondria DNA in liver between wildtype and knockout mice. Bhmt -/- mice had reduced hepatic glucose (by 22% at 5 weeks of age and by 53% at 48 weeks of age) and glycogen (by 17% at 5 weeks of age and by 87% at 48 weeks of age) concentrations compared to those of Bhmt +/+ mice (Table 4.1). These data indicated that Bhmt -/- mice might be oxidizing more glucose (hence not storing them as glycogen), perhaps in an attempt to maintain the cellular ATP/AMP level. These data were consistent with the increased RER in Bhmt -/- mice, and perhaps explained why these mice were cold intolerant (due to lack of external glucose fuel). Bhmt -/- Mice Did Not Have Altered Lipolytic Rate To investigate whether the markedly decreased adiposity observed in Bhmt -/- mice was due to increased lipolysis, we measured lipolytic rate in both in vivo and ex vivo models whereby lipolytic stimuli were given, and glycerol released was measured as the indicator of lipolytic rate. Plasma TAG and glucose were also measured in the in vivo model to determine the whole-body response to adrenergic stimuli. During the in vivo experiment, when CL (β3 adrenergic specific lipolytic stimulus) was administered, Bhmt +/+ and Bhmt -/- mice had similar levels of plasma TAG, glycerol, and glucose release (Figure 4.4A-C). When isoproterenol (non-specific lipolytic 84
102 stimulus) was administered, Bhmt +/+ and Bhmt -/- mice had similar levels of plasma TAG and glycerol (Figure 4.4A-B), but a 50% decreased plasma glucose concentration compared to wildtype controls (Figure 4.4C). Lipolysis was further analyzed in isolated GWAT and IWAT explants from Bhmt +/+ and Bhmt -/- mice. The explants from Bhmt -/- mice released similar amounts of glycerol as did those from Bhmt +/+ mice under basal or stimulated conditions (Figure 4.4D-E), suggesting normal lipolytic machinery in Bhmt -/- mice. BHMT Deficiency Resulted in Impaired TAG Synthesis and Enhanced Glucose Oxidation in Isolated Mature Adipocytes Since TAG breakdown was not defective, we assessed whether TAG synthesis and FA oxidation were altered within the fat cells. We isolated mature adipocytes from both GWAT and IWAT from Bhmt -/- mice and their littermate controls and measured the rates of [1-14 C]oleate incorporation into TAG (for TAG synthesis), into CO 2 (for complete FA oxidation) and acid soluble metabolites (for incomplete FA oxidation). Mature adipocytes isolated from Bhmt +/+ and Bhmt -/- GWAT had the same rate of TAG synthesis (Figure 4.4F). Interestingly, mature adipocytes isolated from Bhmt -/- IWAT made less TAG (by 62%) compared to that of Bhmt +/+ mice (p<0.001). GWAT and IWAT adipocytes from Bhmt +/+ and Bhmt -/- mice had the same FA oxidation rate (Figure 4.4G), indicating normal β oxidation machinery. Since several lines of evidence (RER, enhanced glucose tolerance and insulin sensitivity, reduced glucose upon cold exposure and isoproterenol stimulus, reduced hepatic glucose and glycogen concentrations) suggested an increased reliance on glucose in Bhmt -/- mice, we assessed whether their mature adipocytes used more glucose. At basal level (without insulin), mature adipocytes isolated from Bhmt +/+ and Bhmt -/- GWAT had the same glucose oxidation rate (Figure 4.4H). However, with 85
103 insulin treatment, Bhmt -/- GWAT oxidized 2.38-fold more glucose than did Bhmt +/+ GWAT (p<0.05). Mature adipocytes isolated from Bhmt -/- IWAT oxidized 2.4-fold and 1.78-fold more glucose than did Bhmt +/+ IWAT without and with insulin treatment (Figure 4.4I). Compared to basal level, insulin treatment induced glucose oxidation by 1.87-fold, 4.17-fold, 3.21-fold, and 3.79-fold respectively for Bhmt +/+ GWAT, Bhmt -/- GWAT, Bhmt +/+ IWAT, and Bhmt -/- IWAT, confirming the viability of the isolated mature adipocytes, and indicating a higher response to insulin in Bhmt -/- mice, particularly in GWAT (Figure 4.4H, 4.4I). 4.5 DISCUSSION BHMT is one of the most abundant proteins in the liver, representing % of the total protein [43]. However, its known functions are limited to its roles in choline and onecarbon metabolism. Our current studies establish a unique role for BHMT in energy homeostasis. These findings are remarkable given that these mice had reduced adiposity and better insulin sensitivity and glucose tolerance when fed a diet containing 5% fat. Previously, we found that Bhmt -/- mice had reduced body weight from 5 to 9 weeks of age compared to wildtype littermates, although the difference in body weight disappeared after 9 weeks [226]. MRI and dissection of fat pads revealed that the reduced body weight in Bhmt -/- mice was due to lower fat mass. Different from changes in body weight, Bhmt -/- mice had fat pad mass smaller up to 1 year of age compared to the controls. Bhmt -/- mice were able to maintain body weight in light of the reduced fat mass perhaps due to the fact that they had heavier liver (fatty liver and liver tumor) that made up the difference in weights [226]. 86
104 BHMT is a liver-specific enzyme in rodents [18]. Since BHMT protein is absent in normal adipose tissue, this observation indicates that the reduced fat mass in Bhmt -/- mice was due to an indirect effect of the lack of hepatic BHMT activity. How could lack of a hepatic enzyme result in reduced fat mass? One possibility is diminished lipid transport from the liver to adipose tissue via very low density lipoprotein (VLDL). Our previous work showed that Bhmt -/- mice had reduced hepatic PtdCho concentration, resulting in decreased VLDL secretion and increased hepatic fat accumulation [226]. However, the amount of fat missing in fat pads exceeds the excess amount accumulated in the liver. In addition, adipose should be able to store lipid obtained from the diet instead of depending solely on hepatic lipid sources. Thus, decreased VLDL secretion is unlikely to account for all the fat absence. Homeostasis of energy stores is regulated by mechanisms that include modulation of metabolic rate and thermogenesis, control of metabolite fluxes among various organs, and modulation of fuel synthesis and usage within adipose tissue. Examination of each of these parameters in Bhmt -/- mice showed that multiple factors might contribute to the reduced adiposity observed in this mouse model. Bhmt -/- mice had normal food intake, fat clearance rate, and fecal fat content, indicating that the reduced adiposity was not due to reduced energy intake or fat malabsorption. Bhmt -/- mice had increased rates of O 2 consumption, CO 2 release, and heat production, suggesting that the reduced fat mass was partially due to hypermetabolism. Because locomotor activity did not differ between genotypes, the increased energy expenditure exhibited by Bhmt -/- mice was not due to increased physical activity. The increased RER suggested that Bhmt -/- mice were oxidizing more glucose, instead of FA, as 87
105 fuel to maintain whole body metabolism, particularly during the fasting period. We investigated whether the reduced adiposity was due to increased thermogenesis. Upon cold exposure, Bhmt -/- mice failed to maintain their body temperature. Bhmt -/- mice exhibited normal induction of genes involved in mitochondrial biogenesis, uncoupling, and fatty acid oxidation in BAT. Furthermore, Bhmt -/- mice had normal BAT TAG storage and functional lipolytic machinery in peripheral tissues. However, during prolonged cold exposure, Bhmt -/- mice had lower plasma glucose, glycerol, and NEFA and higher plasma CK (marker of muscle breakdown). These data indicate that Bhmt -/- mice were not hyperthermogenic. In fact, these animals were cold sensitive due to lack of exogenous fuel, and had to depend on shivering thermogenesis in an attempt to maintain body temperature. The reduced plasma glucose in Bhmt -/- mice during cold exposure was probably because they had less glucose and glycogen stored in the liver or increased demand of glucose as fuel supply. The reduced plasma glycerol and NEFA in Bhmt -/- mice during cold exposure was probably because they had less TAG stored in the adipose tissue to be released during energy needs. It was also possible that Bhmt -/- mouse liver was taking up glycerol and NEFA more efficiently for synthesizing glucose to make up the lack of glucose and glycogen stores. Within the adipose tissue, we observed that Bhmt -/- IWAT, but not GWAT, made 62% less TAG than did the controls. Although Bhmt -/- had normal lipolytic and FA oxidation machinery in both fat depots, the mice might have less TAG stored at a time when fuel was needed. On the other hand, the energy level (ATP/AMP) in GWAT and IWAT did not differ for the two genotypes. These data together suggest that Bhmt -/- mice may be utilizing more glucose instead of FA to maintain the cellular ATP/AMP ratio. Indeed, we observed 88
106 increased glucose oxidation in Bhmt -/- GWAT with insulin stimulus, and increased glucose oxidation in Bhmt -/- IWAT with or without insulin stimulus. This hypothesis was further supported by the elevated RER obtained from the indirect calorimetry, the enhanced glucose and insulin sensitivities observed in Bhmt -/- mice, the reduced plasma glucose during cold exposure and ß-adrenergic stimulation, and the reduced hepatic glucose and glycogen concentrations. These data also suggest that the altered glucose metabolism in Bhmt -/- mice was not limited to adipose tissue, but also occurred in the liver. Enhanced whole-body glucose oxidation could limit the availability of acetyl-coa forming fatty acids and the availability of the glycerol backbone forming TAG. It is intriguing that the observed effects were more pronounced in IWAT as compared to GWAT in Bhmt -/- mice. The size of Bhmt -/- GWAT adipocytes was 57% that of controls, while IWAT adipocytes size was 20% the size of that in controls. Adipocytes from Bhmt -/- IWAT synthesized 62% less TAG and oxidized 2.4-fold more glucose than did control IWAT, while no changes were detected in adipocytes from GWAT. It is commonly accepted that visceral (GWAT) and subcutaneous (IWAT) fat pads are different. GWAT is considered to be the pure WAT, while IWAT is a convertible WAT that may convert to BAT [237]. Compared to visceral fat, subcutaneous fat cells express more thyroid hormone receptors [238] and mitochondrial Ucp1 [239, 240], have more efficient insulin signaling and Glut4 [241], and is more responsive to Pparγ thiazolidinedione ligand [242, 243]. When subcutaneous fat was transplanted into visceral cavity of mice, it reduced body weight and fat mass, and enhanced insulin and glucose sensitivities [244], suggesting an intrinsic difference between the two fat pads. These differences in GWAT and IWAT may explain why effects in 89
107 Bhmt -/- IWAT are more pronounced. Similar findings have been observed in a different mouse model [245]. Bhmt -/- mice had reduced adiposity due to increased energy expenditure, enhanced glucose oxidation, and reduced TAG synthesis (Figure 4.5). The next question was how Bhmt deficiency could exert these differences, and we identified several candidates that may be responsible. Coinciding with increased energy expenditure, Bhmt -/- mice had elevated plasma T4 (the major form of thyroid hormone in the blood), a well-known energy metabolism regulator. Bhmt -/- mice also over-expressed hepatic Fgf21 and plasma FGF21 concentration was elevated, possibly contributing to the elevated energy expenditure and the enhanced glucose sensitivity. FGF21 is a novel metabolic regulator that is preferentially expressed in the liver [140]. FGF21 increases glucose uptake [142, 144] and decreased intracellular TAG content in adipocytes [144]; it lowers plasma glucose and TAG when administered to diabetic mice [142]; and it increases energy expenditure and improves insulin sensitivity in diet-induced obese mice [145, 146]. Furthermore, Bhmt -/- mice had increased bile acids concentrations in both liver and adipose tissue. Recent progress suggested a role of bile acids in glucose and energy homeostasis. Mice fed a cholic acid (a bile acid) supplemented diet had increased energy expenditure, preventing obesity and insulin resistance [133], while mice with reduced bile acids had decreased energy expenditure [132]. Bhmt deletion resulted in increased cholate and taurocholate in adipose tissue, and in increased taurocholate and glycocholate in liver. Bhmt -/- mice had reduced hepatic and serum cholesterol [226]. This was perhaps due to an increased conversion of cholesterol to cholic acid. Indeed, the concentration of 7-hydroxycholesterol, the precursor to bile acid from 90
108 cholesterol, was significantly elevated in both liver and adipose in Bhmt -/- mice. A growing body of evidence suggested an interaction among bile acids, thyroid hormone and FGF21. Thyroid hormone induced cholesterol 7α hydroxylase (CYP7A1), the rate-limiting enzyme in bile-acid synthesis from cholesterol [138, 139], and there was an inverse relationship between thyroid hormone level and serum cholesterol [136]. Thyroid hormone also induced hepatic Fgf21 expression in mice [147]. Bile acids enhanced the conversion of T4 to T3 within tissues, resulting in increased energy expenditure in mice [133]. Both bile acids and FGF21 concentrations were elevated in patients with nonalcoholic fatty liver [149]. Bile acids, thyroid hormone and FGF21 all induce similar metabolic changes, and these data together suggested that there was an interaction among these factors and Bhmt deficiency. All of these were altered in Bhmt -/- mice and could contribute to the reduced adiposity observed in Bhmt -/- mice. However, more studies are required to elucidate the interaction among these factors and their roles in reduced adiposity in Bhmt -/- mice. Aside from the increased bile acids, thyroid hormone and FGF21, deletion of hepatic Bhmt may cause reduced adiposity via changes in choline metabolites. As mentioned previously, BHMT is a major regulator of choline metabolism. Deletion of Bhmt resulted in altered choline metabolites, including a 21-fold and 2-fold increase in hepatic and adipose tissue betaine concentration and an 82% and 53% decrease in hepatic and adipose tissue choline concentration [226]. Recently, studies suggested that manipulation of dietary choline or alteration of pathways in choline metabolism may influence energy expenditure and adiposity. Mice fed a methionine and choline deficient diet (MCDD) were hypermetabolic, lost weight [150], and had better insulin sensitivity and glucose tolerance [154]. Mice with 91
109 the Pemt gene (making PtdCho from PtdEtn) deleted had normal metabolic parameters on a regular chow diet compared to wildtype controls, however, when fed a high fat diet, they had increased oxygen consumption and RER, accumulated less body fat and had increased glucose sensitivity [155]. The lack of weight gain in Pemt -/- mice disappeared when mice were supplemented with choline. These observations suggest a potential role of choline deficiency in modulating energy metabolism. Similar to MCCD fed mice and the Pemt -/- mice, Bhmt -/- mice had reduced choline and PtdCho concentrations, enhanced glucose and insulin sensitivities, increased energy expenditure and reduced adiposity. Bhmt ablation also resulted in a significant accumulation of betaine, which serves as a methyl donor and osmolyte. Betaine is commercially available as a feed additive; it is widely discussed as a carcass modifier due to its lipotropic and growth-promoting effects, generating leaner meat [156]. Dietary betaine supplementation resulted in reduced abdominal fat in poultry, and reduced carcass fat (by 10-18%) in pigs [ ]. The exact mechanism by which betaine modulates carcass quality is still unclear but has been suggested to involve interactions of betaine with growth factors and thyroid hormones [172, 175, 179, 181, ]. We did not observe increased growth hormone, but did observe enhanced plasma T4 and FGF21 concentration and consequently hypermetabolism in Bhmt -/- mice. Betaine may also have a role as a glucose sensitizer. Betaine supplementation enhanced insulin sensitivity in diet-induced-obese mice and increased insulin signaling pathway in isolated adipocytes [99]. 92
110 To summarize (Figure 4.5), Bhmt deletion resulted in reduced adiposity, enhanced insulin sensitivity and glucose tolerance. The reduction in fat mass in Bhmt deficient mice could be attributed to (1) increased whole body energy expenditure (2) decreased mobilization of lipids from the liver (VLDL) to be stored in adipose tissues (3) decreased TAG synthesis within adipocytes, and (4) increased glucose oxidation. Deletion of Bhmt resulted in a panel of abnormalities, including elevated thyroid hormone, bile salts, FGF21, and betaine concentrations, and reduced choline and PtdCho concentrations. Many of these have been related to elevated energy metabolism, reduced adiposity, and enhanced glucose tolerance and insulin sensitivity. How these parameters interact with each other warrant further studies. This study suggests the importance of Bhmt in regulating energy metabolism and adiposity. 93
111 4.6 FIGURES Figure 4.1. Bhmt -/- mice have reduced adiposity and better insulin & glucose sensitivities. A. Body mass was measured in 14-week-old Bhmt +/+ (black bar) and Bhmt -/- (white bar) mice using magnetic resonance image (MRI). *p<0.01, different from Bhmt +/+ mice by Students t test; n=6 per group. B. Two major fat pads, gonadal (GWAT) and inguinal (IWAT) white adipose tissues, were harvested from from Bhmt +/+ (black square) and Bhmt -/- (white square) mice at various age. *p<0.01, different from Bhmt +/+ of the same age by Students t test; n=10-16 per group for 5-12 week old mice and n=5 per group for week old mice. C. Morphology of GWAT and IWAT from 3-month-old mice was shown by hematoxylin-eosin staining. Scale bar = 50 µm. D. The adipocyte cell area of GWAT and IWAT from Bhmt +/+ (black bar) and Bhmt -/- (white bar) mice was analyzed using Zeiss AxioVision software. *p<0.05, **p<0.01, different from Bhmt +/+ mice by Students t test; n=3-5 per group. E. BHMT protein in liver and adipose tissue from Bhmt +/+ and Bhmt -/- mice were probed by Western blot analysis. The size of BHMT protein is 45 kda. F-G. Glucose tolerance test (F) and insulin tolerance test (G) was done in 7-week-old Bhmt +/+ (black square) and Bhmt -/- (white square) mice via intraperitonal injection of either glucose or insulin and measuring tail blood glucose at various time points. *p<0.05, different from Bhmt +/+ by Students t test; n=7 per group. Data is presented as mean ± SEM. 94
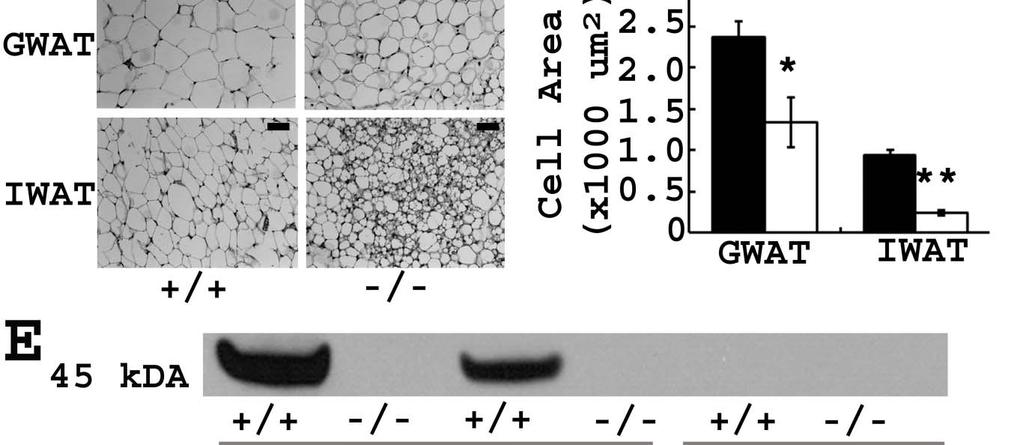
112 95
113 Figure 4.2. Bhmt -/- mice have altered energy metabolism. A. Food intake was measured in 7-week-old Bhmt +/+ (black bar) and Bhmt -/- (white bar) mice using indirect calorimetry; n=8 per group. B. A fat tolerance test was performed in 7-week-old Bhmt +/+ (black square) and Bhmt -/- (white square) mice via oral gavage of olive oil and measuring plasma TAG at various time points; n=3 per group. C. Fecal fat from Bhmt +/+ (black bar) and Bhmt -/- (white bar) mice was extracted and measured using a colorimetric assay; n=7 per group. D. Rectal temperature of 7-week-old Bhmt +/+ (black bar) and Bhmt -/- (white bar) mice was measured using a rectal probe thermometer at room temperature; n=6-7 per group. E-I. Oxygen consumption (E), carbon dioxide release (F), heat release (G), respiratory exchange ratio (CO 2 release/o 2 used) (H), and locomotor activity (I) were measured in 7-week-old Bhmt +/+ (black) and Bhmt -/- (white) using indirect calorimetry. Data was obtained after mice being acclimated to the chambers for 24 hr. *p<0.05, **p<0.01, different from Bhmt +/+ mice by Students t test; n=8 per group. Data is presented as mean ± SEM. TAG, triacylglycerol; VO 2, oxygen consumption; VCO 2, carbon dioxide release; RER, respiratory exchange ratio. 96
114 97
115 Figure 4.3. Bhmt -/- mice are cold sensitive. Seven-week-old mice were exposed to room temperature or 4 C, and tissues collected after 6 hour exposure. A. Body temperature of Bhmt +/+ (black square) and Bhmt -/- (white square) mice exposed to 4 C was measured using a rectal probe thermometer at different time point. *p<0.05, **p<0.01, different from Bhmt +/+ mice at the same time point by Students t test; n=13-14 per group. B. Expression of genes involved in thermogenesis in the BAT of Bhmt +/+ (black bar) and Bhmt -/- (white bar) mice at room temperature (n=3-4 per group) or 4 C (n=7-8 per group) exposure. C. TAG in BAT from room temperature (n=3-6 per group) or 4 C (n=13-14 per group) exposed Bhmt +/+ (black bar) and Bhmt -/- (white bar) mice were extracted and measured colorimetrically. D-G. Plasma glucose (D), glycerol (E), NEFA (F), and CK (G) from room temperature (n=3-6 per group) or 4 C (n=13-14 per group) exposed Bhmt +/+ (black bar) and Bhmt -/- (white bar) mice were measured colorimetrically. *p<0.05, different from Bhmt +/+ mice under the same condition by Students t test. Data is presented as mean ± SEM. BAT, brown adipose tissue; NEFA, non-esterified fatty acid; CK, creatine kinase; PGC1α, pparγ coactivator 1α; LPL, lipoprotein lipase; UCP1, uncoupling protein 1; MCPT1, muscle carnitine palmitoyl transferase 1. 98
116 99
117 Figure 4.4. Bhmt -/- mice have altered TAG synthesis and glucose oxidation. A-C. Plasma TAG (A), glycerol (B), and glucose (C) were measured in 7-week-old Bhmt +/+ (black bar) and Bhmt -/- (white bar) mice before and after ip injection of lipolytic stimulus isoproterenol or CL316243; n= 5-7 per group. D-E. Gonadal (D) or inguinal (E) explants from Bhmt +/+ (black square) and Bhmt -/- (white square) mice were used to measure glycerol release without (solid line) or with (dashed line) 10 µm lipolytic stimulus isoproterenol; n=4-6 per group. F. Mature adipocytes were isolated from Bhmt +/+ (black bar) and Bhmt -/- (white bar) mice GWAT and IWAT and used to determine the rate of labeled fatty acid incorporated to triacylglycerol. **p<0.01, different from Bhmt +/+ mice by Students t test; n=4-5 per group. G. Mature adipocytes were isolated from Bhmt +/+ and Bhmt -/- mice GWAT and IWAT and used to determine the rate of 14 C 18:1 oxidation: CO 2 (grey bar), ASM (white bar); n=10-13 per group. H-I. Mature adipocytes were isolated from Bhmt +/+ (black bar) and Bhmt -/- (white bar) mice GWAT (H) and IWAT (I) and used to determine the rate of glucose oxidation with or without insulin. *p<0.05,**p<0.01 different from Bhmt +/+ mice under the same treatment by Students t test; n=7-10 per group without insulin, n=4-7 per group with insulin. Data is presented as mean ± SEM. GWAT, gonadal white adipose tissue; IWAT, inguinal white adipose tissue; ASM, acid soluble metabolites; TAG, triacylglycerol; Iso, isoproterenol; CL, CL CL
118 101
119 Figure 4.5. Overview of metabolic disturbances in Bhmt -/- mice. Increased energy expenditure, decreased lipid mobilization from the liver to adipose tissue, decreased TAG synthesis and enhanced glucose oxidation together resulted in reduced fat mass in Bhmt -/- mice. Bhmt deletion increased plasma FGF21 and T4 concentrations, and increased betaine and bile acids concentrations while decreased choline concentration in both liver and adipose tissue. All of these changes had been associated with increased energy expenditure, enhanced insulin sensitivity, and reduced adiposity, and might be interrelate with one-another. BHMT, betaine homocysteine S-methyltransferase; Cho, choline; Bet, betaine; PtdCho, phosphatidylcholine; VLDL, very low density lipoprotein; FA, fatty acid; TAG, triacylglycerol; FGF21, fibroblast growth factor 21; Chol, cholesterol; 7 hydroxychol, 7 hydroxycholesterol; BAs, bile acids; Glu, glucose; Gly, glycogen; G-6-P, glucose-6- phosphate; Dio2, deiodinase 2; T4, thyroxine; T3 triiodothyronine. 102
120 103
121 4.7 TABLES Table 4.1. Metabolites and Gene Expression of Bhmt +/+ and Bhmt -/- mice in Tissues. Plasma was collected from 7-12 week old Bhmt +/+ and Bhmt -/- mice after 4 h fasting, and metabolites measured using commercial available kits; n=8-17 per group. Liver, GWAT, IWAT were collected from 7-week-old Bhmt +/+ and Bhmt -/- mice unless otherwise indicated. Fgf21 expression and mitochondria DNA were measured by real-time PCR, and expressed relatively to the controls; n=6-10 per group. ATP and AMP were measured using a high pressure chromatography method; n=4 for ATP and AMP measurement. Glucose and glycogen were measured using an acid hydrolysis method; n=6 per group. *p<0.05, **p<0.01, different from Bhmt +/+ by Students t test. Data is presented as mean ± SEM. Organ Measurement Bhmt +/+ Bhmt -/- Plasma Insulin [ng/ml] ± ± 0.157* FGF21 [ng/ml] 1.49 ± ± 0.3** T4 (thyroxine) [µg/dl] 4.61 ± ± 0.22** T3 (triiodothyronine) [ng/dl] ± ± 9.87 Growth hormone [ng/ml] 5.02 ± ± 1.46 Liver FGF21 expression [arbitrary value] 1.00 ± ± 0.95* Glucose [µmol/g liver] [5-wk-old] ± ± 1.47* Glucose [µmol/g liver] [48-wk-old] ± ± 2.39* Glycogen [µmol/g liver] [5-wk-old] ± ± 4.21 Glycogen [µmol/g liver] [48-wk-old] ± ± 2.56* ATP [nmol/mg protein] ± ± 13.0* AMP [nmol/mg protein] ± ± 27.6 ATP/AMP 1.49 ± ± 0.17* Mitochondria DNA [arbitrary value] 1.00 ± ± 0.21 GWAT ATP [nmol/mg protein] 74.6 ± ± 28.4 AMP [nmol/mg protein] ± ± 53.7 ATP/AMP 0.50 ± ± 0.31 Mitochondria DNA [arbitrary value] 1.00 ± ± 0.17 IWAT ATP [nmol/mg protein] 51.5 ± ± 16.9 AMP [nmol/mg protein] ± ± 12.1 ATP/AMP 0.23 ± ± 0.05 Mitochondria DNA [arbitrary value] 1.00 ± ±
122 Table 4.2. Bile acids and sterols in Bhmt liver and adipose tissue. Liver and gonadal adipose tissue were collected from 5-week-old Bhmt +/+ and Bhmt -/- mice after 4 hour fasting; n=6 per group. The relative abundance of metabolites was measured and analyzed by liquid and gas chromatography by Metabolon (Research Triangle Park, NC). Dark grey=elevated relatively to controls, light grey=decreased relatively to controls, N/D=not-detected. METABOLITES LIVER WT Mean KO Mean Fold P Value Change Cholate 0.84 ± ± Taurocholate 0.75 ± ± Glycocholate 0.88 ± ± Taurochenodeoxycholate 1.62 ± ± Cholesterol 1.19 ± ± ß-hydroxycholesterol 0.76 ± ± ADIPOSE WT Mean KO Mean Fold P Value Change Cholate 0.94 ± ± Taurocholate 1.14 ± ± Cholesterol 1.09 ± ± α-hydroxycholesterol 0.88 ± ± ß-hydroxycholesterol 1.03 ± ±
123 CHAPTER V SYNTHESIS 5.1 Overview This dissertation describes two independent projects that examine the metabolic consequences of Bhmt deficiency. In this work, we generated the first mouse model with the gene encoding Bhmt deleted. The results of these studies confirm the importance of BHMT in the regulation of homocysteine and one-carbon metabolism. The results of these studies also reveal that BHMT has broader metabolic effects than we previously anticipated. We show for the first time that BHMT is involved in hepatic carcinogenesis and in energy metabolism. Although many questions remain to be addressed, this work is expected to stimulate further research. This chapter will discuss the key findings from these projects and their future implications for understanding and treatment of BHMT-related diseases.
124 5.2 Bhmt deficiency caused hyperhomocysteinemia Elevation of Hcy has been associated with cardiovascular disease, neural tube defect, renal dysfunction, and cognitive impairment [43]. Although it is well established that BHMT functions to remethylate Hcy into methionine, this role has traditionally received little attention. This is due to the assumption that transsulfuration and methyl-folate pathways could potentially replace the lack of BHMT. Using Bhmt deficient mice, this dissertation provides compelling evidence that the role of BHMT in Hcy metabolism is not replaceable. Bhmt -/- mice have a substantial increase in hepatic (by 6-fold) and plasma Hcy (by 7.8-fold), suggesting that transsulfuration and methyl-folate pathways do not have the capacity to remove the excess Hcy due to Bhmt deficiency under normal conditions. BHMT and MS share the function of remethylating Hcy to methionine. MS uses methyl-folate as the methyl donor. An interesting question to ask is whether folate supplementation can reverse, while folate deficiency can exacerbate, the elevated plasma Hcy caused by Bhmt deletion? My student, Ignacio Cerdena, and I are currently addressing this question. We are feeding 6 week old Bhmt +/+ and Bhmt -/- female mice a folate deficient, a folate control or a folate supplemented diet for 4 weeks. We will collect plasma and tissues for analysis. Preliminary data from this study shows that Bhmt -/- mice have higher plasma homocysteine than do Bhmt +/+ mice in all dietary groups (Figure 5.1). The data also shows that a 4-week folate supplementation does not ameliorate the elevated plasma Hcy caused by Bhmt deficiency, while folate deficiency exacerbates it. This ongoing project provides a valuable message humans who have HHcy due to BHMT deficiency may not benefit from 107
125 dietary folate supplementation, but they would do worse if they are not taking in enough folate. Figure 5.1 Plasma total homocysteine of Bhmt +/+ or Bhmt -/- mice on varying folate diets. Six weeks old Bhmt +/+ and Bhmt -/- mice were given a folate deficient, a folate control or a folate supplemented diet for four weeks. Plasma total homocysteine was quantified by high pressure liquid chromatography. Small letters, significantly different by diets within wildtype mice. Capitalized letters, significantly different by diets within knockout mice. *, significantly different by genotypes within the same diet. The pressing question arising from these findings is whether the elevated Hcy levels in Bhmt -/- mice affect the pathology of HHcy-related diseases, particularly cardiovascular diseases. Several mouse models of HHcy have been engineered to study the vascular pathophysiology of hyperhomocysteinemia [42]. Those include mice with the gene encoding Cbs, Mthfr or Mtr/Ms deleted [ ]. Mice with homozygous defects in these genes have poor growth and survival, making the study of vascular pathophysiology of HHcy difficult [ ]. Instead, studies have been done in mice with heterozygous defect in these genes. 108
126 These mice are barely hyperhomocysteinemic (plasma Hcy of 6-9 µm, compared with 3-5 µm in wildtype littermates) and require additional diet manipulation to reach the HHcy state [ ]. The Bhmt -/- mouse will be a valuable mouse model to examine the relationship between HHcy and vascular diseases because it survives to at least 1 year of age and is severely hyperhomocysteinemic. Future studies should examine whether deletion of Bhmt results in increased susceptibility to vascular diseases due to HHcy. 5.3 Bhmt deficiency disturbed choline metabolites The results from this dissertation elucidate the effects of Bhmt deficiency on choline metabolites. As predicted, Bhmt deficiency results in a substantial accumulation of betaine in most tissues, except testis. Unexpectedly, Bhmt deficiency results in reduced choline and PtdCho concentrations in tissues, suggesting the complexity of the regulation of choline metabolism. Deletion of Bhmt does not result in accumulation of choline, the precursor of betaine. Choline is either oxidized to form betaine by the enzyme CHDH or used to form PtdCho. Since Bhmt -/- mice cannot use betaine, we expected to see product inhibition of CHDH, resulting in increased choline availability for use in PtdCho synthesis. The opposite has been observed, with lower choline and PtdCho concentrations in a number of tissues. Bhmt -/- mice have elevated hepatic Chdh expression and CHDH activity, suggesting that this gene is induced by some factor present in Bhmt -/- mice, possibly explaining increased use of choline to form betaine. It is intriguing that nature would sacrifice the possibility of synthesizing PtdCho to make methyl donors. This further demonstrates the importance of betaine and 109
127 AdoMet. The questions that arise from these findings regard how CHDH is regulated and whether it is differentially regulated based on tissue types. Testis is the only tissue that maintains normal betaine and choline concentrations during Bhmt deficiency. This finding suggests a rigid control of CHDH activity and the importance of maintaining choline metabolite homeostasis in the testis. Our laboratory finds that male mice with Chdh deficiency are infertile due to abnormal mitochondria in the testis [252]. Contrary to Bhmt -/- mice, Chdh -/- mice have high choline and low betaine concentrations, indicating a potential role of betaine in fertility. Amy Johnson in our laboratory is currently studying the role of Chdh in male infertility. Future studies examining the regulation of CHDH are needed to develop preventative strategies for male infertility. In addition to being a methyl donor, betaine also serves as an osmolyte that regulates cellular volume and fluid balance [253]. Cells in the renal medulla are typically exposed to high extracellular osmolarity (NaCl and urea). High NaCl and urea cause water efflux from cells, resulting in reduced cellular volume and creating a hypertonic state that is damaging to cells [254]. Therefore, cells accumulate osmolytes such as betaine to counteract the hypertonicity by retaining water within cells. One would predict that betaine accumulation within renal cells would increase water retention, generating elevated urine osmolarity (lower urinary specific gravity). We observe the opposite, with Bhmt -/- mice have reduced urinary specific gravity. One possibility is that these mice are thirsty and consume extra fluid, leading to increased urinary output that consequently decreases urinary osmolarity. To test this hypothesis, fluid intake and urinary output need to be determined. Furthermore, within cells there are other organic osmolytes, such as glycerophosphocholine, taurine, sorbital, and 110
128 inositol. Whether betaine accumulation results in compensatory changes of other osmolytes remains to be answered. Future studies should examine the role of betaine in kidney function and betaine s relationship with other osmolytes. The physiological consequences of accumulating excessive betaine within cells are not understood. Excessive levels of osmolytes could potentially result in cells swelling due to excess water retention and in altered intracellular ionic strength. The mitochondrion is the site of betaine formation (CHDH is a mitochondrial enzyme). Excess betaine accumulation and water retention could potentially result in swollen mitochondria, thereby altering oxidative and energy generating functions. This could potentially contribute to the altered energy metabolism and the fuel usage observed in Bhmt -/- mice. To examine the structure of organelles, various tissues from Bhmt mice have been collected and are now being processed for conducting transmission electron microscopy (TEM). If changes in organelles are observed, then cellular functions should be examined. It is essential for the future studies to examine the potential effects of betaine as an osmolyte in cellular functions. 5.4 Bhmt deficiency altered hepatic health Alteration of one-carbon metabolism has been associated with liver diseases such as alcoholic and nonalcoholic fatty liver, human liver cirrhosis, and hepatocellular carcinoma for at least 50 years. Expression of genes involved in one-carbon metabolism, such as BHMT, is reduced significantly in human cirrhosis and hepatocellular carcinoma [255]. Betaine is used to treat both alcoholic and nonalcoholic fatty liver, while choline deficiency is the only nutrient deficiency that results in hepatocellular carcinoma (summarized in the background 111
129 section). Data from this dissertation demonstrates that Bhmt deficiency results in nonalcoholic fatty liver at an early age and hepatocellular carcinoma at 1 yr of age. Taken together, one-carbon metabolism plays a crucial role in hepatic health. However, the molecular bases of these findings are not fully elucidated. Bhmt -/- mice have a 6-fold increase in hepatic triacylglycerol concentration compared to their wildtype littermates. We show that Bhmt -/- mice have reduced hepatic PtdCho concentration (by 36%) and VLDL secretion, explaining the fatty liver. However, Bhmt may have more roles in hepatic lipid metabolism. Cultured hepatocytes overexpressing Bhmt, and rat livers following an in vivo induction of Bhmt, have increased apolipoprotein B expression, suggesting an additional role of betaine/bhmt system on lipoprotein homeostasis [ ]. BHMT catalyzes the synthesis of methionine, which is the precursor of AdoMet. The cells need carnitine to transfer fatty acids to mitochondria, where fatty acid oxidation takes place. Carnitine is synthesized from lysine or methionine via methylation, in which AdoMet is required. Deletion of Bhmt could possibly reduce carnitine synthesis (by reducing methionine and AdoMet), resulting in limited fatty acid oxidation and a consequent fat accumulation in the liver. Fatty acid oxidation can be tested by incubating hepatocytes or liver homogenates with labeled fatty acid and collecting labeled CO 2. This hypothesis probably does not apply to adipose tissue as Bhmt -/- mice have reduced fat mass and no change in fatty acid oxidation. Bhmt deficiency results in HHcy, which has been associated with altering several biological functions. HHcy has been shown to induce endoplasmic reticulum (ER) stress [108]. ER is an essential organelle, which provides a specialized environment for the 112
130 production and post-translational modifications of secretory and membrane proteins. Studies suggest that Hcy can be wrongly incorporated to proteins, causing protein misfolding and unfolding in the ER and increasing ER stress [93, 95, 101, 108]. Increased ER stress activates Srebp1c (sterol regulatory element binding protein 1c), an ER bound transcription factor that induces lipid synthesis, which further contributes to fatty liver. Transgenic mice overexpressing human BHMT are resistant to HHcy induced ER stress and are protected from alcohol induced fatty liver [95]. This hypothesis can be tested by measuring ER stress markers such as GRP78 (glucose regulated protein 78) and CHOP (C/EBP homologous protein) in tissue. HHcy is also associated with alteration in sterol metabolism. Mice with one allele of Mthfr deleted (Mthfr +/-, gene in the methyl-folate pathway) have HHcy and increased mrna and protein levels of CYP7A1, an enzyme that mediates the synthesis of bile acids from cholesterol. Bhmt -/- mice have reduced cholesterol concentration in liver and increased bile acid concentrations in liver and adipose tissue. These data suggest that Bhmt deletion enhances the synthesis of bile acids from cholesterol. It is unclear whether HHcy in Bhmt -/- mice is the underlying mechanism for this phenotype. Bhmt deficiency may also result in oxidative stress. Oxidative stress plays a key role in the development of liver injury, and glutathione attenuates oxidative stress by scavenging free radicals. Glutathione (GSH) is made from cysteine, the synthesis of which requires AdoMet (Figure 2.4). GSH becomes glutathione disulfide (GSSG) when oxidized. The ratio of GSH and GSSG within a cell measures cellular toxicity. Since Bhmt deficiency reduces AdoMet by 50%, the synthesis of glutathione may be affected. Although we do not see a change in hepatic cysteine level in Bhmt -/- mice, plasma cysteine concentration is 113
131 significantly reduced during Bhmt deficiency. In addition, a side project looking at the metabolomics of Bhmt -/- mice reveals that Bhmt deficiency reduces both GSH and GSSG in the liver (Table 5.1). Compared to the controls, Bhmt -/- mice have reduced GSH (by 89%) and GSSG (by 20%) concentrations, leading to an 86% reduction in GSH:GSSG ratio. These data suggest that Bhmt -/- mice might be under cellular oxidative stress. The cellular stress may contribute to the later liver injury (fibrosis and HCC) observed in Bhmt -/- mice. The mitochondria are the primary intracellular site of oxygen consumption and the major source of reactive oxygen species. Glutathione maintains the redox balance in mitochondria. Future studies should examine how the reduced GSH:GSSG in Bhmt -/- mice affects the function of mitochondria, whose primary roles are to oxidize fuels and to generate ATP. Table 5.1 Glutathione Levels in Bhmt Mouse Liver WT Mean KO Mean Fold Change P Value Glutathione, 6.53 ± ± reduced (GSH) Glutathione, 1.11 ± ± <0.001 oxidized (GSSG) GSH:GSSG 5.95 ± ± <0.01 Liver was collected from 5-week-old Bhmt +/+ and Bhmt -/- mice after 4 hour fasting; n=6 per group. The relative abundance of metabolites was measured and analyzed by liquid and gas chromatography by Metabolon (Research Triangle Park, NC). At 1 year of age, 64% of Bhmt -/- mice develop hepatic tumors. Histopathology confirms that these tumors are either hepatocellular adenomas or carcinomas. Even those samples that do not have visible tumors have a higher incidence of fat accumulation, cellular alteration and hyperplasia when compared to Bhmt +/+ livers. The pressing question arising 114
132 from these findings is the underlying mechanisms of Bhmt deletion in hepatocarcinogenesis. Understanding the role of BHMT in mitigating liver injury may help to develop effective and safe therapies for fatty liver diseases. Several mechanisms have been proposed linking choline deficiency to HCC (summarized in the background section). Those include increased lipid peroxidation, perturbed PKC pathway, and altered DNA methylation of genes involved in tumor genesis. We plan to investigate each of these hypotheses in ongoing work in our laboratory. To summarize, this dissertation shows that Bhmt deficiency results in adverse hepatic effects such as fatty liver and hepatocellular carcinoma. In the future studies, the metabolic basis of these findings needs to be addressed. In addition, the roles of Bhmt deficiency in ER stress, oxidative stress, apolipoprotein B synthesis, and sterol metabolism need to determined. 5.5 Bhmt deficiency altered methylation potential Compared to wildtype mice, Bhmt -/- mice have a significant reduction in hepatic methylation potential (AdoMet:AdoHcy) - by 76% at 5 weeks of age, and by 91% at 1 year of age. Decreased hepatic AdoMet/AdoHcy could affect all methylation reactions, including the epigenetic modification DNA methylation. Alteration in DNA methylation may alter the expression of genes involved in tumor genesis, leading to altered cancer risks (summarized in the background section). Mat1A and Gnmt knockout mouse models are two examples with disturbed methyl group metabolism that leads to tumor genesis [121, 123]. 115
.")
133 To determine whether methyl group deficiency in Bhmt -/- mice results in altered DNA methylation pattern, and consequently, altered gene expression profile, I use CpG methylation and gene expression arrays. Bhmt -/- mice have a significant reduction in overall DNA methylation (Figure 5.2). However, when closely examining individual probes for CpG sites, no single CpG sites has been significantly different between genotypes with a false discovery rate less than Several factors could contribute to this lack of finding: (1) a small N (n=5) per group, (2) variable methylation pattern within each group, particularly in the Bhmt -/- mice group, and (3) a lack of established bioinformatics methods specific for analyzing CpG arrays. To determine whether the methylation of a CpG site is altered, a methylation-specific-pcr or pyrosequencing for the particular CpG site may be better a approach. In conclusion, I believe there would be epigenetic effect due to Bhmt deficiency. However, I have failed to prove this using CpG methylation arrays. Future studies examining this question require better methods. Figure 5.2 Ratio between methylated and total DNA in Bhmt +/+ and Bhmt -/- mice. Genomic DNA was extracted from 5 week old Bhmt +/+ and Bhmt -/- mouse livers. A portion of the DNA was immunoprecipitated using an antibody specific against 5- methylcytidine. The pulled-down methylated DNA and its own genomic DNA were labeled with cyanine (3 and 5 respectively) and cohybridized onto the CpG methylation array. Compared to the controls, Bhmt -/- mice had similar signal intensity for total genomic DNA, but less methylated DNA signal intensity. The data suggested that Bhmt -/- mice had DNA hypomethylation. 116
134 5.6 Bhmt deficiency altered fuel metabolism within adipocytes Bhmt -/- mice have smaller adipocytes in both gonadal and inguinal depots than do the controls. Factors that contribute to the size of an adipocyte include reduced lipid synthesis (FA and TAG synthesis) and increased lipid breakdown (lipolysis and FA oxidation). We show that Bhmt -/- mice have normal lipolytic and FA oxidation functions. In contrast, Bhmt -/- mice have reduced triacylglycerol synthesis in the isolated mature adipocytes from inguinal depots. These data suggest that the smaller adipocytes in Bhmt -/- mice are due to a problem in lipid synthesis rather than breakdown. However, this study does not define the mechanism by which Bhmt deletion reduces TAG synthesis. In addition, whether Bhmt deficiency results in reduced FA synthesis remains to be determined. Compared to the controls, Bhmt -/- mice oxidize more glucose in the whole body (by indirect calorimetry) and in the isolated adipocytes. Glucose undergoes glycolysis, generating pyruvate, which becomes the fatty acid precursor acetyl CoA. Increased glucose oxidation in Bhmt -/- mice may result in reduced acetyl CoA available for the synthesis of FA that is subsequently incorporated into TAG. Increased glucose oxidation in Bhmt -/- mice may also result in reduced glucose available in the adipose tissue for generating glycerol-3-phosphate, the glucose backbone required for TAG synthesis. To confirm the rate of FA synthesis, the incorporation of radiolabeled acetate or glucose into lipid can be measured in isolated primary adipocytes from Bhmt mice. To confirm the rate of glucose incorporation to lipid, glucose can be given to mice intravenously, and tissues collected for lipid extraction. 117
135 This study also does not determine the rate of adipocyte differentiation. The histology of both gonadal and inguinal fat pads shows that Bhmt -/- mice have a larger number of smaller adipocytes, so it is assumed that the reduced adiposity in Bhmt -/- mice is more likely due to problems in making or storing lipids, rather than problems in adipocyte differentiation. To study adipocyte differentiation, I have attempted to isolate and differentiate preadipocytes from Bhmt mice. However, Bhmt -/- mice have small fat pads, making preadipocyte isolation exceedingly difficult. In addition, the differentiation rate varies significantly from sample to sample such that I have failed to draw any reliable conclusions. This study has identified the possible metabolic bases that contribute to the reduced adiposity in Bhmt -/- mice, such as reduced TAG synthesis and increased glucose oxidation. Future studies need to investigate the direct links between Bhmt deletion and these changes. The FA synthesis rate and adipocyte differentiation in Bhmt mice may also need to be determined. 5.7 Bhmt deficiency altered glucose metabolism Many lines of evidence from this study suggest that Bhmt deficiency alters glucose metabolism. Indirect calorimetry shows that Bhmt -/- mice oxidizes more glucose than fatty acids in the whole body system. Adipocytes isolated from Bhmt -/- mice oxidize more glucose than do those from Bhmt +/+ mice. We do not examine the underlying mechanisms of such findings. Is the increased glucose oxidation in Bhmt -/- mice caused by increased glucose uptake by tissues? Future studies should examine the uptake of labeled glucose into tissues. In addition, glucose metabolism in other tissues in these mice, particularly the liver, has not 118
136 been closely investigated. Bhmt -/- mice have reduced hepatic glucose concentration and glycogen storage, which is assumed to be the consequence of an increased demand of glucose. However, I have not tested whether the reduced glycogen in Bhmt -/- mice is due to decreased glycogen synthesis from glucose or increased glycogen breakdown to release glucose. Whether or not Bhmt deficiency alters glucose metabolism via altering the insulin signaling pathway remains to be examined. Insulin binds to the insulin receptor (IR), which recruits insulin receptor substrates (IRS). IRS activates the PKB/Akt pathway, resulting in inhibition of gluconeogenesis and induction of glycogen synthesis. Several studies provide evidence that betaine/bhmt is associated with altered insulin homeostasis. A study demonstrates that betaine supplementation alleviates insulin resistance in high-fat-fed mouse model by activating Akt and ERK, two major kinases in the insulin signaling pathway, in the adipose tissues [99]. Another study demonstrates that betaine treatment enhances hepatic insulin signaling in high-fat-fed mouse model by activating hepatic IRS1, leading to enhanced glycogen synthesis [98]. Zucker diabetic fatty rats (model for type 2 diabetes) [256] and streprozotocin-diabetic rats (model of type 1 diabetes) [257] both have increased hepatic BHMT activity and Bhmt mrna levels, implying a correlation between BHMT and insulin sensitivity. These studies, together with the evidence from this dissertation, suggest a role of betaine and BHMT in insulin signaling and glucose metabolism. The insulin-signaling pathway in both Bhmt -/- liver and adipose tissue requires additional attention. I have preliminary data showing that Bhmt -/- mice have increased protein levels of hepatic insulin receptors (Figure 5.3). Increased insulin receptors are often associated with increased 119

137 glycogen synthesis, which does not seem to be the case in Bhmt -/- mice. However, it is possible that the increased protein levels of hepatic insulin receptors are responses to the reduced hepatic glucose and glycogen concentrations observed in Bhmt -/- mice. The exact interaction between betaine/bhmt and insulin and glucose metabolism requires additional study. Future studies need to investigate the roles of betaine/bhmt in insulin and glucose homeostasis in closer detail. Does the Bhmt -/- mouse liver take up more glucose? Does the Bhmt -/- mouse have altered insulin signaling pathway? Why does the Bhmt -/- mouse have less glucose and glycogen stored in the liver? Figure 5.3 Insulin receptor (IR) α and ß in Bhmt mouse liver. Livers were collected from 7 week old Bhmt +/+ and Bhmt -/- mice. Insulin receptor α and ß protein levels were quantified using a Western blotting analysis. Bhmt -/- mice expressed higher hepatic insulin receptor protein than did Bhmt +/+ mice. 120
Fat Metabolism, Insulin and MTHFR
 Fat Metabolism, Insulin and MTHFR BCAA, SAMe and ACAT Carolyn Ledowsky Overview of This Presentation 1. Fat Metabolism and MTHFR 2. SAMe and Fat Metabolism 3. Acetyl Co A and Fat Metabolism 4. How to Maintain
Integration Of Metabolism
 Integration Of Metabolism Metabolism Consist of Highly Interconnected Pathways The basic strategy of catabolic metabolism is to form ATP, NADPH, and building blocks for biosyntheses. 1. ATP is the universal
Principles of Anatomy and Physiology
 Principles of Anatomy and Physiology 14 th Edition CHAPTER 25 Metabolism and Nutrition Metabolic Reactions Metabolism refers to all of the chemical reactions taking place in the body. Reactions that break
Oxidation of Long Chain Fatty Acids
 Oxidation of Long Chain Fatty Acids Dr NC Bird Oxidation of long chain fatty acids is the primary source of energy supply in man and animals. Hibernating animals utilise fat stores to maintain body heat,
LIPID METABOLISM. Sri Widia A Jusman Department of Biochemistry & Molecular Biology FMUI
 LIPID METABOLISM Sri Widia A Jusman Department of Biochemistry & Molecular Biology FMUI Lipid metabolism is concerned mainly with fatty acids cholesterol Source of fatty acids from dietary fat de novo
Biosynthesis of Fatty Acids. By Dr.QUTAIBA A. QASIM
 Biosynthesis of Fatty Acids By Dr.QUTAIBA A. QASIM Fatty Acids Definition Fatty acids are comprised of hydrocarbon chains terminating with carboxylic acid groups. Fatty acids and their associated derivatives
9 Metabolic trigger: control of methionine metabolism
 9 Metabolic trigger: control of methionine metabolism M.V. Martinov 1,V.M.Vitvitsky 1,E.V.Mosharov 2,R.Banerjee 2,F.I.Ataullakhanov 1 1 National Research Center for Hematology, Moscow, Russia 125167 2
Exercise prevents hyperhomocysteinemia in a folate-deficient mouse model
 Graduate Theses and Dissertations Graduate College 2010 Exercise prevents hyperhomocysteinemia in a folate-deficient mouse model Joshua Charles Neuman Iowa State University Follow this and additional works
Nutritional and hormonal modulation of diabetesperturbed folate, homocysteine, and methyl group metabolism
 Retrospective Theses and Dissertations Iowa State University Capstones, Theses and Dissertations 2008 Nutritional and hormonal modulation of diabetesperturbed folate, homocysteine, and methyl group metabolism
BIOL2171 ANU TCA CYCLE
 TCA CYCLE IMPORTANCE: Oxidation of 2C Acetyl Co-A 2CO 2 + 3NADH + FADH 2 (8e-s donated to O 2 in the ETC) + GTP (energy) + Heat OVERVIEW: Occurs In the mitochondrion matrix. 1. the acetyl portion of acetyl-coa
Metabolic integration and Regulation
 Metabolic integration and Regulation 109700: Graduate Biochemistry Trimester 2/2016 Assistant Prof. Dr. Panida Khunkaewla kpanida@sut.ac.th School of Chemistry Suranaree University of Technology 1 Overview
Lipid Metabolism. Remember fats?? Triacylglycerols - major form of energy storage in animals
 Remember fats?? Triacylglycerols - major form of energy storage in animals Your energy reserves: ~0.5% carbs (glycogen + glucose) ~15% protein (muscle, last resort) ~85% fat Why use fat for energy? 1 gram
AMINO ACID METABOLISM
 AMINO ACID METABOLISM Synthesis of Urea in Liver The series of reactions that form urea is known as the Urea Cycle or the Krebs-Henseleit Cycle. The urea cycle operates only to eliminate excess nitrogen.
Intermediary metabolism. Eva Samcová
 Intermediary metabolism Eva Samcová Metabolic roles of tissues Four major tissues play a dominant role in fuel metabolism : liver, adipose, muscle, and brain. These tissues do not function in isolation.
Hormones and Target Tissues
 Hormones and Target Tissues The hypothalamus is the coordination center of the endocrine system Hypothalamus is a small region of the forebrain in animals with skulls It receives and integrates nerve signals
Plasma lipoproteins & atherosclerosis by. Prof.Dr. Maha M. Sallam
 Biochemistry Department Plasma lipoproteins & atherosclerosis by Prof.Dr. Maha M. Sallam 1 1. Recognize structures,types and role of lipoproteins in blood (Chylomicrons, VLDL, LDL and HDL). 2. Explain
!!"#$%&'#()*+,-).(&"/+0&'12'
*+,-).(&/+0&'12'") LAB #: Sample Report PATIENT: Sample Patient ID: SEX: Female DOB: 01/01/1985 AGE: 33 CLIENT #: 12345 DOCTOR: Sample Doctor Doctors Data Inc 3755 Illinois Ave St. Charles, IL 60174 U.S.A.!!"#$%&'#()*+,-).(&"/+0&'12'
LAB #: Sample Report PATIENT: Sample Patient ID: SEX: Female DOB: 01/01/1985 AGE: 33 CLIENT #: 12345 DOCTOR: Sample Doctor Doctors Data Inc 3755 Illinois Ave St. Charles, IL 60174 U.S.A.!!"#$%&'#()*+,-).(&"/+0&'12'
Published on Second Faculty of Medicine, Charles University (http://www.lf2.cuni.cz )
") Published on Second Faculty of Medicine, Charles University (http://www.lf2.cuni.cz ) Biochemistry Submitted by Marie Havlová on 8. February 2012-0:00 Syllabus of Biochemistry Mechanisms of enzyme catalysis.
Published on Second Faculty of Medicine, Charles University (http://www.lf2.cuni.cz ) Biochemistry Submitted by Marie Havlová on 8. February 2012-0:00 Syllabus of Biochemistry Mechanisms of enzyme catalysis.
EVERYDAY CLINICAL APPLICATION OF TELOMERE AND AGING SUPPORT PRESENTED BY: Fred Pescatore, MD, MPH, CCN
 EVERYDAY CLINICAL APPLICATION OF TELOMERE AND AGING SUPPORT PRESENTED BY: Fred Pescatore, MD, MPH, CCN Financial Disclosure: Consultant to DaVinci Labs AGENDA Overview of the following: Methylation Telomere
Metabolism of. Sulfur Containing Amino Acids
 Metabolism of Sulfur Containing Amino Acids Methionine S CH 3 CH 2 cysteine CH 2 SH CH 2 CHNH 2 COOH CHNH 2 COOH Essential amino acid Non-polar amio acid Glucogenic amino acid Methionine IMPORTANCE: As
Integrative Metabolism: Significance
 Integrative Metabolism: Significance Energy Containing Nutrients Carbohydrates Fats Proteins Catabolism Energy Depleted End Products H 2 O NH 3 ADP + Pi NAD + NADP + FAD + Pi NADH+H + NADPH+H + FADH2 Cell
CHY2026: General Biochemistry. Lipid Metabolism
 CHY2026: General Biochemistry Lipid Metabolism Lipid Digestion Lipid Metabolism Fats (triglycerides) are high metabolic energy molecules Fats yield 9.3 kcal of energy (carbohydrates and proteins 4.1 kcal)
Energy metabolism - the overview
 Energy metabolism - the overview Josef Fontana EC - 40 Overview of the lecture Important terms of the energy metabolism The overview of the energy metabolism The main pathways of the energy metabolism
Lipids digestion and absorption, Biochemistry II
 Lipids digestion and absorption, blood plasma lipids, lipoproteins Biochemistry II Lecture 1 2008 (J.S.) Triacylglycerols (as well as free fatty acids and both free and esterified cholesterol) are very
number Done by Corrected by Doctor Faisal Al-Khatibe
 number 24 Done by Mohammed tarabieh Corrected by Doctor Faisal Al-Khatibe 1 P a g e *Please look over the previous sheet about fatty acid synthesis **Oxidation(degradation) of fatty acids, occurs in the
In The Name Of God. In The Name Of. EMRI Modeling Group
 In The Name Of God In The Name Of God EMRI Modeling Group Cells work together in functionally related groups called tissues Types of tissues: Epithelial lining and covering Connective support Muscle movement
In glycolysis, glucose is converted to pyruvate. If the pyruvate is reduced to lactate, the pathway does not require O 2 and is called anaerobic
 Glycolysis 1 In glycolysis, glucose is converted to pyruvate. If the pyruvate is reduced to lactate, the pathway does not require O 2 and is called anaerobic glycolysis. If this pyruvate is converted instead
Phospholipids Metabolism
 Chapter VI: Phospholipids Metabolism Dr. Sameh Sarray Hlaoui Phospholipids Features: Amphipatic: - Hydrophobic head: fatty acids - Hydropholic head: P group+ alcohol Composed of alcohol attached by a phosphodiester
Unit IV Problem 3 Biochemistry: Cholesterol Metabolism and Lipoproteins
 Unit IV Problem 3 Biochemistry: Cholesterol Metabolism and Lipoproteins - Cholesterol: It is a sterol which is found in all eukaryotic cells and contains an oxygen (as a hydroxyl group OH) on Carbon number
BBSG 501 Section 4 Metabolic Fuels, Energy and Order Fall 2003 Semester
 BBSG 501 Section 4 Metabolic Fuels, Energy and Order Fall 2003 Semester Section Director: Dave Ford, Ph.D. Office: MS 141: ext. 8129: e-mail: fordda@slu.edu Lecturers: Michael Moxley, Ph.D. Office: MS
Chemical Energy. Valencia College
 9 Pathways that Harvest Chemical Energy Valencia College 9 Pathways that Harvest Chemical Energy Chapter objectives: How Does Glucose Oxidation Release Chemical Energy? What Are the Aerobic Pathways of
Cholesterol and its transport. Alice Skoumalová
 Cholesterol and its transport Alice Skoumalová 27 carbons Cholesterol - structure Cholesterol importance A stabilizing component of cell membranes A precursor of bile salts A precursor of steroid hormones
Oxidation and Methylation in Human Brain: Implications for vaccines
 Oxidation and Methylation in Human Brain: Implications for vaccines 1 Life can be viewed through the perspective of oxidation and reduction, which involves the loss and gain of electrons, respectively.
23.1 Lipid Metabolism in Animals. Chapter 23. Micelles Lipid Metabolism in. Animals. Overview of Digestion Lipid Metabolism in
 Denniston Topping Caret Copyright! The McGraw-Hill Companies, Inc. Permission required for reproduction or display. Chapter 23 Fatty Acid Metabolism Triglycerides (Tgl) are emulsified into fat droplets
General Principles of Endocrine Physiology
 General Principles of Endocrine Physiology By Dr. Isabel S.S. Hwang Department of Physiology Faculty of Medicine University of Hong Kong The major human endocrine glands Endocrine glands and hormones
Retinoid- and diabetes-induced aberrations of methyl group and homocysteine metabolism including alterations of epigenetic regulation
 Graduate Theses and Dissertations Graduate College 2009 Retinoid- and diabetes-induced aberrations of methyl group and homocysteine metabolism including alterations of epigenetic regulation Kelly T. Williams
THE GLUCOSE-FATTY ACID-KETONE BODY CYCLE Role of ketone bodies as respiratory substrates and metabolic signals
 Br. J. Anaesth. (1981), 53, 131 THE GLUCOSE-FATTY ACID-KETONE BODY CYCLE Role of ketone bodies as respiratory substrates and metabolic signals J. C. STANLEY In this paper, the glucose-fatty acid cycle
CHM333 LECTURE 34: 11/30 12/2/09 FALL 2009 Professor Christine Hrycyna
 Lipid Metabolism β-oxidation FA Acetyl-CoA Triacylglycerols (TAGs) and glycogen are the two major forms of stored energy in vertebrates Glycogen can supply ATP for muscle contraction for less than an hour
UNIVERSITY OF PNG SCHOOL OF MEDICINE AND HEALTH SCIENCES DIVISION OF BASIC MEDICAL SCIENCES DISCIPLINE OF BIOCHEMISTRY AND MOLECULAR BIOLOGY
 1 UNIVERSITY OF PNG SCHOOL OF MEDICINE AND HEALTH SCIENCES DIVISION OF BASIC MEDICAL SCIENCES DISCIPLINE OF BIOCHEMISTRY AND MOLECULAR BIOLOGY GLUCOSE HOMEOSTASIS An Overview WHAT IS HOMEOSTASIS? Homeostasis
Lecture 5: Cell Metabolism. Biology 219 Dr. Adam Ross
 Lecture 5: Cell Metabolism Biology 219 Dr. Adam Ross Cellular Respiration Set of reactions that take place during the conversion of nutrients into ATP Intricate regulatory relationship between several
Metabolism. Chapter 5. Catabolism Drives Anabolism 8/29/11. Complete Catabolism of Glucose
 8/29/11 Metabolism Chapter 5 All of the reactions in the body that require energy transfer. Can be divided into: Cell Respiration and Metabolism Anabolism: requires the input of energy to synthesize large
Final Review Sessions. 3/16 (FRI) 126 Wellman (4-6 6 pm) 3/19 (MON) 1309 Surge 3 (4-6 6 pm) Office Hours
 126 Wellman (4-6 6 pm) 3/19 (MON) 1309 Surge 3 (4-6 6 pm) Office Hours") Final Review Sessions 3/16 (FRI) 126 Wellman (4-6 6 pm) 3/19 (MON) 1309 Surge 3 (4-6 6 pm) Office ours 3/14 (WED) 9:30 11:30 am (Rebecca) 3/16 (FRI) 9-11 am (Abel) Final ESSENTIALS Posted Lecture 20 ormonal
Final Review Sessions 3/16 (FRI) 126 Wellman (4-6 6 pm) 3/19 (MON) 1309 Surge 3 (4-6 6 pm) Office ours 3/14 (WED) 9:30 11:30 am (Rebecca) 3/16 (FRI) 9-11 am (Abel) Final ESSENTIALS Posted Lecture 20 ormonal
PHOSPHOLIPIDS METABOLISM. BY Dr. Walid Said Zaki Dr. Marwa Ali LECTURER OF BIOCHEMISTRY AND MOLECULAR BIOLOGY
 PHOSPHOLIPIDS METABOLISM BY Dr. Walid Said Zaki Dr. Marwa Ali LECTURER OF BIOCHEMISTRY AND MOLECULAR BIOLOGY 1. State the definition and classification of Phospholipids. 2. Describe the general structure
Metabolism of cardiac muscle. Dr. Mamoun Ahram Cardiovascular system, 2013
 Metabolism of cardiac muscle Dr. Mamoun Ahram Cardiovascular system, 2013 References This lecture Mark s Basic Medical Biochemistry, 4 th ed., p. 890-891 Hand-out Why is this topic important? Heart failure
Chapter 26 Biochemistry 5th edition. phospholipids. Sphingolipids. Cholesterol. db=books&itool=toolbar
 http://www.ncbi.nlm.nih.gov/sites/entrez? db=books&itool=toolbar 1 The surface of a soap bubble is a bilayer formed by detergent molecules 2 Chapter 26 Biochemistry 5th edition phospholipids Sphingolipids
Electron Transport Chain and Oxidative phosphorylation
 Electron Transport Chain and Oxidative phosphorylation So far we have discussed the catabolism involving oxidation of 6 carbons of glucose to CO 2 via glycolysis and CAC without any oxygen molecule directly
Metabolism of acylglycerols and sphingolipids. Martina Srbová
 Metabolism of acylglycerols and sphingolipids Martina Srbová Types of glycerolipids and sphingolipids 1. Triacylglycerols function as energy reserves adipose tissue (storage of triacylglycerol), lipoproteins
Cholesterol metabolism. Function Biosynthesis Transport in the organism Hypercholesterolemia
 Cholesterol metabolism Function Biosynthesis Transport in the organism Hypercholesterolemia - component of all cell membranes - precursor of bile acids steroid hormones vitamin D Cholesterol Sources: dietary
CARBOHYDRATE METABOLISM 1
 CARBOHYDRATE METABOLISM 1 web 2017 József Mandl Strategy of metabolism 1 Strategy of metabolism to extract energy ( hydrogen ) from the environment to store the energy excess to store hydrogen CH 3 O 2
OVERVIEW M ET AB OL IS M OF FR EE FA TT Y AC ID S
 LIPOLYSIS LIPOLYSIS OVERVIEW CATABOLISM OF FREE FATTY ACIDS Nonesterified fatty acids Source:- (a) breakdown of TAG in adipose tissue (b) action of Lipoprotein lipase on plasma TAG Combined with Albumin
ANSC/NUTR 618 LIPIDS & LIPID METABOLISM Lipoprotein Metabolism
 ANSC/NUTR 618 LIPIDS & LIPID METABOLISM Lipoprotein Metabolism I. Chylomicrons (exogenous pathway) A. 83% triacylglycerol, 2% protein, 8% cholesterol plus cholesterol esters, 7% phospholipid (esp. phosphatidylcholine)
Estrogen. Cysteine Prevents oxidation of estrogen into a dangerous form that causes breast cancer. 29,30,31
 Cysteine Prevents oxidation of estrogen into a dangerous form that causes breast cancer. 29,30,31 Estrogen lowers risk of zinc de ciency; dependent proteins metabolize estrogen. 26,27,28 Magnesium Cofactor
Roles of Lipids. principal form of stored energy major constituents of cell membranes vitamins messengers intra and extracellular
 Roles of Lipids principal form of stored energy major constituents of cell membranes vitamins messengers intra and extracellular = Oxidation of fatty acids Central energy-yielding pathway in animals. O
Biochemistry: A Short Course
 Tymoczko Berg Stryer Biochemistry: A Short Course Second Edition CHAPTER 27 Fatty Acid Degradation Dietary Lipid (Triacylglycerol) Metabolism - In the small intestine, fat particles are coated with bile
Moh Tarek. Razi Kittaneh. Jaqen H ghar
 14 Moh Tarek Razi Kittaneh Jaqen H ghar Naif Karadsheh Gluconeogenesis is making glucose from non-carbohydrates precursors. Although Gluconeogenesis looks like Glycolysis in many steps, it is not the simple
Medical Biochemistry and Molecular Biology department
 Medical Biochemistry and Molecular Biology department Cardiac Fuels [Sources of energy for the Cardiac muscle] Intended learning outcomes of the lecture: By the end of this lecture you would be able to:-
ANSC/NUTR 618 Lipids & Lipid Metabolism
 I. Overall concepts A. Definitions ANC/NUTR 618 Lipids & Lipid Metabolism 1. De novo synthesis = synthesis from non-fatty acid precursors a. Carbohydrate precursors (glucose, lactate, and pyruvate) b.
BCM 221 LECTURES OJEMEKELE O.
 BCM 221 LECTURES BY OJEMEKELE O. OUTLINE INTRODUCTION TO LIPID CHEMISTRY STORAGE OF ENERGY IN ADIPOCYTES MOBILIZATION OF ENERGY STORES IN ADIPOCYTES KETONE BODIES AND KETOSIS PYRUVATE DEHYDROGENASE COMPLEX
BIOL212 Biochemistry of Disease. Metabolic Disorders - Obesity
 BIOL212 Biochemistry of Disease Metabolic Disorders - Obesity Obesity Approx. 23% of adults are obese in the U.K. The number of obese children has tripled in 20 years. 10% of six year olds are obese, rising
What systems are involved in homeostatic regulation (give an example)?
?") 1 UNIVERSITY OF PNG SCHOOL OF MEDICINE AND HEALTH SCIENCES DIVISION OF BASIC MEDICAL SCIENCES DISCIPLINE OF BIOCHEMISTRY AND MOLECULAR BIOLOGY GLUCOSE HOMEOSTASIS (Diabetes Mellitus Part 1): An Overview
1 UNIVERSITY OF PNG SCHOOL OF MEDICINE AND HEALTH SCIENCES DIVISION OF BASIC MEDICAL SCIENCES DISCIPLINE OF BIOCHEMISTRY AND MOLECULAR BIOLOGY GLUCOSE HOMEOSTASIS (Diabetes Mellitus Part 1): An Overview
Integration Of Metabolism
 Integration Of Metabolism Metabolism Consist of Highly Interconnected Pathways The basic strategy of catabolic metabolism is to form ATP, NADPH, and building blocks for biosyntheses. 1. ATP is the universal
number Done by Corrected by Doctor Nayef Karadsheh
 number 13 Done by Asma Karameh Corrected by Saad hayek Doctor Nayef Karadsheh Gluconeogenesis This lecture covers gluconeogenesis with aspects of: 1) Introduction to glucose distribution through tissues.
Metabolic Syndrome. DOPE amines COGS 163
 Metabolic Syndrome DOPE amines COGS 163 Overview - M etabolic Syndrome - General definition and criteria - Importance of diagnosis - Glucose Homeostasis - Type 2 Diabetes Mellitus - Insulin Resistance
Chapter 10. Introduction to Nutrition and Metabolism, 3 rd edition David A Bender Taylor & Francis Ltd, London 2002
 Chapter 10 Introduction to Nutrition and Metabolism, 3 rd edition David A Bender Taylor & Francis Ltd, London 2002 Chapter 10: Integration and Control of Metabolism Press the space bar or click the mouse
Multiple choice: Circle the best answer on this exam. There are 12 multiple choice questions, each question is worth 3 points.
 CHEM 4420 Exam 4 Spring 2015 Dr. Stone Page 1 of 6 Name Use complete sentences when requested. There are 120 possible points on this exam. Therefore there are 20 bonus points. Multiple choice: Circle the
7 Pathways That Harvest Chemical Energy
 7 Pathways That Harvest Chemical Energy Pathways That Harvest Chemical Energy How Does Glucose Oxidation Release Chemical Energy? What Are the Aerobic Pathways of Glucose Metabolism? How Is Energy Harvested
LIPID METABOLISM
 LIPID METABOLISM LIPOGENESIS LIPOGENESIS LIPOGENESIS FATTY ACID SYNTHESIS DE NOVO FFA in the blood come from :- (a) Dietary fat (b) Dietary carbohydrate/protein in excess of need FA TAG Site of synthesis:-
CBS Deficient Homocystinuria.
 CBS Deficient Homocystinuria. Kenneth N. Maclean PhD University of Colorado School of Medicine Department of Pediatrics The methionine cycle Alternative metabolic fates for Hcy Extrusion into the extracellular
Nitrogen Metabolism. Pratt and Cornely Chapter 18
 Nitrogen Metabolism Pratt and Cornely Chapter 18 Overview Nitrogen assimilation Amino acid biosynthesis Nonessential aa Essential aa Nucleotide biosynthesis Amino Acid Catabolism Urea Cycle Juicy Steak
Dietary supplementation in treating non-alcoholic fatty liver disease Dr. Ahmad Saedi Associate Professor School of Nutritional Sciences and
 Dietary supplementation in treating non-alcoholic fatty liver disease Dr. Ahmad Saedi Associate Professor School of Nutritional Sciences and Dietetics Tehran University of Medical Sciences Honorary Academic
Nitrogen Metabolism. Overview
 Nitrogen Metabolism Pratt and Cornely Chapter 18 Overview Nitrogen assimilation Amino acid biosynthesis Nonessential aa Essential aa Nucleotide biosynthesis Amino Acid Catabolism Urea Cycle Juicy Steak
Fatty Acid and Triacylglycerol Metabolism 1
 Fatty Acid and Triacylglycerol Metabolism 1 Mobilization of stored fats and oxidation of fatty acids Lippincott s Chapter 16 What is the first lecture about What is triacylglycerol Fatty acids structure
One-Carbon Metabolism and Breast Cancer
 One-Carbon Metabolism and Breast Cancer A DISSERTATION SUBMITTED TO THE FACULTY OF THE GRADUATE SCHOOL OF THE UNIVERSITY OF MINNESOTA BY MAKI INOUE-CHOI IN PARTIAL FULFILLMENT OF THE REQUIREMENTS FOR THE
Fatty acid breakdown
 Fatty acids contain a long hydrocarbon chain and a terminal carboxylate group. Most contain between 14 and 24 carbon atoms. The chains may be saturated or contain double bonds. The complete oxidation of
Companion to Biosynthesis of Ketones & Cholesterols, Regulation of Lipid Metabolism Lecture Notes
 Companion to Biosynthesis of Ketones & Cholesterols, Regulation of Lipid Metabolism Lecture Notes The major site of acetoacetate and 3-hydorxybutyrate production is in the liver. 3-hydorxybutyrate is the
Midterm 2. Low: 14 Mean: 61.3 High: 98. Standard Deviation: 17.7
 Midterm 2 Low: 14 Mean: 61.3 High: 98 Standard Deviation: 17.7 Lecture 17 Amino Acid Metabolism Review of Urea Cycle N and S assimilation Last cofactors: THF and SAM Synthesis of few amino acids Dietary
Glucose is the only source of energy in red blood cells. Under starvation conditions ketone bodies become a source of energy for the brain
 Glycolysis 4 / The Text :- Some Points About Glucose Glucose is very soluble source of quick and ready energy. It is a relatively stable and easily transported. In mammals, the brain uses only glucose
Week 3 The Pancreas: Pancreatic ph buffering:
 Week 3 The Pancreas: A gland with both endocrine (secretion of substances into the bloodstream) & exocrine (secretion of substances to the outside of the body or another surface within the body) functions
CHE 242 Exam 3 Practice Questions
 CHE 242 Exam 3 Practice Questions Glucose metabolism 1. Below is depicted glucose catabolism. Indicate on the pathways the following: A) which reaction(s) of glycolysis are irreversible B) where energy
Cell Signaling part 2
 15 Cell Signaling part 2 Functions of Cell Surface Receptors Other cell surface receptors are directly linked to intracellular enzymes. The largest family of these is the receptor protein tyrosine kinases,
Integration of Metabolism 1. made by: Noor M. ALnairat. Sheet No. 18
 Integration of Metabolism 1 made by: Noor M. ALnairat Sheet No. 18 Data :24/11/2016 SLIDE 2: Metabolism Consist of Highly Interconnected Pathways The basic strategy of catabolic metabolism is to form ATP,
Nutrition, Metabolism, and Body Temperature Regulation Outline PART 1: NUTRIENTS (pp ; Figs ; Table 24.1) 24.
 24.") Nutrition, Metabolism, and Body Temperature Regulation Outline PART 1: NUTRIENTS (pp. 915 922; Figs. 24.1 24.3; Table 24.1) 24.1 Carbohydrates, lipids, and proteins supply energy and are used as building
Nutrition, Metabolism, and Body Temperature Regulation Outline PART 1: NUTRIENTS (pp. 915 922; Figs. 24.1 24.3; Table 24.1) 24.1 Carbohydrates, lipids, and proteins supply energy and are used as building
Metabolic Dr Elizabeth Mumper
 MINDD Forum General Session Metabolic Elizabeth Mumper, MD Director of Medical Education Autism Research Institute May 2009 Vicious Cycles Food sensitivities Gut inflammation Malabsorption oxidative stress
Biochemistry: A Short Course
 Tymoczko Berg Stryer Biochemistry: A Short Course Second Edition CHAPTER 31 Amino Acid Synthesis 2013 W. H. Freeman and Company Chapter 31 Outline Although the atmosphere is approximately 80% nitrogen,
GENERAL CHARACTERISTICS OF THE ENDOCRINE SYSTEM FIGURE 17.1
 GENERAL CHARACTERISTICS OF THE ENDOCRINE SYSTEM FIGURE 17.1 1. The endocrine system consists of glands that secrete chemical signals, called hormones, into the blood. In addition, other organs and cells
Nutrients. Chapter 25 Nutrition, Metabolism, Temperature Regulation
 Chapter 25 Nutrition, Metabolism, Temperature Regulation 25-1 Nutrients Chemicals used by body to produce energy, provide building blocks or function in other chemical reactions Classes Carbohydrates,
Biochemistry: A Short Course
 Tymoczko Berg Stryer Biochemistry: A Short Course Second Edition CHAPTER 30 Amino Acid Degradation and the Urea Cycle 2013 W. H. Freeman and Company Chapter 30 Outline Amino acids are obtained from the
Energy Production In A Cell (Chapter 25 Metabolism)
") Energy Production In A Cell (Chapter 25 Metabolism) Large food molecules contain a lot of potential energy in the form of chemical bonds but it requires a lot of work to liberate the energy. Cells need
Energy Production In A Cell (Chapter 25 Metabolism) Large food molecules contain a lot of potential energy in the form of chemical bonds but it requires a lot of work to liberate the energy. Cells need
I) Development: tissue differentiation and timing II) Whole Chromosome Regulation
 Development: tissue differentiation and timing II) Whole Chromosome Regulation") Epigenesis: Gene Regulation Epigenesis : Gene Regulation I) Development: tissue differentiation and timing II) Whole Chromosome Regulation (X chromosome inactivation or Lyonization) III) Regulation during
Epigenesis: Gene Regulation Epigenesis : Gene Regulation I) Development: tissue differentiation and timing II) Whole Chromosome Regulation (X chromosome inactivation or Lyonization) III) Regulation during
ENERGY FROM INGESTED NUTREINTS MAY BE USED IMMEDIATELY OR STORED
 QUIZ/TEST REVIEW NOTES SECTION 1 SHORT TERM METABOLISM [METABOLISM] Learning Objectives: Identify primary energy stores of the body Differentiate the metabolic processes of the fed and fasted states Explain
Propagation of the Signal
 OpenStax-CNX module: m44452 1 Propagation of the Signal OpenStax College This work is produced by OpenStax-CNX and licensed under the Creative Commons Attribution License 3.0 By the end of this section,
Nitrogen Metabolism. Overview
 Nitrogen Metabolism Pratt and Cornely Chapter 18 Overview Nitrogen assimilation Amino acid biosynthesis Nonessential aa Essential aa Nucleotide biosynthesis Amino Acid Catabolism Urea Cycle Juicy Steak
Lehninger 5 th ed. Chapter 17
 Lehninger 5 th ed. Chapter 17 December 26, 2010 Prof. Shimon Schuldiner Email: Shimon.Schuldiner@huji.ac.il Phone: 6585992 CHAPTER 17 Fatty Acid Catabolism Key topics: How fats are digested in animals
5.0 HORMONAL CONTROL OF CARBOHYDRATE METABOLISM
 5.0 HORMONAL CONTROL OF CARBOHYDRATE METABOLISM Introduction: Variety of hormones and other molecules regulate the carbohydrates metabolism. Some of these have already been cited in previous sections.
Hormonal regulation of. Physiology Department Medical School, University of Sumatera Utara
 Hormonal regulation of nutrient metabolism Physiology Department Medical School, University of Sumatera Utara Homeostasis & Controls Successful compensation Homeostasis reestablished Failure to compensate
MILK BIOSYNTHESIS PART 3: FAT
 MILK BIOSYNTHESIS PART 3: FAT KEY ENZYMES (FROM ALL BIOSYNTHESIS LECTURES) FDPase = fructose diphosphatase Citrate lyase Isocitrate dehydrogenase Fatty acid synthetase Acetyl CoA carboxylase Fatty acyl
S-adenosylmethionine metabolism and liver disease
 CONCISE REVIEW S-adenosylmethionine metabolism and liver disease., 2013; 12 (2): 183-189 March-April, Vol. 12 No.2, 2013: 183-189 183 S-adenosylmethionine metabolism and liver disease José M Mato,* M Luz
AMINO ACID METABOLISM. Sri Widia A Jusman Dept. of Biochemistry & Molecular Biology FMUI
 AMINO ACID METABOLISM Sri Widia A Jusman Dept. of Biochemistry & Molecular Biology FMUI Amino acids derived from dietary protein absorbed from intestine through blood taken up by tissues used for biosynthesis
Hormones. Prof. Dr. Volker Haucke Institut für Chemie-Biochemie Takustrasse 6
 Hormones Prof. Dr. Volker Haucke Institut für Chemie-Biochemie Takustrasse 6 Tel. 030-8385-6920 (Sekret.) 030-8385-6922 (direkt) e-mail: vhaucke@chemie.fu-berlin.de http://userpage.chemie.fu-berlin.de/biochemie/aghaucke/teaching.html