Biases in clinical research. Seungho Ryu, MD, PhD Kanguk Samsung Hospital, Sungkyunkwan University
|
|
|
- Brendan Taylor
- 5 years ago
- Views:
Transcription

1 Biases in clinical research Seungho Ryu, MD, PhD Kanguk Samsung Hospital, Sungkyunkwan University
2 Learning objectives Understand goal of measurement and definition of accuracy Describe the threats to causal inferences in clinical studies Understand the role of random variability in clinical studies Describe, understand, and learn how to control the 3 main types of bias: Confounding Information bias / measurement error Selection bias Discuss the concept of generalizability of study results DCR Chapters 4 and 9 2
3 0 Density Issues with Measurement systolic blood pressure, mmhg
4 Planning measurements: precision and accuracy Measure Measure A F B G Measure C Measure Measure
5 Measure factors To answer the research question, an epidemiologist needs to measure for each individual: A exposure factors B outcome factors C confounding factors F mediating factors G modifying factors
6 Goal of measurement Capture the TRUE value of the factor Measurement of factors is often imperfect Imperfect measurement of a Continuous variable measurement error Discrete variable misclassification Note: the precision of clincal measurements maybe very different from the precision of research measurements

7 Yajnik SC, Yudkin JS. Lancet. 2004;363:163
8 What do we measure? The factor itself Direct measure Example: body fat mass A surrogate for the factor Indirect measure Example: body mass index Leading to: How well does the surrogate measure the factor? Factors with multiple correlates Example: socioeconomic status
9 Sources of variability in measuring a factor Within person variability Error due to the measurement tool Examples of measurement tools: bathroom scale; blood pressure cuff (sphygmomanometer); a diet questionnaire; a laboratory assay Error due to the observer Examples of observers: participant, interviewer/observer, abstractor Error in recording the measurement
10 Error components Measured value = True value + Error Error = Bias + Random Error Systematic component of the error Random component of the error
11 Bias Systematic difference between the true value and the measured value How close is the measured value to the true value? Synonym for bias: lack of validity Validity on average, the measurement estimates the true measurement
12 Real example of random error! Body weight, bathroom scale True body weight 180 lbs Inconsistent scale, but set correctly at 0 lbs Moments apart: 1 st measurement: lbs 2 nd measurement: lbs 3 rd measurement: lbs 4 th measurement: lbs

13 Real example of bias! Body weight, bathroom scale True body weight 180 lbs Consistent scale, but fail to set it at 0 lbs: reads -5 lbs Moments apart: 1 st measurement: 175 lbs 2 nd measurement: 175 lbs 3 rd measurement: 175 lbs 4 th measurement: 175 lbs
14 Measure has random error, but no bias If the measure has no bias, the average of the measured values for the replicates will approach the true value as the number of replicates increases. Distribution of the measured values for the replicates. Body weight Truth 180 lbs
15 Measure has random error, but no bias The extent of the random error can be small or large (different precision) Synonyms for the extent of random error: Variability Spread Dispersion Scale 1 Scale 2 Body weight Truth 180 lbs
16 Measure has random error and bias If the measure has bias, the average of the measured values for the replicates will approach the same value, but not the true value, as the number of replicates increases. Body weight Truth Mean of the values of the replicates 180 lbs 185 lbs
17 Accuracy =lack of bias + high precision High bias Low random error Low bias High random error
18 The Precision and Accuracy of Measurements Precision Accuracy Definition Best way to assess The degree to which a variable has nearly the same value when measured several times Comparison among repeated measures The degree to which a variable actually represents what it is supposed to represent Comparison with a reference standard Value to study Increase power to detect effects Increase validity of conclusions Threatened by Random error(chance) contributed by The observer The subject The instrument Systematic error(bias) contributed by The observer The subject The instrument
19 Threats to causal inference Truth in the Universe infer Truth in the Study infer Findings in the study Research Question Random and systematic error Study Plan Random and systematic error Actual Study Target Population Intended Sample Actual subjects Design Implementation Phenomena of interest Intended variables Actual measurement s EXTERNAL VALIDITY INTERNAL VALIDITY 19
20 Threats to causal inference Lack of precision Random variability - by chance We may observe an association that does not exist or may fail to observe an existing association Lack of internal validity Bias - Systematic errors Confounding Information bias / measurement error Selection bias 20
21 Threats to causal inference (continued) Incorrect assessment of the direction of causality: We believe that A B But, in reality A B Lack of external validity (generalizability): True effect in the study population But, does not apply to other populations 21
22
23 Precision vs. validity Meta-analysis of long-term large randomized controlled trials of statins and coronary heart disease endpoints Cheung BMY, et al. Br J Clin Pharmacol 2004;57:
24 Streptokinase in AMI Meta-analysis Lau J, et al. N Engl J Med 1992;327:
25 Smoking and CVD mortality NHANES II Mortality Study Sample size: 9,205 Length of follow-up: 16 years Prevalence at baseline Current smokers: 32.2% Former smokers: 26.8% Never smokers: 41.0% Hazard ratio for all-cause mortality: Current vs. never smokers: 2.08 (95% CI ) Former vs. never smokers: 1.32 (95% CI ) 25
26 Smoking and CVD mortality NHANES II Mortality Study Hazard ratios for mortality in random samples of N = 500 Ex-smokers Curr. smk [1] [2] [3] [4] [5] [6] [7] [8] [9] [10] [11] [12] [13] [14] [15] [16] [17] [18] [19] [20]
27 Smoking and CVD mortality NHANES II Mortality Study Hazard ratios for mortality comparing current to never smokers N = 500 N = 1, N = 5,000 N = 9,205
28 Smoking and CVD mortality NHANES II Mortality Study Hazard ratios for mortality comparing former to never smokers N = 500 N = 1, N = 5,000 N = 9,205 28
29 Bias definition Deviation of results or inferences from the truth Any trend in the collection, analysis, interpretation, publication, or review of data that can lead to conclusions that are systematically different from the truth Last JM, ed. A dictionary of epidemiology, 4th ed. Oxford, Oxford University Press,
30 Bias classification Many different biases have been described Sackett DL. Bias in analytic research. J Chron Dis 1979;32:51-63 Delgado-Rodriguez M, Llorca J. J Epidemiol Community Health 2004;58: general types of biases: Confounding Misclassification / Information bias Selection bias 30
31 From causal effect to data Phillips CV. Epidemiology 2003;14:

32 Direction of Bias (I)
33 Direction of Bias (II)
34 From causal effect to data
35 Concepts of confounding MI No MI Coffee No coffee Odd ratio (OR)= Smokers Nonsmokers MI No MI MI No MI Coffee No Coffee OR in smokers= OR in nonsmokers=
36 Concepts of confounding Response (R) Exposure (E)
37 Concepts of confounding Response (R) C is associated with E C causes R CONFOUNDING C = 1 C = 0 Exposure (E)
38 Concepts of confounding Response (R) C is associated with E C causes R CONFOUNDING C = 1 C = 0 Exposure (E)
39 Confounding Smith GD, et al. BMJ 1997;315:


40 Asking about sex Smith GD, et al. BMJ 1997;315:

41 Comparability of exposure groups Smith GD, et al. BMJ 1997;315:
42 Sex and mortality Results Smith GD, et al. BMJ 1997;315:

43 Sex and mortality Recommendations! Smith GD, et al. BMJ 1997;315:
44 Causal associations Low sex frequency Death from myocardial infarction Low sex frequency Death from myocardial infarction Poor health

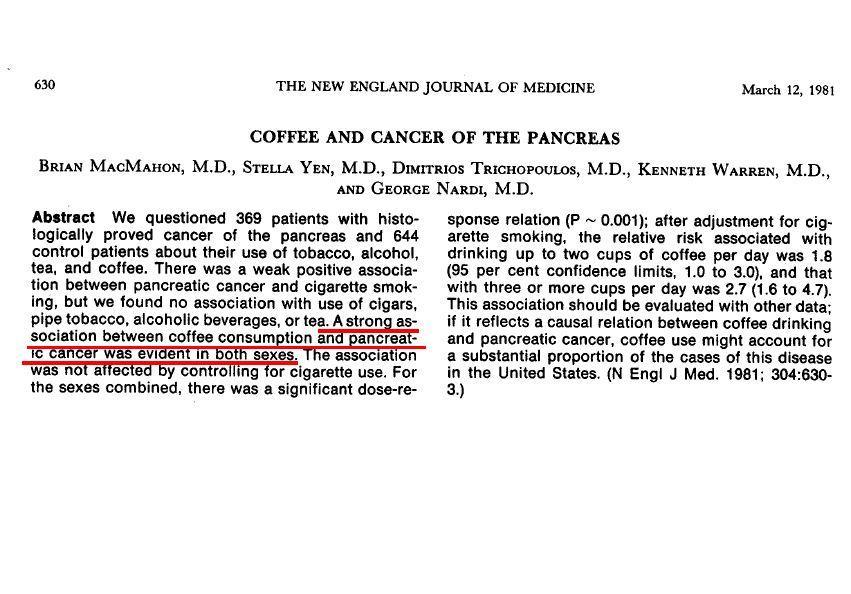
45 Marmor M, et al. Lancet 1982;1:

46 Hypotheses Marmor M, et al. Lancet 1982;1:

47 Methods Marmor M, et al. Lancet 1982;1:
48 Results and interpretation Marmor M, et al. Lancet 1982;1:
49 Causal diagram Sexual behavior HIV infection AIDS Use of amyl nitrite 49
50 Confounders are factors that Cause the disease (or are surrogates for causal factors) AND Have a different distribution in exposed and unexposed populations (i.e., are associated with the exposure in the study sample) Both conditions need to be present to have confounding We will also need the additional condition that the confounder is not affected by the exposure
51 Amyl nitrite, HIV infection, and AIDS Sexual behavior HIV infection AIDS Use of amyl nitrite HIV infection causes AIDS HIV infection and use of amyl nitrite were associated in homosexual men 51

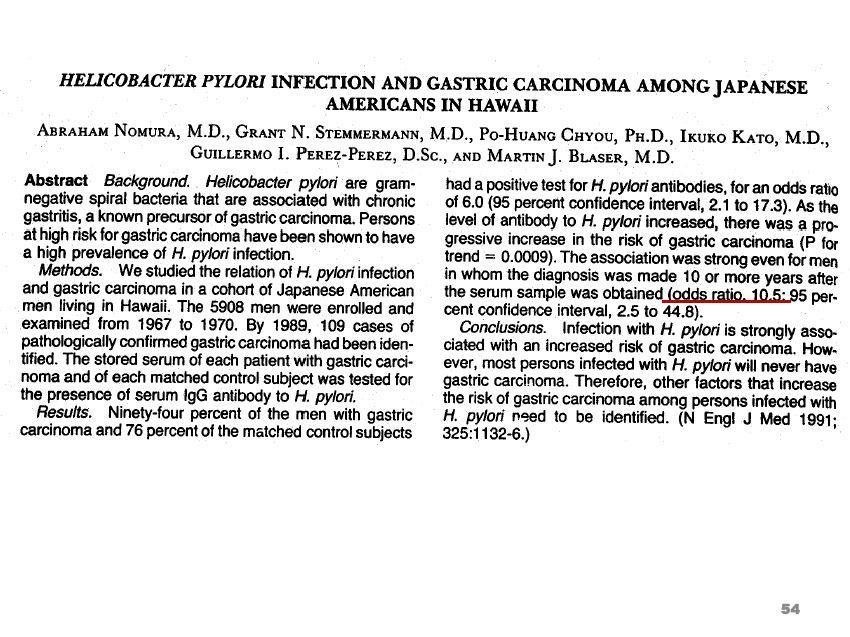
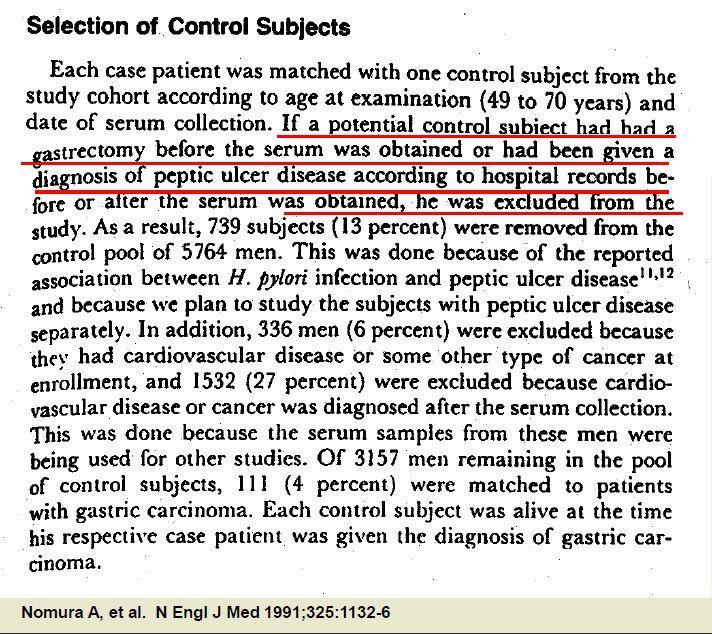
52 Enrollment and follow-up in HERS Grady D, et al. JAMA 2002;288:
53 Grady D, et al. JAMA 2002;288:
54 54
55 van Vollenhoven, et al. Lupus 1999;8:

56 56

57 Jiang R, et al. JAMA 2002;288:
58 Confounders have to 1. Cause the disease (or be a surrogate measure of a cause) AND 2. Be associated with exposure (i.e., be distributed differently between exposed and unexposed), AND 3. Not affected by exposure (i.e., not be an intermediate variable in the causal pathway) Note: the 3 conditions are necessary for a variable to be a confounder 58
59 Causal diagram Physical activity, HDL cholesterol, and MI Low physical activity Low HDL cholesterol Myocardial infarction Low physical activity is a cause low HDL cholesterol Low HDL cholesterol is a cause of myocardial infarction HOWEVER, low HDL cholesterol is an intermediate variable in the causal pathway between physical activity and myocardial infarction 59
60
61 Uncontrolled confounding Unmeasured confounders Unknown confounders Known confounders that are too expensive or difficult to measure Residual confounding Confounder is measured imperfectly, and cannot be controlled completely 61

62 Results and interpretation Marmor M, et al. Lancet 1982;1:

63 Confounding by indication Hak E, et al. J Epidemiol Community Health 2002;56:
64 In practice (I) Prior knowledge on the biological and other causal relationships is needed to properly identify which variables to adjust for Do NOT apply statistical criteria to decide if the conditions for confounding are present Testing for the association of confounder with exposure and of confounder with disease Stepwise selection procedures Consider if exposed and unexposed subjects are comparable with respect to their risk of disease (except for exposure) 64
65 In practice (II) Consider which determinants of disease may be responsible for the lack of comparability Elaborate causal diagram Identify causal factors that may be different between exposed and unexposed Obtain information on potential confounders Measuring confounders with error will result in residual confounding after adjustment Use statistical techniques to adjust for potential confounders 65
66 Methods to control for confounding In the design of the study Randomization Restriction Matching primarily in case-control studies In the analysis Standardization Stratification Multivariate models Propensity scores Inverse probability weighting Sensitivity analysis 66
67 Restriction Restrict eligibility into the study to one category of the confounder Advantages Convenient, inexpensive and easy to implement Adequate control of confounder Simple analysis Disadvantages Cannot evaluate effect modification May limit generalizability For continuous variables, need to group the restriction variable (possibility of residual confounding) Can only be applied to a small number of variables 67
68 Restriction to lifetime non-smokers to avoid confounding by smoking
69 Kabat GC, et al. Cancer 1986;57:
70 From causal effect to data Phillips CV. Epidemiology 2003;14:
71 Selection bias The measure of association observed in the study sample is different to the measure of association in the source population Selection into the study is affected both by the exposure (or by a cause of the exposure) AND by a cause of the outcome (in cohort studies) or by the outcome (in case-control studies) Source population Study population Exposed Disease No disease Disease No disease A B Exposed b a C D Nonexposed Nonexposed c d 71
72 폭로군 (1000 명 ) 비폭로군 (2000 명 ) Risk = = 0.01 Risk = = 폭로군에서 risk 0.01 Relative risk = = 비폭로군에서 risk = 4
73 폭로군 (1000 명 ) 비폭로군 (2000 명 ) 환자군 : 15 명 ( 폭로 Hx 에서 10 명, 비폭로 Hx 에서 5 명 ) 대조군 : 15 명 ( 폭로 Hx 에서 10 명, 비폭로 Hx 에서 5 명 ) 환자군에서폭로 odd = 대조군에서폭로 odd = = 2 = 2 Odds ratio = 2 2 = 1
74 예 1) Fat intake 은대장암의위험요인인가? 환자군 : multi-center 대장암신환 대조군 : 대장암이없는종검수진자
75 폭로군 (1000 명 ) 비폭로군 (2000 명 ) 환자군 : 15 명 ( 폭로 Hx 에서 10 명, 비폭로 Hx 에서 5 명 ) 대조군 : 15 명 ( 폭로 Hx 에서 1 명, 비폭로 Hx 에서 14 명 ) 환자군에서폭로 odd = 대조군에서폭로 odd = = 2 = Odds ratio = = 28
76 예 2) 흡연은방광암의위험요인인가? 환자군 : multi-center 방광암신환 대조군 : 방광암이없는종검수진자
77 폭로군 (1000 명 ) 비폭로군 (2000 명 ) 환자군 : 15 명 ( 폭로군에서 10 명, 비폭로군에서 5 명 ) 대조군 : 15 명 ( 폭로군에서 5 명, 비폭로군에서 10 명 ) 환자군에서폭로 odd = 대조군에서폭로 odd = = 2 = 0.5 Odds ratio = = 4
78
79

80 Selection bias in Case-Control Study
81 커피음용비율 (%) 환자군대조군일반인
82
83

84 Selection bias in Case-Control Study
85 Selection bias in cohort studies Immigrative selection bias Selection into the cohort is affected both by exposure (or by a cause of exposure) and by risk of disease Emigrative selection bias Selection out of the cohort (losses to follow-up) are affected both by exposure (or by a cause of exposure) and by risk of disease 85
86 86
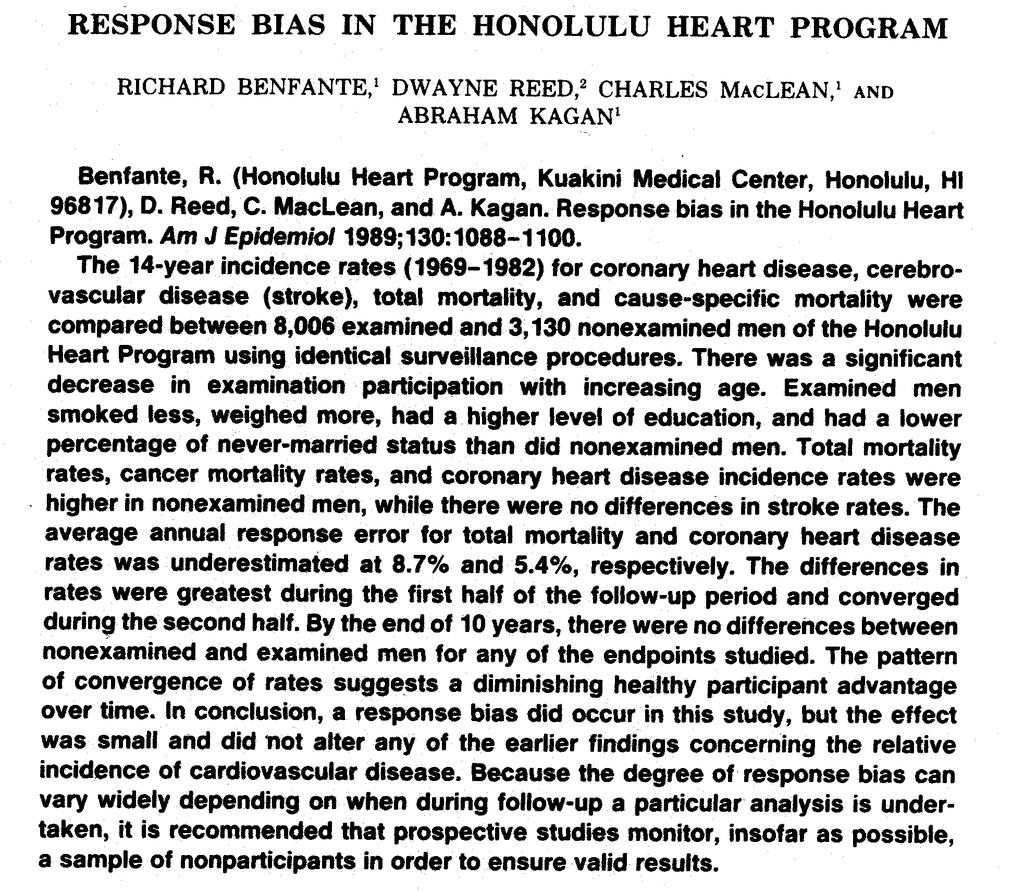
87 Honolulu Heart Study Rate of CHD, stroke and total mortality in 11,136 men of Japanese ancestry eligible in ,006 men examined and 3,130 not examined (60% completed a mailed questionnaire) Baseline smoking as current, ever or never All 11,136 followed through
88 Differential smoking by participation Examined Unexamined N = 8,006 N = 3,130 Smoking: Ever 69% 72% Current 48% 53% Age-standardized %, p value < 0.01 Selection into cohort associated with smoking 88
89 Non-participants Participants Benfante R, et al. Am J Epidemiol 1989;130:
90 Rate ratios for current smoking Examined (Study) N = 8,006 Un-Examined N = 3,130 Source N = 11,136 Total CVD Stroke

91 Grady D et al, JAMA 2002;288:49-57

92 Grady D et al, JAMA 2002;288:49-57
93 CHD events since randomization HERS and HERS II Grady D, et al. JAMA 2002;288:

94 Psaty BM, et al. JAMA 2001;285:

95 Psaty BM, et al. JAMA 2001;285:
96 Prothrombin variant G A, HRT, and non-fatal MI Population based case-control study Psaty BM, et al. JAMA 2001;285:
97 Selection bias in cohort studies of HRT and CVD Postmenopausal women with prothrombotic mutations may die or have CVD early after onset of treatment These women would not be included in cohort studies of HRT and CVD Source population Exposed Disease No disease Study population Disease No disease A B Exposed b a C D Nonexposed Nonexposed c d 97
98 Selection bias in cohort studies of HRT and CVD HRT Selection Outcome Prothrombotic mutations
99 Psaty BM, et al. JAMA 2001;285:
100 Samaha FF, et al. N Engl J Med 2003;348:

101 Samaha FF, et al. N Engl J Med 2003;348:
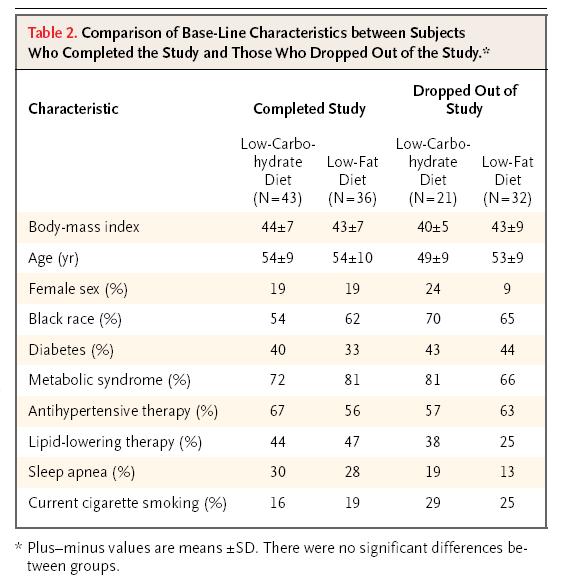
102 102
103 Selection bias due to losses of follow-up in RCT of Atkins diet Assigned diet Selection Outcome (weight loss) Age, other factors
104 Minimizing selection bias Random sampling from source population Limit losses to follow up Sensitivity analysis 104

105 Healthy Worker Effect

106 Dibbs E, et al. Circulation 1982;65:

107 107
108 From causal effect to data Phillips CV. Epidemiology 2003;14:
109 Measurement error can affect Exposure Outcome Confounders Mediators Modifying factors 109
110 Error components Measured value = True value + Error Error = Bias + Random Error Systematic component of the error Random component of the error
111 Quantification of measurement error Dichotomous variables Sensitivity, specificity Kappa statistic Categorical variables Spearman correlation coefficient Kappa statistic Continuous variables Coefficient of variation Intraclass correlation coefficient (reliability coefficient) 111
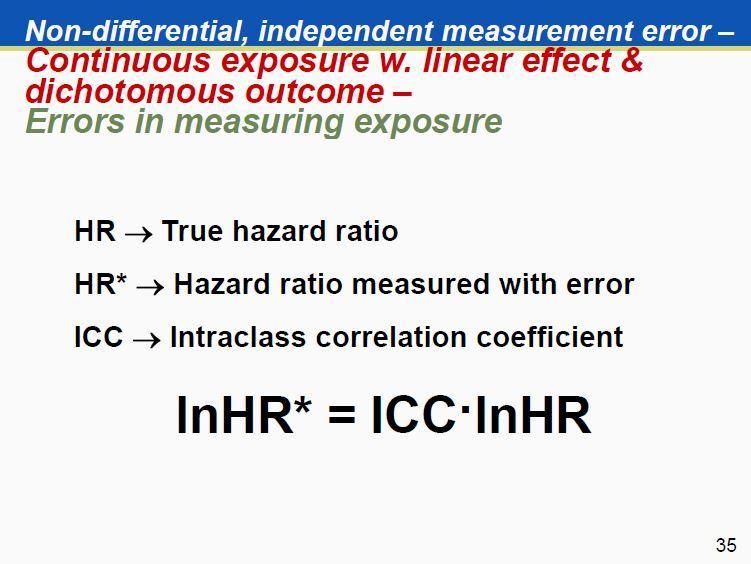
112 Differential vs. non-differential errors Non-differential measurement error Measurement error in the variable in question (e.g., the exposure) does not depend on the levels of other variables (e.g., the outcome, confounders, etc) Differential measurement error Measurement error depends on the levels of other variables (for instance, when sensitivity and specificity for measuring disease are different in exposed and unexposed participants) 112
113 Non-differential measurement error Dichotomous exposure & outcome Errors in measuring exposure TRUE TABLE N = 2000 P(E) = 50% P(D E ) = 10% RR = 2.0 Diseased Yes No Exposed Yes No TABLE WITH MISCLASSIFIED EXPOSURE Sensitivity = 80% Specificity = 100% Observed RR = 1.71 Yes Diseased No Exposed Yes No
114 Non-differential measurement error Dichotomous exposure & outcome Errors in measuring exposure TRUE TABLE N = 2000 P(E) = 50% P(D E ) = 10% RR = 2.0 Diseased Yes No Exposed Yes No TABLE WITH MISCLASSIFIED EXPOSURE Sensitivity = 100% Specificity = 90% Observed RR = 1.91 Yes Diseased No Exposed Yes No
115 Non-differential measurement error Dichotomous exposure & outcome Errors in measuring exposure TRUE TABLE N = 2000 P(E) = 50% P(D E ) = 10% RR = 2.0 Diseased Yes No Exposed Yes No TABLE WITH MISCLASSIFIED EXPOSURE Sensitivity = 80% Specificity = 90% Observed RR = 1.60 Yes Diseased No Exposed Yes No
116 Non-differential measurement error Dichotomous exposure & outcome Errors in measuring exposure In this case, measurement error will induce a bias will be towards the null, unless The test is uninformative or misleading The true effect is null The magnitude of the bias depends on: Sensitivity and specificity The prevalence of the exposure The risk of the disease The magnitude of the true effect The measure of association used 116

117 Non-differential measurement error Dichotomous exposure & outcome Errors in measuring exposure 117

118 Non-differential measurement error Dichotomous exposure & outcome Errors in measuring exposure
119 Non-differential measurement error Dichotomous exposure & outcome Errors in measuring exposure

120 Non-differential measurement error Dichotomous exposure & outcome Errors in measuring exposure
121 Non-differential measurement error Dichotomous exposure & outcome Errors in measuring disease TRUE TABLE N = 2000 P(E) = 50% P(D E ) = 10% RR = 2.0 Diseased Yes No Exposed Yes No TABLE WITH MISCLASSIFIED DISEASE Sensitivity = 80% Specificity = 90% Observed RR = 1.41 Yes Diseased No Exposed Yes No
122
123
124
125
126
127
128
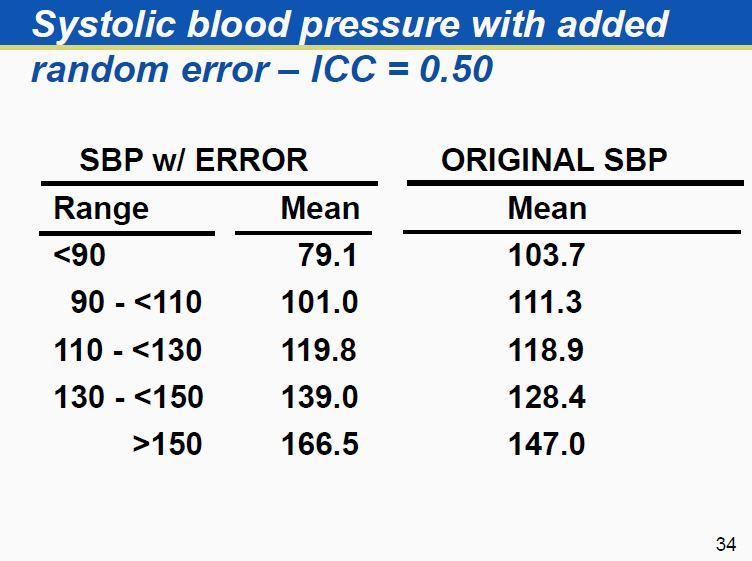
129 Regression towards the mean When a variable is measured with random error and we select participants with observed extreme values, their true underlying values are on average closer to the population mean Measure BP and select participants with SBP > 140 mmhg Consequences Inconsistencies in diagnosis and classification Biases in evaluation of interventions Inefficiency in planning studies 129
130 Differential measurement error Dichotomous exposure & outcome Errors in measuring disease TRUE TABLE N = 2000 P(E) = 50% P(D E ) = 10% RR = 2.0 Diseased Yes No Exposed Yes No TABLE WITH MISCLASSIFIED Yes DISEASE Sens in exposed = 90% Sens in unexposed = 80% Spec in exposed = 100% Spec in unexposed = 100% Observed RR = 2.25 Diseased No Exposed Yes No
131 Differential measurement error Dichotomous exposure & outcome Errors in measuring disease TRUE TABLE N = 2000 P(E) = 50% P(D E ) = 10% RR = 2.0 Diseased Yes No Exposed Yes No TABLE WITH MISCLASSIFIED Yes DISEASE Sens in exposed = 100% Sens in unexposed = 100% Spec in exposed = 90% Spec in unexposed = 80% Observed RR = 1.00 Diseased No Exposed Yes No
132 Differential measurement error Can bias measures of association in any direction The magnitude can be substantial, even with small differences in sensitivity or specificity In cohort studies, an important concern is differential classification of disease as a function of exposure Diagnostic bias Surveillance bias Mask follow-up procedures and outcome assessment 132
133 Main points on measurement error Measurement errors are pervasive in epidemiological studies Non-differential, independent errors in exposure or outcome tend to bias associations towards the null, but there are exceptions Differential or dependent errors can bias the association in either direction If sensitivity / specificity or ICC are known from validation studies, we can correct the measures of association 133
134 Strategies for increasing accuracy of measurements Standardize measurement methods in an operations manual Train and certify observers Refine the instruments Automate instruments and procedures Calibrate equipment Make unobtrusive measurements Blind measurements Take repeated measurements
135 Generalizability (external validity) 135
136 PPV Information Sheet 136
137 Generalizability is a judgment Consider if the same biological / social mechanisms apply in the target population as in the source population Consider if the prevalence of factors that may modify the effect of the exposure are different in the target and in the source population E.g., genetic determinants Be careful 137

138 Any question?
Biases in clinical research. Seungho Ryu, MD, PhD Kanguk Samsung Hospital, Sungkyunkwan University
 Biases in clinical research Seungho Ryu, MD, PhD Kanguk Samsung Hospital, Sungkyunkwan University Learning objectives Describe the threats to causal inferences in clinical studies Understand the role of
Observational Study Designs. Review. Today. Measures of disease occurrence. Cohort Studies
 Observational Study Designs Denise Boudreau, PhD Center for Health Studies Group Health Cooperative Today Review cohort studies Case-control studies Design Identifying cases and controls Measuring exposure
INTERNAL VALIDITY, BIAS AND CONFOUNDING
 OCW Epidemiology and Biostatistics, 2010 J. Forrester, PhD Tufts University School of Medicine October 6, 2010 INTERNAL VALIDITY, BIAS AND CONFOUNDING Learning objectives for this session: 1) Understand
Bias. A systematic error (caused by the investigator or the subjects) that causes an incorrect (overor under-) estimate of an association.
 that causes an incorrect (overor under-) estimate of an association.") Bias A systematic error (caused by the investigator or the subjects) that causes an incorrect (overor under-) estimate of an association. Here, random error is small, but systematic errors have led to
Bias A systematic error (caused by the investigator or the subjects) that causes an incorrect (overor under-) estimate of an association. Here, random error is small, but systematic errors have led to
Challenges of Observational and Retrospective Studies
 Challenges of Observational and Retrospective Studies Kyoungmi Kim, Ph.D. March 8, 2017 This seminar is jointly supported by the following NIH-funded centers: Background There are several methods in which
Confounding and Interaction
 Confounding and Interaction Why did you do clinical research? To find a better diagnosis tool To determine risk factor of disease To identify prognosis factor To evaluate effectiveness of therapy To decide
Basic Biostatistics. Dr. Kiran Chaudhary Dr. Mina Chandra
 Basic Biostatistics Dr. Kiran Chaudhary Dr. Mina Chandra Overview 1.Importance of Biostatistics 2.Biological Variations, Uncertainties and Sources of uncertainties 3.Terms- Population/Sample, Validity/
University of Wollongong. Research Online. Australian Health Services Research Institute
 University of Wollongong Research Online Australian Health Services Research Institute Faculty of Business 2011 Measurement of error Janet E. Sansoni University of Wollongong, jans@uow.edu.au Publication
Confounding and Bias
 28 th International Conference on Pharmacoepidemiology and Therapeutic Risk Management Barcelona, Spain August 22, 2012 Confounding and Bias Tobias Gerhard, PhD Assistant Professor, Ernest Mario School
Controlling Bias & Confounding
 Controlling Bias & Confounding Chihaya Koriyama August 5 th, 2015 QUESTIONS FOR BIAS Key concepts Bias Should be minimized at the designing stage. Random errors We can do nothing at Is the nature the of
Understanding Statistics for Research Staff!
 Statistics for Dummies? Understanding Statistics for Research Staff! Those of us who DO the research, but not the statistics. Rachel Enriquez, RN PhD Epidemiologist Why do we do Clinical Research? Epidemiology
Epidemiologic Measure of Association
 Measures of Disease Occurrence: Epidemiologic Measure of Association Basic Concepts Confidence Interval for population characteristic: Disease Exposure Present Absent Total Yes A B N 1 = A+B No C D N 2
Main objective of Epidemiology. Statistical Inference. Statistical Inference: Example. Statistical Inference: Example
 Main objective of Epidemiology Inference to a population Example: Treatment of hypertension: Research question (hypothesis): Is treatment A better than treatment B for patients with hypertension? Study
Observational Medical Studies. HRP 261 1/13/ am
 Observational Medical Studies HRP 261 1/13/03 10-11 11 am To Drink or Not to Drink? Volume 348:163-164 January 9, 2003 Ira J. Goldberg, M.D. A number of epidemiologic studies have found an association
Diabetes Mellitus: A Cardiovascular Disease
 Diabetes Mellitus: A Cardiovascular Disease Nestoras Mathioudakis, M.D. Assistant Professor of Medicine Division of Endocrinology, Diabetes, & Metabolism September 30, 2013 1 The ABCs of cardiovascular
INTERPRETATION OF STUDY FINDINGS: PART I. Julie E. Buring, ScD Harvard School of Public Health Boston, MA
 INTERPRETATION OF STUDY FINDINGS: PART I Julie E. Buring, ScD Harvard School of Public Health Boston, MA Drawing Conclusions TRUTH IN THE UNIVERSE Infer TRUTH IN THE STUDY Infer FINDINGS IN THE STUDY Designing
Experimental Design. Terminology. Chusak Okascharoen, MD, PhD September 19 th, Experimental study Clinical trial Randomized controlled trial
 Experimental Design Chusak Okascharoen, MD, PhD September 19 th, 2016 Terminology Experimental study Clinical trial Randomized controlled trial 1 PHASES OF CLINICAL TRIALS Phase I: First-time-in-man studies
Placebo-Controlled Statin Trials
 PREVENTION OF CHD WITH LIPID MANAGEMENT AND ASPIRIN: MATCHING TREATMENT TO RISK Robert B. Baron MD MS Professor and Associate Dean UCSF School of Medicine Declaration of full disclosure: No conflict of
Bias and confounding. Mads Kamper-Jørgensen, associate professor, Section of Social Medicine
 Bias and confounding Mads Kamper-Jørgensen, associate professor, maka@sund.ku.dk PhD-course in Epidemiology l 7 February 2017 l Slide number 1 The world according to an epidemiologist Exposure Outcome
Types of Biomedical Research
 INTRODUCTION & MEASUREMENT IN CLINICAL RESEARCH Sakda Arj Ong Vallipakorn, MD MSIT, MA (Information Science) Pediatrics, Pediatric Cardiology Emergency Medicine, Ped Emergency Family Medicine Section of
Causal Association : Cause To Effect. Dr. Akhilesh Bhargava MD, DHA, PGDHRM Prof. Community Medicine & Director-SIHFW, Jaipur
 Causal Association : Cause To Effect Dr. MD, DHA, PGDHRM Prof. Community Medicine & Director-SIHFW, Jaipur Measure of Association- Concepts If more disease occurs in a group that smokes compared to the
Epidemiologic Study Designs. (RCTs)
") Epidemiologic Study Designs Epidemiologic Study Designs Experimental (RCTs) Observational Analytical Descriptive Case-Control Cohort + cross-sectional & ecologic Epidemiologic Study Designs Descriptive
Epidemiologic Study Designs Epidemiologic Study Designs Experimental (RCTs) Observational Analytical Descriptive Case-Control Cohort + cross-sectional & ecologic Epidemiologic Study Designs Descriptive
Confounding Bias: Stratification
 OUTLINE: Confounding- cont. Generalizability Reproducibility Effect modification Confounding Bias: Stratification Example 1: Association between place of residence & Chronic bronchitis Residence Chronic
Updates in Therapeutics 2015: The Pharmacotherapy Preparatory Review & Recertification Course
 Updates in Therapeutics 2015: The Pharmacotherapy Preparatory Review & Recertification Course Study Designs: Fundamentals and Interpretation Kevin M. Sowinski, Pharm.D., FCCP Purdue University, College
INTRODUCTION TO EPIDEMIOLOGICAL STUDY DESIGNS PHUNLERD PIYARAJ, MD., MHS., PHD.
 INTRODUCTION TO EPIDEMIOLOGICAL STUDY DESIGNS PHUNLERD PIYARAJ, MD., MHS., PHD. 1 OBJECTIVES By the end of this section, you will be able to: Provide a definition of epidemiology Describe the major types
Online Supplementary Material
 Section 1. Adapted Newcastle-Ottawa Scale The adaptation consisted of allowing case-control studies to earn a star when the case definition is based on record linkage, to liken the evaluation of case-control
Epidemiologic Methods and Counting Infections: The Basics of Surveillance
 Epidemiologic Methods and Counting Infections: The Basics of Surveillance Ebbing Lautenbach, MD, MPH, MSCE University of Pennsylvania School of Medicine Nothing to disclose PENN Outline Definitions / Historical
No relevant financial relationships
 MANAGEMENT OF LIPID DISORDERS Balancing Benefits and harms Disclosure Robert B. Baron, MD MS Professor and Associate Dean UCSF School of Medicine No relevant financial relationships baron@medicine.ucsf.edu
12/26/2013. Types of Biomedical Research. Clinical Research. 7Steps to do research INTRODUCTION & MEASUREMENT IN CLINICAL RESEARCH S T A T I S T I C
 Types of Biomedical Research INTRODUCTION & MEASUREMENT IN CLINICAL RESEARCH Sakda Arj Ong Vallipakorn, MD MSIT, MA (Information Science) Pediatrics, Pediatric Cardiology Emergency Medicine, Ped Emergency
Intermediate Methods in Epidemiology Exercise No. 4 - Passive smoking and atherosclerosis
 Intermediate Methods in Epidemiology 2008 Exercise No. 4 - Passive smoking and atherosclerosis The purpose of this exercise is to allow students to recapitulate issues discussed throughout the course which
Clinical Research Design and Conduction
 Clinical Research Design and Conduction Study Design M Mohsen Ibrahim, MD Cardiac Department Cairo University Algorithm for classification of types of clinical research Grimes DA and Schulz KF. Lancet
Addressing error in laboratory biomarker studies
 Addressing error in laboratory biomarker studies Elizabeth Selvin, PhD, MPH Associate Professor of Epidemiology and Medicine Co-Director, Biomarkers and Diagnostic Testing Translational Research Community
Using negative control outcomes to identify biased study design: A self-controlled case series example. James Weaver 1,2.
 Using negative control outcomes to identify biased study design: A self-controlled case series example James Weaver 1,2 1Janssen Research & Development, LLC, Raritan, NJ, USA 2 Observational Health Data
Preventive Cardiology Scientific evidence
 Preventive Cardiology Scientific evidence Professor David A Wood Garfield Weston Professor of Cardiovascular Medicine International Centre for Circulatory Health Imperial College London Primary prevention
PTHP 7101 Research 1 Chapter Assignments
 PTHP 7101 Research 1 Chapter Assignments INSTRUCTIONS: Go over the questions/pointers pertaining to the chapters and turn in a hard copy of your answers at the beginning of class (on the day that it is
Advanced IPD meta-analysis methods for observational studies
 Advanced IPD meta-analysis methods for observational studies Simon Thompson University of Cambridge, UK Part 4 IBC Victoria, July 2016 1 Outline of talk Usual measures of association (e.g. hazard ratios)
Evidence-Based Medicine Journal Club. A Primer in Statistics, Study Design, and Epidemiology. August, 2013
 Evidence-Based Medicine Journal Club A Primer in Statistics, Study Design, and Epidemiology August, 2013 Rationale for EBM Conscientious, explicit, and judicious use Beyond clinical experience and physiologic
Welcome to this series focused on sources of bias in epidemiologic studies. In this first module, I will provide a general overview of bias.
 Welcome to this series focused on sources of bias in epidemiologic studies. In this first module, I will provide a general overview of bias. In the second module, we will focus on selection bias and in
JUPITER NEJM Poll. Panel Discussion: Literature that Should Have an Impact on our Practice: The JUPITER Study
 Panel Discussion: Literature that Should Have an Impact on our Practice: The Study Kaiser COAST 11 th Annual Conference Maui, August 2009 Robert Blumberg, MD, FACC Ralph Brindis, MD, MPH, FACC Primary
Critical Appraisal Series
 Definition for therapeutic study Terms Definitions Study design section Observational descriptive studies Observational analytical studies Experimental studies Pragmatic trial Cluster trial Researcher
Study design. Chapter 64. Research Methodology S.B. MARTINS, A. ZIN, W. ZIN
 Chapter 64 Study design S.B. MARTINS, A. ZIN, W. ZIN Research Methodology Scientific methodology comprises a set of rules and procedures to investigate the phenomena of interest. These rules and procedures
Epidemiologic Methods I & II Epidem 201AB Winter & Spring 2002
 DETAILED COURSE OUTLINE Epidemiologic Methods I & II Epidem 201AB Winter & Spring 2002 Hal Morgenstern, Ph.D. Department of Epidemiology UCLA School of Public Health Page 1 I. THE NATURE OF EPIDEMIOLOGIC
Confounding. Confounding and effect modification. Example (after Rothman, 1998) Beer and Rectal Ca. Confounding (after Rothman, 1998)
 Beer and Rectal Ca. Confounding (after Rothman, 1998)") Confounding Confounding and effect modification Epidemiology 511 W. A. Kukull vember 23 2004 A function of the complex interrelationships between various exposures and disease. Occurs when the disease
Confounding Confounding and effect modification Epidemiology 511 W. A. Kukull vember 23 2004 A function of the complex interrelationships between various exposures and disease. Occurs when the disease
well-targeted primary prevention of cardiovascular disease: an underused high-value intervention?
 well-targeted primary prevention of cardiovascular disease: an underused high-value intervention? Rod Jackson University of Auckland, New Zealand October 2015 Lancet 1999; 353: 1547-57 Findings: Contribution
Disclosure. No relevant financial relationships. Placebo-Controlled Statin Trials
 MANAGEMENT OF HYPERLIPIDEMIA AND CARDIOVASCULAR RISK IN WOMEN: Balancing Benefits and Harms Disclosure Robert B. Baron, MD MS Professor and Associate Dean UCSF School of Medicine No relevant financial
Recent developments for combining evidence within evidence streams: bias-adjusted meta-analysis
 EFSA/EBTC Colloquium, 25 October 2017 Recent developments for combining evidence within evidence streams: bias-adjusted meta-analysis Julian Higgins University of Bristol 1 Introduction to concepts Standard
Is There An Association?
 Is There An Association? Exposure (Risk Factor) Outcome Exposures Risk factors Preventive measures Management strategy Independent variables Outcomes Dependent variable Disease occurrence Lack of exercise
Placebo-Controlled Statin Trials MANAGEMENT OF HIGH BLOOD CHOLESTEROL MANAGEMENT OF HIGH BLOOD CHOLESTEROL: IMPLICATIONS OF THE NEW GUIDELINES
 MANAGEMENT OF HIGH BLOOD CHOLESTEROL: IMPLICATIONS OF THE NEW GUIDELINES Robert B. Baron MD MS Professor and Associate Dean UCSF School of Medicine Declaration of full disclosure: No conflict of interest
Measures of Association
 Measures of Association Lakkana Thaikruea M.D., M.S., Ph.D. Community Medicine Department, Faculty of Medicine, Chiang Mai University, Thailand Introduction One of epidemiological studies goal is to determine
Macrovascular Residual Risk. What risk remains after LDL-C management and intensive therapy?
 Macrovascular Residual Risk What risk remains after LDL-C management and intensive therapy? Defining Residual Vascular Risk The risk of macrovascular events and microvascular complications which persists
Epidemiological study design. Paul Pharoah Department of Public Health and Primary Care
 Epidemiological study design Paul Pharoah Department of Public Health and Primary Care Molecules What/why? Organelles Cells Tissues Organs Clinical medicine Individuals Public health medicine Populations
9/29/2015. Primary Prevention of Heart Disease: Objectives. Objectives. What works? What doesn t?
 Primary Prevention of Heart Disease: What works? What doesn t? Samia Mora, MD, MHS Associate Professor, Harvard Medical School Associate Physician, Brigham and Women s Hospital October 2, 2015 Financial
Understanding Confounding in Research Kantahyanee W. Murray and Anne Duggan. DOI: /pir
 Understanding Confounding in Research Kantahyanee W. Murray and Anne Duggan Pediatr. Rev. 2010;31;124-126 DOI: 10.1542/pir.31-3-124 The online version of this article, along with updated information and
No relevant financial relationships
 MANAGEMENT OF LIPID DISORDERS: WHERE DO WE STAND WITH THE NEW PRACTICE GUIDELINES? Robert B. Baron MD MS Professor and Associate Dean UCSF School of Medicine Disclosure No relevant financial relationships
Quantitative Research Methods and Tools
 Quantitative Research Methods and Tools Fraser Health Authority, 2011 The Fraser Health Authority ( FH ) authorizes the use, reproduction and/or modification of this publication for purposes other than
Welcome to this third module in a three-part series focused on epidemiologic measures of association and impact.
 Welcome to this third module in a three-part series focused on epidemiologic measures of association and impact. 1 This three-part series focuses on the estimation of the association between exposures
Bias. Zuber D. Mulla
 Bias Zuber D. Mulla Explanations when you Observe or Don t Observe an Association Truth Chance Bias Confounding From Epidemiology in Medicine (Hennekens & Buring) Bias When you detect an association or
Improved control for confounding using propensity scores and instrumental variables?
 Improved control for confounding using propensity scores and instrumental variables? Dr. Olaf H.Klungel Dept. of Pharmacoepidemiology & Clinical Pharmacology, Utrecht Institute of Pharmaceutical Sciences
John J.P. Kastelein MD PhD Professor of Medicine Dept. of Vascular Medicine Academic Medial Center / University of Amsterdam
 Latest Insights from the JUPITER Study John J.P. Kastelein MD PhD Professor of Medicine Dept. of Vascular Medicine Academic Medial Center / University of Amsterdam Inflammation, hscrp, and Vascular Prevention
Placebo-Controlled Statin Trials Prevention Of CVD in Women"
 MANAGEMENT OF HIGH BLOOD CHOLESTEROL: IMPLICATIONS OF THE NEW GUIDELINES Robert B. Baron MD MS Professor and Associate Dean UCSF School of Medicine Declaration of full disclosure: No conflict of interest
The Healthy User Effect: Ubiquitous and Uncontrollable S. R. Majumdar, MD MPH FRCPC FACP
 The Healthy User Effect: Ubiquitous and Uncontrollable S. R. Majumdar, MD MPH FRCPC FACP Professor of Medicine, Endowed Chair in Patient Health Management, Health Scholar of the Alberta Heritage Foundation,
Should we base treatment decisions on short-term or lifetime CVD risk? Rod Jackson University of Auckland New Zealand
 Should we base treatment decisions on short-term or lifetime CVD risk? Rod Jackson University of Auckland New Zealand Presentation outline Strengths & weaknesses of short-term risk approach Strengths &
115 remained abstinent. 140 remained abstinent. Relapsed Remained abstinent Total
 Chapter 10 Exercises 1. Intent-to-treat analysis: Example 1 In a randomized controlled trial to determine whether the nicotine patch reduces the risk of relapse among smokers who have committed to quit,
EVect of measurement error on epidemiological studies of environmental and occupational
 Occup Environ Med 1998;55:651 656 651 METHODOLOGY Series editors: T C Aw, A Cockcroft, R McNamee Correspondence to: Dr Ben G Armstrong, Environmental Epidemiology Unit, London School of Hygiene and Tropical
The Clinical Unmet need in the patient with Diabetes and ACS
 The Clinical Unmet need in the patient with Diabetes and ACS Professor Kausik Ray (UK) BSc(hons), MBChB, MD, MPhil, FRCP (lon), FRCP (ed), FACC, FESC, FAHA Diabetes is a global public health challenge
4/7/ The stats on heart disease. + Deaths & Age-Adjusted Death Rates for
 + Update on Lipid Management Stacey Gardiner, MD Assistant Professor Division of Cardiovascular Medicine Medical College of Wisconsin + The stats on heart disease Over the past 10 years for which statistics
Data that can be classified as belonging to a distinct number of categories >>result in categorical responses. And this includes:
 This sheets starts from slide #83 to the end ofslide #4. If u read this sheet you don`t have to return back to the slides at all, they are included here. Categorical Data (Qualitative data): Data that
Clinical Evidence: Asking the Question and Understanding the Answer. Keeping Up to Date. Keeping Up to Date
 Clinical Evidence: Asking the Question and Understanding the Answer Keeping Up to Date 5,000? per day 1,500 per day 95 per day Keeping Up to Date 5,000? per day 1,500 per day 95 per day 1 Bias Bias refers
Branko N Huisa M.D. Assistant Professor of Neurology UNM Stroke Center
 Branko N Huisa M.D. Assistant Professor of Neurology UNM Stroke Center THE END! CHANGABLE Blood pressure Diabetes Mellitus Hyperlipidemia Atrial fibrillation Nicotine Drug abuse Life style NOT CHANGABLE
3. Factors such as race, age, sex, and a person s physiological state are all considered determinants of disease. a. True
 / False 1. Epidemiology is the basic science of public health. LEARNING OBJECTIVES: CNIA.BOYL.17.2.1 - Define epidemiology. 2. Within the field of epidemiology, the term distribution refers to the relationship
Cedars Sinai Diabetes. Michael A. Weber
 Cedars Sinai Diabetes Michael A. Weber Speaker Disclosures I disclose that I am a Consultant for: Ablative Solutions, Boston Scientific, Boehringer Ingelheim, Eli Lilly, Forest, Medtronics, Novartis, ReCor
Dyslipidemia: Lots of Good Evidence, Less Good Interpretation.
 Dyslipidemia: Lots of Good Evidence, Less Good Interpretation. G Michael Allan Evidence & CPD Program, ACFP Associate Professor, Dept of Family, U of A. CFPC CoI Templates: Slide 1 Faculty/Presenter Disclosure
Epidemiology: Overview of Key Concepts and Study Design. Polly Marchbanks
 Epidemiology: Overview of Key Concepts and Study Design Polly Marchbanks Lecture Outline (1) Key epidemiologic concepts - Definition - What epi is not - What epi is - Process of epi research Lecture Outline
EPI 200C Final, June 4 th, 2009 This exam includes 24 questions.
 Greenland/Arah, Epi 200C Sp 2000 1 of 6 EPI 200C Final, June 4 th, 2009 This exam includes 24 questions. INSTRUCTIONS: Write all answers on the answer sheets supplied; PRINT YOUR NAME and STUDENT ID NUMBER
Disclosure. No relevant financial relationships. Placebo-Controlled Statin Trials
 PREVENTING CARDIOVASCULAR DISEASE IN WOMEN: Current Guidelines for Hypertension, Lipids and Aspirin Disclosure Robert B. Baron, MD MS Professor and Associate Dean UCSF School of Medicine No relevant financial
Rapid appraisal of the literature: Identifying study biases
 Rapid appraisal of the literature: Identifying study biases Rita Popat, PhD Clinical Assistant Professor Division of Epidemiology Stanford University School of Medicine August 7, 2007 What is critical
Effects of whole grain intake on weight changes, diabetes, and cardiovascular Disease
 Effects of whole grain intake on weight changes, diabetes, and cardiovascular Disease Simin Liu, MD, ScD Professor of Epidemiology and Medicine Director, Center for Global Cardiometabolic Health Brown
Placebo-Controlled Statin Trials EXPLAINING THE DECREASE IN DEATHS FROM CHD! PREVENTION OF CARDIOVASCULAR DISEASE IN WOMEN EXPLAINING THE DECREASE IN
 PREVENTION OF CARDIOVASCULAR DISEASE IN WOMEN Robert B. Baron MD MS Professor and Associate Dean UCSF School of Medicine Declaration of full disclosure: No conflict of interest EXPLAINING THE DECREASE
EBM: Therapy. Thunyarat Anothaisintawee, M.D., Ph.D. Department of Family Medicine, Ramathibodi Hospital, Mahidol University
 EBM: Therapy Thunyarat Anothaisintawee, M.D., Ph.D. Department of Family Medicine, Ramathibodi Hospital, Mahidol University How to appraise therapy literature Are the result valid? What are the result?
Dyslipidemia in women: Who should be treated and how?
 Dyslipidemia in women: Who should be treated and how? Lale Tokgozoglu, MD, FACC, FESC Professor of Cardiology Hacettepe University Faculty of Medicine Ankara, Turkey. Cause of Death in Women: European
Purpose. Study Designs. Objectives. Observational Studies. Analytic Studies
 Purpose Study Designs H.S. Teitelbaum, DO, PhD, MPH, FAOCOPM AOCOPM Annual Meeting Introduce notions of study design Clarify common terminology used with description and interpretation of information collected
General Biostatistics Concepts
 General Biostatistics Concepts Dongmei Li Department of Public Health Sciences Office of Public Health Studies University of Hawai i at Mānoa Outline 1. What is Biostatistics? 2. Types of Measurements
CVD risk assessment using risk scores in primary and secondary prevention
 CVD risk assessment using risk scores in primary and secondary prevention Raul D. Santos MD, PhD Heart Institute-InCor University of Sao Paulo Brazil Disclosure Honoraria for consulting and speaker activities
The Evidence for Populationwide Reduction in Sodium Intake: Why All the Fuss?
 The Evidence for Populationwide Reduction in Sodium Intake: Why All the Fuss? CIA-Harvard Menus of Change National Leadership Summit June 10, 2014 Cambridge, MA General Session IV Lawrence J Appel, MD,
Genetic risk prediction for CHD: will we ever get there or are we already there?
 Genetic risk prediction for CHD: will we ever get there or are we already there? Themistocles (Tim) Assimes, MD PhD Assistant Professor of Medicine Stanford University School of Medicine WHI Investigators
The Whitehall II study originally comprised 10,308 (3413 women) individuals who, at
 individuals who, at") Supplementary notes on Methods The study originally comprised 10,308 (3413 women) individuals who, at recruitment in 1985/8, were London-based government employees (civil servants) aged 35 to 55 years.
Supplementary notes on Methods The study originally comprised 10,308 (3413 women) individuals who, at recruitment in 1985/8, were London-based government employees (civil servants) aged 35 to 55 years.
2013 Lipid Guidelines Practical Approach. Edward Goldenberg, MD FACC,FACP, FNLA Medical Director of Cardiovascular Prevention CCHS
 2013 Lipid Guidelines Practical Approach Edward Goldenberg, MD FACC,FACP, FNLA Medical Director of Cardiovascular Prevention CCHS EVIDENCE BASED MEDICINE Case #1 - LB 42 yo Asian/American female who was
Pharmacy practice research is
 Research fundamentals Bias: Considerations for research practice Tobias Gerhard Pharmacy practice research is multifaceted and includes a variety of settings, study questions, and study designs. This report
CAN EFFECTIVENESS BE MEASURED OUTSIDE A CLINICAL TRIAL?
 CAN EFFECTIVENESS BE MEASURED OUTSIDE A CLINICAL TRIAL? Mette Nørgaard, Professor, MD, PhD Department of Clinical Epidemiology Aarhus Universitety Hospital Aarhus, Denmark Danish Medical Birth Registry
Assessing Cardiovascular Risk to Optimally Stratify Low- and Moderate- Risk Patients. Copyright. Not for Sale or Commercial Distribution
 CLINICAL Viewpoint Assessing Cardiovascular Risk to Optimally Stratify Low- and Moderate- Risk Patients Copyright Not for Sale or Commercial Distribution By Ruth McPherson, MD, PhD, FRCPC Unauthorised
How do we know that smoking causes lung cancer?
 How do we know that smoking causes lung cancer? Seif Shaheen Professor of Respiratory Epidemiology Centre for Primary Care and Public Health Blizard Institute Barts and The London School of Medicine and
Critical Appraisal of a Meta-Analysis: Rosiglitazone and CV Death. Debra Moy Faculty of Pharmacy University of Toronto
 Critical Appraisal of a Meta-Analysis: Rosiglitazone and CV Death Debra Moy Faculty of Pharmacy University of Toronto Goal To provide practitioners with a systematic approach to evaluating a meta analysis
You can t fix by analysis what you bungled by design. Fancy analysis can t fix a poorly designed study.
 You can t fix by analysis what you bungled by design. Light, Singer and Willett Or, not as catchy but perhaps more accurate: Fancy analysis can t fix a poorly designed study. Producing Data The Role of
8/10/2012. Education level and diabetes risk: The EPIC-InterAct study AIM. Background. Case-cohort design. Int J Epidemiol 2012 (in press)
") Education level and diabetes risk: The EPIC-InterAct study 50 authors from European countries Int J Epidemiol 2012 (in press) Background Type 2 diabetes mellitus (T2DM) is one of the most common chronic
Education level and diabetes risk: The EPIC-InterAct study 50 authors from European countries Int J Epidemiol 2012 (in press) Background Type 2 diabetes mellitus (T2DM) is one of the most common chronic
Modifying effects of dietary polyunsaturated fatty acid (PUFA) on levels of cholesterol and their implications for heart health
 on levels of cholesterol and their implications for heart health") Modifying effects of dietary polyunsaturated fatty acid (PUFA) on levels of cholesterol and their implications for heart health Robert Clarke Clinical Trial Service Unit University of Oxford 28 th May
Modifying effects of dietary polyunsaturated fatty acid (PUFA) on levels of cholesterol and their implications for heart health Robert Clarke Clinical Trial Service Unit University of Oxford 28 th May
Blood Pressure Targets: Where are We Now?
 Blood Pressure Targets: Where are We Now? Diana Cao, PharmD, BCPS-AQ Cardiology Assistant Professor Department of Clinical & Administrative Sciences California Northstate University College of Pharmacy
Blood Pressure and Complications in Individuals with Type 2 Diabetes and No Previous Cardiovascular Disease. ID BMJ
 1 Blood Pressure and Complications in Individuals with Type 2 Diabetes and No Previous Cardiovascular Disease. ID BMJ 2016.033440 Dear Editor, Editorial Committee and Reviewers Thank you for your appreciation
Introduction. Step 2: Student Role - Your Plan of Action. Confounding. Good luck and have fun!
 Confounding Introduction You have learned that random error and bias must be considered as possible explanations for an observed association between an exposure and disease. This week we will examine the
Glossary of Practical Epidemiology Concepts
 Glossary of Practical Epidemiology Concepts - 2009 Adapted from the McMaster EBCP Workshop 2003, McMaster University, Hamilton, Ont. Note that open access to the much of the materials used in the Epi-546