Predictability of VO 2max using a commercially available GPS sports watch
|
|
|
- Roger Simmons
- 6 years ago
- Views:
Transcription

1 Eastern Michigan University Master's Theses and Doctoral Dissertations Master's Theses, and Doctoral Dissertations, and Graduate Capstone Projects 2017 Predictability of VO 2max using a commercially available GPS sports watch Andrew Pearson Follow this and additional works at: Part of the Medicine and Health Sciences Commons Recommended Citation Pearson, Andrew, "Predictability of VO 2max using a commercially available GPS sports watch" (2017). Master's Theses and Doctoral Dissertations This Open Access Thesis is brought to you for free and open access by the Master's Theses, and Doctoral Dissertations, and Graduate Capstone Projects at DigitalCommons@EMU. It has been accepted for inclusion in Master's Theses and Doctoral Dissertations by an authorized administrator of DigitalCommons@EMU. For more information, please contact lib-ir@emich.edu.
2 Predictability of VO2max Using a Commercially Available GPS Sports Watch by Andrew Pearson Thesis Submitted to the School of Health Promotion and Human Performance Eastern Michigan University in partial fulfillment of the requirements for the degree of MASTER OF SCIENCE in Exercise Physiology Thesis Committee: Rebecca Moore, PhD, Chair Christopher Herman, PhD Jeff Schulz, PhD July 13, 2017 Ypsilanti, Michigan
3 ii Dedication To my mother, for supporting me every step of the way, regardless of the choices I made in life. To my father, who would have loved nothing more than to see how far I have come. To my brother and sister, for providing encouragement and advice along the way.
4 iii Acknowledgments To Becca, for being the greatest possible advisor any graduate student could ask for, encouraging me to always produce my best work, pushing me to pursue a Ph.D. from the first day I met you in 636, teaching me to love dogs, and becoming someone I can ask for help for the rest of my career. To Steve, for spending countless hours in the lab with me, teaching me how to run, and struggling through graduate school and life together. To Andrea, for always listening to my nutrition rants, providing unwavering support, and encouraging me to be myself in all aspects of my life. To my friends, for making me laugh when I don t want to, being there for me during the difficult times, and supporting me no matter where I go in life.
5 iv Abstract The purpose of this study was to examine the predictability of VO2max using a GPS sports watch. Thirty participants volunteered for this study and performed a treadmill-based graded exercise test, a 15-minute submaximal outdoor run, and three additional runs of at least 30 minutes in duration while wearing a GPS sports watch. Three separate VO2max values were recorded during the study: direct, predicted, and adjusted, respectively. A two-way (2 fitness groups x 3 VO2max time points) repeated measures ANOVA was conducted to determine if a significant difference existed between recorded VO2max values. The GPS sports watch did not accurately predict VO2max. Participants were placed into two fitness groups determined by directly measured VO2max. The watch was unable to accurately predict VO2max for participants with a VO2max of greater than 50 ml/kg/min. The watch could accurately predict VO2max for individuals with a directly measured VO2max of less than 50 ml/kg/min.
6 v Structured Abstract PREDICTABILITY OF VO2MAX USING A GPS SPORTS WATCH Andrew G. Pearson 1, Brandon Bastianelli 1, Andrea D. Workman 1, Christopher W. Herman 1, Jeff Schulz 1 & Rebecca W. Moore 1. 1 Eastern Michigan University, Ypsilanti, MI. Using accurate submaximal methodologies to estimate VO2max is a convenient alternative to maximal exercise testing. Submaximal testing is practical because it provides a cheaper, more time-efficient method to determine VO2max and allows a wider range of individuals to be tested. Purpose: The purpose of this study was to examine the predictability of VO2max using a GPS sports watch. Methods: Thirty participants, 16 males and 14 females between the ages of 18 and 55, volunteered for this study. A total of three separate VO2max values were recorded during the study: (a) directly measured VO2max, (b) a predicted VO2max value based on a 15-minute outdoor run, and (c) an adjusted predicted VO2max value based on three subsequent outdoor runs of at least 30 minutes in duration. Participants came to the Running Science Laboratory at Eastern Michigan University (EMU) on two separate occasions. On day one, participants completed a treadmill-based graded exercise test (GXT) to determine VO2max. Participants completed the test using a self-selected pace (mph) that was determined during a 3-minute warm-up period. The self-selected pace remained constant throughout the test while the grade increased at a rate of 2% every 2 minutes. On day two, participants arrived at EMU and completed a 15-minute submaximal outdoor run. Participants were fitted with a GPS sports watch, which was used to predict VO2max based on subject characteristics (gender, age, height [in], weight [lbs.]), as well as
7 vi total distance of the run, pace, time (15 minutes), and heart rate (HR) during exercise. Participants were then required to take the watch home and record three additional runs of at least 30 minutes to produce an adjusted predicted VO2max value. A two-way (2 fitness groups x 3 VO2max time points) repeated measures ANOVA was conducted to determine if there was a significant difference between directly measured VO2max, predicted VO2max, and adjusted predicted VO2max. Participants were placed into two fitness groups determined by directly measured VO2max (VO2max of greater than [high] or less than [low] 50 ml/kg/min). A one-way repeated measures ANOVA was conducted to determine if a significant difference in recorded VO2max values was observed within groups. Statistical significance was determined using a p-value of.05. Results: Two participants (two males) were excluded from the analysis due to failing to return for visit two. The remaining 28 participants were ± 5.69 years old, had a height of ± 6.94 cm, and weighed ± kg. A statistically significant difference was observed between directly measured (55.09 ± 9.73 ml/kg/min) and predicted VO2max (51.75 ± 5.16 ml/kg/min);(p-value <.05), directly measured and adjusted predicted VO2max (50.68 ± 5.98 ml/kg/min);(p-value <.001), and predicted and adjusted predicted VO2max (p-value <.05). A significant difference was observed in the high VO2max group between directly measured and predicted VO2max and directly measured and adjusted predicted VO2max (p-value <.001). No significant difference was observed between predicted and adjusted predicted VO2max in the high VO2max group (pvalue >.05). No significant difference was observed between values in the low VO2max group (p-value >.05). Conclusion: Major limitations of this study included participants performing all activities at a self-selected pace and measuring HR using the radial pulse with an optical sensor. A self-selected pace could have led to inaccuracies in VO2max prediction as
8 vii participants may not have performed to their full potential. Future research could enforce stricter pace and distance requirements for additional activity recording to test both anaerobic and aerobic energy systems. Additionally, measuring HR using an optical sensor within the watch at the radial pulse has been shown to underestimate average HR values when compared to HR measurement using a chest strap. While the purpose of this study was to test the predictability of only the GPS sports watch, a lower overall average HR for a given activity could have produced overestimates of VO2max.
9 viii Table of Contents Dedication... ii Acknowledgments... iii Abstract... iv Structured Abstract...v List of Tables... xi Chapter 1: Introduction and Background...1 Statement of the Problem...11 Justification and Significance...12 Purpose of the Study...12 Research Hypotheses...13 Definitions...13 Limitations...13 Chapter 2: Review of Related Literature...15 Submaximal Exercise to Determine VO2max...16 Maximal Exercise to Determine VO2max...24 Estimation of VO2max...28 Wearable Devices...33 GPS Technology and Devices...38 VO2max Prediction Using Smart Watches...44 Summary...46
10 ix Chapter 3: Research Design and Methodology...48 Participants...48 Procedures...48 Garmin Forerunner Visit Visit Statistical Analysis...54 Chapter 4: Presentation and Analysis of Data...57 Chapter 5: Summary, Conclusions, and Recommendations for Future Research...71 Predictors of VO2max...72 Similar Research...75 Strengths and Limitations...79 Conclusion...82 Recommendations for Further Research and Action...83 References...85 Appendix A: Consent Form...96 Appendix B: Physical Activity Readiness Questionnaire Appendix C: Health-History Questionnaire Appendix D: IRB Permission Letter Appendix E: Proposal Approval Form Appendix F: Thesis Defense Approval Form...105
11 x Appendix G: Data Collection Sheet Appendix H: Curriculum Vitae...108
12 xi List of Tables Table Page 1 Data Collection Sheet Descriptive Statistics of Participants Descriptive Statistics of All VO2max Values Descriptive Statistics of Additional Exercise Activities Descriptive Statistics of the High VO2max Group Descriptive Statistics of the Low VO2max Group Mauchly s Test of Sphericity Two-Way ANOVA Tests of Within-Subjects Effects Two-Way ANOVA Dependent Variables Two-Way ANOVA Pairwise Comparisons Two-Way ANOVA Pairwise Comparisons of Groups One-Way ANOVA Mauchly s Test of Sphericity One-Way ANOVA Tests of Within-Subjects Effects One-Way ANOVA Pairwise Comparisons One-Way ANOVA...69
13 Chapter 1 Introduction and Background Hill, Long, and Lupton (1924) researched the relationship between ventilation and exercise extensively in the early twentieth century. These researchers were among the first to demonstrate a ventilatory limit in response to an increase in exercise intensity, now commonly referred to as VO2max, or simply the maximum amount of oxygen an individual is able to consume during exercise (Hill et al., 1924). Countless methods to estimate and directly determine VO2max have been developed and validated. Regarding the simplest determination of VO2max, from non-exercise (NE) data, different methodologies of estimating VO2max have been developed (Bradshaw et al., 2005; George, Stone, & Burkett, 1997; George et al., 2009; Heil, Freedson, Ahlquist, Price, & Rippe,1995; Jackson et al., 1990; Schembre & Riebe, 2011; Webb, Vehrs, George, & Hager, 2004). These types of estimates typically use physical activity (PA) questionnaires and anthropometric data to create regression models that can accurately estimate VO2max. While these NE models are valid measurements of VO2max and can be useful in special populations such as the elderly and clinical patients, they may not be ideal for all populations. More conventional methods of determining VO2max are grounded in collecting exercise data for subjects in addition to anthropometric measures and, in some cases, questionnaire data. Protocols to accurately obtain VO2max were developed as early as the 1950s and new protocols continue to emerge in the literature. In most cases, when hearing the term VO2max protocol, a few familiar names come to mind such as Balke, Bruce, Ebbeling, Taylor, Margaria, and Åstrand. These are a few of the more popular protocols used
14 2 in research and clinical settings. While each method differs in procedure, they all have the same end goal: to determine VO2max for a subject. Submaximal testing to determine VO2max involves a particular mode of exercise, which can include a step test at a predetermined step height, regression equations using exercise data, cycle ergometer and treadmill (TM) tests, and field tests outside using a known distance such as a 1-mile track jog or a 1-mile track walk (Balke, 1963; Cooper, 1968; Ebbeling, Ward, Puleo, Widrick, & Rippe, 1991; George, Vehrs, Allsen, Fellingham, & Fisher, 1993; George et al., 2009; Kline et al., 1987; Macsween, A. 2001; Vehrs, George, Fellingham, Plowman, & Dustman-Allen, 2007; Waddoups, Wagner, Fallon, & Heath, 2008). While these exercise bouts are not always shorter in duration compared to their maximal counterparts, sub-maximal efforts are of lower intensity and in return lead to an overall better perceived experience and less psychological and physiological stress experienced by the participant. These types of tests have proven to be beneficial for special populations, specifically in clinical settings. The logistics of a submaximal test allow VO2max to be estimated without collecting maximal data, which is much safer for high-risk populations such as cardiac patients. Submaximal testing has its place in clinical research however; maximal protocols are necessary for research geared towards optimizing performance and testing in elite athletes. Prediction equations to estimate VO2max are one of the most commonly used methods in both clinical and performance settings (Åstrand& Ryhming, 1954; Balke, 1963; Bradshaw et al., 2005; Cink & Thomas, 1981; Cooper, 1968; Ebbeling et al., 1991; George et al., 1993, 1997, 2009; George, Bradshaw, Hyde, Vehrs, & Hager, 2007; Heil et al., 1995; Jackson et al., 1990; Kline et al., 1987; Macsween, 2001; Margaria, Aghemo, & Rovelli, 1965;
15 3 Schembre & Riebe, 2011; Vehrs et al., 2011; Webb et al., 2014). Using prediction equations allows researchers to estimate VO2max based solely on NE data or a combination of NE and exercise data that is typically obtained through submaximal tests. These characteristics contribute to an overall safer and more enjoyable testing experience for the participant, as well as a cheaper alternative to a maximal graded exercise test (GXT). In most cases, regression equations are developed using some form of submaximal testing and then validated in the same study using maximal GXT results. Maximal tests provide a direct measurement of VO2max and are regarded as the gold standard of exercise testing. However, this improved accuracy comes at a cost. Maximal tests are generally much more expensive compared to submaximal tests and impose greater risk to the participant. These tests require an all-out effort, which if executed correctly, requires participants to exercise to their maximal heart rate (HR). While this is completely safe when the necessary precautions are taken, the increased cost and risk inherently limit the populations that can be tested using a maximal protocol. Nevertheless, maximal tests have their place in research and are necessary for performance-based studies, particularly with highly fit individuals. Similar to the research on submaximal protocols, a substantial amount of literature exists regarding maximal protocols, which has led to the development of countless methods to measure VO2max. Researchers have spent decades attempting to develop protocols, and while multiple valid protocols exist today, they are often geared towards a specific population. Many of the protocols developed decades ago are still used in research today, most of which consist of some variation of a TM test using a particular speed and incline (Bruce, Kusumi, & Hosmer, 1973; George, 1996; Spackman, George, Pennington, &
16 4 Fellingham, 2001; Taylor, Buskirk, & Henschel, 1955). The main difference among protocols is whether or not participants were able to use a self-selected pace and the progression of incline throughout the duration of the exercise test (Bruce et al., 1973, George, 1996). For example, the protocol developed by Bruce et al. (1973) requires participants to begin at 1.7 mph and 10% grade and then every 3 minutes the speed of the TM increases by roughly 0.8 mph and incline increases by 2%. Depending on how conditioned the participant is, they progress through three to five stages until volitional exhaustion occurs. In contrast to this protocol, the protocol developed by George (1996) requires participants to walk at a 5% grade for 3 minutes at a self-selected pace. After the initial 3 minutes, participants are then able to continue walking at the same self-selected pace or progress towards a suitable jogging speed for an additional 3 minutes. After the initial 6-minute period that served as a warm-up, participants are then able to select a speed most comfortable to perform the maximal exercise test. This speed is held constant throughout the test and the incline is increased by 1.5% every minute until volitional exhaustion (George, 1996) While the outcome of these two protocols is inevitably the same, the difference in methodology is important in evaluating which protocol should be used for a given population. Generally, the Bruce test is used in clinical populations while the George test is used in athletic populations. The term wearable device spans a broad category and includes all types of personal activity tracking monitors such as pedometers, accelerometers, smart watches, and global positioning system (GPS) watches. The technology used to monitor activity and exercise has made monumental advancements in the last decade. In the past, a pedometer, which counts the number of steps taken by an individual, was used to estimate distance traveled per day (Schneider, Crouter, & Bassett, 2004). The pedometer is a relatively simple way to monitor
17 5 activity and is worn at the hip, typically placed on the pants of the individual and counts steps taken during the day through movement of the hip. In the past, pedometers often overestimated an individual's step count because movement at the hip while not walking could be misconstrued as a step. While pedometers may not be the most accurate form of measurement, studies have demonstrated the benefits of owning these types of monitoring devices by significantly increasing physical activity (PA) while decreasing body mass index (BMI) and blood pressure (Bravata et al., 2007; Kang, Marshall, Barreira, & Lee, 2009). Recent advancements in pedometer technology have led to increasingly accurate activity tracking, but many researchers have shifted towards accelerometers for activity monitoring (Abel, Hannon, Sell, Lillie, Conlin, & Anderson, 2008; Le Masurier, Lee, & Tudor-Locke, 2004, Tudor-Locke, McClain, Sisson, & Craig, 2007). With further advancements in technology, widespread use of accelerometers for PA monitoring has been observed in all types of research settings (Abel et al., 2008; Erdogan, Cetin, Karatosun, & Baydar, 2010; Le Masurier et al., 2004, Liden, Wolowicz, Stivoric, Teller, Vishnubhatla, Pelletier, & Farringdon 2002; Reeve, Pumpa, & Ball, 2014; Scheers, Philippaerts, & Lefevre, 2012; Tudor-Locke et al., 2007). Accelerometers are small, reasonably priced, wearable devices that measure PA on a uniaxial or triaxial basis (Hanggi et al., 2013). These devices measure PA by recording duration, intensity, and frequency. Additionally, newer models, such as the ActiGraph GT3X+ (ActiGraph, LLC, Pensacola, FL, USA), include an inclinometer that is able to detect posture during PA. The shift from using pedometers to accelerometers in research has been an important turning point in the literature. These more advanced methods of data collection brought forth many studies in order to validate new devices, determine activity cut-points for all
18 6 populations, identify the most accurate sampling periods (epochs), and determine the most appropriate site to wear the device (Kim, Beets, Pate, & Blair, 2013; Kim, Jung, Park, & Joo, 2014: Pate, Almedia, McIver, Pfeiffer, & Dowda, 2006; Romanzini, Petroski, Ohara, Dourado, Reichert, 2014; Sasaki, John, & Freedson, 2011; Sirard, Trost, Pfeiffer, Dowda, & Pate, 2005; Trost, Loprinzi, Moore, & Pfeiffer, 2011). Accelerometers such as the Actigraph GT1M and GT3X are particularly useful in pediatric populations as they are able to measure PA on one to three axes instead of only counting steps. In a large of over 2000 British children, van Sluijs et al. (2008) found that roughly 70% of children did not meet PA guidelines when measured using an Actigraph accelerometer over the course of seven days. While research is ongoing as to the validity of these accelerometers, research on GPS, exercise based video games (exergames), and social media applications are emerging, which has led to increased PA in previously lacking populations (Boulos& Yang, 2013; Kerr et al., 2012; Le Faucheur, Abraham, Jaquinandi, Bouyé, Saumet, & Noury-Desvaux, 2007; Le Faucher, Abraham, Jaquinandi, Bouyé, Saumet, & Noury-Desvaux, 2008). GPS, exergames, and social media are the present and future platforms to promote PA in all populations. Wearable devices equipped with GPS technology allow users to accurately record activities, specifically data on distance, pace, total time, and HR during the exercise bout. Additionally, these devices can determine personal bests and are a convenient way to compare training history and progress over the course of weeks, months, and years. GPS research began in the late 1990s with Schutz and Chambaz (1997) investigating whether GPS could be an accurate tool to determine walking and running speed in humans. In this study, a male was equipped with a GPS device and then required to walk, run, and cycle around a track at different speeds. Schutz and Chambaz found that GPS technology was useful for
19 7 speed assessment. However, walking accuracy needed to improve. The researchers concluded that GPS technology could potentially be a useful tool to measure PA, but future research is necessary (Schutz& Chambaz, 1997). This initial study sparked an abundance of research on accuracy, validity, reliability, and ultimately the use of GPS technology to measure PA, specifically in relation to the environment. One of the first studies to analyze the accuracy of GPS devices was conducted by Le Faucheur et al. (2007). The authors found that when using a low-cost commercially available GPS (Garmin 60 GPS ), outdoor walking distance could be accurately measured. Additionally, the authors were able to conclude that resting and walking bouts could be identified using GPS and both speed and distance of the exercise could be accurately determined (Le Faucher et al., 2007). Although promising, GPS technology is still relatively new in the literature, and further research is necessary to validate devices and establish standards of measurement. GPS technology is necessary for social media applications and exergames to be utilized for everyday activity. While this is relatively novel research, the literature has shown that GPS exergames can be a motivational tool to promote exercise in youth while simultaneously acting as a video game to capture attention. These benefits target two major problems in adolescents: lack of physical activity and a short attention span. The research indicates that GPS exergames could act as an alternative or in conjunction with conventional outdoor activities to promote PA in youth (Boulos& Yang, 2013). Additionally, research on the Nintendo Wii in older adults indicate that exergames can be used as a motivational tool to increase in PA, cognition, and psychosocial outcomes as well as a safe, practical way to exercise (Chao, Scherer, & Montgomery, 2014). In addition to exergames, social media applications such as the Garmin and Fitbit applications allow users to compare PA to
20 8 their friends, thus creating a competitive atmosphere in order to further promote exercise in all populations. Future research on the role of such applications is necessary and potentially a method to combat the ever-growing obesity epidemic across America in all populations. The validity and reliability of any advancement in technology is a major concern in research. However, recent studies have shown that GPS devices can accurately determine location in unobstructed conditions with some devices still being able to monitor location in obstructed environments (Duncan, Stewart, Oliver, Mavoa, MacRae, Badland, & Duncan, 2013). Additionally, Wieters, Kim, and Lee (2012) tested the accuracy of four GPS models for outdoor recording of PA and found that the units demonstrated an acceptable level of reliability and validity to be used in research on PA. An abundance of research has emerged on GPS and accelerometry, specifically on how this technology can be utilized to examine the relationship between PA and the environment. In general, the research shows the importance of preserving green space, which is often used for vigorous activity (Almanza, Jerrett, Dunton, Seto, & Pentz, 2012; Coombes, van Sluijs, & Jones, 2013; Jones, Coombes, Griffin, & van Sluijs, 2009; Lachowycz, Jones, Page, Wheeler, & Cooper, 2012; McCrorie, Fenton, & Ellaway, 2014; Wheeler, Cooper, Page, & Jago, 2010). While these studies have demonstrated the important relationship between the environment and PA in children, several other studies have incorporated the use of GPS technology in PA monitoring (Oreskovic, Blossom, Field, Chiang, Winickoff, & Kleinman, 2012; Quigg, Gray, Reeder, Holt, & Waters, 2010; Rainham, Bates, Blanchard, Dummer, Kirk, & Shearer, 2012; Rodríguez et al., 2012; Southward, Page, Wheeler, & Cooper, 2012). These studies, which generally focused on children, incorporate the use of GPS and accelerometry to record the contribution of walking to and from school to daily PA as well as other walking bouts. In a review conducted
21 9 by Maddison and Mhurchu (2009), the use of GPS in over 35 studies that are directly related to human movement is documented. The authors found that while GPS was used extensively in the research and can be a useful tool in measuring PA, future research is necessary. Specifically, research that focuses on the interaction of individuals with their environment, effectiveness of an intervention, adjustments in PA patterns, and improving data analysis methods (Maddison& Mhurchu, 2009). Recently, a few abstracts have emerged that utilize GPS based smart watches to predict VO2max (Johnson& Beadle, 2017; Snyder, Willoughby, & Smith, 2017; Willoughby, Snyder, & Smith, 2017). These studies incorporated the use of Polar and multiple Garmin smart watches and compared a directly measured VO2max obtained via a maximal GXT to a predicted value following either a resting or submaximal fitness test. One study used a Polar FT60 smart watch to predict VO2max through a fitness test which required participants to lie down while wearing the watch for 5 minutes while resting HR is collected (Johnson& Beadle, 2017). HR data, combined with participant s characteristics, such as gender, age, weight, and height, are used to predict VO2max, which then adjusts following additional activity input. The results indicated that the fitness test overestimates VO2max by roughly 10% when compared to a directly measured VO2max test obtained in lab (Johnson& Beadle, 2017). Two recent studies have tested the predictability capability of the V800 Polar smart watch and two different GPS smart watches developed by Garmin : the Garmin Forerunner 230 and the Garmin Forerunner 235. The main difference between these two Garmin models is that the 230 utilizes a chest strap to record HR while the 235 uses an optical sensor within the watch to record HR via the radial pulse. The first study compared the accuracy of VO2max prediction using the V800 (Polar ), the 230, and the 235
22 10 (Garmin ). Similar to the study mentioned above, a directly measured VO2max value obtained using a standard TM based GXT was compared to a predicted value from the three smart watches. The V800 predicts VO2max following a resting HR variability test, which requires participants to lie down and rest for 5 minutes. The 230 and 235 predict VO2max following a 10-minute outdoor run completed using a self-selected pace (Snyder et al., 2017). Significant differences between directly measured and all predicted VO2max values were observed. The results indicated that the smart watches typically overestimated VO2max in males, while an overestimate and underestimate, depending on the watch, was found in females (Snyder et al., 2017). In a similar study, predicted VO2max values were compared using the results of a 10- minute self-paced outdoor run while wearing the Garmin Forerunner 230 and the Garmin Forerunner 235. As mentioned above, the 230 utilizes a chest strap to record HR while the 235 uses an optical sensor that records HR via the radial pulse. This difference in HR technology led to differences in average HR recorded during the 10-minute run (Willoughby et al., 2017). Participants completed the outdoor run while wearing a chest strap and both watches. No significant difference in maximum HR, distance, pace, or kcal were observed during exercise for males and females. However, average HR recorded by the 230 was significantly higher for both males and females. In females, no significant difference in predicted VO2max was found between devices. However, in males, a significant difference was observed with the 230 predicting a lower VO2max value. The authors concluded that the average HR recorded using the 230 was significantly higher for both genders and that the predicted VO2max value from the 230 was lower than the 235 in men due to differences in average HR during activity (Willoughby et al., 2017).
23 11 Statement of the Problem GPS technology is fairly new in terms of PA measurement and exercise testing, and while a wide variety of devices have been developed for recreational and professional use, research on available commercial devices is lacking. With new and improved products emerging on the market each year, the literature regarding reliability and validity of such devices is falling behind. Major companies such as Garmin, Polar, and Fitbit, have developed devices that act as pedometers, accelerometers, and include GPS technology to document PA. Some of these devices have been validated but with new products on the horizon, research is necessary to determine if these devices can accurately measure PA. Companies have and continue to develop wearable devices such as smart watches, which now claim to be able to estimate an individual s VO2max using a regression equation, which is inaccessible to the public. Since these companies do not include references or provide any literature on the reliability and accuracy of said devices, research is necessary to assess these claims and to determine how accurately a smartwatch can estimate VO2max based on submaximal exercise. These regression equations likely estimate VO2max based on several characteristics including an individual s gender, age, weight, height, and maximal HR as well as a single exercise bout that records time, pace, distance, and HR during the activity. The ability of these devices to accurately estimate VO2max is beneficial for future research as it will lead towards a convenient way to obtain VO2max in populations who may be unfit or incapable of participating in maximal exercise such as clinical patients, the elderly, and pediatric populations. Submaximal tests are a safer alternative for these special populations and potentially have increased accuracy for pediatric populations who may not complete or produce a true VO2max during testing. Additionally, these advanced features that newer
24 12 models are equipped with serve as a great tool to motivate the user to improve their fitness levels and drive up their VO2max value and personal bests. With validation of GPS smart watches, this method can be utilized in research and serve as a substitute for the more expensive alternative of maximal testing using metabolic carts and portable units. Justification and Significance Research is necessary to validate emerging technology to test how accurately VO2max can be predicted using a GPS sports watch. This study evaluated the Garmin Forerunner 235 s ability to predict VO2max based on a 15-minute submaximal outdoor run and how this value changes after additional activity input. This research is important, as it assessed claims made by Garmin, which could lead towards future research in VO2max prediction technology and, hopefully, lead to improvements in wearable device technology. With these advancements, wearable devices may play an important role in future research regarding physical activity measurement, particularly of VO2max without the expense and risk of TMbased maximal exercise testing. This could lead to a wider range of individuals being able to participate in exercise testing as the risk and cost will be reduced using GPS-based wearable devices to record physical activity and predict VO2max. Purpose of the Study The purpose of this study was to examine the predictability of VO2max using a GPS sports watch. Three separate values for VO2max were obtained: (a) directly measured VO2max, (b) a predicted VO2max value based on a 15-minute outdoor run, and (c) an adjusted predicted VO2max value based on three subsequent outdoor runs of at least 30 minutes in duration.
25 13 Research Hypotheses Based on the existing literature on estimations of VO2max, GPS technology, and minimal research regarding the Garmin Forerunner 235, the researchers hypothesized the following: 1. It was hypothesized that the Garmin Forerunner 235 will not be accurate predictor of VO2max for the general population. 2. It was hypothesized that the Garmin Forerunner 235 will be an accurate predictor of VO2max for individuals with a VO2max of less than 50 ml/kg/min. Definition of Terms 1. VO2max/VO2peak: The maximum amount of oxygen that can be inhaled and utilized by the body, specifically muscular tissue, during exercise. For this study, relative VO2max was used that is expressed in ml/kg/min to incorporate body weight as a factor. 2. Volitional exhaustion/fatigue: The point at which a participant is no longer able to maintain the required intensity to continue exercising at a particular speed and incline on the treadmill. 3. GPS: Global positioning system that is used to determine location on Earth using a satellite. Limitations 1. Using an optical sensor to record radial pulse as a measurement of heart rate instead of a chest strap can potentially lead to inaccurate values for heart rate. If the watch slightly slips on the wrist or moisture exists between the sensor and skin due to accumulation of sweat during exercise, inaccurate heart values could be recorded. To
26 14 avoid this limitation, the researcher ensured that the watch was secured tightly on each subject s wrist before testing. 2. Using GPS to determine distance traveled and pace for an exercise bout is largely dependent on signal strength and accuracy of the GPS device. Certain precautions were taken, such as waiting for the watch to read GPS Ready before beginning exercise. The GPS signal is indicated by five increasingly large vertical bars in the top corner of the watch display similar to a cell phone s reception. When all five bars are lit up green, the watch vibrates and reads GPS Ready. Once this occurs, the subject can begin exercising. 3. Using a self-selected pace for an outdoor run could potentially allow unmotivated participants to not perform the test to their full potential. To minimize this risk, only individuals with past experience in running were recruited for this study. 4. Additional activity input beyond the initial 15-minute outdoor run was not specified beyond a time requirement of 30 minutes. This led to the majority of participants running for exactly 30 minutes for each run. While this is not considered a limitation, as Garmin does not specify the type and duration of additional runs required to predict VO2max, participants could have been required to perform different types of runs by adjusting pace and time to include shorter runs at a faster pace and longer runs at a slower pace to assess the anaerobic and aerobic energy systems.
27 15 Chapter 2 Review of Related Literature A variety of methods that encompass estimating, calculating, and obtaining VO2max directly have been developed over the last century. While these techniques have been validated, modern methodologies are emerging that allow for exciting new ways to collect data outside of the laboratory setting. With the explosion in popularity of wearable devices made by companies such as Garmin, Fitbit, and Polar, research must be conducted in order to assess the claims made by these and other companies and determine the validity of these devices. A wearable device is a piece of equipment that can be worn on the body, generally on the wrist as a watch or at the waist in the case of a pedometer or accelerometer. These devices incorporate computer technology, heart rate (HR) monitors, and in more advanced cases, a global positioning system (GPS). Because of the large increase in popularity of these devices, companies are developing more advanced models which now include methods to predict various race finishing times (5k, 10k, etc.) and estimate VO2max based on a brief run outdoors while wearing the watch. While companies do not typically publish the particular equation they use to estimate VO2max, it can generally be thought of as a regression model that uses multiple variables to estimate VO2max. These variables include, but are not limited to, age-predicted max HR, age, weight, height, body mass index (BMI), gender, recorded HR during exercise, distance traveled and pace during the exercise bout, and total time of the activity. Whether or not these newly developed devices are indeed a valid measurement of VO2max has yet to be
28 16 documented in the literature. Research is necessary in order to establish validity so these devices may be used for future research. A wearable device could be a valuable tool for researchers in all populations as it will lead to improvements in estimating VO2max based on actual exercise data and is a much cheaper, time efficient alternative to laboratory measurement. Submaximal Exercise to Determine VO2max Research on submaximal exercise spans several decades and includes many of the widely recognized names in exercise physiology including Åstrand, Balke, Cooper, Ebbeling, and Margaria. Protocols developed in the 1950s and 60s are still being used today to estimate VO2max based on submaximal data. In 1954, Åstrand and Ryhming tested 50 men and 62 women to develop a simple submaximal test to produce information regarding aerobic capacity. Using their results, the authors developed a nomogram that uses an individual s HR and workload to estimate oxygen intake based on submaximal exercise (Åstrand& Ryhming, 1954). Because of the positive linear relationship that exists between HR, workload, and oxygen intake, VO2max can be estimated using gender and HR at any given submaximal workload. In 1981, as a follow up to Åstrand and Ryhming s research, Cink and Thomas sought to validate the Åstrand-Ryhming nomogram that is used to predict VO2max. The authors tested 40 male students between the ages of 18 and 33. Participants were required to perform a submaximal and maximal exercise test from which the results were compared to evaluate validity. Cink and Thomas concluded that there was no statistically significant difference between VO2max predicted using the Åstrand-Ryhming nomogram with age correction factors and VO2max obtained using a maximal cycle ergometer protocol (Cink& Thomas, 1981). Further expansion on Åstrand and Ryhming s research was conducted in
29 by Macsween who examined the reliability and validity of the Åstrand nomogram by comparing this method to linear extrapolation using a HR/oxygen intake plot based on the theoretical maximum HR (Macsween, 2001). The study consisted of testing 28 volunteers ages years old in which all subjects performed a maximal graded exercise test (GXT) using the Bruce treadmill (TM) protocol (Bruce et al., 1973) while wearing a portable gas analyzer and a HR monitor. Two trials were performed per week over the course of 4 weeks and average oxygen consumption was measured at three submaximal HRs (120, 146, and 172 bpm for females and 122, 146, and 170 bpm for males). From these oxygen consumptions values, three VO2max values were predicted and then averaged using the Åstrand nomogram (Macsween, 2001). For extrapolation, a linear regression equation was generated to be fitted over the HR/oxygen consumption plot and the equation was solved for age-predicted max HR, which yielded an extrapolated VO2max. Macsween (2001) found that submaximal data can be accurately used in both a clinical and research setting to predict VO2max. In 1963, Balke conducted a three-part study to develop a running test protocol that could be used to evaluate physical fitness out in the field for the Federal Aviation Agency. Balke examined how physical conditioning improved working capacity in several areas including TM and cycle ergometer performance as well as completion time for two and three mile runs. Eight male subjects were tested for part one of the study in which work capacity on a TM was examined after a 10-week training period. Work capacity was measured using a procedure previously developed by Balke in 1959 (Balke, 1963), which involved a TM protocol of increasing workload. Participants then ran several running bouts varying in duration, which allowed oxygen intake to be calculated from average velocity for each run. In part two of the study, nine untrained males performed a similar TM test followed by runs
30 18 of two and three miles in length. Average velocity of the outdoor runs was used to calculate oxygen intake, which was compared to the VO2max from the maximal TM test. Part three of the study tested 34 high school boys who performed a 15-minute TM test in which participants were asked to achieve the greatest distance possible in 15 minutes (Balke, 1963). Balke found there exists a linear relationship between oxygen intake per unit body mass and running velocities. The author also developed a field test to assess physical fitness which consisted of a 15-minute run about a known distance. Velocity could then be computed from distance and time and therefore estimate VO2max (Balke, 1963). Based on Balke s (1963) field testing research, Cooper (1968) sought to slightly modify the Balke field test and then compare the results to a VO2max value obtained using a maximal GXT. The study consisted of testing 115 US Air Force males with an age range of years old. Instead of the 15-minute field test presented by Balke (1963), participants performed a 12-minute field test on a flat surface around a one-mile course. After the field test, participants performed a maximal GXT using methods presented by Taylor (1955) which consisted of several 3 minute intervals that were each separated by a rest period of 10 minutes. Incline and grade were increased with each interval based on the participant s fitness level with an attempt to exhaust participants within three or four exercise intervals (Cooper, 1968). Cooper found that field testing is an accurate method to predict VO2max in young individuals if the participant is well motivated. These results are beneficial because a field test is a free alternative to maximal GXT testing and can be performed in a group setting. However, the accuracy of predicted VO2max is dependent upon individual motivation (Cooper, 1968).
31 19 In 1965, Margaria et al. examined indirect methods to determine VO2max by using HR values measured during a bench step-test. By using a slightly more complex nomogram than originally developed by Åstrand and Ryhming (1954), Margaria et al (1965) tested several subjects ages 9 to 47 years old to compare directly measured VO2max to values estimated using HR, step frequency, and step height. VO2max was estimated using an equation that required an upper limit for HR (160, 180, or 200 bpm), step frequency (15 or 25 times/min), and a bench height of 40 cm (Margaria et al., 1965). The authors concluded that the directly measured VO2max values were in agreement with the VO2max values estimated from a step-test using the nomogram (Margaria et al., 1965). Similar to the protocol used by Margaria et al., Webb et al (2014) aimed to develop an individualized step test to predict VO2max in fit, college-aged individuals. Eighty relatively fit subjects, 38 males and 42 females, ages years old were tested for the purpose of this study. Before any exercise testing took place, subjects completed a perceived functional ability (PFA) and a physical activity readiness questionnaire (PAR-Q). All subjects then performed a submaximal step test and a maximal GXT using a TM protocol. The step test used a single step that ranged in height from 10 to 16 in. based on the individual. Before the test, 75% of maximal HR was determined and then set as an endpoint for the test. The test consisted of 2 minute stages and at the end of each stage, stepping frequency increased by 5 steps/min while step height remained the same. Each subject then completed a maximal GXT using a protocol developed by George et al. (2009; Webb et al., 2014). From the results, the authors developed an individualized step test that can accurately predict VO2max in college-aged males and females using a prediction equation that utilizes recovery HR as well as non-exercise (NE) data from questionnaires (PFA and a modified PAR-Q; Webb et al., 2014).
32 20 VO2max has been accurately predicted based on a simple one-mile track walk using subject characteristics. Kline et al. (1987) developed a field test in which subjects were required to walk around a track for one mile and from this time, VO2max can be estimated using test time, gender, age, and body weight. The authors tested 390 healthy individuals, 183 males and 207 females, ages years old. Initially, subjects performed a maximal GXT using a protocol of constant speed and increasing incline to determine VO2max. This value was then compared to the estimated value from two one-mile track walks separated by at least one day in which test times were required to be within 30 seconds of each other. HR was recorded every minute during the walking bout and at the end of each 0.25-mile segment. From the data collected, four HR values were used to generate regression equations that could estimate VO2max (Kline et al., 1987). Cross-validation groups were also used in the study to develop the VO2max regression equations. From the results, six different equations were created that estimated VO2max based on test time for the one-mile walk, HR values, weight, gender, and age. Kilne et al. (1987) concluded that all six equations shared similar accuracy and can be used to estimate VO2max. Similar to Kline et al. s research, George et al. (1993) developed a submaximal onemile track jog protocol that could accurately estimate VO2max in college-aged individuals. Additionally, the authors tested the accuracy of the previously developed 1.5 mile run that is used to estimate VO2max in college-aged individuals. The study consisted of testing 149 college students, 88 males and 61 females, ages years old. All subjects performed a maximal GXT to obtain a VO2max value. Then, 106 subjects performed the one-mile track jog protocol while 96 performed the 1.5-mile run. The one-mile jog could be performed on the same day as the maximal GXT as it is a steady-state, submaximal test. However, the 1.5 mile
33 21 run and maximal GXT were performed on separate days. The maximal GXT performed by all subjects consisted of a TM protocol at a self-selected constant pace between 5.0 and 7.0 mph with a 2.5% increase in grade every minute after a 3-minute warm-up period at the selfselected pace. The one-mile track jog consisted of a self-selected pace with HR and speed upper limits. Test times had to be greater than 8 minutes for males and nine minutes for females. Final HR values had to be less than 180 bpm to ensure a submaximal level of effort. For the 1.5 mile run, subjects were required to complete the test as fast as possible. George et al. (1993) concluded that the one-mile track jog is an acceptable alternative to the 1.5-mile run for predicting VO2max and the one-mile jog is a safer, more enjoyable method compared to the 1.5-mile run and other field tests. A familiar test that is still used today in clinical and research settings is the Ebbeling protocol which was developed by Ebbeling et al. in The protocol consists of a submaximal exercise test that uses HR, TM speed, age, and gender to estimate VO2max. Ebbeling et al. tested 166 volunteers, 77 males and 89 females, ages years old in order to create and cross-validate an equation obtained using submaximal data to estimate VO2max. All subjects performed an exercise test which consisted of three stages of four minutes in duration at 0, 5, or 10% grade. The walking pace was kept constant at 2, 3, 4, or 4.5 mph. After completion of the three stages, the test progressed into a maximal GXT to obtain a VO2max value which consisted of either walking at the same speed or running at a higher speed with a 2.5% increase in grade every two minutes until volitional exhaustion was reached (Ebbeling et al., 1991). HR was measured using an electrocardiogram (ECG) and rate of perceived exertion (RPE) was recorded using a 15 point Borg scale at the end of each stage. Subjects were then randomly placed into either an estimation or validation group. This
34 22 method allowed regression equations to be generated based on submaximal data and then validated using a separate group s data. From these results, Ebbeling et al. (1991) developed an accurate equation that could be used to estimate VO2max using a single stage, submaximal TM protocol. The authors concluded that this was a time-efficient method to determine VO2max for low risk individuals. Further expanding on Ebbeling et al.'s research, Waddoups et al. (2008) set out to determine if the single-stage submaximal protocol previously developed by Ebbeling et al. in 1991 could accurately predict VO2max at the lower (50% HR max) and higher (70% HR max) extremes of the HR testing range. In total 34 subjects, 17 males and 17 females, ages years old were tested in this study with all subjects completing a submaximal exercise test and 22 subjects completing a VO2max test. Testing consisted of three separate sessions with the first session to allow familiarization with the protocol and to determine TM speeds that would produce HR values in the low and high ranges as described above. Session two was the first submaximal TM test in which subjects were randomly assigned to either the low or high intensity group with the other test being completed during the third testing session. For submaximal testing, the protocol developed by Ebbeling et al. (1991) was used which required subjects to walk for three minutes at a grade of 5% after a warm-up period at 0% grade. The same procedure was used during session three with the opposite intensity test being performed. For both tests, HR was recorded to be used in estimating VO2max. A VO2max test was also performed after the submaximal test during the third session of exercise testing. The authors found a significant difference in VO2max when estimated using low intensity (50%) versus high intensity (70%) results. Waddoups et al. (2008) suggested that the best predictive validity for the Ebbeling protocol exists in the lower to middle HR ranges.
35 23 Using the protocol developed by Ebbeling et al., George et al. (2009) worked to improve the protocol and develop a more inclusive submaximal TM test that could include jogging and running as other options for healthy adults. In total, 100 subjects, 50 females and 50 males were used for data analysis. Initial anthropometric data were collected and subjects were then required to complete a PFA and a modified PAR-Q. Subjects then submitted to a submaximal TM test in which subjects exercised at a self-selected pace within a defined interval while progressing through three 4-minute stages. The stages increased in intensity from walking ( mph) to jogging ( mph), and finally to running in stage three (>6.0 mph). The test was stopped when 70% of maximal HR was reached. After completion of the submaximal exercise test and a 2-5-minute cooldown period, subjects performed a maximal GXT using the protocol developed by George et al. (1997). The authors concluded that the submaximal TM test used in this study can accurately predict VO2max. The benefit of this modified version of the Ebbeling test is that individuals are allowed to walk, jog, or run at a submaximal effort level in order to estimate VO2max which is of particular use in healthy adults with higher fitness levels (George et al., 2009). Developing accurate submaximal means to determine VO2max is particularly important for special populations who may not be able to perform maximal exercise. Tests which elicit a submaximal effort are generally much safer by imposing less risk on the individual. Additionally, submaximal measurements are a cheaper, time-efficient alternative to laboratory testing using a metabolic cart. The combination of these benefits allows submaximal testing to be ideal for research in clinical patients where safety is the primary concern during testing.
36 24 Maximal Exercise to Determine VO2max The relationship between oxygen consumption and work rate was first discovered by Hill et al. (1924). A.V. Hill was the main subject with the incorporation of a few others throughout the course of the study. The test consisted of running around an outdoor, all grass track which was roughly 90 meters in length. The pace of the individual was determined by recording the amount of time elapsed for each consecutive trial. Oxygen and carbon dioxide values were recorded in cc/min. to be used to calculate the respiratory quotient and ventilation was calculated in L/min. A total of 14 trials were performed on Hill and the authors were able to conclude a relationship between oxygen intake and work rate exists. Hill et al. (1924) found that oxygen intake increases directly as a result of increased speed and that a maximum can be reached at a certain point of exercise (VO2max). Although there exists much debate on the topic, the authors concluded that when a maximum effort is reached it is due to the inability of the circulatory-respiratory system as opposed to the need for greater amount of oxygen (Hill et al., 1924). Research to develop protocols to elicit VO2max is ongoing and dates back to the 1950s when Taylor et al. (1955) documented the methods used in their lab for determining VO2max as well as particular limitations and potential use in a research setting. Data for this study were recorded over the course of several separate studies and in total the results of 115 subjects were used to draw conclusions. All subjects were males with a total of 27 soldiers and 46 volunteers from the University of Minnesota ages years old. All subjects were considered to be fit individuals and were required to be present for three to five days of initial testing to determine a work rate that would elicit a VO2max. On the first day of testing, a grade was established that would produce a maximal effort on a separate day. This was
37 25 accomplished using scores from the Harvard Fitness Test (Taylor et al., 1955). On the second day of testing, subjects were required to walk at 3.5 mph at 10% grade for as little as 10 minutes and as long as one hour. After finishing the walking portion of the test, subjects then ran at 7.0 mph for 3 minutes at 10% grade while respiratory gases were collected to determine VO2max. On the final day of testing, the same protocol from day two was followed but instead subjects ran at a grade of 12.5%. Respiratory gases were again collected and VO2max values from days two and three were compared to evaluate the difference. If the scores were in agreement (difference of <150 cc/min or 2.1 cc/kg/min), a VO2max value was produced based on the work rate. If the scores differed by more than the previously described values, a fourth visit was added to establish a grade that would produce similar values. The authors concluded that a protocol of increasing incline is the most efficient way to elicit VO2max whereas increasing the speed while keeping the grade constant did not always lead to an increase in oxygen consumption (Taylor et al., 1955). One of the most common VO2max protocols used in both clinical and research settings is the Bruce protocol developed by Bruce et al. (1973). The study, which presents five criteria to measure VO2max, uses data spanning a period of over nine years and 10,000 tests to develop a protocol that could be used in all populations to produce a VO2max. The purpose of the study was to provide evidence of the 5 th criteria for evaluating VO2max which, briefly, is to provide normal standards and reliable methods to measured VO2max. The remaining four criteria are: 1.) focusing on the use of large muscle groups to perform dynamic exercise, 2.) start with a submaximal workload that progresses towards a maximal effort using incremental stages of increasing workload until volitional exhaustion, 3.) a safe test that proposes minimal risk to the participant, and 4.) provide accurate results in a time-efficient
38 26 manner for the both the participant and the researcher (Bruce et al., 1973). The results consist of previously measured data on a total of 295 subjects, which include 85 males, 144 females, and 66 young men and women (< 45 years old). Subjects were placed into either a physically active or sedentary group. A multistage TM test was used to determine VO2max for subjects which consisted of several three minute stages beginning at 1.7 mph and 10% grade (Bruce et al., 1973). The speed and grade of the TM was then increased every 3 minutes with no resting periods until subjects were no longer able to continue. Bruce et al. concluded that the protocol developed is a reliable and safe method when administered correctly to measure VO2max and is of particular use in clinical populations. The Bruce protocol is still widely used today, however, alternative protocols have been developed in recent years that are more suited towards healthy individuals and performance testing (George, 1996; George et al., 2007; Spackman et al., 2001). In 1996, J.D. George devised a protocol geared towards college-age individuals that can accurately measure VO2max using a more personalized approach. The study consisted of testing 126 college students, 52 males and 54 females, ages years old for part one of the study and 20 additional subjects for part two. Before any exercise testing took place, subjects were required to complete a PAR-Q and anthropometric data was collected. Then, subjects were placed into either a validation group or a test-retest reliability group. Both groups performed a maximal GXT on a TM in which subjects ran at a self-selected pace that was held constant throughout the test with a 1.5% increase in grade every minute. The test was ended when subjects could no longer continue and experienced volitional exhaustion. The author determined that this particular protocol was easy to follow and is more realistic for college-age students because of its personalized approach. George also concluded that
39 27 VO2max could be accurately measured when following this time efficient protocol, now deemed the ASU protocol, as total test time lasted roughly 4 8 minutes following a sixminute warm-up (George, 1996). Continuing George's research, Spackman et al. (2001) investigated VO2max protocol preference by comparing the Bruce protocol (Bruce et al., 1973) to the ASU protocol (George, 1996). In total, 34 active students, 17 males and 17 females, ages years old were used for the purpose of this study, all of which were unfamiliar with VO2max testing protocols. Initial anthropometric data were collected and all subjects completed a PAR-Q. Subjects were then informed of all testing protocols and were allowed to exercise wearing the one-way breathing apparatus in order to gain familiarity with the device. All subjects performed the ASU and Bruce maximal GXT TM protocols on two different occasions that were separated by three to six days. In both cases, subjects completed a questionnaire that addressed their preferred protocol (Spackman et al., 2001). In addition to rating satisfaction of the protocol, subjects also noted whether or not the grade and speed of each protocol was preferred and more individualized to their fitness level. The questionnaire consisted of questions using a Likert scale (1 to 7) and lastly subjects chose which protocol they would prefer to perform again, if necessary, two days later. The authors were able to make several conclusions based on the results of this study. Most notably, 93.8% of subjects who participated in the study preferred the ASU protocol over the Bruce protocol if required to perform an additional VO2max test two days later. Spackman et al. (2001) also concluded that the ASU protocol is preferred as it allows participants to self-select a pace that is comfortable to run at and is overall a more individualized experience for relatively fit college-aged individuals.
40 28 In 2007, J.D. George further expanded his research on the ASU protocol by developing a regression model to predict VO2max in a broader range of individuals. Onehundred participants, 50 females and 50 males, ages years old were tested for the purpose of this study. All subjects performed the ASU maximal GXT protocol developed by George (1996). The protocol, which is previously described above, was used to measure VO2max after a warm-up period of 5 10 minutes. These results were then used to generate a regression model that can predict VO2max using gender, age, body mass index (BMI), TM speed, and TM grade. George et al. (2007) found that the regression model developed in the study can accurately predict VO2max in a wider age range of individuals (18 65 years old) using results from the ASU protocol. Maximal exercise testing, while intense in nature, can be performed safely when conducted by an experienced individual who assures that the necessary precautions are taken. Maximal measurements are of particular importance for performance research where accuracy is the primary concern. While several protocols for maximal testing exist, selecting the appropriate protocol that is best suited for the desired sample is necessary for any research study to produce accurate results. VO2max tests are the gold-standard for determining and individual s cardiorespiratory fitness and should be used as the criterion measurement for any validation research. Estimation of VO2max Several techniques exist to estimate VO2max based on non-exercise (NE) data and predict VO2max using regression equations centered around PA questionnaires (Bradshaw et al., 2005, George, 1997, Heil et al., 1995, Jackson et al., 1990, Schembre & Riebe, 2011).
41 29 These methodologies are of particular use in populations who are unfit for PA as exercise data is not required to estimate VO2max. Research on this subject emerged in the 1990s when Jackson et al. (1990) tested several groups of subjects who were employees at the Johnson Space Center for NASA. The authors aimed to evaluate whether or not models to predict VO2 using NE data were valid estimates of cardiorespiratory fitness (Jackson et al., 1990). In this study, estimates obtained using the NE models were compared with results obtained from a maximal GXT. Although there were several groups of subjects used in the study, a total of 2009 subjects were tested, 1,814 males and 195 females. Of this large sample, two groups were formed for the study, a validation group (N = 1,532) and a cross validation group (N = 467). Anthropometric data were collected and all subjects completed a questionnaire before any exercise testing took place (Jackson et al., 1990). All subjects completed a maximal GXT using the Bruce TM protocol while wearing a 12 lead ECG to record HR, which was recorded during the last 15 seconds of each minute. Submaximal data was also used and recorded only for the last minute of the first three stages of the Bruce TM test. From these results, a total of four NE regression models were generated (two for males and two for females). These equations predict VO2peak using only NE data, which included either percent body fat or BMI, age, and a value corresponding to the answers recorded from the PAR-Q (Jackson et al., 1990). Using these regression models the authors concluded that the NE models can accurately estimate VO2peak. Depending greatly on the fitness level, the equations were more accurate for individuals of lower fitness status and should not be used to estimate VO2peak aerobically fit individuals. In some cases, these models were a better estimate of VO2peak than values predicted using the Åstrand nomogram (Jackson et al., 1990).
42 30 In 1995, Heil et al. worked to improve the accuracy of existing NE regression models that are used to predict VO2peak previously developed by Jackson et al. (1990). The study consisted of testing 439 healthy volunteers, 210 males and 229 females, ages 20 to 79 years old. Subjects were randomly placed into either a validation group (N = 374) or a crossvalidation group (N = 65;Heil et al., 1995). Anthropometric data were recorded prior to exercise and all subjects rated the amount of PA performed in the past month on a scale of 0 to 7. All subjects then performed a maximal GXT and HR was recorded using an ECG (>40 years old) or a Polar HR monitor (< 40 years old). Using subject characteristics including anthropometric data, specifically body fat percentage, the authors developed regression models that could accurately predict VO2peak (Heil et al., 1995). These newer models were of comparable accuracy to the older models presented by Jackson et al. (1990) and those developed to predict VO2max using exercise data from the one-mile walk test (Kline et al., 1987). As previously observed in 1990, the authors again found that the regression model struggled to predict VO2peak in aerobically fit individuals (relative VO2max > 54 ml/kg/min) due to sharing similar characteristics such as fitness level, gender (male), and weight (Heil et al., 1995). To further improve accuracy of estimation techniques using regression models, George (1997) created a questionnaire that could be used in place of exercise data combined with subject characteristics to predict VO2max. The authors also compared the accuracy of new NE regression models to those previously developed. One-hundred college students, 50 males and 50 females, ages years old participated in this study. Prior to exercise testing, all subjects were required to complete a PAR-Q and a PFA questionnaire. The PFA questionnaire is designed to evaluate the subject's perception of how well they could
43 31 maintain various exercise intensities such as walking, running, or jogging over specific distances and durations. These bouts included a distance of one-mile, three miles, and one bout of 30 minutes in duration. Subjects were required to rate the activities as easier or harder (George et al., 1997). In addition to the information recorded using the PFA questionnaire, subjects also answered exercise questions established by Jackson et al. (1990). Then, anthropometric data were recorded and subjects submitted to a maximal GXT to determine VO2max. From these results, NE VO2max prediction equations were developed using multiple linear regression analysis (George, 1997). Two sets of equations were developed in this study with the first only taking into account questionnaire data while the second equation used both exercise and questionnaire data. George (1997) found that the incorporation of the data obtained from the PFA questionnaire improved the accuracy of NE equations used to predict VO2max in active college-aged individuals. Interestingly, the authors also found that when using the second prediction equation, which included exercise data, the ability to predict VO2max did not improve (George, 1997). Expanding the research of George (1997), Bradshaw et al. (2005) developed a NE regression model to predict VO2max in older individuals as opposed to specifically college students. One-hundred subjects, 50 males and 50 females, ages years were used as subjects for the study (Bradshaw et al., 2005). Similar to the protocol mentioned in the study above, subjects initially filled out two questionnaires (PAR-Q and PFA) followed by anthropometric data collection. All subjects then performed a maximal GXT using a TM protocol developed by George (1996). Using the results, a regression equation was generated which was used to predict VO2max based on gender, age, and BMI as well as PFA and PAR-Q data (Bradshaw et al., 2005). The authors concluded that the newly developed NE prediction
44 32 equation for older individuals is an accurate way to predict VO2max in both males and females. As is the case with most prediction equations, the results are largely dependent on the truthfulness of questionnaire responses, and the authors found that the PFA data contributes greatly to improved accuracy of predicting VO2max (Bradshaw et al., 2005). In 2011, Schembre and Riebe created and tested a regression equation that could be used to accurately estimate VO2max based on responses from the International PA Questionnaire (IPAQ) in young adults. Participants in this study included 43 males and 37 females who were all considered healthy and generally between the ages of 18 and 20 years old (Schembre& Riebe, 2011). Using the short version of the IPAQ, PA habits were recorded as well as anthropometric data. All subjects performed a maximal GXT using the Bruce protocol. A randomly selected group of subjects which was representative of different fitness levels was created to validate the developed regression equation based on IPAQ responses and anthropometric data (Schembre& Riebe, 2011). The authors developed a regression equation that predicts VO2max based on gender and PA per week. Schembre and Riebe concluded that VO2max can be accurately predicted using the regression equation based on data obtained from the IPAQ. However, in many cases, the equation overestimated VO2max in unfit individuals while underestimating in aerobically fit individuals (Schembre& Riebe, 2011). Estimation of VO2max using prediction equations is a useful tool for researchers as it allows data to be obtained quickly and accurately. One of the main benefits of using regression models that incorporate questionnaire data is that accurate VO2max values can be obtained based solely on individual characteristics without the need for exercise testing.
45 Several valid NE prediction equations exist and can be useful in determining fitness levels in populations who may not be able to perform exercise at any level of intensity. 33 Wearable Devices Wearable devices such as pedometers, accelerometers, and GPS devices have become increasingly popular during the twenty-first century. While research is ongoing, some of the earliest studies began to emerge around the turn of the century in which pedometers and early models of accelerometers were evaluated for use in PA based health interventions. In 2002, Liden et al. evaluated the SenseWear Armband by collecting physiological data from participants who wore the device for varying periods of PA. In this study, 40 participants were selected to produce four groups that were evenly divided by sex, height, age, and BMI (Liden et al., 2002). Before exercise, anthropometric data were collected so that it could be programmed into the armband. The exercise portion of the study consisted of two separate sessions of PA. For the first session, participants either walked at a slow or fast pace, ran, sat, or biked while breathing into a mouthpiece so that respiratory gases could be collected. The same basic protocol was followed for the second session with the only difference being a change in the order and duration of particular activities (Liden et al., 2002). Using the results, the authors concluded that the SenseWear Armband possesses low error rates and can be used to accurately assess PA. In comparison to other devices on the market at the time, the SenseWear Armband was cheaper and could produce more accurate results to be used for PA monitoring (Liden et al., 2002). These devices are often used in research, particularly in the clinical setting.
46 34 In 2010, Erdogan et al. compared a Polar S810i HRM (HR monitor) and a SenseWear Pro Armband to determine the accuracy at which energy cost associated with a particular exercise could be estimated. Forty-three subjects, 16 males and 27 females, of which 24 were overweight with the remaining 19 being obese, were tested while performing an indoor rowing exercise (Erdogan et al., 2010). Anthropometric data were collected in addition to percent body fat which was estimated using bioelectrical impedance analysis. Exercise testing consisted of an increasing intensity rowing protocol with a 20 second resting period between 2-minute stages so that a blood sample could be taken. The test was ended when subjects were not able to perform at the desired intensity. All subjects then returned to the lab on a separate day to perform a submaximal rowing protocol while wearing the SenseWear Armband and Polar HRM. The submaximal effort which was preceded by a short warm-up period consisted of two 10-minute stages at workloads corresponding to 50 and 70% of VO2max with a rest period of two minutes between each stage. In addition to the wearable devices, a Cosmed K4 was used to collect respiratory gases (Erdogan et al., 2010). The authors concluded that the Polar and SenseWear monitors could accurately estimate energy expenditure (EE) for indoor rowing in an overweight population and that the armbands do not yield significantly different values of EE compared with values obtained using the Cosmed K4 (Erdogan et al., 2010). In a related study, Scheers et al. (2012) further expanded research on the SenseWear Armband by determining sources of variances in PA as well as observing the number of days the device needs to be worn to reliably determine PA patterns. The results are based on data from the pilot and main study which included a total of 502 subjects who were required to wear the armband for 14 days. Of the 502 subjects, data from 313 subjects, 190 males and
47 females, were used as seven complete monitoring days were necessary to produce accurate results. A complete day of monitoring consisted of at least 1,368 minutes (95% wear time) of recorded activity. In addition to wearing the device, subjects were required to record in an electronic diary whenever they began a new activity (Scheers et al., 2012). Based on the results, Scheers et al. (2012) found that PA patterns differed on the weekends with Saturday being a day of increased activity while Sunday was a day of decreased activity compared to a normal weekday. The authors also concluded that a wear time of at least three days spanning a normal work week (Monday through Friday) was necessary to determine normal PA patterns and the device needed to be worn Saturday and Sunday because of the differences previously mentioned (Scheers et al., 2012). Further research was conducted on the SenseWear Armband by Reeve et al. (2014) who evaluated the ability of the armband to record EE during resistance training. The study consisted of 18 participants, 11 males and 7 females, who were experienced (at least six months) with resistance training. However, data on only 15 participants were obtained. After initial measurements, exercise took place over four unique sessions that included familiarization to the protocol, maximal strength testing, and two resistance training sessions that were based on maximal results. VO2 was also measured throughout the course of the study using a Cosmed K4 system. The final two exercise sessions consisted of participants completing nine separate exercises using a protocol of 10 reps for three sets at 70% of their one rep max (Reeve et al., 2014). Reeve et al. concluded that the SenseWear Armband and BodyMedia FIT can be used during resistance training to reliably measure EE. Research on accelerometers spans numerous topics as they are especially useful for PA monitoring in adolescents. In 2007, Tudor-Locke et al. compared two devices, the
48 36 Lifecorder EX (LC) and the ActiGraph accelerometer (AG), under free-living conditions to evaluate their ability to record steps taken and time spent in different categories of PA intensity and assess reliability of the LC. The study consisted of a rather small sample of 10 individuals, 5 males and 5 females (Tudor-Locke et al., 2007). Initial measurements were taken one day prior to exercise. On the day of exercise, two LCs were worn, one on each hip, with only one AG monitor placed on the right hip using an elastic belt to house the devices. Participants were required to wear the devices for all waking hours aside from water activities for a 24-hour period and during a run that lasted at least 20 minutes The authors found that the LC possessed high intra-reliability and recorded 1,516 fewer steps than the AG over the course of a single day. Tudor-Locke et al. (2007) concluded that motion sensors such as these are a new technology and can be used to assess PA. The authors also recommend that research needs to continue on devices in the future in order to establish standardization so that results can be compared across populations and between other studies. A similar study conducted by Abel et al. (2008) compared the LC and AG by measuring step count and EE during walking and running on a TM. A sample of 20 subjects, 10 males and 10 females, were used for this study. Resting metabolic rate was determined using indirect calorimetry before exercise testing took place. Accelerometers were programmed with subject information and were then placed into an elastic belt to be worn at the waist. Two LCs were placed in the belt, one on the left and one on the right, while one AG was placed on the right side of the hip. Additionally, each subject was also equipped with a mouthpiece and nose plugs so that respiratory gases could be collected. All subjects completed a total of three walking and three running TM bouts that increased in speed and lasted for 10 minutes each (Abel et al., 2008). A 2-minute rest period was given between
49 37 each trial to wash out the data and following the conclusion of the last trial so that the accelerometers could record a period of zero steps. To compare to the steps measured by the accelerometers, two researchers counted the number of steps taken using direct observation. Abel et al. found that step count for walking and running is generally underestimated while monitoring using these types of devices. However, the authors concluded that the LC and AG are useful devices for researchers, clinicians, and the public and can be used to estimate EE and track steps taken. Further development and improvement of devices is necessary to improve accuracy and measurements for all populations (Abel et al., 2008). Before accelerometers were used in research, pedometers were the go-to device for PA monitoring. A review conducted by Bravata et al. (2007) examined a total of 2,246 articles and narrowed this collection down to just 26 studies after exclusion based on specific inclusion criteria. The authors examined the correlation of pedometers with PA and improvements in health in outpatient adults (Bravata et al., 2007). Studies were only included in the study if they met the following inclusion criteria: (a) use of pedometers in assessment of outpatient adults, (b) reported a difference in steps per day, and (c) the sample used in the study was greater than five participants. Based on the review and results of 26 studies, the authors concluded that pedometers and PA are correlated because the use of pedometers demonstrates an increase in PA as well as a decrease in BMI and BP. Further research is necessary to determine if these positive outcomes are sustainable (Bravata et al., 2007). In a related study, a meta-analysis on pedometers was conducted by Kang et al. (2009) to evaluate the effect pedometers have on motivation so that they can be used as an intervention. The meta-analysis consisted of a total of 32 studies that met the inclusion criteria which consisted of (a) pedometers were used daily by at least one group of subjects, (b) pedometers were
50 38 used as a way to motivate individuals during the intervention, (c) step counts were recorded both pre and post intervention, and (d) the duration of the intervention lasted at least four weeks (Kang et al., 2009). Based on the 32 studies, Kang et al. (2009) found results similar to Bravata et al. (2007) in that the use of pedometers as an intervention tool had a positive effect on PA and, in general, an average increase of 2,000 steps was seen for all studies. Wearable devices such as accelerometers and pedometers are great tools that can be used to measure PA. These devices are particularly useful in measuring free-living and outdoor PA. Accelerometers and pedometers serve as substantial motivation tools that promote PA by recording steps taken, distance traveled, and even energy expenditure. With further advancements in technology and the development of new devices, research must continue to validate devices so that they can be of use in PA research. GPS Technology and Devices Before GPS technology became widespread and popular, Schutz and Chambaz (1997) theorized that a device utilizing satellite technology (GPS) could potentially be useful to record PA on an individual basis. The study tested a GPS device's ability to determine velocity of walking, running, and cycling in one male subject (Schutz& Chambaz, 1997). The subject was fitted with a GPS receptor while performing the previously mentioned exercises at various velocities around a track. From the results, the authors determined that using GPS to measure velocity of various activities could be of use in the future but further research is necessary, specifically on improving accuracy of determining velocity while walking (Schutz& Chambaz, 1997). While this study was conducted almost two decades ago, it set the course for a new direction of activity monitoring in the literature and
51 eventually prompted a switch from using pedometers to more accurate devices that use GPS technology to record activity. 39 In a review paper by Maddison and Mhurchu (2009), 36 studies were analyzed in order to determine the prevalence of GPS use in the literature over the span of two decades. The paper dives into great detail about what exactly GPS is, how it can be utilized, and references several studies that have found GPS to be useful in the following fields of research: (a) GPS to measure human movement, (b) GPS use in sports, (c) use of GPS to record activity under controlled and free-living conditions, as well as (d) presenting potential limitations to using GPS as a research tool (Maddison& Mhurchu, 2009). After reviewing 36 studies, the authors found that using GPS to monitor PA is a novel method, particularly for monitoring activity under free-living conditions in different environments. Maddison and Mhurchu concluded that while future research is necessary to improve accuracy and analysis of data, GPS can be used as an additional tool to understand PA (Maddison& Mhurchu, 2009). A more recent review paper published by McCrorie et al. (2014) details the combined use of GPS, geographic information systems (GIS), and accelerometers to determine the relationship between PA and the environment in young individuals (5 18 years old) as well as directing future research topics. The study was comprised of a total of 14 papers that met particular inclusion criteria that consisted of: (a) use of accelerometers to measure PA in humans, (b) use of GPS to measure PA, (c) combined use of GPS and accelerometers to be used with GIS, and (d) the age of the participants was between 5 and 18 years old (McCrorie et al., 2014). Using 14 studies the authors determined that there may be a slight risk with ongoing research as many studies are not replicable because of unclear protocols. Specificity of methodologies is necessary in the literature to prevent the occurrence of non-replicable
52 40 studies. However, McCrorie et al. (2014) also found that data on GPS devices point to the importance of pavement and greenspace in order to increase PA in young individuals. Both previously mentioned review studies are of great importance as they demonstrate the increasing presence of GPS monitoring in research and while future research is necessary, the link between PA monitoring and greenspace has been well documented in the literature (Almanza et al., 2012; Coombes et al., 2013; Jones et al., 2009; Lachowycz et al., 2012; McCrorie et al., 2014; Wheeler et al., 2010). A series of studies conducted by Le Faucher et al. (2007, 2008) were among the first to document the use of GPS in outdoor environments on healthy and clinical populations. In 2007, a Garmin 60 GPS was tested to assess the accuracy of recording outdoor walking distance using previously determined distances on an outdoor track. The study was separated into three parts in which a total of 30 participants were used. For part one, each participant was fitted with a Garmin 60 and performed a walking protocol that lasted 31.5 minutes up to four times. The walking protocol consisted of six individual bouts lasting 15 seconds, 30 seconds, 1 minute, 2 minutes, 4 minutes, and 8 minutes. Each trial was separated by a rest period that corresponded to the duration of the previously performed bout. Participants were instructed to walk at a self-selected pace on the inside lane of the track. The GPS device recorded position starting 15 minutes prior to exercise and continued until 15 minutes post exercise (Le Faucher et al., 2007). In part two of the study, participants were fitted with a backpack that housed the GPS device, a watch, and an MP3 player that was used to present a walking protocol vocally that lasted minutes Participants were then instructed to walk to a nearby public park and performed the walking task after letting the GPS determine position for 10 minutes (Le Faucher et al., 2007). For the final portion of the study,
53 41 participants completed two separate walking protocols of 2,000 meters that were made up of a series of distances in a randomized order (100, 200, 300, and 400 meters). Using all of the results obtained over the course of the study, the authors found that the commercially available GPS device (Garmin 60 ) can be used when evaluating outdoor activity for healthy subjects. In particular, the GPS device could be used to determine walking and resting periods as well record speed and distance during exercise (Le Faucher et al., 2007). The authors also stated that GPS devices could be of use in evaluating PA and capacity in clinical populations. Continuing their research from 2007, Le Faucher et al.(2008) analyzed walking distance and speed using a GPS device in patients with peripheral arterial disease (PAD). Their aim was to compare TM analysis of walking to non-tm methods in clinical patients as well as present both benefits and limitations to each method of measurement (Le Faucher et al., 2008). A total of 24 patients with PAD were used to assess walking distance and speed. The study was divided into five parts which consisted: (a) a walking impairment questionnaire, (b) self-reported maximal walking distance, (c) a TM walking test at 10% grade with increasing speed up to 4 minutes followed by a maximum of 16 minutes of walking at the capped speed, (d) a 6-minute walking test, and (e) an unsupervised walking activity using a GPS device (Garmin 60 ) that lasted at least 45 minutes in which participants walked freely around a public park (Le Faucher et al., 2008). The authors found that maximal walking distance recorded by the GPS device was highly correlated to maximal walking distance measured during the TM test. Le Faucher et al. (2008) concluded that GPS recording of PA for research in clinical populations is an upcoming field and an alternative approach to laboratory testing.
54 42 Validity and reliability of GPS devices are a major concern in PA research as the accuracy of measuring is largely dependent on the use of satellites to determine location, which proposes obvious issues with any potential obstruction such as a large building or trees. In 2012, Wieters et al. tested the ability of four different GPS devices to measure outdoor PA. The researchers used a Garmin Forerunner 205, a Garmin Foretrex 201, a Globalsat DG-100, and a Wintec Easy Showily. The accuracy of each GPS device was evaluated by determining the deviation from a known route walked, difference in position after changing the position of the unit on the participant s body, and variation of position from a known geodetic point (Wieters et al., 2012). A geodetic point is a static reference point on Earth that can be used to determine location. After assessing all units, the authors concluded that GPS could be used as a recording tool in PA research based on an acceptable level of reliability and validity demonstrated by each GPS. Further, the Garmin Forerunner 205 demonstrated the greatest accuracy by producing the fewest errors in measurement during the walking route. Wieters et al. (2012) suggested that future research is necessary to evaluate new equipment as accuracy in measurement using GPS increases. This will inevitably lead to more convenient methods to collect PA data in the open environment. Further expanding the research on the validity of GPS devices, Duncan et al. (2013) tested seven different GPS units to assess the static validity of measurement in varying environments and evaluated the time it took for satellites to acquire a signal and determine location across all models. In particular, a Garmin Forerunner 205 and Garmin Foretrex 201 were used among the seven devices. For the study, six environmentally unique geodetic sites were used on three separate occurrences to assess signal acquisition time and battery life. The setting of each geodetic site differed as some locations were set under an
55 43 open sky to produce no interference whereas others were next to high-rise buildings to cause a potential disruption in the signal. Duncan et al. found that the Forerunner 205 outperformed the other devices and particularly excelled under conditions of high signal disruption. In unobstructed conditions, GPS devices can be used with confidence to determine static location (Duncan et al., 2013). However, obstructed conditions such as high-rise buildings and trees can potentially produce errors in certain lesser models. While in its present form GPS is useful in research, future research is necessary, specifically for free-living activities to evaluate the performance and accuracy of GPS monitoring in the field (Duncan et al., 2013). Recent research has emerged on the role of GPS devices in promoting PA through exergames. The effect of implementing exergames as an intervention in older adults has been well documented in a review paper by Chao et al. (2014). The review includes 22 studies that met inclusion criteria including the use of Nintendo Wii exergames as an intervention for cognitive performance, physical function, and psychosocial factors in older individuals (Chao et al., 2014). After analyzing the results of all 22 studies, the authors concluded that exergames are a great source of motivating older adults to participate in PA using a safe and reasonable method to exercise. Chao et al. also found that Nintendo Wii exergames have beneficial effects on cognition, physical function, and psychosocial outcomes through improving mood, social support, and PA. Additionally, the authors concluded that exergames could be a useful intervention tool, particularly in populations lacking motivation, although further research is necessary (Chao et al., 2014). The combined effect of GPS and exergames was presented by Boulos et al. (2013), who examined over 45 different exercise based games, applications, devices, and gadgets to determine their effect on health and fitness. To find relevant studies, an online search was conducted to identify research involving GPS,
56 44 exergames, geosocial applications, and gadgets. The authors also browsed popular mobile application stores and marketplaces to find various exercise applications (Boulos et al., 2013). Using the results, the authors concluded that GPS based exergames could be a potential alternative or accessory to traditional sports such as football and skiing, particularly for adolescents. Buolos et al. (2013) recommend that future research should expand on the use of GPS and exergames as they could be used to combat the growing obesity epidemic since they are a form of video games that require individuals to be outside and engage in PA. VO2max Prediction Using Smart Watches The VO2max prediction feature of sports watches is relatively new and few studies exist on the topic. Recently, three abstracts were published on the topic and tested the predictability of several different watches including the Polar FT60, Polar V800, and the Garmin Forerunner 230 and 235. One study, conducted by Johnson and Beadle (2017) examined the predictability of VO2max using the Polar FT60 Fitness Test. The test aimed to predict VO2max using resting heart rate, participant characteristics, and activity level from the past three months. Thirty-one subjects, 13 males and 18 females, volunteered for the study and all testing was completed in one visit. After initial anthropometrics were recorded each participant s VO2max was predicted using the Polar FT60 Fitness Test. This test requires participants to lie down and rest for 5 minutes while wearing the sports watch and a heart monitor contained in a chest strap (Johnson& Beadle, 2017). During the test, resting heart rate variability is collected and used to predict VO2max along with participant characteristics and previous activity level. Following the resting fitness test, participants completed a VO2max test on a TM. The authors found that the Polar FT60 Fitness Test overestimated
57 VO2max by roughly 10% compared to the directly measured value obtained during the GXT (Johnson & Beadle, 2017). 45 Similar to the study above, Snyder et al. (2017) examined the accuracy of prediction of three different sports watches. In this study, a directly measured VO2max value obtained using a standard TM protocol was compared to a predicted value by the Polar V800 and Garmin Forerunner 230 and 235. The Polar V800 predicts VO2max using resting heart rate variability during a 5-minute test in which the participant lies down and relaxes. The Garmin 230 and 235 predict VO2max based on a 10-minute outdoor run performed at selfselected pace (Snyder et al., 2017). The main difference between these two watches is that the 230 records HR using a standard chest strap monitor while the 235 records HR using an optical sensor within the watch and collects HR data at the radial pulse. Forty-two participants, 24 males and 18 females volunteered for the study. On day one of testing, participants completed a resting fitness test while wearing the V800 and a VO2max value was predicted based on participant characteristics and different training zones programmed into the watch. Afterwards, participants completed a GXT using a TM protocol so that a direct VO2max could be obtained. On day two of testing, within 48 hours, participants completed a 10-minute outdoor run while wearing the 230 and 235. This run was completed outdoors because the watch uses GPS signal to measure distance and was performed using a selfselected pace (Snyder et al., 2017). The authors found significant differences between directly measured and all predicted VO2max values. The results differed by gender with an overestimation by the watches in all cases for males whereas the watches overestimated and in some cases underestimated VO2max in females (Snyder et al., 2017).
58 46 Using the same data as the study above, Willoughby et al. (2017) compared VO2max values predicted by the Garmin Forerunner 230 and 235. Additionally, distance, kcals, cadence, and average and maximal HR obtained during a 10-minute outdoor run was compared. The comparison of average and maximal HRs were particularly important as HR values are collected differently across the two watches. The 230 records HR using a chest strap while the 235 records HR at the radial pulse using an optical sensor in the watch. Each participant performed a 10-minute outdoor run using a self-selected pace while wearing both watches and a chest strap. A location free of GPS interference was used and participant characteristics including gender, age, height, and weight were programmed into the watch before any exercise took place (Willougby et al., 2017). The authors found no significant differences for maximum HR, distance, pace, or kcals. However, average HR was significantly higher in the 230 for both genders. Interestingly, no significant difference in predicted VO2max was observed in females while a difference in predicted VO2max occurred in males. The 230 consistently predicted a lower value compared to the 235. Willoughby et al. concluded that the 230 predicted a significantly lower VO2max value because average HR recorded using the 230 (chest strap) was significantly higher. Summary VO2max can be measured using several different techniques that all possess certain benefits as well as inherent limitations. Whether determining VO2max through submaximal exercise, maximal testing protocols, or estimation using regression models, each method can be utilized to provide the most accurate results for a given population. In research, exercise testing should be geared toward the target population to ensure safety of the participant.
59 47 Submaximal methods and prediction equations are of great interest as they offer a costeffective and time-efficient alternative to standard maximal exercise testing. The combination of the aforementioned methodologies with GPS monitoring could lead to major advancements in exercise testing, PA monitoring, and produce more efficient styles of collecting data. Pedometers and accelerometers have been used extensively in PA monitoring and have been shown to increase PA, improve health outcomes, and even accurately measure EE during exercise. GPS devices are already a growing field in the literature with most research focusing on measuring the association between PA and the environment. While the connection between greenspace and increased PA has already been thoroughly documented, research on the use of GPS technology in exercise physiology research is necessary.
60 48 Chapter 3 Research Design and Methodology Participants Thirty participants, 16 males and 14 females between the ages of 18 and 55 years old, volunteered for this study. Sample size was determined using G*Power 3.1. An a priori power analysis was selected for a one-way repeated measures ANOVA (1x3; within factors). Alpha was set at 0.05, beta (power) as 0.08, and effect size F as This produced a sample size of 28. All participants were considered to be fit individuals who exercised at least three times per week. Participants were recruited by word of mouth and flyers that were hung around Eastern Michigan University s (EMU) campus. Prior to any measurements and exercise testing, all participants read and signed a written consent form that explained in full detail the expectations, benefits, and risks of the study (Appendix A). Additionally, participants filled out a PAR-Q (Appendix B) and Health-History Questionnaire (Appendix C) to ensure that they were ready for exercise. This study has been approved by EMU s institutional review board (Appendix D). Procedures All participants completed a VO2max test using a treadmill (TM) protocol, a 15-minute run outside around a 0.5-mile loop while wearing a Garmin Forerunner 235 GPS watch (Garmin, Ltd., Schaffhausen, Switzerland) and wore the watch for up to one week after initial testing. After the submaximal 15-minute outdoor run on EMU s campus, participants wore the watch for a maximum of 7 days and were required to perform three additional runs of at least 30 minutes in duration. Exercise testing took place over the course of two visits
61 49 that were separated by a minimum of 24 hours and time between tests did not exceed 7 days. Total time required by the participant to complete this study was 2 weeks or less. On both days of testing, participants arrived at the Running Science Laboratory located in Rackham Hall at Eastern Michigan University. Participants were required to arrive in a fasted state (no nutrient intake in the past three hours), which generally consisted of an overnight fast. In addition to fasting, participants were required to refrain from consuming any caffeine within the past three hours and were asked to avoid strenuous exercise 24 hours prior to testing. Garmin Forerunner 235 The Garmin Forerunner 235 (Garmin, Ltd., Schaffhausen, Switzerland; weight, 42.0 g; width, 45.0 mm; height, 45.0 mm; thickness, 11.7 mm) is a global positioning system (GPS) sports watch that records distance, time, pace, and monitors heart rate (HR). Continuous HR monitoring is achieved by measuring beats per minute (bpm) using an optical sensor within the watch at the radial pulse, which conveniently allows users to run without a chest strap. The GPS watch also produces personalized HR zones based on maximal and resting HR values that are programmed in when customizing the user profile. The user profile allows individualized programming of the watch and can be reset after each use for new participants. Programming of the user profile consists of gender, birth year, height (in.), weight (lbs), and HR zones detailed above. In addition to activity monitoring, the watch has a race predictor feature (5k, 10k, half and full marathon), the ability to customize goal-oriented workouts, personal record tracking, and the ability to estimate recovery time and VO2max based on a single run of 10 minutes outdoors. In this study participants ran for 15 minutes outdoors to ensure an estimated VO2max was produced. In some cases, during pilot testing, VO2max was not estimated after running 10 minutes. There are several factors that could have
62 50 contributed to this error, particularly GPS accuracy and continuous HR monitoring, which are both described in the discussion. Only the estimated VO2max feature was used for the purpose of this study. Other activity tracking features that the watch possesses are recording total steps, distance traveled, estimated calories burned for a 24-hour period, and sleep monitoring. The built-in accelerometer allows distance, pace, and time to be recorded so that users can run on an indoor track or TM. In addition to the watches activity monitoring features, it serves as a social media platform through the online Garmin Connect Network from which users can share their results with one another. Other applications exist on the App Store and Google Play that allow unique customizability of the watch. Visit 1 On day one, participants arrived at the Running Science Laboratory at EMU in a fasted state. Upon arrival to the testing site, participant s height (cm) and weight (kg) was recorded prior to exercise using a Tanita BWB-800S scale (Tanita Corporation of America Inc., Arlington Heights, IL, USA) for weight and a DETECTO 439 Physician Scale (DETECTO Scale Company, Webb City, MO, USA) to measure height while wearing light clothes and no shoes. All measurements were taken twice to ensure accuracy and then the average of the two values was recorded and entered into the computer for calibration of the metabolic cart. All participants completed a maximal GXT test on day one of testing. GXT tests were performed on a True Fitness S Drive TM (True Fitness Technology, St. Louis, MO, USA). Respiratory gases were collected and analyzed at a 10 second sampling interval using a Parvo Medics TrueOne 2400 metabolic cart (Parvo Medics, Sandy, UT, USA). Calibration of all equipment was done prior to participant arrival on the day of testing.
63 51 A maximal exercise protocol similar to the Arizona State University protocol developed by George (1996) was used for the purpose of this study. Participants began by straddling the TM while the protocol was explained in detail as well as the necessary actions and precautions to take when terminating the test. The protocol used for this study consisted of two minute stages at a self-selected jogging pace with a 2% increase in grade at the beginning of each new stage (Table 1). For the warm-up portion of the test, participants selected a pace greater than 6.0 mph for males and 5.5 mph for females that they believed could be maintained for 30 minutes at 0% grade. After a two-minute warm-up at the selfselected, the TM is stopped and participants again straddled the TM. Participants were then fitted with headgear, nose plugs, and a mouthpiece (Hans Rudolph, Inc., Shawnee, KS, USA) with the purpose of collecting respiratory gases to be analyzed in determining VO2 continuously throughout the test. Additionally, participants were fitted with an electric HR monitor (Polar Electro Inc., Lake Success, NY, USA) so that HR could be monitored for the duration of the test. Then, the timer was started and respiratory gas collection began while participants stood idly for 2 minutes to allow baseline measurements to be completed. After the initial 2-minute sampling period, the TM was set to the speed selected by the participant during the warm-up portion with 0% grade and the exercise portion of the test began. Every 2 minutes thereafter, TM grade was increased by 2% while speed remained constant until the participant experienced volitional exhaustion and voluntarily ended the test due to fatigue. VO2 and HR were recorded each minute during the GXT and the full results were printed and stored as a hard copy after the test which provided respiratory and metabolic values every 10 seconds during the test. An example of the protocol with a participant running at 6.0 mph can be found in Table 1. After completion of the test, the headgear, mouth piece, and nose plugs
64 52 were immediately removed, and participants were required to walk on the TM at a selfselected pace and 0% grade as a cool down until their HR fell below 100 bpm. Once the participant s HR was below 100 bpm and they verbally communicated that they felt normal, the participant was free to leave the testing site. The test is considered to be a maximal effort and therefore a VO2max if at least two of the following three criteria are satisfied based on a study conducted by Kline et al. (1987):(a) no further increase in oxygen consumption despite an increase in workload, (b) a respiratory exchange ratio (RER) 1.10, and (c) a HR within 15 bpm of the participant's age predicted max which was found using the equation 220 age = maximal HR (Kline et al., 1987). Visit 2 On day two, participants arrived at the Running Science Laboratory at EMU in a fasted state. Before their arrival, the researcher recorded the outside weather conditions for the area (zip code 48198), which consisted of relative humidity (%) and temperature (Celsius and Fahrenheit) from After height (in.) and weight (lbs.) are recorded, the researcher programed the GPS watch based on the participant s characteristics, specifically gender, age, height, and weight. The GPS watch was used to record duration of the exercise, distance, pace, HR using the radial pulse, and estimated VO2max based on exercise data recorded during the run as well as participant characteristics (gender, age, height, weight, and maximal HR). Before any exercise took place, the participant was fitted with the GPS watch before walking outside. This was done to ensure accurate HR readings before and during exercise. This is a known issue according to Garmin s troubleshooting section of their website for the Garmin Forerunner 235. Their suggestion to correct this error in
65 53 measurement is to warm-up with the device on for 5 10 minutes before beginning recording any activity. Additionally, the watch was fitted to the participant before stepping outside to allow time for the GPS software to locate the participant and be ready for activity monitoring. Participants wore the watch around their wrist which was placed on the anterior aspect of the wrist so that the radial pulse may be collected as efficiently as possible. The participant was then directed outside to a 0.5-mile loop previously measured on EMU s campus. They were instructed to run around the 0.5-mile course as many times as possible in 15 minutes at a pace that feels comfortable to them. Participants were required to refrain from walking at any time during and were motivated to complete the submaximal run to the best of their ability. Additionally, the participant was informed how to stop the timer on the watch once 15 minutes had elapsed which consisted of pressing one button on the upper right corner of the watch. Before beginning the timed run, the researcher and participant stood still at the starting point to ensure GPS accuracy. Once the watch face read GPS Ready," the researcher pressed the start button on the watch and the participant began the test. After completion of the exercise bout, participants were instructed to press the Stop button, which prompts them with a red stop sign on the watch face and data collection ends. The participant then removed the watch and handed it to the researcher while walking around freely to cool down. Upon acquiring the GPS watch from the participant, the researcher saved the activity by using the watch s activity recording function. Total time (~15 minutes), distance, pace, and predicted VO2max were recorded. After completion of the timed run and before departure, the participant was given detailed instructions orally by the researcher and received a handout explaining how to operate the GPS watch for additional use over the course of the next week. Participants were
66 54 then required to wear the Garmin Forerunner 235 for a maximum of seven days and perform a minimum of three outdoor runs of at least 30 minutes. The original outdoor run on EMU s campus predicts relative VO2max based on the variables mentioned above and any input thereafter from recorded activity adjusts their VO2max value accordingly. As the GPS watch is also a pedometer, accelerometer, and HR monitor, VO2max only adjusts based on recorded activity and not based on number of steps taken per day or HR throughout the day. Because of this technological advancement, participants were not required to wear the watch 24 hours per day and were also instructed to remove the watch if performing aquatic activities or showering. After 7 days and performing three outdoor runs of at least 30 minutes in duration, the participant returned the GPS watch to the Running Science Laboratory at EMU. The researcher checked the activity history to ensure that three activities had been recorded and satisfied the time requirement. Total time, pace, and distance were recorded for each exercise bout completed by the participant. Additionally, the adjusted predicted VO2max value was recorded to be compared to the predicted value received one-week prior and to the directly measured VO2max value on day one of testing. These methods yielded three relative VO2max values, one maximal and two submaximal for analysis. Statistical Analysis To determine statistical significance, a confidence level of 95% (p-value =.05) was used for all tests. Additionally, descriptive statistics of mean and standard deviation were used for age, weight (kg), height (cm), treadmill speed (mph), directly measured VO2max (ml/kg/min), predicted VO2max (ml/kg/min), adjusted predicted VO2max (ml/kg/min), pace (min) and distance (mi) for the initial 15-minute outdoor run, and pace and distance for the three additional exercise bouts. Three measurements of VO2max were recorded for each
67 55 participant. A post hoc power analysis was conducted for a repeated measures ANOVA with within-between interaction (two-way repeated measures ANOVA). Alpha was set at 0.05, beta (power) as 0.08, and effect size F as This produced a sample size of 28, indicting enough participants had completed data collection for this type of analysis to be conducted. A two-way repeated measures ANOVA was conducted to determine if there was a statistically significant difference between directly measured VO2max, predicted VO2max based on a 15-minute outdoor run and adjusted predicted VO2max based on three additional running bouts of at least 30 minutes in duration over the course of no greater than seven days. All activities recorded using the GPS sports watch were performed outdoors to ensure GPS signal strength and accuracy. The differences between all VO2max measurements were examined for all participants. Further, participants were divided into two groups based on directly measured VO2max: VO2max greater than 50ml/kg/min (high) and VO2max less than 50 ml/kg/min (low). A one-way repeated measures ANOVA was conducted to determine if there was a statistically significant difference between recorded VO2max values for each group.
68 56 Time (min) Speed (mph) Table 1 Data Collection Sheet 01:00 Baseline Measurements : :00 Exercise : : : : : : : : : : : : : Grade (%) HR VO2 (ml/kg/min)

69 57 Chapter 4 Presentation and Analysis of Data Of the 30 participants who volunteered to participate in this study, 28 participants (14 males and 14 females) completed the necessary requirements. One participant failed to return for the second visit and one participant suffered an ACL injury independent of the study and was therefore excluded from data analysis. Descriptive statistics for all participant characteristics, VO2max measurements, and recorded exercise activities can be found below in Tables 2, 3, and 4, respectively. ly. Table 2 Descriptive Statistics of Participants


 directly measured VO2max, (b) a predicted")
70 58 Table 3 Descriptive Statistics of All VO2max Values Table 4 Descriptive Statistics of Additional Exercise Activity The purpose of this study was to examine the predictability of VO2max using a global positioning system (GPS) sports watch. Three separate values for VO2max were obtained: (a) directly measured VO2max, (b) a predicted VO2max value based on a 15-minute outdoor run,
71 59 and (c) an adjusted predicted VO2max value based on three subsequent outdoor runs of at least 30 minutes in duration. It was hypothesized that the Garmin Forerunner 235 would not be an accurate predictor of VO2max for the general population. A two-way (2 fitness groups x 3 VO2max time points) repeated measures ANOVA was conducted to determine if a statistically significant difference existed among direct, predicted, and adjusted predicted VO2max recorded during the study for all participants. Additionally, participants were divided into two fitness groups based on direct VO2max: high (> 50 ml/kg/min) and low (< 50 ml/kg/min VO2max). A one-way repeated measures ANOVA was conducted to determine if a significant difference existed among VO2max values for groups. Descriptive statistics for groups separated by VO2max can be found in Tables 5 and 6. Statistical significance was set using a p-value of.05. When first interpreting the results of a two-way repeated measures ANOVA, the assumption of sphericity must be examined. Sphericity is when the relationship between pairs of measurements, in this study the three different VO2max values that were recorded, is assumed to be similar, which means that the level of dependence between pairs formed by these measurements are roughly equal. If sphericity is violated, then a loss of statistical power occurs. To ascertain if sphericity has been violated, the results of Mauchly s Test of Sphericity are examined to determine if the variances between measured pairs are equal (Field, 2016). If Mauchly s test statistic was not significant, the assumption of sphericity has been met. However, if Mauchly s test statistic was significant, the assumption of sphericity has been violated. The results of Mauchly s test of sphericity are provided below in Table 7. Because Mauchly s test statistic was significant (p-value <.001), it can be concluded that significant differences exist between the variances of differences among pairs. This indicates
72 60 that the condition of sphericity required when performing a repeated measures ANOVA has not been met (X 2 (28) = , p =.000). Since the conditions of sphericity have been violated, the degrees of freedom were corrected using the Greenhouse-Geisser estimates of sphericity (ε = 0.687). As a result, the degrees of freedom are smaller, which makes the produced F ratio more conservative. The Greenhouse-Geisser estimate of sphericity (ε) is provided below in Table 7. The Greenhouse-Geisser correction was used to examine the within-subjects effects because ε is less than 0.75 (Field, 2016). Using the Greenhouse-Geisser correction, the results indicate that a significant difference among recorded VO2max values (direct, predicted, and adjusted) was found, F(1.37, 35.72) = 11.60, p-value <.01(Table 8). To determine which VO2max values were significantly different from each other, group means were compared using Bonferroni to adjust for multiple comparisons. The three VO2max values (dependent variables) used for pairwise comparison are denoted below in Table 9. Direct, predicted, and adjusted VO2max are coded as dependent variables 1, 2, and 3, respectively. A statistically significant difference was observed (p-value <.05) between directly measured VO2max (dependent variable 1) and predicted VO2max (dependent variable 2). A statistically significant difference was also observed (p-value <.001) between directly measured VO2max and adjusted VO2max (dependent variable 3). Additionally, there was a significant difference between predicted VO2max and adjusted VO2max (p-value <.05; Table 10).


73 61 Table 5 Descriptive Statistics of the High VO2max Group Table 6 Descriptive Statistics of the Low VO2max Group


74 62 Table 7 Mauchly's Test of Sphericity Two-Way ANOVA Table 8 Tests of Within-Subjects Effects Two-Way ANOVA


.")
75 63 Table 9 Dependent Variables Two-Way ANOVA Table 10 Pairwise Comparisons Two-Way ANOVA It was further hypothesized that the Garmin Forerunner 235 would be an accurate predictor of VO2max for individuals with a VO2max of less than 50 ml/kg/min. A significant interaction between VO2max and fitness level was observed (p-value <.001; Table 11). Participants were divided into groups based on the directly measured VO2max recorded during
76 64 visit one. Seventeen participants had a VO2max of greater than 50 ml/kg/min. Descriptive statistics for characteristics and all VO2max values recorded for this group can be found above in Table 5. Eleven participants had a VO2max of less than 50 ml/kg/min. Descriptive statistics for participant characteristics and all VO2max values recorded for this group can be found above in Table 6. Before the results of the one-way repeated measures ANOVA can be interpreted, the condition of sphericity must be examined. The results of Mauchly s test of sphericity are located in Table 12. Because Mauchly s test statistic was significant (p-value <.001) for the high VO2max group, it can be concluded that significant differences exist between the variances of differences among pairs. This indicates that the condition of sphericity required when performing a repeated measures ANOVA has not been met (X 2 (17) = 9.65, p =.008). Since the conditions of sphericity have been violated, the degrees of freedom were corrected using the Greenhouse-Geisser estimates of sphericity (ε = 0.678). Because ε is less than 0.75, the Greenhouse-Geisser correction was used to examine the within-subjects effects 67. Using the Greenhouse-Geisser correction, the results located in Table 13 indicate that a significant difference among recorded VO2max values (direct, predicted, and adjusted) was found, F(1.36, 21.70) = 32.32, p-value <.001(Table 13). To determine which VO2max values were significantly different from each other, group means were compared using Bonferroni to adjust for multiple comparisons. The results of the way one-repeated measures ANOVA are located below in Table 14. A statistically significant difference was observed (p-value <.001) between directly measured and predicted VO2max for the high group. A statistically significant difference was also observed (p-value < 0.001) between directly measured and
, and therefore, the condition of sphericity has been met and no further correction is necessary.")
77 65 adjusted VO2max. No significant difference existed between predicted and adjusted VO2max (p-value >.05; Table 14). Mauchly s test statistic was not significant for the low VO2max group (Table 12), and therefore, the condition of sphericity has been met and no further correction is necessary. The results of the way one-repeated measures ANOVA are located in Table 14. These results indicate that for the low VO2max group a statistically significant difference does not exist between directly measured and predicted VO2max, directly measured and adjusted VO2max, or predicted and adjusted VO2max (p-value >.05). Additionally, a graphical representation of mean VO2max values for the high and low group can be viewed in Figure 1. Table 11 Pairwise Comparisons of Groups One-Way ANOVA


78 66 Table 12 Mauchly s Test of Sphericity One-Way ANOVA


79 67 Table 13 Tests of Within-Subjects Effects One-Way ANOVA


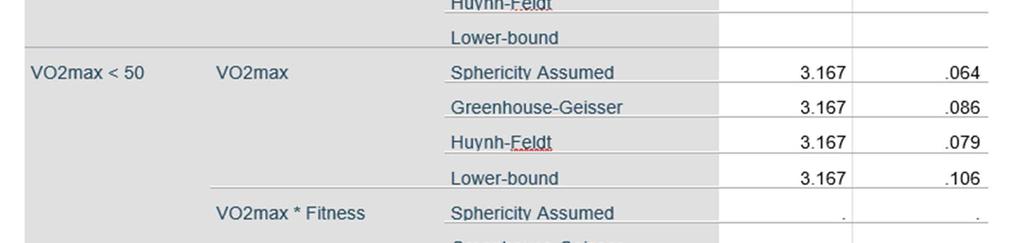

80 Table 13 continued 68


81 69 Table 14 Pairwise Comparisons One-Way ANOVA


82 Figure 1. Direct, predicted, and adjusted VO 2max values by group. 70
83 71 Chapter 5 Summary The purpose of this study was to evaluate the predictability of VO2max using a commercially available global positioning system (GPS) sports watch. Three separate VO2max values were recorded for each participant, which included a directly measured VO2max using a treadmill (TM) based graded exercise test (GXT), a predicted value following a 15-minute submaximal outdoor run while wearing the GPS sports watch, and an adjusted predicted value that was influenced by three additional outdoor runs of at least 30 minutes in duration. The secondary aim of this study was to examine if the watch could accurately predict VO2max for individuals with a VO2max of greater than 50 ml/kg/min and for individuals with a VO2max of less than 50 ml/kg/min as measured during the GXT. A two-way repeated measures ANOVA was conducted, and the pairwise comparison results indicated that a statistically significant difference existed between directly measured VO2max and predicted VO2max (pvalue <.05), directly measured and adjusted predicted VO2max (p-value <.001), and predicted and adjusted predicted VO2max (p-value <.05). After subjects had been split into two groups based on directly measured VO2max (high or low group), a one-way repeated measures ANOVA was conducted. The results indicated that a statistically significant difference existed between directly measured and predicted VO2max for the high VO2max group (p-value <.001). A significant difference was also observed between directly measured and adjusted predicted VO2max for the high group (p-value <.001). However, no significant difference existed between predicted and adjusted predicted VO2max (p-value >.05). No significant difference existed between VO2max values for the low VO2max group (pvalue >.05).
84 72 Predictors of VO2max The Garmin Forerunner 235 utilizes a regression equation to predict VO 2max after a single 10-minute self-paced outdoor run. As there are several variables used to predict VO2max, it is difficult to determine which is the largest contributor to inaccuracies observed in the predicted VO2max results. When programming the smart watch for a given participant, age, weight, height, gender (male or female), and maximal heart rate (HR) are entered before any exercise takes place. After a single activity, time of completion, distance, average and maximal HR during exercise, pace, and kcal are recorded. VO2max is likely predicted using a combination of variables including, but not limited to, age, weight, height, gender, average and maximal HR during exercise, distance, and pace for a recorded activity. Each of these variables contributes to the prediction equation and the magnitude of its effect is likely determined by the constant the variable is multiplied by and whether the variable is assigned as a positive or negative in the regression equation. As with most VO2max estimates, a linear regression model is typically used to predict VO2max (Bradshaw et al., 2005; Ebbeling et al., 1991; George et al., 1993, 1997, 2007, 2009, Heil et al., 1995; Jackson et al., 1990; Kline et al., 1987; Schembre et al., 2011; Vehrs et al., 2011; Webb et al., 2014). As most of the variables remain unchanged during exercise, pace and heart rate are assumed to be the largest contributors in the prediction equation. Pace is expected to be a major factor in the regression model as it is the quotient of distance and time for a given activity. Pace can vary greatly across individuals and in this study pace ranged from 6:22 min/mile to 12:46 min/mile. With such a large range, possibly due to variations in elevation and surface (trail or pavement), it is reasonable to believe that pace is one of the largest contributing variables. Since HR is the greatest contributing
85 73 physiological variable and was recorded at the radial pulse using an optical sensor, it can be assumed that HR has the greatest effect on VO2max prediction. This is reasonable to assume because HR is a tightly regulated homeostatic variable by the parasympathetic and sympathetic nervous systems and regardless of fitness level, HR increases in response to exercise. The magnitude of increase is what differs between untrained and trained individuals. This key physiological adaptation to training is what led to differences in VO2max prediction if all other variables are held constant. The wide range of pace mentioned above can be contributed to unobservable differences in elevation during the additional outdoor runs. The Garmin Forerunner 235 does not record elevation changes during exercise within the watch itself. While this could be considered a limitation to the study, only this watch and its built-in features were tested. Higher-end models developed by Garmin have the technology to record elevation, which could greatly influence the predicted VO2max value if the individual is a trail runner or performs outdoor runs in areas with large changes in elevation. However, the Garmin Connect mobile application does have an elevation-recording feature. After recording a run using the 235 and syncing the activity with the Garmin Connect application, more detailed results are displayed including elevation throughout exercise. While the GPS sports watch itself does not have the ability to record changes in elevation, the mobile application can based on GPS data. Due to this difference in technology, the effect of changes in elevation on pace can be excluded as a limitation because the watch does not include this feature. Future studies with the 235 could enforce stricter requirements for exercise by limiting elevation changes and instructing participants to complete different types of exercise activities such as including longer distance or faster, anaerobic threshold level runs.
86 74 Age is another variable to examine in closer detail in regard to prediction equations and exercise data. As is typically the case in exercise physiology, age is often assigned as a negative variable in exercise regression equations. At first glance, this is a reasonable decision because cardiorespiratory fitness typically diminish with age, which is why norms for VO2max decline with age. This idea presents a problem when evaluating regression equations that predict VO2max using multiple variables, particularly in highly fit individuals. For the general population, a decline in fitness with age is normal due to increased time spent inactive and less time spent participating in physical activity (PA). However, in highly fit individuals, specifically, regular runners, this decrease in cardiorespiratory fitness, and therefore VO2max, is often mitigated to a significant degree (Rogers, Hagberg, Martin, Ehsani, & Holloszy, 1990). While a relatively narrow range of individuals were tested in the present study, ± 5.69 (mean ± standard deviation) years old due to the convenience of participant recruitment on a college campus, one highly-active male, age 46, was included in the analysis. Interestingly, the male s directly measured VO2max was 55.4 ml/kg/min while the predicted and adjusted predicted VO2max were 59 and 57 ml/kg/min respectively. In contrast, a female, age 39 had a directly measured VO2max of 46.6 ml/kg/min and a predicted and adjusted predicted VO2max of 43 ml/kg/min. While both individuals were significantly older than the large majority of participants tested in the study, opposite results were produced than what was typically observed for the low and high VO2max groups. An overestimate of VO2max was observed for the 46-year-old male while an underestimate of VO2max was observed for the 39-year-old female, opposite of what was observed on average for other participants in both groups. A few conclusions can be drawn from the participant s age, fitness levels, and VO2max values. As observed in the one-way repeated measures
87 75 ANOVA, the watch was able to accurately predict VO2max for the low group (< 50 ml/kg/min) while unable to predict VO2max for the high group (> 50 ml/kg/min). For all other individuals in the high VO2max group (N = 16), an underestimate in prediction was produced. However, an overestimate was produced in this case. Although there are many variables used in the prediction equation of the watch, these results suggest that age may be a large contributor in the regression equation because although these participants were significantly older compared to others in the study, their predicted VO2max values were opposite compared to all other participants. Additionally, as all participants recruited in this study were active individuals, the fitness levels of the older participants indicate that regular training while aging can combat reductions in cardiorespiratory fitness levels that are typically seen with age. Research shows that in sedentary males, VO2max declines roughly 12% per decade whereas in master athletes, VO2max declines only 5.5% per decade. These results indicate that regular endurance training overtime can blunt the decrease in VO2max by roughly one-half (Rogers et al., 1990). Similar Research A recently published abstract compared the predicted VO2max, average and maximal HRs during exercise, cadence, distance, and kcals during a 10-minute self-paced outdoor run in males and females using the Garmin Forerunner 230 and 235 (Willoughby et al., 2017). The notable difference between these two devices is that the 230 uses a chest strap to record HR while the 235 uses an optical sensor integrated into the watch to record HR via the radial pulse. This major technological advancement between devices led to differences in average HRs and predicted VO2max values. A significant difference between average HR was observed in males and females with the 230 model yielding a higher average HR. In males, a
88 76 significant difference in predicted VO2max was found across devices. The 230 predicted a lower VO2max value while no significant difference existed for females. No significant differences were found in maximal HR, distance, pace, and kcal between watches (Willoughby et al., 2017). The main conclusion that was drawn from these results was that due to the lower average HRs recorded using the 235 wrist-based optical sensor model, higher predicted VO2max values were produced. The 235 predicted a higher VO2max value in males, which indicates that variation in average HR is the sole contributing factor to the observed differences. From a physiological viewpoint, the observed results make sense because if the average HR recorded during an exercise bout was lower than the true value, then the predicted VO2max value would be higher than expected. For example, if two participants with the exact same characteristics (age, weight, height, and maximal HR) were to complete a 15- minute run with an average pace of 7:30 min/mile, the total distance completed would be two miles. If participant one completed the run with an average HR of 160 beats per minute (bpm) and a maximal HR of 180 bpm while participant two completed the run with an average HR of 175 bpm and a maximal HR of 180 bpm, then their predicted VO2max values would be different. Since all other variables were held constant, the only changing and therefore influential variable in the regression model would be average HR during the run. The predicted VO2max value would therefore be higher in the participant with the lower average HR. This is reasonable to conclude as participant one would have completed the run with an overall lower effort level, which when using only a linear regression model would yield a higher VO2max value because the perceived effort by the watch would be lower for this individual. However, this concept does not explain the general trend of underestimation
89 77 of VO2max observed in this study for participants who produced a directly measured VO2max value of greater than 50 ml/kg/min. In comparison to Willoughby et al. s (2017) results, inaccuracies in prediction made by the smart watch seem to occur when participants with a high level of cardiorespiratory fitness are tested as the watch consistently underestimated VO2max after an initial 15-minute outdoor run and after additional activity recording. Similar to the present study, another recently published abstract examined the accuracy of VO2max prediction across multiple smart watches including the V800 by Polar and the Garmin Forerunner 230 and 235 (Snyder et al., 2017). The study compared a directly measured VO2max value obtained using a GXT to a VO2max value predicted by the smart watch. The V800 predicts VO2max based on a resting HR variability test while the 230 and 235 predict VO2max based on a 10-minute self-paced outdoor run (Snyder et al., 2017). The main difference between the protocols of Snyder et al. (2017) and the current study is the requirement of additional activity input used in this study. Garmin recommends that additional exercise data is necessary to increase the accuracy of prediction of VO2max (Garmin, 2015). The results of Snyder et al. s study demonstrated that a significant difference existed between directly measured VO2max and all predicted VO2max values with a general overestimate of VO2max produced by the smart watches. This is an interesting difference in results between the two studies. While both studies found a significant difference in directly measured and predicted VO2max, an underestimate of VO2max was typically observed in the present study. This major disagreement between studies can be contributed to two distinct differences: average directly measured VO2max and the requirement of additional activity input to adjust the predicted VO2max value. The average direct VO2max for Snyder et al. s
90 78 (2017) study was 49.5 ± 5.8 ml/kg/min and 42.9 ± 4.8 ml/kg/min for males and females, respectively. The average direct VO2max for this study was 59.0 ± 6.9 ml/kg/min and 51.2 ± 10.8 ml/kg/min for males and females, respectively. These differences can likely be contributed to the inclusion criteria for this study as only participants who run on a regular basis were recruited. Because of the higher average direct VO2max recorded in this study, the trend of underestimate of prediction is reasonable. From the results of this study, it can be concluded that the Garmin Forerunner 235 has problems predicting VO2max for individuals with a higher direct VO2max. The reason for this underestimation is difficult to determine, but the authors theorize that the linear regression model used to predict VO2max is the most likely contributor to the inaccuracies. A linear regression model is problematic in exercise physiology because as the extremes of measurement are approached the uniform nature of a linear model assumes that the largest contributing variables will produce the same result across all individuals. For example, if a highly-trained individual with a direct VO2max of 75 ml/kg/min completes a 15- minute run with an average HR of 180 bpm and an untrained individual with a VO2max of 50 ml/kg/min completes a 15-minute run with an average HR of 180 bpm at the same pace, the smart watch has no method to discern the differences in cardiorespiratory fitness. The physiological adaptation of training is typically a lower resting HR and therefore a higher stroke volume during exercise to lead to an overall increase in VO2max. Exercise HR at any given intensity isn t inherently lower after training although the highly-trained individual would likely have an easier time at the given pace and therefore less overall effort when performing the run in this example. This issue suggests that an exponential regression model
91 79 may be more appropriate and lead to increased accuracy when predicting VO2max using exercise data from a smart watch. Strengths and Limitations Strengths of the study included testing participants with a wide range of VO2max values, evaluating new technology with almost no existing literature, assessing the prediction capability of the device beyond the base claims in the directions, and using three separate VO2max values to increase the accuracy of prediction. Testing participants with a wide range of VO2max values was a strength of the study because this allowed individuals with different levels of cardiorespiratory fitness to be tested. As the Garmin Forerunner 235 claims to be able to predict VO2max after a 10-minute outdoor run while recording HR, a wide range of participants is important to assess these claims. If every participant tested had the same or similar directly measured VO2max value, conclusions could only be drawn for a narrow range of VO2max values. Overall, this can be viewed as a strength as opposed to a limitation of the study because the watch s predictability feature was tested using participants with VO2max values ranging from 41.4 ml/kg/min to 77.7 ml/kg/min. As very little literature exists on the topic of predictability of VO2max using a GPS watch, this is an obvious strength of the study. The results of this study hope to spark interest in the growing field of wearable devices, GPS technology, exercise testing, and physical activity measurement research. As mentioned above in the methods section, an additional strength of the study is assessing the prediction model of the watch beyond what the directions state. The Garmin Forerunner 235 predicts a VO2max value after running outdoors for a minimum of 10 minutes while recording HR using the radial pulse through a sensor located on the back of
92 80 the watch face. In this study, participants ran for 15 minutes instead to ensure that a value was predicted. In some cases, a VO2max was not predicted after running for 10 minutes during pilot testing. This is likely due to HR data as Garmin s owner s manual states that erratic HR data recording may occur 68. The websites also lists steps to minimize this from occurring such as warming up for 5 10 minutes. Because of this recommendation, an additional 5 minutes were added to the outdoor run for a total of 15 minutes to improve predication rates. The watch predicted a VO2max value for all 28 participants during this study on the first attempt. Lastly, an additional three outdoor runs of at least 30 minutes were required by all subjects as Garmin s owner s manual states that the device requires a few runs to learn about your running performance (Garmin, 2015). Additional activity input is a major strength of the study as this is a necessary step when evaluating the predictability of the watch. With subsequent exercise bouts, the predicted VO2max adjusts based on each individual activity. Differences in pace, distance, and time will lead to increases or decreases in VO2max. Limitations of the study included using GPS to measure PA, recording HR using the radial pulse through an optical sensor on the watch, using a self-selected pace when performing the outdoor runs, and failing to vary the level of intensity of additional outdoor runs recorded by participants. While GPS is a valid and reliable method to measure PA (Wieters et al., 2012) and is used extensively in the literature (McCrorie et al., 2014), interference is still a common occurrence, especially in areas that are obstructed by high-rise buildings (Duncan et al., 2013). Additionally, on days with heavy cloud coverage, the GPS watch required more time to acquire acceptable signal strength before recording an activity. The effect of this limitation was minimized by performing the initial 15-minute outdoor run
93 81 on a closed 0.5-mile loop in the middle of EMU's campus. There were no tall buildings in the vicinity that could cause obstruction of the GPS signal. Further, the researcher walked to the starting point of the run with each individual participant in order to ensure that the watch displayed "GPS ready" before the participant began the test. Through these practices, potential inaccuracy while using GPS to monitor PA was minimized. Recording HR via the radial pulse is not the most accurate way to measure HR. For example, if the watch was not secured tightly enough on the participant s wrist, HR values may be much lower or higher than expected. Additionally, if the watch slips to one side of the wrist at any point during the run, the same issue will occur. As is often the case with PA, accumulation of sweat could skew the HR values recorded by the watch, particularly during hot and humid days. To ensure accuracy of HR values, participants were required to secure the watch tightly around their wrist before recording any activity. This was then double checked by the researcher before any testing took place and was thoroughly explained to each participant before leaving the laboratory. While HR inaccuracies are potentially the largest limitation of the study due to its likely profound importance as a variable when estimating VO2max using the GPS watch, the purpose of the study was to examine the accuracy of prediction of VO2max using the standard features of the watch. An important selling point and useful feature of the Garmin Forerunner 235 is that the watch is able to measure and record HR every second without the use of an electrocardiogram or chest strap. Because of this, the researchers tested the watch's ability to predict VO2max using the built-in HR monitor. Accuracy could potentially be improved if a chest strap was used to measure HR. However, this would defeat the purpose of a minimal PA monitoring device.
94 82 A self-selected pace while performing all outdoor runs could also affect the prediction result as participants may not have performed to their full potential for each run. This could have led to an overall slower pace and shorter distance for activities recorded on their own. Participants were not externally motivated and volunteered for this study with no additional benefits to themselves. The researchers did their best to motivate the participants for the initial 15-minute outdoor runs, but subsequent activities were performed off campus and on the participant's own time. Failing to vary the level of intensity of additional outdoor runs recorded by participants is another limitation of the study. For example, when recording additional activities beyond the 15-minute outdoor run at EMU, participant's could have been required to perform different types of exercise by varying the level of intensity through enforcing pace and distance requirements. Participants could have been required to still perform only three additional runs but one of the runs could have consisted of sprint intervals to test the anaerobic energy system where the participant sprinted for 2 3 minutes with 30 seconds of rest between intervals. Additionally, participants could have been required to perform one longer run with a distance of greater than eight miles while maintaining a slower than normal pace to test the aerobic energy system. These ideas could be put to use in future research to further examine the predictability of VO2max of the GPS watch while enforcing stricter requirements for subjects to improve the accuracy of results. Conclusion In conclusion, the results indicate that the Garmin Forerunner 235 did not accurately predict VO2max for the general population. The watch generally underestimated VO2max when compared to a direct value obtained using a maximal TM based GXT. Additionally, the watch was unable to accurately predict VO2max for participants with a
95 83 VO2max of greater than 50 ml/kg/min. However, the watch could accurately predict VO2max for individuals with a directly measured VO2max of less than 50 ml/kg/min. While there is no one clear variable responsible for the difference in accuracy of prediction, measuring HR using an optical sensor at the radial pulse is the main factor effecting the results of VO2max prediction. These results suggest that the watch accurately predicts VO2max for individuals who may have a lower cardiorespiratory fitness level. This raises the question of the type of population that Garmin is targeting when developing new technology: active, everyday runners with higher than average cardiorespiratory fitness levels or a less active population more concerned with having the latest and greatest fitness gear and technology available on the market. Recommendations for Further Research and Action Future research should focus on expanding the number of devices tested to include other smart watches available on the market such as models produced by Polar and Suunto and other more advanced models developed by Garmin. Comparing the prediction results of three separate smart watches to a direct measurement could lead to a better understanding of why certain models overestimate or underestimate VO2max. Additionally, future research could concentrate on testing the intra-device reliability of VO2max prediction using multiple watches of the same model. This could include testing the reliability of several devices produced by different companies. Examining minor average HR differences or GPS inaccuracies could lead to explaining conflicting VO2max prediction results. Future research for Garmin smart watches specifically could also explore how different types of running based exercise effect the predicted VO2max value. Instead of having participants to record three additional runs of at least 30 minutes in duration, stricter pace and
96 84 distance requirements could be emphasized. For example, three additional runs could still be utilized in data collection, but each run could be performed at a different intensity level. A longer, slower run could be used to test the participant s aerobic energy system while a shorter, faster run would test the anaerobic threshold and energy systems. Lastly, one-mile repeats could be implemented to test the maximal exercise capacity of participants and require two to three one-mile mile repeats recorded for the same exercise bout. The combination of three different types of running activities could lead to increased accuracy of prediction.
97 85 References Abel, M.G., Hannon, J.C., Sell, K., Lillie, T., Conlin, G., & Anderson, D. (2008). Validation of the Kenz Lifecorder EX and ActiGraph GT1M accelerometers for walking and running in adults. Applied Physiology, Nutrition, and Metabolism, 33(6), Almanza, E., Jerrett, M., Dunton, G., Seto, E., & Pentz, M.A. (2012). A study of community design, greenness, and physical activity in children using satellite, GPS, and accelerometer data. Health & Place, 18(1), Åstrand, P.O. & Ryhming, I. (1954). A nomogram for calculation of aerobic capacity (physical fitness) from pulse rate during submaximal work. Journal of Applied Physiology, 7(2), Balke, B. (1963). A simple field test for the assessment of physical fitness. Rep [Report]. Civil Aeromedical Research Institute (US), 1-8. Bradshaw, D.I., George, J.D., Hyde, A., LaMonte, M.J., Vehrs, P.R., Hager, R.L., & Yanowitz, F.G. (2005). An accurate VO2max nonexercise regression model for year-old adults. Research Quarterly for Exercise and Sport, 76(4), Bravata, D.M., Smith-Spangler, C., Sundaram, V., Gienger, A.L., Lin, N., Lewis, R.,... Sirard, J.R Using pedometers to increase PA and improve health: A systematic review. The Journal of the American Medical Association, 298(19), Boulos, M.N.K. & Yang, S.P. (2013). Exergames for health and fitness: The roles of GPS and geosocial apps. International Journal of Health Geographics, 12(18), 1-7.
98 86 Bruce, R.A., Kusumi, F., & Hosmer, D. (1973). Maximal oxygen intake and nomographic assessment of functional aerobic impairment in cardiovascular disease. American Heart Journal, 85(4), Chao, Y.Y., Scherer, Y.K., & Montgomery, C. A. (2014). Effects of using Nintendo Wii exergames in older adults a review of the literature. Journal of aging and health, 27(3), Cink, R.E. & Thomas, T.R. (1981). Validity of the Astrand-Ryhming nomogram for predicting maximal oxygen intake. British Journal of Sports Medicine, 15(3), Coombes, E., Van Sluijs, E., & Jones, A. (2013). Is environmental setting associated with the intensity and duration of children's physical activity? Findings from the SPEEDY GPS study. Health and Place, 20, Cooper, K.H. (1968). A means of assessing maximal oxygen intake correlation between field and TM testing. Journal of the American Medical Association, 203(3), Duncan, S., Stewart, T.I., Oliver, M., Mavoa, S., MacRae, D., Badland, H.M., & Duncan, M.J. (2013). Portable global positioning system receivers static validity and environmental conditions. American Journal of Preventive Medicine, 44(2), e19-e29. Ebbeling, C.B., Ward, A., Puleo, E.M., Widrick, J., & Rippe, J.M. (1991). Development of a single-stage submaximal TM walking test. Medicine and Science in Sports and Exercise, 23(8), Erdogan, A., Cetin, C., Karatosun, H., & Baydar, M. L. (2010). Accuracy of the Polar S810i ( ) heart rate monitor and the Sensewear Pro Armband ( ) to estimate energy
99 87 expenditure of indoor rowing exercise in overweight and obese individuals. Journal of Sports Science & Medicine, 9(3), Field, A. (2016). Discovering Statistics. Retrieved from Garmin. (2015, December). Garmin Forerunner 230/235 Owner s Manual. Retrieved from George, J.D., Vehrs, P.R., Allsen, P.E., Fellingham, G.W., & Fisher, G. (1993). VO2max estimation from a submaximal 1-mile track jog for fit college-age individuals. Medicine and Science in Sports and Exercise, 25(3), George, J.D. (1996). Alternative approach to maximal exercise testing and VO2max prediction in college students. Research Quarterly for Exercise and Sport, 67(4), George, J.D., Stone, W.J., & Burkett, L.N. (1997). Non-exercise VO2max estimation for physically active college students. Medicine & Science in Sports & Exercise, 29(3), George, J.D. Bradshaw, D.I., Hyde, A., Vehrs, P.R., & Hager, R.L. (2007). A maximal graded exercise test to accurately predict VO2max in year-old adults. Measurement in Physical Education and Exercise Science, 11(3), George, J.D., Paul, S.L., Hyde, A., Bradshaw, D.I., Vehrs, P.R., Hager, R.L., & Yanowitz, F.G. (2009). Prediction of maximum oxygen uptake using both exercise and non-exercise data. Measurement in Physical Education and Exercise Science, 13(1), 1-12.
100 88 Hanggi, J.M., Phillips, L.R.S., & Rowlands, A.V. (2013). Validation of the GT3X ActiGraph in children and comparison with the GT1M ActiGraph. Journal of Science and Medicine in Sport, 16(1), Heil, D.P., Freedson, P.S., Ahlquist, L.E., Price, J., & Rippe, J.M. (1995). Nonexercise regression models to estimate peak oxygen consumption. Medicine and Science in Sports and Exercise, 27(4), Hill, A., Long, C., & Lupton, H. (1924). Muscular exercise, lactic acid, and the supply and utilisation of oxygen. Proceedings of the Royal Society of London. Series B, Containing Papers of a Biological Character, 96(679), Jackson, A.S., Blair, S.N., Mahar, M.T., Wier, L.T., Ross, R.M., & Stuteville, J.E. (1990). Prediction of functional aerobic capacity without exercise testing. Medicine and Science in Sports and Exercise, 22(6), Johnson, K.D. & Beadle, J. (2017). Does the Polar FT60 Fitness Test accurately predict maximal oxygen consumption in healthy subjects. Medicine & Science in Sports & Exercise, 49(5S), 747. Jones, A.P., Coombes, E.G., Griffin, S.J., & van Sluijs, E.M. (2009). Environmental supportiveness for physical activity in English schoolchildren: a study using Global Positioning Systems. International Journal of Behavioral Nutrition and Physical Activity, 6(1), 1. Kang, M., Marshall, S.J., Barreira, T.V., & Lee, J. (2009). Effect of pedometer-based PA interventions: A meta-analysis. Research Quarterly for Exercise and Sport, 80(3),
101 89 Kim, Y, Beets, M.W., Pate, R.R., & Blair, S.N. (2013). The effect of reintegrating Actigraph accelerometer counts in preschool children: Comparison using different epoch lengths. Journal of Science and Medicine in Sport, 16(2), Kim, D.Y., Jung, Y.S., Park, R.W., & Joo, N.S. (2014). Different location of triaxial accelerometer and different energy expenditures. Yonsei Medical Journal, 55(4), Kerr, J., Marshall, S., Godbole, S., Neukam, S., Crist, K., Wasilenko, K., & Buchner, D. (2012). The relationship between outdoor activity and health in older adults using GPS. International Journal of Environmental Research and Public Health, 9(12), Kline, G.M., Porcari, J.P., Hintermesiter, R., Freedson, P.S., Ward, A., McCarron, R.F.,... Rippe, J.M. (1987). Estimation of VO2max from a one-mile track walk, gender, age, and body weight. Medicine and Science in Sports and Exercise, 19(3), Lachowycz, K., Jones, A.P., Page, A.S., Wheeler, B.W., & Cooper, A.R. (2012). What can global positioning systems tell us about the contribution of different types of urban greenspace to children's physical activity? Health & place, 18(3), Le Faucheur, A., Abraham, P., Jaquinandi, V., Bouyé, P., Saumet, J.L., & Noury-Desvaux, B. (2007). Study of human outdoor walking with a low-cost GPS and simple spreadsheet analysis. Medicine and Science in Sports and Exercise, 39(9), Le Faucheur, A., Abraham, P., Jaquinandi, V., Bouyé, P., Saumet, J.L., & Noury-Desvaux, B. (2008). Measurement of walking distance and speed in patients with peripheral arterial disease: A novel method using a global positioning system. Circulation, 117(7),
102 90 Le Masurier, G.C., Lee, S.M., & Tudor-Locke, C. (2004). Motion sensor accuracy under controlled and free-living conditions. Medicine and Science in Sports and Exercise, 36(5), Liden, C.B., Wolowicz, M., Stivoric, J., Teller, A., Vishnubhatla, S., Pelletier, R., & Farringdon, J. (2002). Accuracy and reliability of the SenseWear Armband as an energy expenditure assessment device. BodyMedia, White Papers. Macsween, A. (2001). The reliability and validity of the Astrand nomogram and linear extrapolation for deriving VO2max from submaximal exercise data. Journal of Sports Medicine and Physical Fitness, 41(3), Maddison, R. & Mhurchu, C.N. (2009). Global positioning system: a new opportunity in physical activity measurement. International Journal of Behavioral Nutrition and Physical Activity, 6(1), 1. Margaria, R., Aghemo, P., & Rovelli, E. (1965). Indirect determination of maximal O2 consumption in man. Journal of Applied Physiology, 20(5), McCrorie, P.R., Fenton, C., & Ellaway, A. (2014). Combining GPS, GIS, and accelerometry to explore the PA and environment relationship in children and young people a review. The International Journal of Behavioral Nutrition and PA, 11, 93. Oreskovic, N.M., Blossom, J., Field, A.E., Chiang, S.R., Winickoff, J.P., & Kleinman, R.E. (2012). Combining global positioning system and accelerometer data to determine the locations of physical activity in children. Geospatial Health, 6(2),
103 91 Pate, R.R., Almedia, M.J., McIver, K.L., Pfeiffer, K.A., & Dowda, M. (2006). Validation and calibration of an accelerometer in preschool children. Obesity, 14(11), Quigg, R., Gray, A., Reeder, A.I., Holt, A., & Waters, D.L. (2010). Using accelerometers and GPS units to identify the proportion of daily physical activity located in parks with playgrounds in New Zealand children. Preventive Medicine, 50(5), Rainham, D.G., Bates, C.J., Blanchard, C.M., Dummer, T.J., Kirk, S.F., & Shearer, C.L. (2012). Spatial classification of youth physical activity patterns. American Journal of Preventive Medicine, 42(5), e87-e96. Reeve, M.D., Pumpa, K.L., & Ball, N. (2014). Accuracy of the SenseWear armband mini and the BodyMedia FIT in resistance training. Journal of Science and Medicine in Sport, 17(6), Rogers, M.A., Hagberg, J.M., Martin 3 rd, W.H., Ehsani, A.A., & Holloszy, J.O. (1990). Decline in VO2max with aging in master athletes and sedentary men. Journal of Applied Physiology, 68(5), Romanzini, M., Petroski, E.L., Ohara, D., Dourado, A.C., & Reichert, F.F. (2014). Calibration of ActiGraph GT3X, Actical and RT3 accelerometers in adolescents. European of Journal of Sport Science, 14(1), Rodríguez, D.A., Cho, G.H., Evenson, K.R., Conway, T.L., Cohen, D., Ghosh-Dastidar, B.,... Lytle, L. A. (2012). Out and about: Association of the built environment with physical activity behaviors of adolescent females. Health & Place, 18(1),
104 Sasaki, J.E., John, D., & Freedson, P.S. (2011). Validation and comparison of ActiGraph activity monitors. Journal of Science and Medicine in Sport, 14, Scheers, T., Philippaerts, R., & Lefevre, J. (2012). Variability in PA patterns as measured by the SenseWear armband: How many days are needed? European Journal of Applied Physiology, 112(5), Schembre, S.M. & Riebe, D.A. (2011). Non-exercise estimation of VO2max using the international PA questionnaire. Measurement in Physical Education and Exercise Science, 15(3), Schneider, P.L., Crouter, S.E., & Bassett, D.R. (2004). Pedometer measures of free-living physical activity: comparison of 13 models. Medicine and science in sports and exercise, 36(2), Schutz, Y. & Chambaz, A. (1997). Could a satellite-based navigation system (GPS) be used to assess the physical activity of individuals on earth? European Journal of Clinical Nutrition, 51(5), Sirard, J.R., Trost, S.G., Pfeiffer, K.A., Dowda, M., & Pate, R.R. (2005). Calibration and evaluation of an objective measure of PA in preschool children. Journal of PA and Public Health, 2(3), Snyder, N.C., Willoughby, C.A., & Smith, B.K. (2017). Accuracy of Garmin and Polar smart watches to predict VO2max. Medicine & Science in Sports & Exercise, 49(5S), 761.
105 93 Southward, E.F., Page, A.S., Wheeler, B.W., & Cooper, A.R. (2012). Contribution of the school journey to daily physical activity in children aged years. American Journal of Preventive Medicine, 43(2), Spackman, M.B., George, J.D., Pennington, T.R., & Fellingham, G.W. (2001). Maximal graded exercise test protocol preferences of relatively fit college students. Measurement in Physical Education and Exercise Science, 5(1), Taylor, H.L., Buskirk, E., & Henschel, A. (1955). Maximal oxygen intake as an objective measure of cardio-respiratory performance. Journal of Applied Physiology, 8(1), Trost, S.G., Loprinzi, P.D., Moore, R., & Pfeiffer, K.A. (2011). Comparison of accelerometer cut points for predicting activity intensity in youth. Medicine and Science in Sport & Exercise, 43(7), Tudor-Locke, C., McClain, J.J., Sisson, S.B., & Craig, C.L. (2007). Comparison of lifecorder EX and ActiGraph accelerometers under free-living conditions. Applied Physiology, Nutrition, and Metabolism, 32(4), van Sluijs, E.M., Skidmore, P.M., Mwanza, K., Jones, A.P., Callaghan, A.M., Ekelund, U.,... Cassidy, A. (2008). Physical activity and dietary behaviour in a population-based sample of British 10-year old children: the SPEEDY study (Sport, Physical activity and Eating behaviour: environmental Determinants in Young people). BMC public health, 8(1), 388. Vehrs, P.R., George, J.D., Fellingham, G.W., Plowman, S.A., & Dustman-Allen, K. (2007). Submaximal TM exercise test to predict VO2max in fit adults. Measurement in Physical Education and Exercise Science, 11(2),
106 94 Waddoups, L., Wagner, D., Fallon, J., & Heath, E. (2008). Validation of a single-stage submaximal TM walking test. Journal of Sports Sciences, 26(5), Webb, C., Vehrs, P.R., George, J.D., & Hager, R. (2014). Estimating VO2max using a personalized step test. Measurement in Physical Education and Exercise Science, 18, Wheeler, B.W., Cooper, A.R., Page, A.S., & Jago, R. (2010). Greenspace and children's physical activity: a GPS/GIS analysis of the PEACH project. Preventive medicine, 51(2), Wieters, K.M., Kim, J.H., & Lee, C. (2012). Assessment of wearable global positioning system units for PA research. Journal of PA and Health, 9, Willoughby, C.A., Snyder, N.C., & Smith, B.K. (2017). Comparison of VO2max values obtained from the Garmin Forerunner 230 and 235. Medicine & Science in Sports & Exercise, 49(5S), 761.
107 APPENDICES 95


108 Appendix A: Consent Form 96
An Accurate VO2max Non-exercise Regression Model for 18 to 65 Year Old Adults
 Brigham Young University BYU ScholarsArchive All Theses and Dissertations 2003-12-19 An Accurate VO2max Non-exercise Regression Model for 18 to 65 Year Old Adults Danielle I. Bradshaw Brigham Young University
CHAPTER 5 DISCUSSIONS, CONCLUSIONS AND RECOMMENDATIONS
 CHAPTER 5 DISCUSSIONS, CONCLUSIONS AND RECOMMENDATIONS This chapter discussed and interpreted the results of the study presented in the previous chapters. It is concluded in three parts. The first part
Animal Services Officers Physical Fitness Assessment
 Animal Services Officers Physical Fitness Assessment Purpose of the Animal Services Officers Physical Fitness Assessment is to test the general level of fitness based on the general fitness standards.
ASSESSMENT OF ENDURANCE FITNESS
 ASSESSMENT OF ENDURANCE FITNESS There are two types of tests to assessment of the aerobic resistance: Maximum effort and submaximal effort. In this post, we have written about the submaximal effort because
RELATIVE EXERCISE INTENSITY, HEART RATE, OXYGEN CONSUMPTION, AND CALORIC EXPENDITURE WHEN EXERCISING ON VARIOUS NON-IMPACT CARDIO TRAINERS
 RELATIVE EXERCISE INTENSITY, HEART RATE, OXYGEN CONSUMPTION, AND CALORIC EXPENDITURE WHEN EXERCISING ON VARIOUS NON-IMPACT CARDIO TRAINERS Kirsten Hendrickson, B.S. John P. Porcari, Ph.D. Carl Foster,
Journal of Undergraduate Kinesiology Research
 Elliptical: Forward vs. Backward 25 Journal of Undergraduate Kinesiology Research Official Research Journal of the Department of Kinesiology University of Wisconsin Eau Claire Volume 2 Number 2 May 2007
Chapter 10 Measurement of Common Anaerobic Abilities and Cardiorespiratory Responses Related to Exercise
 Chapter 10 Measurement of Common Anaerobic Abilities and Cardiorespiratory Responses Related to Exercise Slide Show developed by: Richard C. Krejci, Ph.D. Professor of Public Health Columbia College 3.26.13
How Far Did Wii Run? Nintendo s Wii Fit Overestimates Distance Shayna Moratt*, Carmen B Swain The Ohio State University Education and Human Ecology
 How Far Did Wii Run? Nintendo s Wii Fit Overestimates Distance Shayna Moratt*, Carmen B Swain The Ohio State University Education and Human Ecology March 12, 2012 Abstract Exergaming (performing exercise
AEROBIC METABOLISM DURING EXERCISE SYNOPSIS
 SYNOPSIS This chapter begins with a description of the measurement of aerobic metabolism by direct calorimetry and spirometry and proceeds with a discussion of oxygen drift as it occurs in submaximal exercise
THIS MATERIAL IS A SUPPLEMENTAL TOOL. IT IS NOT INTENDED TO REPLACE INFORMATION PROVIDED IN YOUR TEXT AND/OR STUDENT HAND-BOOKS
 THIS MATERIAL IS A SUPPLEMENTAL TOOL. IT IS NOT INTENDED TO REPLACE INFORMATION PROVIDED IN YOUR TEXT AND/OR STUDENT HAND-BOOKS. REVIEW CHAPTERS 8, 9, 10, and 12 OF TEXT BOOK Homework Review; Lab 1 Review
USING PHYSICAL TESTING RESULTS TO PLAN YOUR CONDITIONING SESSIONS
 USING PHYSICAL TESTING RESULTS TO PLAN YOUR CONDITIONING SESSIONS 1. Introduction Created by Dr Stuart Cormack, Dr Emerson Franchini and Dr Clare Humberstone It is vital for a Judo athlete to develop a
EXCITE, ENGAGING CARDIO ADVANCED LED DISPLAY RUN User manual
 EXCITE, ENGAGING CARDIO ADVANCED LED DISPLAY RUN 1000 User manual Contents Description of the control panel...3 Function keys...4 Manual control keys...5 Profile LEDs...7 Heart rate LEDs...8 The number
Development of an Exercise Test to Predict VO2max in Children and Adolescents
 Brigham Young University BYU ScholarsArchive All Theses and Dissertations 2009-04-17 Development of an Exercise Test to Predict VO2max in Children and Adolescents Nathan E. Black Brigham Young University
Exercise Prescription Certificate Course
 Exercise Prescription Certificate Course Session 2: Principles and Frameworks for Exercise Prescription Dr. Raymond CHAN Hoi-fai MBChB (DUNDEE), MSc Sports Medicine (Glasg), MScSMHS(CUHK), MSpMed (New
SUBMAXIMAL EXERCISE TESTING: ADVANTAGES AND WEAKNESS IN PERFORMANCE ASSESSMENT IN CARDIAC REHABILITATION
 SUBMAXIMAL EXERCISE TESTING: ADVANTAGES AND WEAKNESS IN PERFORMANCE ASSESSMENT IN CARDIAC REHABILITATION Dr Saari MohamadYatim M.D Rehabilitation Physician Hospital Serdang APCCRC, Hong Kong, 6-9 Nov 2014
BUFFALO CONCUSSION BIKE TEST (BCBT) INSTRUCTION MANUAL
 INSTRUCTION MANUAL") Purpose BUFFALO CONCUSSION BIKE TEST (BCBT) INSTRUCTION MANUAL To investigate exercise tolerance in patients with persistent post-concussive symptoms (PCS) lasting more than 2-4 weeks. The definition of
Purpose BUFFALO CONCUSSION BIKE TEST (BCBT) INSTRUCTION MANUAL To investigate exercise tolerance in patients with persistent post-concussive symptoms (PCS) lasting more than 2-4 weeks. The definition of
Perceptual & Motor Skills: Physical Development & Measurement 2013, 116, 2, Perceptual & Motor Skills 2013
 Perceptual & Motor Skills: Physical Development & Measurement 2013, 116, 2, 505-511. Perceptual & Motor Skills 2013 A COMPARISON OF HISPANIC MIDDLE SCHOOL STUDENTS PERFORMANCE, AND PERCEIVED AND ACTUAL
The Difference in HR Response between Track and Treadmill Running at a Pre-determined, Selfselected
 Brigham Young University BYU ScholarsArchive All Theses and Dissertations 2005-03-22 The Difference in HR Response between Track and Treadmill Running at a Pre-determined, Selfselected Pace Marisha Corey
CHAPTER THREE JOURNAL MANUSCRIPT
 CHAPTER THREE JOURNAL MANUSCRIPT 13 PHYSIOLOGICAL AND METABOLIC RESPONSES TO CONSTANT-LOAD EXERCISE ON AN INCLINED STEPPER AND TREADMILL by Brian W. Rieger Dr. Shala Davis, Chairman Department of Human
A Protocol for Establishing Critical Power in Running
 A Protocol for Establishing Critical Power in Running A Working Paper Prepared by The Stryd Team 27 September 201 1 Introduction One of the primary reasons for considering one s power consumption during
Effect of pre-exercise sports drink on cardio-respiratory fitness
 (0), vol VIII, no, 846-85 Romanian Sports Medicine Society 846 Neeraj Kumar, Rajkumar Agrahari Department of Physiotherapy, Saaii College of Medical Science & Technology, Kanpur, UP, India Abstract. The
Applied Exercise and Sport Physiology, with Labs, 4e
 Applied Exercise and Sport Physiology, with Labs, 4e hhpcommunities.com/exercisephysiology/chapter-10-aerobic-exercise-prescriptions-for-public-health-cardiorespiratory-fitness-and-athletics/chap Chapter
The Effects of Participation in Marching Band on Physical Activity and Physical Fitness in College Aged Men and Women
 University of Rhode Island DigitalCommons@URI Senior Honors Projects Honors Program at the University of Rhode Island 2013 The Effects of Participation in Marching Band on Physical Activity and Physical
Best Practices in the Data Reduction and Analysis of Accelerometers and GPS Data
 Best Practices in the Data Reduction and Analysis of Accelerometers and GPS Data Stewart G. Trost, PhD Department of Nutrition and Exercise Sciences Oregon State University Key Planning Issues Number of
Standard Operating Procedure for Prediction of VO2max Using a Modified Astrand (1960) Protocol
 Protocol") Standard Operating Procedure for Prediction of VO2max Using a Modified Astrand (1960) Protocol Effective date: 31.10.2016 Review due date: 30.08.2018 Original Author Name: Richard Metcalfe Position: Ph.
Standard Operating Procedure for Prediction of VO2max Using a Modified Astrand (1960) Protocol Effective date: 31.10.2016 Review due date: 30.08.2018 Original Author Name: Richard Metcalfe Position: Ph.
NEW FEATURES ON GARMIN FENIX 5, FR935
 NEW FEATURES ON GARMIN FENIX 5, FR935 FIRSTBEAT PHYSIOLOGICAL FEATURES IN NEW GARMIN PRODUCTS Feature fenix 5 FR935 Anaerobic Training Effect (new) X X Aerobic Training Effect X X Training load (new) X
The Phenomena of Movement pg 3. Physical Fitness and Adolescence pg 4. Fitness as a Lifestyle pg 5. Physical Education and the Student pg 6
 Introduction pg 2 The Phenomena of Movement pg 3 Physical Fitness and Adolescence pg 4 Fitness as a Lifestyle pg 5 Physical Education and the Student pg 6 The Program pg 7 Program Outline pg 8 Proposal
Copyright is owned by the Author of the thesis. Permission is given for a copy to be downloaded by an individual for the purpose of research and
 Copyright is owned by the Author of the thesis. Permission is given for a copy to be downloaded by an individual for the purpose of research and private study only. The thesis may not be reproduced elsewhere
EFFECT OF CAFFEINE ON HEART RATE AND CALORIES BURNED DURING EXERCISE. By: Luis Galvan, Jared Peters, Ronny Olvera, Malcolm Taylor and Steven Franco
 EFFECT OF CAFFEINE ON HEART RATE AND CALORIES BURNED DURING EXERCISE By: Luis Galvan, Jared Peters, Ronny Olvera, Malcolm Taylor and Steven Franco Abstract Four active collegiate level students were asked
AFFECTS OF MUSIC ON EXERCISE. Name Institution
 AFFECTS OF MUSIC ON EXERCISE Name Institution Affects of Music on Exercise Chapter III: Methodology and Study Procedures Though there might be studies related to the effects of music on exercise, only
FREECLIMBER 4400/4600 PT/CL CONSOLE
 The StairMaster FreeClimber 4400/4600 PT/CL systems console is divided into seven sections: the display window, the workout options, the numeric keypad, the entertainment keypad, the workout statistics,
Performance Training in Football Refereeing Training Advice
 General guidelines 1. Training Sessions 1.1 Warm up - Both from a physiological and training perspective it is crucial to warm up prior to training and matches as sports science research has demonstrated
Training 1. Training c Training. For AQA
 Training 1 Training Training 2 What you will learn about in this topic: 1. Methods of training 2. What each training method develops 3. How each method works Training 3 Learning objectives By the end of
Hands on Sports Therapy KNOWLEDGE REVIEW QUESTIONS 2004 Thomson Learning It can help to shape a basic fitness training programme
 Hands on Sports Therapy KNOWLEDGE REVIEW QUESTIONS 2004 Thomson Learning 1 CHAPTER 13 Knowledge Review Q1: Why is fitness testing useful? A1: Fitness testing is useful for various reasons: 1. It can help
Chapter # 3 Aerobic Exercise
 Chapter # 3 Aerobic Exercise Know how your aerobic exercise program works You Will Learn: 1) What aerobic exercise is and why it is important 2) The components of your aerobic exercise program 3) Why it
THE USE OF LACTATE THRESHOLD IN TRAINING
 THE USE OF LACTATE THRESHOLD IN TRAINING By Richard W. Field Richard Field discusses the concept of pulse rates to determine workout intensities and outlines how the controversial Conconi test can be used
Does the HealthVest really work?
 Does the HealthVest really work? If you haven t noticed by now, there is extreme pressure by the Federal Trade Commission (FTC) to provide clinical trials showing statistically valid results reporting
Performance Enhancement. Cardiovascular/Respiratory Systems and Athletic Performance
 Performance Enhancement Cardiovascular/Respiratory Systems and Athletic Performance Functions of the Cardiovascular System Deliver oxygen & nutrients to body tissues Carry wastes from the cells Anatomy
D I N E S H J O H N EDUCATION
 D I N E S H J O H N 117 CLIFFSIDE APARTMENTS, 248 AMHERST ROAD SUNDERLAND, MA-01375 PHONE (801) 230-6320 FAX (413)-545-2906 E-MAIL djohn1@kin.umass.edu EDUCATION 2007-2009 University of Tennessee Knoxville,
Paula Radcliffe is an English marathon runner
 EXCLUSIVE ACE SPONSORED RESEARCH Validity of the Talk Test in Identifying the Respiratory Compensation Threshold By Maria L. Cress, M.S., John P. Porcari, Ph.D., Carl Foster, Ph.D., Pedro Recalde, M.S.,
Prescription Fitness. Robert M. Pepper, DO, FAAFP. ACOFP 55th Annual Convention & Scientific Seminars
 Prescription Fitness Robert M. Pepper, DO, FAAFP 8 ACOFP 55th Annual Convention & Scientific Seminars RX: FITNESS Robert M Pepper, DO, FAAFP Assistant Dean for Predoctoral Clinical Education West Virginia
Journal of Undergraduate Kinesiology Research Official Research Journal of the Department of Kinesiology University of Wisconsin Eau Claire
 Energy Expenditure of Recreational Kayaking 26 Journal of Undergraduate Kinesiology Research Official Research Journal of the Department of Kinesiology University of Wisconsin Eau Claire Volume 2 Number
A Modified Submaximal Cycle Ergometer Test Designed to Predict Treadmill VO 2max
 Measurement in Physical Education and Exercise Science ISSN: 1091-367X (Print) 153-7841 (Online) Journal homepage: http://www.tandfonline.com/loi/hmpe0 A Modified Subimal Cycle Ergometer Test Designed
The configuration menu International Setup Training setup Entertainment setup Calibrating the touch screen...
 VISIO User manual Contents Visio... 3 The exercises... 4 All the exercise programs... 4 Inserting data to set the exercise... 5 Workout... 6 QUICK START... 10 Warm Up... 10 Workout with goal... 11 Weight
Welcome! ACE Personal Trainer Virtual Exam Review: Module 5. Laura Abbott, MS, LMT. What We ll Cover This Module
 Welcome! ACE Personal Trainer Virtual Exam Review: Module 5 Laura Abbott, MS, LMT Master s Degree, Sports Medicine Licensed Massage Therapist Undergraduate degree in Exercise Science Instructor of Kinesiology,
Fitness Activities. Special Olympics Unified Schools. Minnesota
 Fitness Activities This document is one piece in a series of Special Olympics Unified Champion Schools resources to conduct Unified Physical Education. Each document may be used individually or in combination
Cardiac Rehabilitation & Exercise Training in Congenital Heart Disease. Jidong Sung Division of Cardiology Sungkyunkwan University School of Medicine
 Cardiac Rehabilitation & Exercise Training in Congenital Heart Disease Jidong Sung Division of Cardiology Sungkyunkwan University School of Medicine Cardiac rehabilitation Agency of Health Care Policy
Btec Exam Guide Practice Questions - Unit 1.1 Components of Fitness
 Btec Exam Guide Practice Questions - Unit 1.1 Components of Fitness 1) What is the main difference between aerobic endurance and muscular endurance? (2 marks) 2) Explain the following components of physical
BTEC SPORT LEVEL 3 FLYING START
 BTEC SPORT LEVEL 3 FLYING START The following tasks will provide the foundation to your first year study topics. You should aim to complete these in time for our first taught lessons. 1) PAR-Q and Informed
TESTING SERVICES BODY COMPOSITION:
 The Nutrition and Exercise Testing (NExT) Lab offers a number of fitness, body composition and energy expenditure tests for individuals from the community, Ryerson faculty and staff, and students. To schedule
POST-ACTIVATION POTENTIATION AND VERTICAL JUMP PERFORMANCE. Cody Hardwick
 POST-ACTIVATION POTENTIATION AND VERTICAL JUMP PERFORMANCE Cody Hardwick Submitted in partial fulfillment of the requirements For the degree Master of Science in Kinesiology In the School of Public Health
Bell Work. Review Total Lung Capacity. (page 337 and 338 of Body Structure and Function book)
") VO2 Max Bell Work Review Total Lung Capacity (page 337 and 338 of Body Structure and Function book) *This information was discussed at length in A&P classes. Use your worksheet and write down brief descriptions
VO2 Max Bell Work Review Total Lung Capacity (page 337 and 338 of Body Structure and Function book) *This information was discussed at length in A&P classes. Use your worksheet and write down brief descriptions
YOUR WEEKLY TIMETRIAL
 YOUR WEEKLY TIMETRIAL PURPOSE Benefits; Your weekly timetrials allow us to objectively track your ever improving progress Identify looming trouble shooting eg. Illness, injuries, or burn out Offer week
Applicant Fitness Test Cumberland County Police Testing Consortium 2018
 Applicant Fitness Test Cumberland County Police Testing Consortium 2018 This is a pass or fail test. The individual tests will be conducted in the order displayed below. 1. Vertical Jump Requirement Jump
Purpose of game/activity analysis
 Game Analysis Purpose of game/activity analysis The gathering of knowledge about : Movement Patterns and exercise intensity charts Energy system requirements Work to rest ratios Muscle groups involved
Welcome to Pulmonary Rehab
 Patient Education Welcome to Pulmonary Rehab This handout is designed to help you get started in our program. We encourage you to read it before coming to your first class. Feel free to ask questions or
The Chemistry of Running Interactive Lab. Effort Scale. Introduction
 The Chemistry of Running Interactive Lab Introduction The Chemistry of Running simulation allows students to explore the chemistry and physiology of exercise a field that attracts a lot of interest from
Strength and Core Stability - Handout
 Strength and Core Stability - Handout The National Physical Activity Guidelines for Australians are simple to achieve by focusing on: Thinking of movement as an opportunity, not an inconvenience. Being
Accelerometer can accurately measure training load in badminton
 Accelerometer can accurately measure training load in badminton Yi-Chih Lin 1,2, Tsung-Han Liu 1,3 and Tzyy-Yuang Shiang 4 1 Department of Physical Education, National Taiwan Normal University 2 Office
Validation of the Cosmed Fitmate for predicting maximal oxygen consumption
 University of Tennessee, Knoxville Trace: Tennessee Research and Creative Exchange Masters Theses Graduate School 12-2008 Validation of the Cosmed Fitmate for predicting maximal oxygen consumption Jung
Comparison of Perceived Exertion While Exercising at the Same Intensity on Land and Aquatic Treadmills
 The University of Akron IdeaExchange@UAkron Honors Research Projects The Dr. Gary B. and Pamela S. Williams Honors College Spring 2017 Comparison of Perceived Exertion While Exercising at the Same Intensity
Effect of Training Mode on Post-Exercise Heart Rate Recovery of Trained Cyclists
 Digital Commons at Loyola Marymount University and Loyola Law School Undergraduate Library Research Award ULRA Awards Effect of Training Mode on Post-Exercise Heart Rate Recovery of Trained Cyclists Kelia
Developing accurate and reliable tools for quantifying. Using objective physical activity measures with youth: How many days of monitoring are needed?
 Using objective physical activity measures with youth: How many days of monitoring are needed? STEWART G. TROST, RUSSELL R. PATE, PATTY S. FREEDSON, JAMES F. SALLIS, and WENDELL C. TAYLOR Department of
Mobilization and Exercise Prescription
 1 Clinicians can use this job aid as a tool to guide them through mobilization and exercise prescription with patients who have cardiopulmonary conditions. Mobilization and Exercise Prescription Therapy
Squid: Exercise Effectiveness and. Muscular Activation Tracking
 1 Squid: Exercise Effectiveness and Muscular Activation Tracking Design Team Trevor Lorden, Adam Morgan, Kyle Peters, Joseph Sheehan, Thomas Wilbur Interactive Media Alexandra Aas, Alexandra Moran, Amy
Cardiovascular Fitness
 Section III: Concept 08 Cardiovascular Fitness Cardiovascular Fitness "Cardio" = heart "Vascular" = vessels A strong heart and healthy vessels (developed from regular physical activity) help to make a
Eligibility The NCSF online quizzes are open to any currently certified fitness professional, 18 years or older.
 Eligibility The NCSF online quizzes are open to any currently certified fitness professional, 18 years or older. Deadlines Course completion deadlines correspond with the NCSF Certified Professionals certification
Accelerometer Assessment of Children s Physical Activity Levels at Summer Camps
 Accelerometer Assessment of Children s Physical Activity Levels at Summer Camps Jessica L. Barrett, Angie L. Cradock, Rebekka M. Lee, Catherine M. Giles, Rosalie J. Malsberger, Steven L. Gortmaker Active
THE LONG RIDE THRESHOLD RIDES HILLS
 THE LONG RIDE 6/10 effort focusing on building your time on the bike and developing your aerobic capacity. Start off riding at 65% of MHR (conversational pace). Gradually this will build to 75% of MHR
505 Recovery rates and training (Pulse Oximeter)
") Sensors: Loggers: Pulse Oximeter None required Science in Sport Logging time: Not applicable Teacher s notes 505 Recovery rates and training (Pulse Oximeter) Read The Pulse Oximeter is a simple to use
Sensors: Loggers: Pulse Oximeter None required Science in Sport Logging time: Not applicable Teacher s notes 505 Recovery rates and training (Pulse Oximeter) Read The Pulse Oximeter is a simple to use
TESTING SERVICES BODY COMPOSITION:
 The Nutrition and Exercise Testing (NExT) Lab offers a number of fitness, body composition and energy expenditure tests for individuals from the community, Ryerson faculty and staff, seniors and students.
Content Area: Physical Education Grade Level Expectations: Fifth Grade Standard: 1. Movement Competence & Understanding in Physical Education
 Colorado Academic Standards Physical Education - Fifth Grade Content Area: Physical Education Grade Level Expectations: Fifth Grade Standard: 1. Movement Competence & Understanding in Physical Education
Dauphin County Chiefs of Police Testing Consortium Physical Fitness Test Standards
 Dauphin County Chiefs of Police Testing Consortium Physical Fitness Test Standards The standard used in the physical fitness test were derived from law enforcement physical fitness norms that are based
THE LONG RIDE THRESHOLD RIDES HILLS
 THE LONG RIDE 6/10 effort focusing on building your time on the bike and developing your aerobic capacity. Start off riding at 65% of MHR (conversational pace). Gradually this will build to 75% of MHR
Predicting VO2max in College-Aged Participants Using Cycle Ergometry and Nonexercise Measures
 Brigham Young University BYU ScholarsArchive All Theses and Dissertations 2009-08-05 Predicting VO2max in College-Aged Participants Using Cycle Ergometry and Nonexercise Measures David E. Nielson Brigham
Introduction to Training Beginning Athletes. Beginning Athletes 19/04/2018. Fundamental Movement Skills for Beginning Athletes. Training Progressions
 Introduction to Training Beginning Athletes Version 17 March 2018 Athletics Australia 2018 Training Principles for Beginning Athletes Remember: That as a Coach you are responsible for creating a welcoming,
Adding Activity to Your Lifestyle
 MINTO PREVENTION & REHABILITATION CENTRE CENTRE DE PREVENTION ET DE READAPTATION MINTO Adding Activity to Your Lifestyle About This Kit An important long-term goal of the Heart Institute Prevention and
Actical Accelerometry Cut-points for Quantifying Levels of Exertion in Overweight Adults. Jamie Elizabeth Giffuni.
 Actical Accelerometry Cut-points for Quantifying Levels of Exertion in Overweight Adults Jamie Elizabeth Giffuni A thesis submitted to the faculty at the University of North Carolina at Chapel Hill in
INTERPRETING FITNESSGRAM RESULTS
 CHAPTER 9 INTERPRETING FITNESSGRAM RESULTS FITNESSGRAM uses criterion-referenced standards to evaluate fitness performance. These standards have been established to represent a level of fitness that offers
MAXIMAL AEROBIC POWER (VO 2max /VO 2peak ) Application to Training and Performance
 Application to Training and Performance") MAXIMAL AEROBIC POWER (VO 2max /VO 2peak ) Application to Training and Performance Presented by Coaching and Sports Science Division of the United States Olympic Committee Revised July 2004 MAXIMAL AEROBIC
MAXIMAL AEROBIC POWER (VO 2max /VO 2peak ) Application to Training and Performance Presented by Coaching and Sports Science Division of the United States Olympic Committee Revised July 2004 MAXIMAL AEROBIC
Title : Adaptation to exercise
 Title : Adaptation to exercise Teacher: Magdalena Gibas MD PhD Coll. Anatomicum, 6 Święcicki Street, Dept. of Physiology I. Exercise physiology 1. The acute and chronic responses to exercise depend upon
REGIONAL EMERGENCY SERVICES RECRUIT FITNESS TESTING PROCESS
 RECRUIT FITNESS TEST ADMINISTRATION: The Recruit Physical Fitness Test is administered by Alberta Sport Development Center at the Syncrude Sport and Wellness Center. To register for Firefighter Fitness
Lab Exercise 8. Energy Expenditure (98 points)
") Lab Exercise 8 Energy Expenditure (98 points) Introduction To understand an individual s energy requirements, we must be able to estimate their usual energy expenditure. This is difficult to do in free
Lab Exercise 8 Energy Expenditure (98 points) Introduction To understand an individual s energy requirements, we must be able to estimate their usual energy expenditure. This is difficult to do in free
Effect of Weekly Exercise Frequency on BMI. Dalton Trembow Rowan University Department of Health and Exercise Science
 Effect of Weekly Exercise Frequency on BMI Dalton Trembow Rowan University Department of Health and Exercise Science BACKGROUND AND LITERATURE REVIEW It is well known that obesity has become an epidemic
Unit 1: Fitness for Sport and Exercise
 Unit 1: Fitness for Sport and Exercise Level: 1 and 2 Unit type: Core Guided learning hours: 30 Assessment type: External Unit introduction All sports performers want to be the best they can be. To reach
Eligibility The NCSF online quizzes are open to any currently certified fitness professional, 18 years or older.
 Eligibility The NCSF online quizzes are open to any currently certified fitness professional, 18 years or older. Deadlines Course completion deadlines correspond with the NCSF Certified Professionals certification
ASSESSING BODY COMPOSITION
 ALL ABOUT EXERCISE ASSESSING BODY COMPOSITION BODY MASS INDEX Body Mass Index (BMI) is a number calculated from a person s height and weight. BMI is an indicator of total body fat and is used to screen
TomTom Fitness Age User Manual 1.0
 TomTom Fitness Age User Manual 1.0 1st September 2017 Contents All about TomTom Fitness Age 3 Which devices can I use? 4 Quick tutorial 5 Your Fitness Age... 5 Fitness Points... 5 Effort Matters... 7 Everyone
A Non-Exercise Based Estimation of the Critical Running Velocity and Anaerobic Running Capacity in Competitive Runners
 University of Kentucky UKnowledge Theses and Dissertations--Kinesiology and Health Promotion Kinesiology and Health Promotion 2016 A Non-Exercise Based Estimation of the Critical Running Velocity and Anaerobic
PERCEIVED VS. OBJECTIVE STRAIN IN THE WHOOP POPULATION CONSTANTIN BOSINCEANU DEPARTMENT OF PHYSIOLOGY AND ANALYTICS WHOOP, INC.
 PERCEIVED VS. OBJECTIVE STRAIN IN THE WHOOP POPULATION CONSTANTIN BOSINCEANU DEPARTMENT OF PHYSIOLOGY AND ANALYTICS WHOOP, INC. APRIL 2, 2016 Copyright 2016 WHOOP, inc. All rights reserved. The information
GROUP CYCLE CONSOLE. User manual
 GROUP CYCLE CONSOLE User manual Contents Description of the buttons...3 Description of the display...4 Starting an exercise...7 Technogym threshold power test...8 Using the chest strap...10 Heart rate
Copyright is owned by the Author of the thesis. Permission is given for a copy to be downloaded by an individual for the purpose of research and
 Copyright is owned by the Author of the thesis. Permission is given for a copy to be downloaded by an individual for the purpose of research and private study only. The thesis may not be reproduced elsewhere
WHO WE ARE WHO USES MIO MIO S PRODUCTS INCLUDE WHAT WE DO WHY TRAIN WITH HEART. Mio FUSE. Mio ALPHA 2. Mio LINK
 WHO WE ARE Mio Global makes advanced wearable technology for athletes who want to improve their performance and get the most out of each training session. The company was founded in 1999 by CEO Liz Dickinson,
Unit 1: Fitness for Sport and Exercise. Fitness Testing
 Unit 1: Fitness for Sport and Exercise Fitness Testing Importance of fitness testing Gives baseline data for monitoring/improving performance Can design training programmes based on test results and determine
Middle School Cross Country
 Middle School Cross Country By: Heather Baker Building a team oriented quality program If your actions inspire others to dream more, learn more, do more and become more, you are a leader. -John Quincy
Fitting a Single-Phase Model to the Post-Exercise Changes in Heart Rate and Oxygen Uptake
 Fitting a Single-Phase Model to the Post-Exercise Changes in Heart Rate and Oxygen Uptake R. STUPNICKI, T. GABRYŚ, U. SZMATLAN-GABRYŚ, P. TOMASZEWSKI University of Physical Education, Warsaw, Poland Summary
CHAPTER III METHODOLOGY
 CHAPTER III METHODOLOGY This chapter describes the procedures followed in the selection of subjects, selection of variables, selection of tests, reliability of the data, competency of the tester, orientation
Coaching Applications Training Zones Revisited
 J. Swimming Research, Vol. 19:2 (2012) Coaching Applications Ernest W. Maglischo, Ph.D. 1970 Lazy Meadow Lane Prescott, AZ 86303 USA ewmaglischo@cox.net Abstract The purpose of this paper will be to describe
Rockwell Automation Self-Administered Cardiorespiratory Test: Submission Form
 Rockwell Automation Self-Administered Cardiorespiratory Test: Submission Form Only this page (p. 1) needs to be returned to StayWell to be considered for cardiorespiratory test credit. Forms must be received
CALIBRATION OF THE ACTICAL ACCELEROMETER IN ADULTS. Jason Diaz
 CALIBRATION OF THE ACTICAL ACCELEROMETER IN ADULTS Jason Diaz A thesis submitted to the faculty of the University of North Carolina at Chapel Hill in partial fulfillment of the requirements for the degree