Pathways for Neoarchean pyrite formation constrained by mass-independent sulfur
|
|
|
- Alexandra Fowler
- 5 years ago
- Views:
Transcription
1 1 Supplementary Materials for: Pathways for Neoarchean pyrite formation constrained by mass-independent sulfur isotopes James Farquhar 1, 2, John Cliff 2, Aubrey L. Zerkle 3, Alexey Kamyshny 4, Simon W. Poulton 5, Mark Claire 6, David Adams 2,Brian Harms 1 1 Department of Geology and ESSIC, University of Maryland, College Park MD USA. 2 Centre for Microscopy and Microanalysis, University of Western Australia, Perth, Australia. 3 School of Civil Engineering and Geoscience, Newcastle University, Newcastle upon Tyne, NE1 7RU, UK. 4 Department of Geological and Environmental Sciences, The Faculty of Natural Sciences, Ben-Gurion University of the Negev, P.O. Box 653, Beer Sheva 84105, Israel. 5 School of Earth and Environment, University of Leeds, Leeds, LS2 9JT, UK. 6 School of Environmental Sciences, University of East Anglia, Norwich Research Park, Norwich, NR4 7TJ, UK Analytical procedure Sample preparation Samples were cut from core remnants using a diamond wafering saw and cast along with the in-house standard Son-3 in epoxy mounts. Samples were ground flat and polished to 1 µm before imaging and coating with 30 nm of gold. Sulfide S-isotope analysis Analytical procedure Sulfur 4-isotope ratios ( x S/ 32 S) were determined using a Cameca IMS 1280 ion microprobe in multicollection mode at the Centre for Microscopy, Characterisation and
2 Analysis (CMCA) at the University of Western Australia. In all cases NMR regulation was used and 32 S, 33 S, and 34 S were measured using Faraday cup detectors (FC). 36 S was measured using an electron multiplier (EM). Two different analytical conditions were used depending on the size of the sulfide target available. When sulfide grains were of sufficient size, a rastered beam approach was used. A na focused primary beam was used to presputter the analysis area using a 30 µm 30 µm beam for 30 seconds followed by automated secondary centering in the field aperture (FA) and entrance slit (ES) and analysis using a 20 µm 20 µm raster employing dynamic transfer for 45 4 second integrations. This strategy optimized conditions for a stable signal for 36 S on the EM, thus minimizing artifacts due to nonlinearity of the EM response at high count rates during the course of a single analysis. Unknowns were bracketed with standards of known composition. Other conditions include a 133 magnification between sample stage and FA, 70 µm entrance slit, 4000 µm FA, 400 µm contrast aperture, a 40 ev energy window with a 5 ev offset to the high energy side, and 500 µm exit slits. These conditions do not allow for complete resolution of the 32 SH - and 33 S - peaks. However, we employed the common method of offsetting the m/z 33 trolley to the low mass side. Abundance sensitivity under the analytical conditions presented here is sufficient to exclude tailing of the 32 SH - peak. For example, we have found that under these conditions, analyses of standard grains in a radius of 6 mm from the centre of the sample provide no evidence of degraded abundance sensitivity which would be exhibited as poor external precision of the 33 S/ 32 S measurements and a positive 33 S signature ( 33 S- ext = 0.04, 33 S = ± 0.01, 1 ext ). Average external precision (1 SD) for standard analyses were as follows 33 S =0.05, 34 S =0.05, 36 S=0.15, 33 S =0.03, and 36 S = In many cases, targets were analyzed with length scales of between 10 µm and 20 µm. For these targets, a static ~10 µm beam was used after presputtering. Because IMF changed
3 dramatically as a function of depth (see Table S1 below) IMF was calculated every 15 cycles. Thus, each analysis consisted of 45 4-second cycles but used a different IMF factors for cycles 1-15, 16-30, and and data reported here consist of the average of the IMF corrected values (or calculated values) and uncertainties are the SD mean of the three values for each analysis. Each analysis spot was pre-sputtered for 30 seconds with a raster of 10 µm before a static beam was employed. Other analytical conditions were identical to that employed with a rastered beam (see above). Regardless of whether a rastered or static beam was used for analysis, a normal incidence electron gun was used for charge compensation. Despite the fact that the analyses were performed with the Cameca automatic EM drift correction module, drift correction was often needed for 36 S. Average external precision for standard analyses were as follows 33 S = 0.07, 34 S =0.11, 36 S=0.30, 33 S =0.04, and 36 S =0.25. Table S1. Representative IMF data for 33 S/ 32 S, 34 S/ 32 S, and 36 S/ 32 S for a single analysis session using the static analysis beam approach. Individual x S values for each analysis were obtained by averaging the values obtained using equation 4 with three different IMF values for each third of the analysis. 33 S/ 32 S 34 S/ 32 S 36 S/ 32 S Anal. cycle IMF a 1 b a Instrumental mass fractionation () defined by (equation 3 above). b 1 SD mean n = 12. Data processing calibration Detector yield and background corrected x S/ 32 S raw ratios (R raw ) were drift corrected where deemed necessary using a linear regression: 78 R drift R raw mx (1)
4 where m is the slope of the regression and x is the analysis number between bracketing standards, scaled to ensure that the intercept (c) crosses the x-axis at x = 0. The drift corrected ratios were expressed as raw delta values (VCDT) using: 82 x S drift R 1000 drift 1 x RVCDT. (2) We used for 33 R VCDT, for 34 R VCDT, and for 36 R VCDT. mass fractionation (α) was then calculated as the infit and outfit corrected σ drift -2 (see below) weighted average of all estimates α i of the δ x S drift values for the bracketing standards using: 86 x S i x S drift std (3) where δ x S std is the δ x S value of the bracketing working standard used in the analyses relative to VCDT. The δ x S estimate relative to VCDT for each sample spot was obtained by using: x S sample x S drift (4) The Laser Fluorination values for our primary pyrite standard Son-3 relative to VCDT are 33 S= 0.83±0.03, 34 S = 1.61±0.08, and 36 S= 3.25±0.03 (mean ±SD mean n=3) Propagation of uncertainty We use the law of propagation of uncertainty to obtain expanded uncertainty estimates for individual analyses including a covariance term for linear regression associated with drift correction when used. The propagated error to include the uncertainty associated with drift correction is given by:
5 97 R drift 2 i 2 reg, (5) where σ i is the internal precision (SD mean of the 15 analysis blocks (for static analyses) or 45 analysis blocks (for rastered analyses) of a single analysis i and σ reg is the standard error of the estimate of the linear regression used to model drift, given by: 101 reg 2 2 m 2 c x 2x m c. (6) σ m and σ c are the standard errors associated with the estimation of slope and intercept respectively and ρ is the correlation coefficient for the regression. The uncertainty of δ x S drift is given by: 105 drift 1000 x R VCDT R drift 2. (7) The uncertainty of individual α i estimates is given by: x S drift i drift std (8) x x Sstd 1000 Sstd where σ std is the uncertainty of the reference value of the appropriate working standard. The uncertainty associated with α (σ α ) is the weighted mean standard error of the individual estimates α i obtained from the drift corrected standards that have been scaled for underfit or overfit using n 1 ( i ) * * (9) ( 1) 2 n i 1 i The propagated uncertainty for the δ 18 O value of each sample spot is given by:
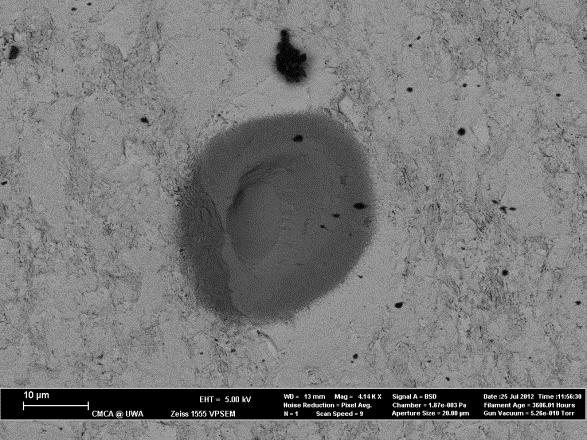
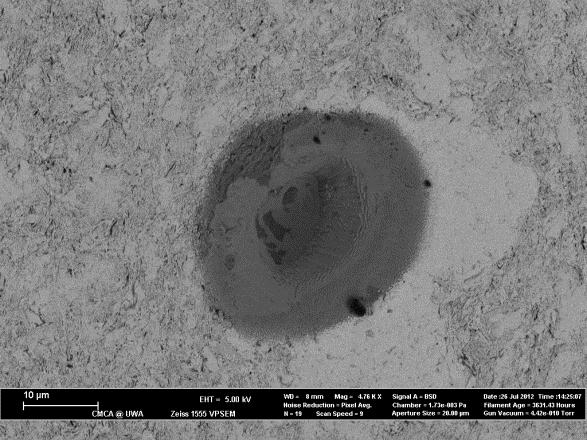
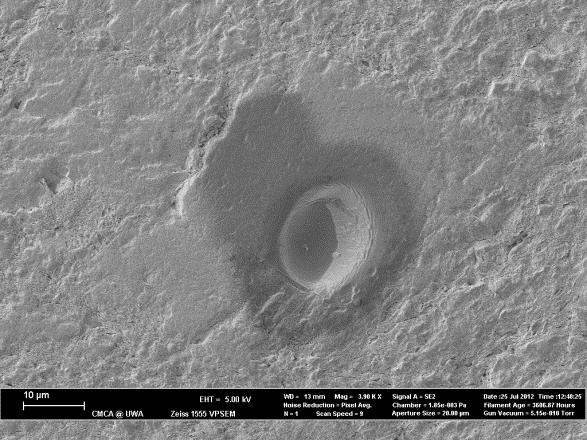
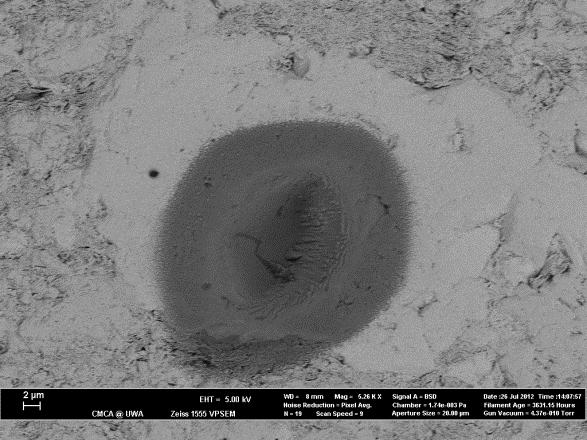
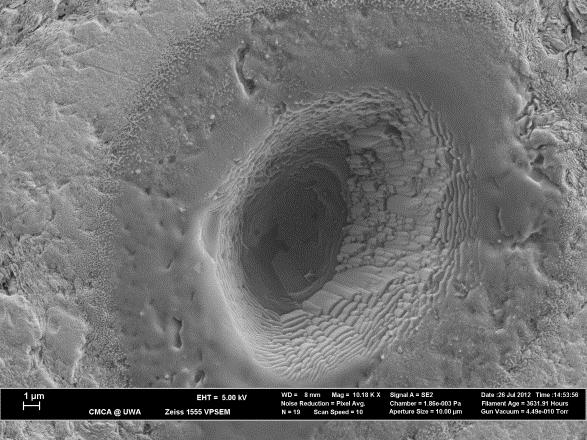
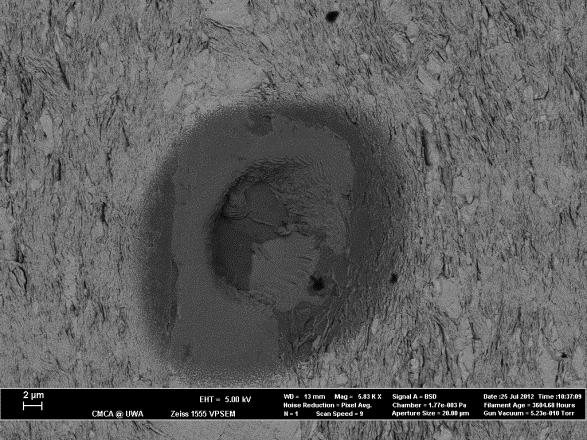
6 115 x sample 1 drift 2 x 1000 S sample 2 2. (10) sample * S (11) and sample * 1.9 S (12) Evaluation of uncertainty introduced by partial overlap with nonsulfide phases The placement of the primary beam on pyrite grains for one session (Mount 2-sample GKF m) was offset by about 10 microns from where we thought the beam was aimed. Since the grains were only microns across, this yielded analyses of spots with variable amounts of overlap with nonsulfide phases. The grains in this sample are disseminated pyrite and appear to possess a homogenous Δ 33 S and Δ 36 S values. The δ 34 S values appear to be variable, and it is unclear whether this is real heterogeneity or an artifact of grain overlap. A plot of Δ 33 S versus count rate ( 32 S) is presented in Figure S1. SEM and BSE images and data for these spots are presented below in Figure S2 and Table S2.
.")

7 Figure S1: Plot of Δ 33 S versus count rate ( 32 S). Error bars are 2 times the SIMS uncertainty Mount 2 Grain MOUNT 2 GRAIN 2


8 MOUNT 2 GRAIN MOUNT 2 GRAIN 4


9 MOUNT 2 GRAIN MOUNT 2 GRAIN 6


10 MOUNT 2 GRAIN MOUNT 2 GRAIN 8 Figure S2: SEM and BSE images of SIMS pits for sample Mount 2 GKF m. Each SIMS pit was occupied for three successive 160
11 161 Table S Analysis 32 S counts 33 S VCDT unc 34 S VCDT unc 36 S VCDT unc 33 S VCDT unc 36 S VCDT unc #2-1@1 1.4E #2-1@2 1.54E #2-1@3 1.75E #2-2@1 1.36E #2-2@2 1.53E #2-2@3 1.97E #2-3@1 5.7E #2-3@2 7.71E #2-3@3 3.49E #2-5@1 1.02E #2-5@2 1.4E #2-5@3 1.13E #2-6@1 8.07E #2-6@2 1.08E #2-6@3 5.5E #2-8@1 1.42E #2-8@ #2-8@ Sample Analysis and Sample Data The three epoxy mounts studied here were photographed (Figure S3) and representative images of SIMS pits are presented following. SIMS data for all sessions (and data used in plotting) is included in Table S3 and S4.


.")

.")

12 Figure S3. Photomosaics of epoxy mounts studied here. Sample mount 1 (upper left) includes two equant pieces of (top) and two long pieces of (bottom). Sample mount 2 (upper right) includes one piece of (top) and three pieces of 1404 (lower right). Sample mount 4 (lower left) includes two pieces of sample (top) and one large piece of (bottom) GKF01 Mount 1 spot 1 178


13 179 GKF01 Mount 1 spot GKF01 Mount 1 spot GKF01 Mount 1 spot GKF01 Mount 1 spot 5


14 GKF01 Mount 1 spot GKF01 Mount 1 spot GKF01 Mount 1 spot 8


15 GKF01 Mount 1 spot GKF01 Mount 1 spot GKF01 Mount 1 spot 11


16 GKF01 Mount 1 spot GKF01 Mount 1 spot GKF01 Mount 1 spot GKF01 Mount 1 spot 15


17 GKF01 Mount 1 spot GKF01 Mount 1 spot GKF01 Mount 1 spot 18


18 GKF01 Mount 1 spot 20 or GKF01 Mount 1 spot 19 Representative SEM images of SIMS pits of other samples are below: MOUNT 2 GRAIN MOUNT 2 GRAIN 10


19 MOUNT 2 GRAIN Mount 2 GRAIN MOUNT 2 GRAIN 13


20 MOUNT 2 GRAIN MOUNT 2 GRAIN 15
21 Table S3 Data: GKF01-mount4-grain1 Analysis 32 S counts 33 S VCDT unc 34 S VCDT unc 36 S VCDT unc 33 S VCDT unc 36 S VCDT unc Son@1 2.23E Son@ E Son@ E Son@ E Son@ E GKF01_mount4_1102_grain-1@1 1.96E GKF01_mount4_1102_grain-1@2 2.00E GKF01_mount4_1102_grain-1@3 1.99E GKF01_mount4_1102_grain-1@4 1.91E GKF01_mount4_1102_grain-1@5 1.92E GKF01_mount4_1102_grain-1@6 1.97E Son@ E Son@ E GKF01_mount4_1102_grain-1@7 1.95E GKF01_mount4_1102_grain-1@8 1.92E GKF01_mount4_1102_grain-1@9 1.99E GKF01_mount4_1102_grain-1@ E GKF01_mount4_1102_grain-1@ E GKF01_mount4_1102_grain-1@ E Son@ E Son@ E GKF01_mount4_1102_grain-1@ E GKF01_mount4_1102_grain-1@ E
22 2.10E E E E E E E E E E E E E E E E E E E E E E E E E E E E E
23 2.45E E E E E E E E E E E E E E E E E E E E E E E E E E E E E E
24 2.37E E E E E E E E E E E E E E E E E E E E E E E E E E E E E E
25 2.35E E E E E E E E E E E E E GKF01_mount4_Grain3 and disseminated 2.36E E E E E E E E E E E E E
26 2.22E E E E E E E E E E E E E E E E E E E E E E E E E E E E E E
27 2.14E E E E E E E Mount2_gkf E E E E E E E E E E E E E E E E E E
28 1.36E E E E E E E E E E E E E E E E E E E E E E E E E E E E E E
29 1.54E E E E E E E E E E E E E E E E E E E E E E E E E E E E E E
30 1.55E E E E E E E E E E E E Mount1gkf01 32Scounts d33s VCDT unc d34s VCDT unc d36s VCDT unc D33S VCDT unc D36S VCDT Unc 1.91E E E E E E E E E E E E E E E
31 1.77E E E E E E E E E E E E E E E E E E E E E E E E E E E E E E
32 1.84E E E E E E E E E E E E E E E E E E Mount1_2nd set 1.82E E E E E E E
33 1.90E E E E E E E E E E E E E E E E E E E E E E E E E E E E E E
34 1.85E E E E E E E E E E E E E E E E E E E E E E E E E E E E E
35 1.76E E E E E E E E E E E E E E E E E E E E E E E E E E E E E E
36 1.81E E E E E E E E E GKF01_mount_4_disseminated_bottomsample_and_vein 1.64E E E E E E E E E E E E E E E E E
37 2.74E E E E E E E E E E E E E E E E E E E E E E E E E E E E E E
38 2.51E E E E E E E E E E E E E E E E E E E E E E E E E E E E E E
39 1.51E E E E E E E E E E E E E E E E E E E E E E E E E E E E E E
The J105 SIMS. A New Instrument for 3-Dimensional Imaging and Analysis. Paul Blenkinsopp, Ionoptika Ltd
 The J105 SIMS A New Instrument for 3-Dimensional Imaging and Analysis Paul Blenkinsopp, Ionoptika Ltd The J105 SIMS Why a new ToF Mass Spectrometer? The J105 ToF has been designed to allow us to separate
F. Al-Rimawi* Faculty of Science and Technology, Al-Quds University, P.O. Box 20002, East Jerusalem. Abstract
 JJC Jordan Journal of Chemistry Vol. 4 No.4, 2009, pp. 357-365 Development and Validation of Analytical Method for Fluconazole and Fluconazole Related Compounds (A, B, and C) in Capsule Formulations by
LOCALISATION, IDENTIFICATION AND SEPARATION OF MOLECULES. Gilles Frache Materials Characterization Day October 14 th 2016
 LOCALISATION, IDENTIFICATION AND SEPARATION OF MOLECULES Gilles Frache Materials Characterization Day October 14 th 2016 1 MOLECULAR ANALYSES Which focus? LOCALIZATION of molecules by Mass Spectrometry
Electronic Supplementary Information NOVEL NON-TARGET ANALYSIS FOR FLUORINE COMPOUNDS USING ICPMS/MS AND HPLC-ICPMS/MS
 Electronic Supplementary Material (ESI) for Journal of Analytical Atomic Spectrometry. This journal is The Royal Society of Chemistry 2017 Electronic Supplementary Information NOVEL NON-TARGET ANALYSIS
Data Independent MALDI Imaging HDMS E for Visualization and Identification of Lipids Directly from a Single Tissue Section
 Data Independent MALDI Imaging HDMS E for Visualization and Identification of Lipids Directly from a Single Tissue Section Emmanuelle Claude, Mark Towers, and Kieran Neeson Waters Corporation, Manchester,
Development and Validation of a Polysorbate 20 Assay in a Therapeutic Antibody Formulation by RP-HPLC and Charged Aerosol Detector (CAD)
") LIFE SCIENCES AR ENOUGH? HOW DO YOU KNOW RAW MATERIALS ARE PURE? HOW DO YOU EVALUATE PRODUCT PACKAGING? HOW DO YOU DO YOU KNOW WHAT ANALYTICAL TECHNIQUE TO USE? HOW DO YOU SIMULTANEOUSLY TEST FOR TWO BYPRODUCTS?
LIFE SCIENCES AR ENOUGH? HOW DO YOU KNOW RAW MATERIALS ARE PURE? HOW DO YOU EVALUATE PRODUCT PACKAGING? HOW DO YOU DO YOU KNOW WHAT ANALYTICAL TECHNIQUE TO USE? HOW DO YOU SIMULTANEOUSLY TEST FOR TWO BYPRODUCTS?
Analysis of glipizide binding to normal and glycated human serum Albumin by high-performance affinity chromatography
 Analytical and Bioanalytical Chemistry Electronic Supplementary Material Analysis of glipizide binding to normal and glycated human serum Albumin by high-performance affinity chromatography Ryan Matsuda,
Application Note 201
 201 Application note: Determination of the of Milk Application note no.: 201 By: E. de Jong Date: January 2001 Copyright Delta Instruments 2005 www.deltainstruments.com Table of contents Table of contents
INTRODUCTION TO MALDI IMAGING
 INTRODUCTION TO MALDI IMAGING Marten F. Snel, Emmanuelle Claude, Thérèse McKenna, and James I. Langridge Waters Corporation, Manchester, UK INT RODUCTION The last few years have seen a rapid increase in
Supporting Information
 Supporting Information Mass Spectrometry Imaging Shows Cocaine and Methylphenidate have Opposite Effects on Major Lipids in Drosophila Brain Mai H. Philipsen *, Nhu T. N. Phan *, John S. Fletcher *, Per
Quadrupole and Ion Trap Mass Analysers and an introduction to Resolution
 Quadrupole and Ion Trap Mass Analysers and an introduction to Resolution A simple definition of a Mass Spectrometer A Mass Spectrometer is an analytical instrument that can separate charged molecules according
Theta sequences are essential for internally generated hippocampal firing fields.
 Theta sequences are essential for internally generated hippocampal firing fields. Yingxue Wang, Sandro Romani, Brian Lustig, Anthony Leonardo, Eva Pastalkova Supplementary Materials Supplementary Modeling
General Single Ion Calibration. Pete 14-May-09
 General Single Ion Calibration Pete 14-May-09 Purpose of SI calibration Measure the instrument response of a single ion. Necessary for understanding of error in instrument (counting statistics) Calculation
Linear Ultrasonic Wave Propagation in Biological Tissues
 Indian Journal of Biomechanics: Special Issue (NCBM 7-8 March 29) Linear Ultrasonic Wave Propagation in Biological Tissues Narendra D Londhe R. S. Anand 2, 2 Electrical Engineering Department, IIT Roorkee,
Mass Spectrometry Introduction
 Mass Spectrometry Introduction Chem 744 Spring 2013 What MS is and is not MS is NOT a spectroscopic method. Molecules are not absorbing EM radiation MS is the generation, separation and characterization
Conditional Distributions and the Bivariate Normal Distribution. James H. Steiger
 Conditional Distributions and the Bivariate Normal Distribution James H. Steiger Overview In this module, we have several goals: Introduce several technical terms Bivariate frequency distribution Marginal
Technical Note # TN-31 Redefining MALDI-TOF/TOF Performance
 Bruker Daltonics Technical Note # TN-31 Redefining MALDI-TOF/TOF Performance The new ultraflextreme exceeds all current expectations of MALDI-TOF/TOF technology: A proprietary khz smartbeam-ii TM MALDI
Astrocyte signaling controls spike timing-dependent depression at neocortical synapses
 Supplementary Information Astrocyte signaling controls spike timing-dependent depression at neocortical synapses Rogier Min and Thomas Nevian Department of Physiology, University of Berne, Bern, Switzerland
Introducing.. PIKA (Ochotona princeps)
") Introducing.. PIKA (Ochotona princeps) Pikas are hearty little mammals who live in rock piles high in the mountains of western North America. PIKA, or Peak Integration by Key Analysis is a software tool
Introducing.. PIKA (Ochotona princeps) Pikas are hearty little mammals who live in rock piles high in the mountains of western North America. PIKA, or Peak Integration by Key Analysis is a software tool
Analysis of Pesticides (II) Metribuzin & their metabolites in Rice Jun Yonekubo, Nihon Waters, JAPAN
 Metribuzin & their metabolites in Rice Jun Yonekubo, Nihon Waters, JAPAN") Waters Alliance LC/MS System Analytical Conditions Chromatograms Mass Spectra Calibration Quantitation Analysis of Pesticides (II) Metribuzin & their metabolites in Rice Jun Yonekubo,, JAPAN Key Words
Waters Alliance LC/MS System Analytical Conditions Chromatograms Mass Spectra Calibration Quantitation Analysis of Pesticides (II) Metribuzin & their metabolites in Rice Jun Yonekubo,, JAPAN Key Words
Mammography. Background and Perspective. Mammography Evolution. Background and Perspective. T.R. Nelson, Ph.D. x41433
 - 2015 Background and Perspective 2005 (in US) Women Men Mammography Invasive Breast Cancer Diagnosed 211,240 1,690 Noninvasive Breast Cancer Diagnosed 58,940 Deaths from Breast Cancer 40,410 460 T.R.
Supplementary figures
 Supplementary figures Supplementary Figure 1. Overlaid GPC traces (RI) of the PFDMS 61 aliquot, pure PFDMS 61-b- PMVS 574 copolymer and BCP P after sulfurisation of pendant phosphines. 1 Supplementary
RADIATION PROTECTION IN DIAGNOSTIC AND INTERVENTIONAL RADIOLOGY. L19: Optimization of Protection in Mammography
 IAEA Training Material on Radiation Protection in Diagnostic and Interventional Radiology RADIATION PROTECTION IN DIAGNOSTIC AND INTERVENTIONAL RADIOLOGY L19: Optimization of Protection in Mammography
A genetically targeted optical sensor to monitor calcium signals in astrocyte processes
 A genetically targeted optical sensor to monitor calcium signals in astrocyte processes 1 Eiji Shigetomi, 1 Sebastian Kracun, 2 Michael V. Sofroniew & 1,2 *Baljit S. Khakh Ψ 1 Departments of Physiology
MALDI-TOF analysis of whole blood: its usefulness and potential in the assessment of HbA1c levels
 MALDI-TOF analysis of whole blood: its usefulness and potential in the assessment of HbA1c levels Jane Y. Yang, David A. Herold Department of Pathology, University of California San Diego, 9500 Gilman
Chapter 3 CORRELATION AND REGRESSION
 CORRELATION AND REGRESSION TOPIC SLIDE Linear Regression Defined 2 Regression Equation 3 The Slope or b 4 The Y-Intercept or a 5 What Value of the Y-Variable Should be Predicted When r = 0? 7 The Regression
10 Years Experience in Industrial Phased Array Testing of Rolled Bars
 18th World Conference on Nondestructive Testing, 16-20 April 2012, Durban, South Africa 10 Years Experience in Industrial Phased Array Testing of Rolled Bars Josef MAIER 1 and Gerhard Ferstl 1, 1 Böhler
Verification of micro-beam irradiation
 Journal of Physics: Conference Series OPEN ACCESS Verification of micro-beam irradiation To cite this article: Qiongge Li et al 2015 J. Phys.: Conf. Ser. 573 012047 View the article online for updates
SUPPORTING INFORMATION. Lysine Carbonylation is a Previously Unrecognized Contributor. to Peroxidase Activation of Cytochrome c by Chloramine-T
 Electronic Supplementary Material (ESI) for Chemical Science. This journal is The Royal Society of Chemistry 2019 SUPPORTING INFORMATION Lysine Carbonylation is a Previously Unrecognized Contributor to
Supplementary Materials for
 www.sciencesignaling.org/cgi/content/full/8/364/ra18/dc1 Supplementary Materials for The tyrosine phosphatase (Pez) inhibits metastasis by altering protein trafficking Leila Belle, Naveid Ali, Ana Lonic,
Radiation Detection and Measurement
 Radiation Detection and Measurement Range of charged particles (e.g.,!: µm; ": mm) Range of high energy photons (cm) Two main types of interactions of high energy photons Compton scatter Photoelectric
THE RIGAKU JOURNAL VOL. 23 / 2006, A1-A10 CONSIDERATIONS REGARDING THE ALIGNMENT OF DIFFRACTOMETERS FOR RESIDUAL STRESS ANALYSIS
 THE RIGAKU JOURNAL VOL. 23 / 2006, A1-A10 CONSIDERATIONS REGARDING THE ALIGNMENT OF DIFFRACTOMETERS FOR RESIDUAL STRESS ANALYSIS THOMAS R. WATKINS, O. BURL CAVIN, CAMDEN R. HUBBARD, BETH MATLOCK, AND ROGER
Application(s) of Alanine
 of Alanine") Application(s) of Alanine Simon Duane Radiotherapy Standards User Group, 5 June 2007 Outline Alanine/EPR dosimetry characteristics, usage (dis)advantages for reference dosimetry Traceable dosimetry for
Application(s) of Alanine Simon Duane Radiotherapy Standards User Group, 5 June 2007 Outline Alanine/EPR dosimetry characteristics, usage (dis)advantages for reference dosimetry Traceable dosimetry for
CONSIDERATION OF ASPECT RATIO IN ULTIMATE FLEXURAL LOAD-CARRYING CAPACITY OF CFS REINFORCED RC BEAM
 - Technical Paper - CONSIDERATION OF ASPECT RATIO IN ULTIMATE FLEXURAL LOAD-CARRYING CAPACITY OF CFS REINFORCED RC BEAM Ming-Chien HSU *1, Tetsukazu KIDA *2, Tadashi ABE *2 and Yoshitaka OZAWA *3 ABSTRACT
Regression CHAPTER SIXTEEN NOTE TO INSTRUCTORS OUTLINE OF RESOURCES
 CHAPTER SIXTEEN Regression NOTE TO INSTRUCTORS This chapter includes a number of complex concepts that may seem intimidating to students. Encourage students to focus on the big picture through some of
Gene expression scaled by distance to the genome replication site. Ying et al. Supporting Information. Contents. Supplementary note I p.
 Gene expression scaled by distance to the genome replication site Ying et al Supporting Information Contents Supplementary note I p. 2 Supplementary note II p. 3-5 Supplementary note III p. 5-7 Supplementary
Available Online through Research Article
 ISSN: 0975-766X Available Online through Research Article www.ijptonline.com SPECTROPHOTOMETRIC METHODS FOR THE DETERMINATION OF FROVATRIPTAN SUCCINATE MONOHYDRATE IN BULK AND PHARMACEUTICAL DOSAGE FORMS
A NOVEL METHOD OF M/Z DRIFT CORRECTION FOR OA-TOF MASS SPECTROMETERS BASED ON CONSTRUCTION OF LIBRARIES OF MATRIX COMPONENTS.
 A NOVEL METHOD OF M/Z DRIFT CORRECTION FOR OA-TOF MASS SPECTROMETERS BASED ON CONSTRUCTION OF LIBRARIES OF MATRIX COMPONENTS. Martin R Green*, Keith Richardson, John Chipperfield, Nick Tomczyk, Martin
Performance of phased array and conventional ultrasonic probes on the new ISO reference block
 Performance of phased array and conventional ultrasonic probes on the new ISO 19675 reference block C. Udell, D. Chai 1 and F. Gattiker Proceq S.A., Ringstrasse 2, Schwerzenbach, Switzerland. More info
1 Analytical Methods 2 3 Electronic Supplementary Information Ultra-trace determination of sodium fluoroacetate (1080) as
 as") Electronic Supplementary Material (ESI) for Analytical Methods. This journal is The Royal Society of Chemistry 018 1 Analytical Methods 3 Electronic Supplementary Information 4 5 6 Ultra-trace determination
Electronic Supplementary Material (ESI) for Analytical Methods. This journal is The Royal Society of Chemistry 018 1 Analytical Methods 3 Electronic Supplementary Information 4 5 6 Ultra-trace determination
The Impact of Statistically Adjusting for Rater Effects on Conditional Standard Errors for Performance Ratings
 0 The Impact of Statistically Adjusting for Rater Effects on Conditional Standard Errors for Performance Ratings Mark R. Raymond, Polina Harik and Brain E. Clauser National Board of Medical Examiners 1
For more information, please contact: or +1 (302)
") Introduction Quantitative Prediction of Tobacco Components using Near-Infrared Diffuse Reflectance Spectroscopy Kristen Frano Katherine Bakeev B&W Tek, Newark, DE Chemical analysis is an extremely important
Introduction Quantitative Prediction of Tobacco Components using Near-Infrared Diffuse Reflectance Spectroscopy Kristen Frano Katherine Bakeev B&W Tek, Newark, DE Chemical analysis is an extremely important
DR1 - Schematic geological maps of sampling sites and field data
 GSA Data Repository 2019164 Nuriel, P. et al., 2019, Reactivation history of the North Anatolian fault zone based on calcite age-strain analyses: Geology, https://doi.org/10.1130/g45727.1 DR1 - Schematic
Topics covered 7/21/2014. Radiation Dosimetry for Proton Therapy
 Radiation Dosimetry for Proton Therapy Narayan Sahoo Department of Radiation Physics University of Texas MD Anderson Cancer Center Proton Therapy Center Houston, USA Topics covered Detectors used for to
SUPPLEMENTARY INFORMATION. Direct Observation of the Local Reaction Environment during the Electrochemical Reduction of CO 2
 Direct Observation of the Local Reaction Environment during the Electrochemical Reduction of CO 2 Ezra L. Clark 1,2 and Alexis T. Bell* 1,2 1 Joint Center for Artificial Photosynthesis Lawrence Berkeley
Nature Neuroscience: doi: /nn Supplementary Figure 1. Behavioral training.
 Supplementary Figure 1 Behavioral training. a, Mazes used for behavioral training. Asterisks indicate reward location. Only some example mazes are shown (for example, right choice and not left choice maze
Other Major Component Inspection II
 Other Major Component Inspection II Ultrasonic Inspection Technique for BWR Shroud Support Plate Access Hole Covers S.W. Glass III, B. Thigpen, Areva, France BACKGROUND Access hole covers (AHC) are found
Assessment of variation of wedge factor with depth, field size and SSD for Neptun 10PC Linac in Mashhad Imam Reza Hospital
 Iran. J. Radiat. Res., 2004; 2 (2): 53-58 Assessment of variation of wedge factor with depth, field size and SSD for Neptun 10PC Linac in Mashhad Imam Reza Hospital M. Hajizadeh Saffar 1*, M.R. Ghavamnasiri
UV Spectrophotometric Estimation of Alprazolam by Area Under Curve And First Order Derivative Methods in Bulk and Pharmaceutical Dosage Form
 Available online at www.scholarsresearchlibrary.com Scholars Research Library Der Pharmacia Lettre, 2016, 8 (5):105-110 (http://scholarsresearchlibrary.com/archive.html) ISSN 0975-5071 USA CODEN: DPLEB4
Supplementary information. Additional methods: Elemental formula assignments
 Impact of instrument and experiment parameters on reproducibility and repeatability of peaks within ultrahigh resolution ESI FT ICR mass spectra of natural organic matter Melissa C. Kido Soule 1, Krista
Estimation of protein using standard curve & Biochemistry analyzer. Experiment 1 & 2 BBT 314 ACh
 Estimation of protein using standard curve & Biochemistry analyzer Experiment 1 & 2 BBT 314 ACh Introduction Proteins are an abundant component in all cells, and almost all except storage proteins are
PRELIMINARY STUDY RESULT
 (BDIZ EDI) Implant-Study 2014/2015 Quantitative and qualitative element-analysis of implant-surfaces by SEM and EDX PRELIMINARY STUDY RESULT Name of Manufacturer: Medical Instinct Deutschland GmbH Analyzed
Supporting Information. Evolution of atomically precise silver clusters to superlattices
 Copyright WILEY-VCH Verlag GmbH & Co. KGaA, 69469 Weinheim, Germany, 2012. Supporting Information for Part. Part. Sys. Charact., DOI: 10.1002/ppsc.((please add manuscript number)) Evolution of atomically
Pankti M. Shah et al, Asian Journal of Pharmaceutical Technology & Innovation, 04 (17); 2016; 07-16
; 2016; 07-16") Asian Journal of Pharmaceutical Technology & Innovation ISSN: 2347-8810 Research Article Received on: 30-03-2016 Accepted on: 01-04-2016 Published on: 15-04-2016 Corresponding Author: *Pankti M. Shah,
Asian Journal of Pharmaceutical Technology & Innovation ISSN: 2347-8810 Research Article Received on: 30-03-2016 Accepted on: 01-04-2016 Published on: 15-04-2016 Corresponding Author: *Pankti M. Shah,
O O H. Robert S. Plumb and Paul D. Rainville Waters Corporation, Milford, MA, U.S. INTRODUCTION EXPERIMENTAL. LC /MS conditions
 Simplifying Qual/Quan Analysis in Discovery DMPK using UPLC and Xevo TQ MS Robert S. Plumb and Paul D. Rainville Waters Corporation, Milford, MA, U.S. INTRODUCTION The determination of the drug metabolism
Improved method for the quantification of lysophospholipids including enol ether
 Supplemental Material Improved method for the quantification of lysophospholipids including enol ether species by liquid chromatography-tandem mass spectrometry James G. Bollinger *, Hiromi Ii*, Martin
Electronic Supporting Information
 Electronic Supplementary Material (ESI) for Green Chemistry. This journal is The Royal Society of Chemistry 2018 Electronic Supporting Information Two-phase systems developed with hydrophilic and hydrophobic
bio-mof-1 DMASM Wavenumber (cm -1 ) Supplementary Figure S1 FTIR spectra of bio-mof-1, DMASMI, and bio-mof-1 DMASM.
 Supplementary Figure S1 FTIR spectra of bio-mof-1, DMASMI, and bio-mof-1 DMASM.") bio-mof-1 Transmittance bio-mof-1 DMASM DMASMI 2000 1500 1000 500 Wavenumber (cm -1 ) Supplementary Figure S1 FTIR spectra of bio-mof-1, DMASMI, and bio-mof-1 DMASM. Intensity (a.u.) bio-mof-1 DMASM as
bio-mof-1 Transmittance bio-mof-1 DMASM DMASMI 2000 1500 1000 500 Wavenumber (cm -1 ) Supplementary Figure S1 FTIR spectra of bio-mof-1, DMASMI, and bio-mof-1 DMASM. Intensity (a.u.) bio-mof-1 DMASM as
Figure S1: Influence of relative humidity on acetic acid fragmentation
 Supporting information for the article: Odorant emissions from intensive pig production measured by online Proton-Transfer-Reaction Mass Spectrometry Anders Feilberg *a, Dezhao Liu a, Anders P. S. Adamsen
CPGAN #002. FTIR Quantification of Absorbed Radiation Dose in Polyethylene
 1.1 Introduction Ultra-high molecular weight polyethylene (UHMWPE) is the current material of choice for bearing surface applications in total joint arthroplasty. In an effort to enhance the wear properties
Chapter 12: Mass Spectrometry: molecular weight of the sample
 Structure Determination: hapter 12: Mass Spectrometry- molecular weight of the sample; formula hapter 12: Infrared Spectroscopy- indicated which functional groups are present hapter 13: Nuclear Magnetic
Comparative study of analytical method development of fluconazole in tablets and capsule by ultraviolet spectrophotometric method
 Research Article Comparative study of analytical method development of fluconazole in tablets and capsule by ultraviolet spectrophotometric method Shital S. Patil*, Ubhale Ravindra, Yeole Tejal, Tayade
Matrix Assisted Laser Desorption Ionization Time-of-flight Mass Spectrometry
 Matrix Assisted Laser Desorption Ionization Time-of-flight Mass Spectrometry Time-of-Flight Mass Spectrometry. Basic principles An attractive feature of the time-of-flight (TOF) mass spectrometer is its
Method Comparison Report Semi-Annual 1/5/2018
 Method Comparison Report Semi-Annual 1/5/2018 Prepared for Carl Commissioner Regularatory Commission 123 Commission Drive Anytown, XX, 12345 Prepared by Dr. Mark Mainstay Clinical Laboratory Kennett Community
Spectrophotometric Determination of the Kinetic Parameters of β-fructofuranosidase and the Mechanism of Inhibition by Copper (II) Sulfate
 Sulfate") Spectrophotometric Determination of the Kinetic Parameters of β-fructofuranosidase and the Mechanism of Inhibition by Copper (II) Sulfate Allen Zhang Tyson Miao Science One Program The University of British
Spectrophotometric Determination of the Kinetic Parameters of β-fructofuranosidase and the Mechanism of Inhibition by Copper (II) Sulfate Allen Zhang Tyson Miao Science One Program The University of British
Integrated Targeted Quantitation Method for Insulin and its Therapeutic Analogs
 Integrated Targeted Quantitation Method for Insulin and its Therapeutic Analogs Eric Niederkofler, 1 Dobrin Nedelkov, 1 Urban Kiernan, 1 David Phillips, 1 Kemmons Tubbs, 1 Scott Peterman, 2 Bryan Krastins,
Chunyang Ding. A Sweet Conclusion: Comparing the Osmotic Potentials of Yams and Sweet Potatoes. 2 October Mr. Allen. AP/IB Biology P.
 Chunyang Ding A Sweet Conclusion: Comparing the Osmotic Potentials of Yams and Sweet Potatoes 2 October 2013 Mr. Allen AP/IB Biology P.3 Ding 2 Data Collection: Yam Raw Data: Raw Masses of Yams (±0.01
See external label 2 C-8 C Σ=96 tests Cat # 3171Z. Free Estriol. Cat # 3171Z. Enzyme Linked Immunosorbent Assay
 DIAGNOSTIC AUTOMATION, INC. 23961 Craftsman Road, Suite D/E/F, Calabasas, CA 91302 Tel: (818) 591-3030 Fax: (818) 591-8383 onestep@rapidtest.com technicalsupport@rapidtest.com www.rapidtest.com See external
GAFCHROMIC MD-55 RADIOCHROMIC DOSIMETRY FILM FOR HIGH-ENERGY PHOTONS CONFIGURATION, SPECIFICATIONS AND PERFORMANCE DATA
 GAFCHROMIC MD-55 RADIOCHROMIC DOSIMETRY FILM FOR HIGH-ENERGY PHOTONS CONFIGURATION, SPECIFICATIONS AND PERFORMANCE DATA DESCRIPTION GAFCHROMIC MD-55 radiochromic dosimetry film is designed for the measurement
High-Throughput Analysis of Oligonucleotides using Automated Electrospray Ionization Mass Spectrometry
 High-Throughput Analysis of Oligonucleotides using Automated Electrospray Ionization Mass Spectrometry Mark E. Hail 1, Brian Elliott 2, Kerry Nugent 3, Jeffrey L. Whitney 1, and David J. Detlefsen 1 1
Traceability and absorbed dose standards for small fields, IMRT and helical tomotherapy
 Traceability and absorbed dose standards for small fields, IMRT and helical tomotherapy Simon Duane, Hugo Palmans, Peter Sharpe NPL, UK Stefaan Vynckier UCL, Brussels, Belgium LNE-LNHB / BIPM workshop,
Terahertz reflectometry imaging for low and high grade gliomas
 Terahertz reflectometry imaging for low and high grade gliomas Young Bin Ji 1,9, Seung Jae Oh 1,9, Seok-Gu Kang 2,9, Jung Heo 3,9, Sang-Hoon Kim 1,4, Yuna Choi 1, Seungri Song 3, Hye Young Son 5, Se Hoon
Supporting information
 Supporting information Figure legends Supplementary Table 1. Specific product ions obtained from fragmentation of lithium adducts in the positive ion mode comparing the different positional isomers of
[ APPLICATION NOTE ] High Sensitivity Intact Monoclonal Antibody (mab) HRMS Quantification APPLICATION BENEFITS INTRODUCTION WATERS SOLUTIONS KEYWORDS
![[ APPLICATION NOTE ] High Sensitivity Intact Monoclonal Antibody (mab) HRMS Quantification APPLICATION BENEFITS INTRODUCTION WATERS SOLUTIONS KEYWORDS](/thumbs/79/80328542.jpg "[ APPLICATION NOTE ] High Sensitivity Intact Monoclonal Antibody (mab) HRMS Quantification APPLICATION BENEFITS INTRODUCTION WATERS SOLUTIONS KEYWORDS") Yun Wang Alelyunas, Henry Shion, Mark Wrona Waters Corporation, Milford, MA, USA APPLICATION BENEFITS mab LC-MS method which enables users to achieve highly sensitive bioanalysis of intact trastuzumab
Yun Wang Alelyunas, Henry Shion, Mark Wrona Waters Corporation, Milford, MA, USA APPLICATION BENEFITS mab LC-MS method which enables users to achieve highly sensitive bioanalysis of intact trastuzumab
Sound in medicine. CH.12. Dr.Rajaa أ.م.د. رجاء سهيل جنم جامعة تكريت كلية طب االسنان. General Properties of Sound
 CH.12. Dr.Rajaa Sound in medicine أ.م.د. رجاء سهيل جنم جامعة تكريت كلية Sound : It is the audible waves of frequency between 20 Hz and 20 khz. Infrasound : refers to the sound of frequency below the normal
Halo Collimation Depth Using BDSIM
 Halo Collimation Depth Using BDSIM John Carter Royal Holloway University of London Halo Collimation Depth Studies Full BDS Collimation plans Example of BDSIM collimation capabilities Conclusion John.Carter@.rhul
Specifics of treatment planning for active scanning and IMPT
 Specifics of treatment planning for active scanning and IMPT SFUD IMPT Tony Lomax, Centre for Proton Radiotherapy, Paul Scherrer Institute, Switzerland Treatment planning for scanning 1. Single Field,
CETR Adhesion Testing on Glass/Al Surface for Corning Inc.
 CETR Adhesion Testing on Glass/Al Surface for Corning Inc. I. Introduction 1.1 Objective The goal of the study was to differentiate stiction from various glass composites and surface treatments using the
Supporting Information for:
 Supporting Information for: A Robust Liposomal Platform for Direct Colorimetric Detection of Sphingomyelinase Enzyme and Inhibitors Margaret N. Holme, 1,2,3,4 Subinoy Rana, 1,2,3,5 Hanna M. G. Barriga,
DETERMINATION OF OXYCODONE CONTENT AND RELATED SUBSTANCES IN OXYCODONE AND ACETAMINOPHEN CAPSULE BY HIGH-PERFORMANCE LIQUID CHROMATOGRAPHY
 DETERMINATION OF OXYCODONE CONTENT AND RELATED SUBSTANCES IN OXYCODONE AND ACETAMINOPHEN CAPSULE BY HIGH-PERFORMANCE LIQUID CHROMATOGRAPHY *Liandong Hu 1,2 and Yanjing Shi 1,2 1 School of Pharmaceutical
Early Learning vs Early Variability 1.5 r = p = Early Learning r = p = e 005. Early Learning 0.
 The temporal structure of motor variability is dynamically regulated and predicts individual differences in motor learning ability Howard Wu *, Yohsuke Miyamoto *, Luis Nicolas Gonzales-Castro, Bence P.
Overbidding and Heterogeneous Behavior in Contest Experiments: A Comment on the Endowment Effect Subhasish M. Chowdhury* Peter G.
 CBESS Discussion Paper 15-17 Overbidding and Heterogeneous Behavior in Contest Experiments: A Comment on the Endowment Effect by Subhasish M. Chowdhury* Peter G. Moffatt* **CBESS and School of Economics,
Business Statistics Probability
 Business Statistics The following was provided by Dr. Suzanne Delaney, and is a comprehensive review of Business Statistics. The workshop instructor will provide relevant examples during the Skills Assessment
Matrix Interferences in ICP-MS: Causes, Effects, and Strategies to Reduce or Eliminate Them
 Matrix Interferences in ICP-MS: Causes, Effects, and Strategies to Reduce or Eliminate Them Ruth E. Wolf, Ph. D. and Daniel H. Jones HUMAN HEALTH ENVIRONMENTAL HEALTH 2017 2014 PerkinElmer Matrix Effects
SCATTER PLOTS AND TREND LINES
 1 SCATTER PLOTS AND TREND LINES LEARNING MAP INFORMATION STANDARDS 8.SP.1 Construct and interpret scatter s for measurement to investigate patterns of between two quantities. Describe patterns such as
Sample Illustration of the "CompuSyn Report" of Two-Drug Combinations in Vitro
 Sample Illustration of the "CompuSyn Report" of Two-Drug Combinations in Vitro A: Fludelone (FD) in nm (IC 50 was about 2.7 nm), 8 Data Points B: Panaxytriol (PTX) in um (IC 50 was about 3.2 um), 6 Data
Why use Signal-To-Noise as a Measure of MS Performance When it is Often Meaningless?
 Why use Signal-To-Noise as a Measure of MS Performance When it is Often Meaningless? Technical Overview Authors Greg Wells, Harry Prest, and Charles William Russ IV, Agilent Technologies, Inc. 285 Centerville
The vapour of imidazolium based ionic liquids: a mass spectrometry study
 The vapour of imidazolium based ionic liquids: a mass spectrometry study A. Deyko, K. R. J. Lovelock*, P. Licence, R. G. Jones School of Chemistry The University of Nottingham University Park Nottingham
EXERCISE: HOW TO DO POWER CALCULATIONS IN OPTIMAL DESIGN SOFTWARE
 ...... EXERCISE: HOW TO DO POWER CALCULATIONS IN OPTIMAL DESIGN SOFTWARE TABLE OF CONTENTS 73TKey Vocabulary37T... 1 73TIntroduction37T... 73TUsing the Optimal Design Software37T... 73TEstimating Sample
GC & LC Application Note
 GC & LC Application Note www.palsystem.com Comparison of the manual and automated generation of calibration standards Comparison of the manual and automated generation of calibration standards Thomas Funke,
Modeling Type One Diabetes with a Linear Response Function Based Model
 Modeling Type One Diabetes with a Linear Response Function Based Model Physics Honors Thesis Matthew Bauerle Advisor: Prof. Roman Vershynin Physics Honors Thesis July 29, 2016 Abstract Type one diabetes
Advanced IPD meta-analysis methods for observational studies
 Advanced IPD meta-analysis methods for observational studies Simon Thompson University of Cambridge, UK Part 4 IBC Victoria, July 2016 1 Outline of talk Usual measures of association (e.g. hazard ratios)
Low-Pressure Chromium Speciation in P2O5 using the Spectro ARCOS MV ICP and the ESI SC-DX chromfast System
 Low-Pressure Chromium Speciation in P2O5 using the Spectro ARCOS MV ICP and the ESI SC-DX chromfast System Dion Tsourides AAFPCO Meeting Albuquerque, NM (Acknowledgements ESI) Introduction Chromium exists
Fizzy Extraction of Volatile and Semivolatile Compounds into the Gas Phase
 SUPPORTING INFORMATION Fizzy Extraction of Volatile and Semivolatile Compounds into the Gas Phase Cheng-Hao Chang, Pawel L. Urban* Department of Applied Chemistry, National Chiao Tung University 1001 University
Determination of Benzodiazepines in Urine by CE-MS/MS
 Determination of Benzodiazepines in Urine by CE-MS/MS Application ote Forensic Toxicology Authors audimir Lucio do Lago Department of Fundamental Chemistry, Institute of Chemistry University of São Paulo,
BY: Bernard L. Cohen University of Pittsburgh. Pittsburgh, PA ABSTRACT
 CORRELATION BETWEEN MEAN RADON LEVELS AND LUNG CANCER RATES IN U.S. COUNTIES A TEST OF THE LINEAR - NO THRESHOLD THEORY BY: Bernard L. Cohen University of Pittsburgh. Pittsburgh, PA 15260 ABSTRACT Mean
V. LAB REPORT. PART I. ICP-AES (section IVA)
") CH 461 & CH 461H 20 V. LAB REPORT The lab report should include an abstract and responses to the following items. All materials should be submitted by each individual, not one copy for the group. The goal
CH 461 & CH 461H 20 V. LAB REPORT The lab report should include an abstract and responses to the following items. All materials should be submitted by each individual, not one copy for the group. The goal
Non-invasive blood glucose measurement by near infrared spectroscopy: Machine drift, time drift and physiological effect
 Spectroscopy 24 (2010) 629 639 629 DOI 10.3233/SPE-2010-0485 IOS Press Non-invasive blood glucose measurement by near infrared spectroscopy: Machine drift, time drift and physiological effect Simon C.H.
Barry Boyes 1,2, Shujuan Tao 2, and Ron Orlando 2
 Barry Boyes 1,2, Shujuan Tao 2, and Ron Orlando 2 1 Advanced Materials Technology, Inc. Wilmington, DE USA 2 Complex Carbohydrate Research Center University of Georgia, Athens, GA USA bboyes@advanced-materials-tech.com
XPS surface analysis of human tooth samples with EnviroESCA
 Application Note #000396 KeyWords XPS, Human Tissue, Tooth, Measurements, Surface Analysis XPS surface analysis of human tooth samples with EnviroESCA Human teeth from an adult and a baby were studied