Quantitative Literacy: Thinking Between the Lines
|
|
|
- Patience Hunter
- 6 years ago
- Views:
Transcription
1 Quantitative Literacy: Thinking Between the Lines Crauder, Noell, Evans, Johnson Chapter 6: Statistics 2013 W. H. Freeman and Company 1
2 Chapter 6: Statistics Lesson Plan Data summary and presentation: Boiling down the numbers The normal distribution: Why the bell curve? The statistics of polling: Can we believe the polls? Statistical inference and clinical trials: Effective drugs? 2
3 Learning Objectives: Understand why the normal distribution is so important. The bell-shaped curve Mean and standard deviation for the normal distribution z-scores with Percentile scores The Central Limit Theorem Significance of apparently small deviations 3

4 The bell-shaped curve: Figure 6.13 shows the distribution of heights of adult males in the United States. A graph shaped like this one resembles a bell thus the bell curve. This bell-shaped graph is typical of normally distributed data. The mean and median are the same: For normally distributed data, the mean and median are the same. Figure 6.13 indicates that the median height of adult males is 69.1 inches. The average height of adult males is 69.1 inches. 4

5 Most data are clustered about the mean: The vast majority of adult males are within a few inches of the mean. 5
6 The bell curve is symmetric about the mean: The curve to the left of the mean is a mirror image of the curve to the right of the mean. In terms of heights, there are about the same number of men 2 inches taller than the mean as there are men 2 inches shorter than the mean. This is illustrated in Figure If data are normally distributed: 1. Their graph is a bell-shaped curve. 2. The mean and median are the same. 3. Most of the data tend to be clustered relatively near the mean. 4. The data are symmetrically distributed above and below the mean. 6

7 Example: Figure 6.17 shows the distribution of IQ scores, and Figure 6.18 shows the percentage of American families and level of income. Which of these data sets appear to be normally distributed, and why? 7
8 Solution: The IQ scores appear to be normally distributed because they are symmetric about the median score of 100, and most of the data relatively close to this value. Family incomes do not appear to be normally distributed because they are not symmetric. They are skewed toward the lower end of the scale, meaning there are many more families with low incomes than with high incomes. 8

9 Mean and standard deviation for the normal distribution: A normal distribution, the mean and standard deviation completely determine the bell shape for the graph of the data. The mean determines the middle of the bell curve. The standard deviation determines how steep the curve is. A large standard deviation results in a very wide bell, and small standard deviation results in a thin, steep bell. 9
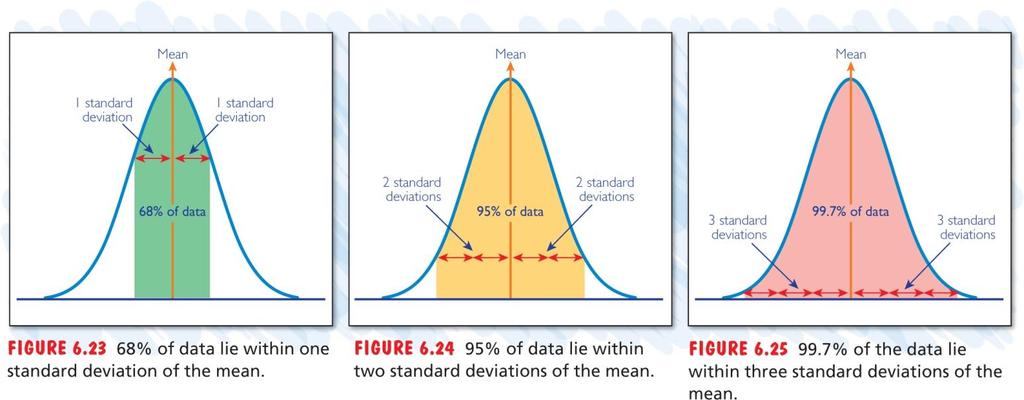
10 Normal Data: % Rule If a set of data is normally distributed: About 68% of the data lie within one standard deviation of the mean (34% within one standard deviation above the mean and 34% within one standard deviation below the mean). See Figure About 95% of the data lie within two standard deviations of the mean (47.5% within two standard deviations above the mean and 47.5% within two standard deviations below the mean). See Figure About 99.7% of the data lie within three standard deviations of the mean (49.85% within three standard deviations above the mean and 49.85% within three standard deviations below the mean). See Figure
11 11
12 Example: We noted earlier that adult male heights in the United States are normally distributed, with a mean of 69.1 inches. The standard deviation is 2.65 inches. What dose the % rule tell us about the heights of adult males? Solution: 68% of adult males are between = inches (5 feet 6.45 inches) and = inches (5 feet inches) tall 95% are between 69.1 (2 2.65) = 63.8 inches and (2 2.65) = 74.4 inches tall 99.7% are between 69.1 (3 2.65) = inches and (3 2.65) = inches tall 12

13 Example: The weights of apples in the fall harvest are normally distributed, with a mean weight of 200 grams and standard deviation of 12 grams. Figure 6.28 shows the weight distribution of 2000 apples. In a supply of 2000 apples, how many will weigh between 176 and 224 grams? 13
14 Solution: Apples weighing 176 grams are = 24 grams below the mean, and apples weighing 224 grams are = 24 grams above the mean. Now 24 grams represents 24/12 = 2 standard deviations. So the weight range of 176 grams to 224 grams is within two standard deviations of the mean. Therefore, about 95% of data points will lie in this range. This means that about 95% of 2000, or 1900 apples, weigh between 176 and 224 grams. 14
15 In a normal distribution, the z-score or standard score for a data point is the number of standard deviations that point lies above or below the mean. For data points above the mean the z-score is positive, and for data points below the mean the z-score is negative. z score = ( Data point Mean)/Standard deviation Data point = Mean + z score Standard deviation 15
16 Example: The weights of newborns in the United States are approximately normally distributed. The mean birthweight (for single births) is about 3332 grams (7 pounds, 5 ounces). The standard deviation is about 530 grams. Calculate the z-score for a newborn weighing 3700 grams (about 8 pounds, 2 ounces). Solution: A 3700-gram newborn is = 368 grams above the mean weight of 3332 grams. We divide by the number of grams in one standard deviation to find the z-score: z score for 3700 grams = =
17 17
18 The percentile for a number relative to a list of data is the percentage of data points that are less than or equal to that number. Example: The average length of illness for flu patients in a season is normally distributed, with a mean of 8 days and standard deviation of 0.9 day. What percentage of flu patients will be ill for more than 10 days? Solution: Ten days is 2 days above the mean of 8 days. This gives a z-score of 2/0.9 or about 2.2. Table 6.2 gives a percentile of about 98.6% for this z-score. It means that about 98.6% of patients will recover in 10 days or less. Thus, only about 100% 98.6% = 1.4% will be ill for more than 10 days. 18
19 Example: Recall from the previous Example that the weights of newborns in the United States are approximately normally distributed. The mean birthweight (for single births) is about 3332 grams (7 pounds, 5 ounces). The standard deviation is about 530 grams. 1. What percentage of newborns weigh more than 8 pounds ( grams)? 2. Low birthweight is a medical concern. The American Medical Association defines low birthweight to be 2500 grams (5 pounds, 8 ounces) or less. What percentage of newborns are classified as low-birthweight babies? 19
20 Solution: 1. z score = mean = standard deviation 530 = = 0.6 Consulting Table 6.2, we find that this represents a percentile of about 72.6%. This means that about 72.6% of newborns weigh 8 pounds or less. So, 100% 72.6% = 27.4% of newborns weigh more than 8 pounds. 2. z score = 2500 mean = standard deviation 530 = = 1.6 Table 6.2 shows a percentile of about 5.5% for a z-score of 1.6. Hence, about 5.5% of newborns are classified as low-birthweight babies. 20
21 The Central Limit Theorem According to the Central Limit Theorem, percentages obtained by taking many samples of the same size from a population are approximately normally distributed. The mean p% of the normal distribution is the mean of the whole population. If the sample size is n, the standard deviation of the normal distribution is: Standard deviation = σ = p(100 p) n percentage points Here, p is a percentage, not a decimal. 21
22 Example: For a certain disease, 30% of untreated patients can be expected to improve within a week. We observe a population of 50 patients and record the percentage who improve within a week. According to the Central Limit Theorem, the results of such a study will be approximately normally distributed. 1. Find the mean and standard deviation for this normal distribution. 2. Find the percentage of test groups of 50 patients in which more than 40% improve within a week. 22
23 Solution: 1. p = 30%, n = 50. A standard deviation of σ = p(100 p) n = 30(100 30) 50 = 6.5 percentage points 2. The z-score for 40%: 40 mean z score = = standard deviation 6.5 Table 6.2 gives a percentile of about 93.3%. = = 1.5 This means that in 93.3% of test groups, we expect that 40% or fewer will improve within a week. Only 100% 93.3% = 6.7% of test groups will show more than 40% improving within a week. 23
24 Example: Assume we know that 20% of Americans suffer from a certain type of allergy. Suppose we take a random sample of 100,000 Americans and record the percentage who suffer from this allergy. 1. The Central Limit Theorem says that percentages from such surveys will be normally distributed. What is the mean of this distribution? 2. What is the standard deviation of the normal distribution in part 1? 3. Suppose we find that in a town of 100,000 people, 21% suffer from this allergy. Is this an unusual sample? What does the answer to such a question tell us about this town? 24
25 Solution: 1. The mean is p = 20%. 2. For a sample size of 100,000, σ = p(100 p) n = 20(100 20) 100,000 = 0.13 percentage point. 3. Our sample of 21% is one percentage point larger than the mean of 20%. 21 mean z score = = standard deviation 0.13 = = 7.7 This score is far larger than any z-score in Table 6.2. There is almost no chance that in a randomly chosen sample of this size, 21% will suffer from this allergy. Thus, this is a truly anomalous sample: This town is not representative of the total population of Americans. Its allergy rate is highly unusual. 25
26 : Chapter Summary Data summary and presentation: Boiling down Four important measures in descriptive statistics: mean, median, mode, and standard deviation The normal distribution: Why the bell curve? A plot of normally distributed data: the bell-shape curve. The z-score for a data point The Central Limit Theorem 26
27 : Chapter Summary The statistics of polling: Can we believe the polls? Polling involves: a margin of error, a confidence level, and a confidence interval. Statistical inference and clinical trials: Effective drugs? Statistical significance and p-values. Positive correlated, negative correlated, uncorrelated or linearly correlated 27
AP Statistics TOPIC A - Unit 2 MULTIPLE CHOICE
 AP Statistics TOPIC A - Unit 2 MULTIPLE CHOICE Name Date 1) True or False: In a normal distribution, the mean, median and mode all have the same value and the graph of the distribution is symmetric. 2)
THE DIVERSITY OF SAMPLES FROM THE SAME POPULATION
 CHAPTER 19 THE DIVERSITY OF SAMPLES FROM THE SAME POPULATION Narrative: Bananas Suppose a researcher asks the question: What is the average weight of bananas selected for purchase by customers in grocery
Chapter 2: The Normal Distributions
 Chapter 2: The Normal Distributions Use the following to answer questions 1-3: 1. For this density curve, which of the following is true? a) It is symmetric. c) The median is 1. b) The total area under
Chapter 2--Norms and Basic Statistics for Testing
 Chapter 2--Norms and Basic Statistics for Testing Student: 1. Statistical procedures that summarize and describe a series of observations are called A. inferential statistics. B. descriptive statistics.
Unit 2: Probability and distributions Lecture 3: Normal distribution
 Unit 2: Probability and distributions Lecture 3: Normal distribution Statistics 101 Thomas Leininger May 23, 2013 Announcements 1 Announcements 2 Normal distribution Normal distribution model 68-95-99.7
AP Psych - Stat 1 Name Period Date. MULTIPLE CHOICE. Choose the one alternative that best completes the statement or answers the question.
 AP Psych - Stat 1 Name Period Date MULTIPLE CHOICE. Choose the one alternative that best completes the statement or answers the question. 1) In a set of incomes in which most people are in the $15,000
c. Construct a boxplot for the data. Write a one sentence interpretation of your graph.
 STAT 280 Sample Test Problems Page 1 of 1 1. An English survey of 3000 medical records showed that smokers are more inclined to get depressed than non-smokers. Does this imply that smoking causes depression?
Chapter 8 Estimating with Confidence
 Chapter 8 Estimating with Confidence Introduction Our goal in many statistical settings is to use a sample statistic to estimate a population parameter. In Chapter 4, we learned if we randomly select the
Psychologist use statistics for 2 things
 Psychologist use statistics for 2 things O Summarize the information from the study/experiment O Measures of central tendency O Mean O Median O Mode O Make judgements and decisions about the data O See
Medical Statistics 1. Basic Concepts Farhad Pishgar. Defining the data. Alive after 6 months?
 Medical Statistics 1 Basic Concepts Farhad Pishgar Defining the data Population and samples Except when a full census is taken, we collect data on a sample from a much larger group called the population.
CCM6+7+ Unit 12 Data Collection and Analysis
 Page 1 CCM6+7+ Unit 12 Packet: Statistics and Data Analysis CCM6+7+ Unit 12 Data Collection and Analysis Big Ideas Page(s) What is data/statistics? 2-4 Measures of Reliability and Variability: Sampling,
4) Compare the scores: a score of 88 on a test with a mean of 79 and a score of 78 on a test with a mean of 70.
 Compare the scores: a score of 88 on a test with a mean of 79 and a score of 78 on a test with a mean of 70.") Problem Set 3 Name MULTIPLE CHOICE. Please show all your work in the space provided or on scratch paper. Problems on scratch paper must be numbered and written legibly. Choose the one alternative that
Problem Set 3 Name MULTIPLE CHOICE. Please show all your work in the space provided or on scratch paper. Problems on scratch paper must be numbered and written legibly. Choose the one alternative that
CHAPTER 3 Describing Relationships
 CHAPTER 3 Describing Relationships 3.1 Scatterplots and Correlation The Practice of Statistics, 5th Edition Starnes, Tabor, Yates, Moore Bedford Freeman Worth Publishers Reading Quiz 3.1 True/False 1.
Statistics for Psychology
 Statistics for Psychology SIXTH EDITION CHAPTER 3 Some Key Ingredients for Inferential Statistics Some Key Ingredients for Inferential Statistics Psychologists conduct research to test a theoretical principle
STT 200 Test 1 Green Give your answer in the scantron provided. Each question is worth 2 points.
 STT 200 Test 1 Green Give your answer in the scantron provided. Each question is worth 2 points. For Questions 1 & 2: It is known that the distribution of starting salaries for MSU Education majors has
Chapter 8: Estimating with Confidence
 Chapter 8: Estimating with Confidence Section 8.1 The Practice of Statistics, 4 th edition For AP* STARNES, YATES, MOORE Introduction Our goal in many statistical settings is to use a sample statistic
2.75: 84% 2.5: 80% 2.25: 78% 2: 74% 1.75: 70% 1.5: 66% 1.25: 64% 1.0: 60% 0.5: 50% 0.25: 25% 0: 0%
 Capstone Test (will consist of FOUR quizzes and the FINAL test grade will be an average of the four quizzes). Capstone #1: Review of Chapters 1-3 Capstone #2: Review of Chapter 4 Capstone #3: Review of
CHAPTER 8 Estimating with Confidence
 CHAPTER 8 Estimating with Confidence 8.1b Confidence Intervals: The Basics The Practice of Statistics, 5th Edition Starnes, Tabor, Yates, Moore Bedford Freeman Worth Publishers Confidence Intervals: The
UF#Stats#Club#STA#2023#Exam#1#Review#Packet# #Fall#2013#
 UF#Stats#Club#STA##Exam##Review#Packet# #Fall## The following data consists of the scores the Gators basketball team scored during the 8 games played in the - season. 84 74 66 58 79 8 7 64 8 6 78 79 77
Standard Deviation and Standard Error Tutorial. This is significantly important. Get your AP Equations and Formulas sheet
 Standard Deviation and Standard Error Tutorial This is significantly important. Get your AP Equations and Formulas sheet The Basics Let s start with a review of the basics of statistics. Mean: What most
Midterm Exam MMI 409 Spring 2009 Gordon Bleil
 Midterm Exam MMI 409 Spring 2009 Gordon Bleil Table of contents: (Hyperlinked to problem sections) Problem 1 Hypothesis Tests Results Inferences Problem 2 Hypothesis Tests Results Inferences Problem 3
Chapter 2 Norms and Basic Statistics for Testing MULTIPLE CHOICE
 Chapter 2 Norms and Basic Statistics for Testing MULTIPLE CHOICE 1. When you assert that it is improbable that the mean intelligence test score of a particular group is 100, you are using. a. descriptive
Chapter 7: Descriptive Statistics
 Chapter Overview Chapter 7 provides an introduction to basic strategies for describing groups statistically. Statistical concepts around normal distributions are discussed. The statistical procedures of
Applied Statistical Analysis EDUC 6050 Week 4
 Applied Statistical Analysis EDUC 6050 Week 4 Finding clarity using data Today 1. Hypothesis Testing with Z Scores (continued) 2. Chapters 6 and 7 in Book 2 Review! = $ & '! = $ & ' * ) 1. Which formula
Unit 1 Exploring and Understanding Data
 Unit 1 Exploring and Understanding Data Area Principle Bar Chart Boxplot Conditional Distribution Dotplot Empirical Rule Five Number Summary Frequency Distribution Frequency Polygon Histogram Interquartile
Normal Distribution. Many variables are nearly normal, but none are exactly normal Not perfect, but still useful for a variety of problems.
 Review Probability: likelihood of an event Each possible outcome can be assigned a probability If we plotted the probabilities they would follow some type a distribution Modeling the distribution is important
AP Statistics Practice Test Ch. 3 and Previous
 AP Statistics Practice Test Ch. 3 and Previous Name Date Use the following to answer questions 1 and 2: A researcher measures the height (in feet) and volume of usable lumber (in cubic feet) of 32 cherry
Practice First Midterm Exam
 Practice First Midterm Exam Statistics 200 (Pfenning) This is a closed book exam worth 150 points. You are allowed to use a calculator and a two-sided sheet of notes. There are 9 problems, with point values
Chapter 1: Exploring Data
 Chapter 1: Exploring Data Key Vocabulary:! individual! variable! frequency table! relative frequency table! distribution! pie chart! bar graph! two-way table! marginal distributions! conditional distributions!
The normal curve and standardisation. Percentiles, z-scores
 The normal curve and standardisation Percentiles, z-scores The normal curve Frequencies (histogram) Characterised by: Central tendency Mean Median Mode uni, bi, multi Positively skewed, negatively skewed
A point estimate is a single value that has been calculated from sample data to estimate the unknown population parameter. s Sample Standard Deviation
 7.1 Margins of Error and Estimates What is estimation? A point estimate is a single value that has been calculated from sample data to estimate the unknown population parameter. Population Parameter Sample
Stats 95. Statistical analysis without compelling presentation is annoying at best and catastrophic at worst. From raw numbers to meaningful pictures
 Stats 95 Statistical analysis without compelling presentation is annoying at best and catastrophic at worst. From raw numbers to meaningful pictures Stats 95 Why Stats? 200 countries over 200 years http://www.youtube.com/watch?v=jbksrlysojo
Normal Distribution Foldable
 Normal Distribution Foldable Thank you for buying my game! Foresta Math Please stop back to my store and let me know how the game went. http://www.teacherspayteachers.com/store/foresta- Math Facebook:
Chapter 23. Inference About Means. Copyright 2010 Pearson Education, Inc.
 Chapter 23 Inference About Means Copyright 2010 Pearson Education, Inc. Getting Started Now that we know how to create confidence intervals and test hypotheses about proportions, it d be nice to be able
Making Inferences from Experiments
 11.6 Making Inferences from Experiments Essential Question How can you test a hypothesis about an experiment? Resampling Data Yield (kilograms) Control Group Treatment Group 1. 1.1 1.2 1. 1.5 1.4.9 1.2
Module 28 - Estimating a Population Mean (1 of 3)
") Module 28 - Estimating a Population Mean (1 of 3) In "Estimating a Population Mean," we focus on how to use a sample mean to estimate a population mean. This is the type of thinking we did in Modules 7
Module 28 - Estimating a Population Mean (1 of 3) In "Estimating a Population Mean," we focus on how to use a sample mean to estimate a population mean. This is the type of thinking we did in Modules 7
CP Statistics Sem 1 Final Exam Review
 Name: _ Period: ID: A CP Statistics Sem 1 Final Exam Review Multiple Choice Identify the choice that best completes the statement or answers the question. 1. A particularly common question in the study
A point estimate is a single value that has been calculated from sample data to estimate the unknown population parameter. s Sample Standard Deviation
 7.1 Margins of Error and Estimates What is estimation? A point estimate is a single value that has been calculated from sample data to estimate the unknown population parameter. Population Parameter Sample
STATISTICS AND RESEARCH DESIGN
 Statistics 1 STATISTICS AND RESEARCH DESIGN These are subjects that are frequently confused. Both subjects often evoke student anxiety and avoidance. To further complicate matters, both areas appear have
(a) 50% of the shows have a rating greater than: impossible to tell
 50% of the shows have a rating greater than: impossible to tell") q 1. Here is a histogram of the Distribution of grades on a quiz. How many students took the quiz? What percentage of students scored below a 60 on the quiz? (Assume left-hand endpoints are included in
q 1. Here is a histogram of the Distribution of grades on a quiz. How many students took the quiz? What percentage of students scored below a 60 on the quiz? (Assume left-hand endpoints are included in
UNIVERSITY OF TORONTO SCARBOROUGH Department of Computer and Mathematical Sciences Midterm Test February 2016
 UNIVERSITY OF TORONTO SCARBOROUGH Department of Computer and Mathematical Sciences Midterm Test February 2016 STAB22H3 Statistics I, LEC 01 and LEC 02 Duration: 1 hour and 45 minutes Last Name: First Name:
Test 1 Version A STAT 3090 Spring 2018
 Multiple Choice: (Questions 1 20) Answer the following questions on the scantron provided using a #2 pencil. Bubble the response that best answers the question. Each multiple choice correct response is
9. Interpret a Confidence level: "To say that we are 95% confident is shorthand for..
 Mrs. Daniel AP Stats Chapter 8 Guided Reading 8.1 Confidence Intervals: The Basics 1. A point estimator is a statistic that 2. The value of the point estimator statistic is called a and it is our "best
WDHS Curriculum Map Probability and Statistics. What is Statistics and how does it relate to you?
 WDHS Curriculum Map Probability and Statistics Time Interval/ Unit 1: Introduction to Statistics 1.1-1.3 2 weeks S-IC-1: Understand statistics as a process for making inferences about population parameters
3.2 Least- Squares Regression
 3.2 Least- Squares Regression Linear (straight- line) relationships between two quantitative variables are pretty common and easy to understand. Correlation measures the direction and strength of these
Eating Behaviors. Maintaining a Healthy Weight
 CHAPTER 11 Managing Weight and Eating Behaviors LESSON 1 Maintaining a Healthy Weight Before You Read Write down some steps that you can take to manage your weight in a healthful way. BIG Idea Maintaining
CHAPTER 3 DATA ANALYSIS: DESCRIBING DATA
 Data Analysis: Describing Data CHAPTER 3 DATA ANALYSIS: DESCRIBING DATA In the analysis process, the researcher tries to evaluate the data collected both from written documents and from other sources such
Statistics Spring Study Guide
 Name: Statistics Spring Study Guide NORMAL AND SAMPLING DISTRIBUTIONS CHAPTER SIX As opposed to the discrete distributions in the previous chapter, the normal distribution is a continuous distribution,
How Faithful is the Old Faithful? The Practice of Statistics, 5 th Edition 1
 How Faithful is the Old Faithful? The Practice of Statistics, 5 th Edition 1 Who Has Been Eating My Cookies????????? Someone has been steeling the cookie I bought for your class A teacher from the highschool
1.4 - Linear Regression and MS Excel
 1.4 - Linear Regression and MS Excel Regression is an analytic technique for determining the relationship between a dependent variable and an independent variable. When the two variables have a linear
Math 124: Module 2, Part II
 , Part II David Meredith Department of Mathematics San Francisco State University September 15, 2009 What we will do today 1 Explanatory and Response Variables When you study the relationship between two
(a) 50% of the shows have a rating greater than: impossible to tell
 50% of the shows have a rating greater than: impossible to tell") KEY 1. Here is a histogram of the Distribution of grades on a quiz. How many students took the quiz? 15 What percentage of students scored below a 60 on the quiz? (Assume left-hand endpoints are included
KEY 1. Here is a histogram of the Distribution of grades on a quiz. How many students took the quiz? 15 What percentage of students scored below a 60 on the quiz? (Assume left-hand endpoints are included
AP Psych - Stat 2 Name Period Date. MULTIPLE CHOICE. Choose the one alternative that best completes the statement or answers the question.
 AP Psych - Stat 2 Name Period Date MULTIPLE CHOICE. Choose the one alternative that best completes the statement or answers the question. 1) In a set of incomes in which most people are in the $15,000
I will investigate the difference between male athlete and female athlete BMI, for athletes who belong to the Australian Institute of Sport.
 AS 91582 - Statistical Inference: Merit example (Body Mass Index). INTRODUCTION Body Mass Index is an estimator how the amount of body fat a person has (LiveScience, 2014). It is calculated by taking a
Previously, when making inferences about the population mean,, we were assuming the following simple conditions:
 Chapter 17 Inference about a Population Mean Conditions for inference Previously, when making inferences about the population mean,, we were assuming the following simple conditions: (1) Our data (observations)
Normal Distribution: Homework *
 OpenStax-CNX module: m16978 1 Normal Distribution: Homework * Susan Dean Barbara Illowsky, Ph.D. This work is produced by OpenStax-CNX and licensed under the Creative Commons Attribution License 2.0 Exercise
MULTIPLE CHOICE. Choose the one alternative that best completes the statement or answers the question.
 Statistics Final Review Semeter I Name MULTIPLE CHOICE. Choose the one alternative that best completes the statement or answers the question. Provide an appropriate response. 1) The Centers for Disease
Regression. Lelys Bravo de Guenni. April 24th, 2015
 Regression Lelys Bravo de Guenni April 24th, 2015 Outline Regression Simple Linear Regression Prediction of an individual value Estimate Percentile Ranks Regression Simple Linear Regression The idea behind
People have used random sampling for a long time
 Sampling People have used random sampling for a long time Sampling by lots is mentioned in the Bible. People recognised that it is a way to select fairly if every individual has an equal chance of being
Theory. = an explanation using an integrated set of principles that organizes observations and predicts behaviors or events.
 Definition Slides Hindsight Bias = the tendency to believe, after learning an outcome, that one would have foreseen it. Also known as the I knew it all along phenomenon. Critical Thinking = thinking that
Team: Seat #: Name: Statistics Team Quiz 1 Explain each answer in one or more complete sentences.
 Team: Seat #: Name: Statistics Team Quiz 1 Explain each answer in one or more complete sentences. 1. What level of measurement is age? ratio 2. Fill in the blanks with the appropriate symbols: = 28% of
Chapter Three in-class Exercises. MULTIPLE CHOICE. Choose the one alternative that best completes the statement or answers the question.
 Name Chapter Three in-class Exercises MULTIPLE CHOICE. Choose the one alternative that best completes the statement or answers the question. 1) The table below lists the populations, in thousands, of several
Population. Sample. AP Statistics Notes for Chapter 1 Section 1.0 Making Sense of Data. Statistics: Data Analysis:
 Section 1.0 Making Sense of Data Statistics: Data Analysis: Individuals objects described by a set of data Variable any characteristic of an individual Categorical Variable places an individual into one
Part III Taking Chances for Fun and Profit
 Part III Taking Chances for Fun and Profit Chapter 8 Are Your Curves Normal? Probability and Why it Counts What You Will Learn in Chapter 8 How probability relates to statistics Characteristics of the
Statistics: Interpreting Data and Making Predictions. Interpreting Data 1/50
 Statistics: Interpreting Data and Making Predictions Interpreting Data 1/50 Last Time Last time we discussed central tendency; that is, notions of the middle of data. More specifically we discussed the
Averages and Variation
 Chapter 3 Averages and Variation Name Section 3.1 Measures of Central Tendency: Mode, Median, and Mean Objective: In this lesson you learned how to compute, interpret, and explain mean, median, and mode.
Statistical Methods Exam I Review
 Statistical Methods Exam I Review Professor: Dr. Kathleen Suchora SI Leader: Camila M. DISCLAIMER: I have created this review sheet to supplement your studies for your first exam. I am a student here at
Math 1680 Class Notes. Chapters: 1, 2, 3, 4, 5, 6
 Math 1680 Class Notes Chapters: 1, 2, 3, 4, 5, 6 Chapter 1. Controlled Experiments Salk vaccine field trial: a randomized controlled double-blind design 1. Suppose they gave the vaccine to everybody, and
t-test Tutorial Aliza McConnahey & Josh Petkash
 t-test Tutorial Aliza McConnahey & Josh Petkash t-testing? A t-test is used to test against the mean of a population when the population standard deviation is not known. In order to conduct a t-test, a
Lesson 9 Presentation and Display of Quantitative Data
 Lesson 9 Presentation and Display of Quantitative Data Learning Objectives All students will identify and present data using appropriate graphs, charts and tables. All students should be able to justify
AP Stats Review for Midterm
 AP Stats Review for Midterm NAME: Format: 10% of final grade. There will be 20 multiple-choice questions and 3 free response questions. The multiple-choice questions will be worth 2 points each and the
Statistics: Making Sense of the Numbers
 Statistics: Making Sense of the Numbers Chapter 9 This multimedia product and its contents are protected under copyright law. The following are prohibited by law: any public performance or display, including
STOR 155 Section 2 Midterm Exam 1 (9/29/09)
") STOR 155 Section 2 Midterm Exam 1 (9/29/09) Name: PID: Instructions: Both the exam and the bubble sheet will be collected. On the bubble sheet, print your name and ID number, sign the honor pledge, also
STOR 155 Section 2 Midterm Exam 1 (9/29/09) Name: PID: Instructions: Both the exam and the bubble sheet will be collected. On the bubble sheet, print your name and ID number, sign the honor pledge, also
MATH 227 CP 8 SHORT ANSWER. Write the word or phrase that best completes each statement or answers the question.
 MATH 227 CP 8 SHORT ANSWER. Write the word or phrase that best completes each statement or answers the question. Find the indicated critical z value. 1) Find z /2 for = 0.07. 1) 2) Find the value of z
STATISTICS 8 CHAPTERS 1 TO 6, SAMPLE MULTIPLE CHOICE QUESTIONS
 STATISTICS 8 CHAPTERS 1 TO 6, SAMPLE MULTIPLE CHOICE QUESTIONS Circle the best answer. This scenario applies to Questions 1 and 2: A study was done to compare the lung capacity of coal miners to the lung
MULTIPLE CHOICE. Choose the one alternative that best completes the statement or answers the question.
 Exam Name MULTIPLE CHOICE. Choose the one alternative that best completes the statement or answers the 1) Which of the following is the properly rounded mean for the given data? 7, 8, 13, 9, 10, 11 A)
Ch. 1 Collecting and Displaying Data
 Ch. 1 Collecting and Displaying Data In the first two sections of this chapter you will learn about sampling techniques and the different levels of measurement for a variable. It is important that you
Section 3.2 Least-Squares Regression
 Section 3.2 Least-Squares Regression Linear relationships between two quantitative variables are pretty common and easy to understand. Correlation measures the direction and strength of these relationships.
CHAPTER 8 Estimating with Confidence
 CHAPTER 8 Estimating with Confidence 8.1 Confidence Intervals: The Basics The Practice of Statistics, 5th Edition Starnes, Tabor, Yates, Moore Bedford Freeman Worth Publishers Confidence Intervals: The
Example The median earnings of the 28 male students is the average of the 14th and 15th, or 3+3
 Lecture 3 Nancy Pfenning Stats 1000 We learned last time how to construct a stemplot to display a single quantitative variable. A back-to-back stemplot is a useful display tool when we are interested in
Chapter 8: Estimating with Confidence
 Chapter 8: Estimating with Confidence Key Vocabulary: point estimator point estimate confidence interval margin of error interval confidence level random normal independent four step process level C confidence
V. Gathering and Exploring Data
 V. Gathering and Exploring Data With the language of probability in our vocabulary, we re now ready to talk about sampling and analyzing data. Data Analysis We can divide statistical methods into roughly
10/4/2007 MATH 171 Name: Dr. Lunsford Test Points Possible
 Pledge: 10/4/2007 MATH 171 Name: Dr. Lunsford Test 1 100 Points Possible I. Short Answer and Multiple Choice. (36 points total) 1. Circle all of the items below that are measures of center of a distribution:
Empirical Rule ( rule) applies ONLY to Normal Distribution (modeled by so called bell curve)
 applies ONLY to Normal Distribution (modeled by so called bell curve)") Chapter 2.5 Interpreting Standard Deviation Chebyshev Theorem Empirical Rule Chebyshev Theorem says that for ANY shape of data distribution at least 3/4 of all data fall no farther from the mean than 2
Chapter 2.5 Interpreting Standard Deviation Chebyshev Theorem Empirical Rule Chebyshev Theorem says that for ANY shape of data distribution at least 3/4 of all data fall no farther from the mean than 2
Chapter 1: Introduction to Statistics
 Chapter 1: Introduction to Statistics Variables A variable is a characteristic or condition that can change or take on different values. Most research begins with a general question about the relationship
10.1 Estimating with Confidence. Chapter 10 Introduction to Inference
 10.1 Estimating with Confidence Chapter 10 Introduction to Inference Statistical Inference Statistical inference provides methods for drawing conclusions about a population from sample data. Two most common
1. Bring your completed exam to class on Monday November 10, 2014, being sure that you have made a copy for safe keeping; OR
 PubHlth 540 Fall 2014 Exam III Choice B (Unit 5 Normal) corrected 10-28-14 Page 1 of 7 PubHlth 540 - Introductory Biostatistics Fall 2014 Examination III Choice B Unit 5 (Normal) Due Monday November 10,
Lesson 1: Distributions and Their Shapes
 Lesson 1 Name Date Lesson 1: Distributions and Their Shapes 1. Sam said that a typical flight delay for the sixty BigAir flights was approximately one hour. Do you agree? Why or why not? 2. Sam said that
On the purpose of testing:
 Why Evaluation & Assessment is Important Feedback to students Feedback to teachers Information to parents Information for selection and certification Information for accountability Incentives to increase
Basic Statistical Concepts, Research Design, & Notation
 , Research Design, & Notation Variables, Scores, & Data A variable is a characteristic or condition that can change or take on different values. Most research begins with a general question about the relationship
Normal Random Variables
 Normal Random Variables The distribution associated with Normal random variable is called Normal distribution. Carl Friedrich Gauss analyzed astronomical data using Normal distribution and defined the
Chapter 15: Continuation of probability rules
 Chapter 15: Continuation of probability rules Example: HIV-infected women attending either an infectious disease clinic in Bangkok were screened for high-risk HPV and received a Pap test; those with abnormal
Still important ideas
 Readings: OpenStax - Chapters 1 11 + 13 & Appendix D & E (online) Plous - Chapters 2, 3, and 4 Chapter 2: Cognitive Dissonance, Chapter 3: Memory and Hindsight Bias, Chapter 4: Context Dependence Still
Chapter 4: Causation: Can We Say What Caused the Effect? Sections 4.1 & 4.2: Association and Confounding / Observations v.s.
 Stat 300: Intro to Probability & Statistics Textbook: Introduction to Statistical Investigations Name: American River College Chapter 4: Causation: Can We Say What Caused the Effect? Sections 4.1 & 4.2:
Appendix B Statistical Methods
 Appendix B Statistical Methods Figure B. Graphing data. (a) The raw data are tallied into a frequency distribution. (b) The same data are portrayed in a bar graph called a histogram. (c) A frequency polygon
Biostatistics for Med Students. Lecture 1
 Biostatistics for Med Students Lecture 1 John J. Chen, Ph.D. Professor & Director of Biostatistics Core UH JABSOM JABSOM MD7 February 14, 2018 Lecture note: http://biostat.jabsom.hawaii.edu/education/training.html
1. Find the appropriate value for constructing a confidence interval in each of the following settings:
 AP Statistics Unit 06 HW #4 Review Name Period 1. Find the appropriate value for constructing a confidence interval in each of the following settings: a. Estimating a population proportion p at a 94% confidence
STA Module 1 The Nature of Statistics. Rev.F07 1
 STA 2023 Module 1 The Nature of Statistics Rev.F07 1 Learning Objectives 1. Classify a statistical study as either descriptive or inferential. 2. Identify the population and the sample in an inferential
STA Rev. F Module 1 The Nature of Statistics. Learning Objectives. Learning Objectives (cont.
 STA 2023 Module 1 The Nature of Statistics Rev.F07 1 Learning Objectives 1. Classify a statistical study as either descriptive or inferential. 2. Identify the population and the sample in an inferential
Chapter 1 Where Do Data Come From?
 Chapter 1 Where Do Data Come From? Understanding Data: The purpose of this class; to be able to read the newspaper and know what the heck they re talking about! To be able to go to the casino and know