RNA-seq. Differential analysis
|
|
|
- Toby Bradford
- 5 years ago
- Views:
Transcription
1 RNA-seq Differential analysis
2 Data transformations
3 Count data transformations In order to test for differential expression, we operate on raw counts and use discrete distributions differential expression. For other downstream analyses e.g. for visualization or clustering it might be useful to work with transformed versions of the count data. The most obvious choice of transformation is the logarithm. Since count values for a gene can be zero in some conditions, some advocate the use of pseudocounts, i.e. transformations of the form: yy = log 2 nn + nn 0 where nn represents the count values and nn 0 is a positive constant.
4 normtransform(), log 2 nn + 1
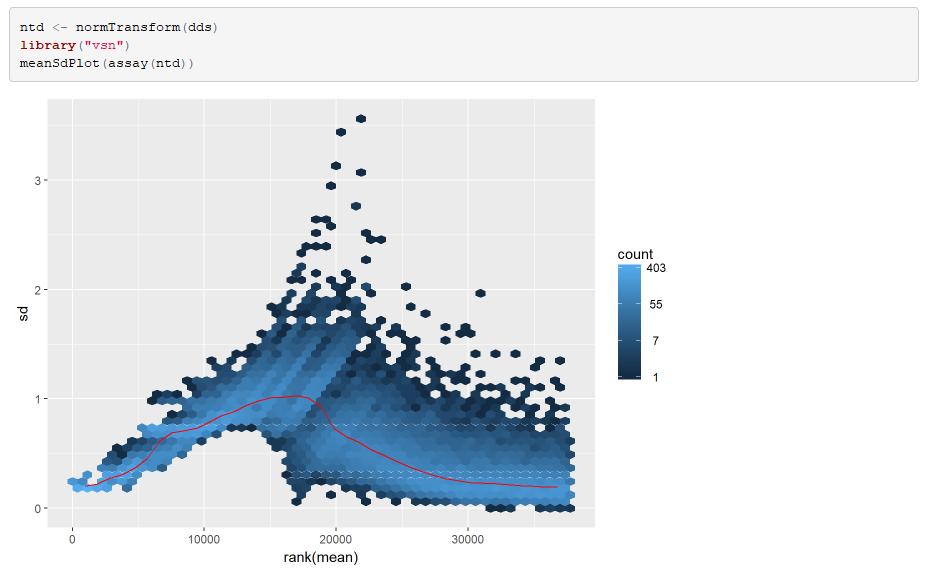
5 rlog and vst We discuss two alternative approaches that offer more theoretical justification and a rational way of choosing the parameter equivalent to nn 0. The regularized logarithm or rlog incorporates a prior on the sample differences (Love, Huber, and Anders 2014), and the other uses the concept of variance stabilizing transformations (VST) (Tibshirani 1988; Huber et al. 2003; Anders and Huber 2010). Both transformations produce transformed data on the log2 scale which has been normalized with respect to library size.
6 rlog and vst The point of these two transformations is to remove the dependence of the variance on the mean, particularly the high variance of the logarithm of count data when the mean is low. Both rlog and VST use the experiment-wide trend of variance over mean, in order to transform the data to remove the experiment-wide trend. Note that we do not require or desire that all the genes have exactly the same variance after transformation. Indeed, you will see that after the transformations the genes with the same mean do not have exactly the same standard deviations, but that the experiment-wide trend has flattened. It is those genes with variance above the trend which will allow us to cluster samples into interesting groups.
7 Blind dispersion estimation The two functions, rlog and vst have an argument blind, for whether the transformation should be blind to the sample information specified by the design formula. When blind equals TRUE (the default), the functions will reestimate the dispersions using only an intercept. This setting should be used in order to compare samples in a manner wholly unbiased by the information about experimental groups, for example to perform sample QA (quality assurance).
8 Blind dispersion estimation However, blind dispersion estimation is not the appropriate choice if one expects that many or the majority of genes will have large differences in counts which are explainable by the experimental design, and one wishes to transform the data for downstream analysis. In this case, using blind dispersion estimation will lead to large estimates of dispersion, as it attributes differences due to experimental design as unwanted noise, and will result in overly shrinking the transformed values towards each other. By setting blind to FALSE, the dispersions already estimated will be used to perform transformations, or if not present, they will be estimated using the current design formula.
9 Extracting transformed values The assay function is used to extract the matrix of normalized values.
10 rlog The function rlog, stands for regularized log, transforming the original count data to the log2 scale by fitting a model with a term for each sample and a prior distribution on the coefficients which is estimated from the data. This is the same kind of shrinkage (sometimes referred to as regularization, or moderation) of log fold changes used by the DESeq and nbinomwaldtest. The resulting data contains elements defined as: log 2 qq iiii = ββ iii + ββ iijj
11 rlog qq iiii : a parameter proportional to the expected true concentrati on of fragments for gene ii and sample jj. ββ iii : an intercept which does not undergo shrinkage. ββ iiii : the sample-specific effect which is shrunk toward zero ba sed on the dispersion-mean trend over the entire dataset.
12 VST The closed-form expression for the variance stabilizing transformation is used by variancestabilizingtransformation.

13 Effects of transformations on the variance
14 Effects of transformations on the variance
15 Data visualization
16 Quality assessment Data quality assessment and quality control (i.e. the removal of insufficiently good data) are essential steps of any data analysis. These steps should typically be performed very early in the analysis of a new data set, preceding or in parallel to the differential expression testing. We define the term quality as fitness for purpose. Our purpose is the detection of differentially expressed genes, and we are looking in particular for samples whose experimental treatment suffered from an anormality that renders the data points obtained from these particular samples detrimental to our purpose.

17 Heatmap of the count matrix

18 Heatmap of the count matrix

19 Heatmap of the sample-to-sample distances

20 PCA plot of the samples
21 PCA plot of the samples
22 Design of experiments
23 Statistical design of experiments The process of planning the experiment so that appropriate data will be collected and analyzed by statistical methods, resulting in valid and objective conclusions.
24 Explanatory and response variables XX YY - Explanatory variables - Factors - Response variables
25 Factors - Noise factor - Blocking factor ZZ Treatment factor or design factor XX YY Response variables Levels: XX = xx Treatment combination or treatment: a particular combination of factor levels (e.g. xx 1, xx 2 if there are two treatment factors)
26 Three basic principles of experimental design Randomization Replication Blocking
27 Randomization By randomization we mean that both the assignment of treatments to units and the order in which the individual runs of the experiments are to be performed are randomly determined. A completely randomized design is an experimental design in which treatments are assigned to all units by randomization.
28 Replication By replication we mean an independent repeat run of each treatment combination.
29 Experimental units An entity receiving an independent application of a treatment is called an experimental unit. An experimental run is the process of applying a particular treatment combination to an experimental unit and recording its response. A replicate is an independent run carried out on a different experimental unit under the same conditions.
30 Example: Two pots Experimental unit: plant on the pot No replication
31 Example: Randomized Experimental unit: plant on the pot 4 replicates for each treatment
32 Blocking Blocking is an experimental design strategy used to reduce or eliminate the variability transmitted from nuisance factors, which may influence the response variable but in which we are not directly interested. Blocking is the grouping of experimental units that have similar properties. Within each block, treatments are randomly assigned to experimental units. The resulting design is called a randomized block design. This design enables more precise estimates of the treatment effects because comparisons between treatments are made among homogeneous experimental units in each block.
33 Blocking ZZ XX YY
34 Blocking example Blocking removes the variation in response among chambers, allowing more precise estimates and more powerful tests of the treatment effects.
35 Blinding The process of concealing information from participants and researchers about which of them receive which treatments is called blinding. Single-blind experiment: participants area unaware of the treatment they have been assigned. It prevents participants from responding differently according to their knowledge of their treatment. Double-blind experiment: researchers administering the treatments and measuring the response are also unaware of which subjects are receiving which treatment.
36 Factorial design Many experiments in biology investigate more than one treatment factor, because: 1. answering two questions from a single experiment rather than just one makes more efficient use of time, supplies, and other costs 2. the factors might interact.
37 Factorial design An experiment having a factorial design investigates all treatment combinations of two or more treatment factors. A factorial design can measure interactions between factors. An interaction between two (or more) explanatory variables means that the effect of one variable on the response depends on the state of the other variable.
38 Factorial design XX 2 XX 1 YY
39 A unified model: general linear model EE[yy] = ββ 0 + ββ 1 xx ββ pp 1 xx pp 1
40 Basic linear models Model formula Model Design yy~xx Linear regression Dose-response yy~t One-way ANOVA Completely randomized yy~t + b Two-way ANOVA Randomized block yy~t 1 + t 2 + t 1 t 2 Two-way, fixed-effect ANOVA Factorial design yy~tt + xx ANCOVA Observation study with one known noise factor yy~xx 1 + xx 2 + xx 1 xx 2 Multiple linear regression Dose-response xx: numerical, t: categorical treatment factor, b: categorical blocking factor

41 Randomized complete block design How does fish abundance affects the abundance and diversity of prey species?
42 Design 3mm 3mm 30 fish 90 fish Control Low High
43 Data: Zooplankton diversity in three fish abundance treatments Control Low High
44 Model: yy~t + b yy ii = ββ 0 + ββ 1 tt ii + ββ 2 b i + εε ii H0: Mean zooplankton diversity is the same in every abundance treatment yy~b H1: Mean zooplankton diversity is not the same in every abundance treatment yy~t + b
45 Fitting the model to data

46 Adjusting for a known confounding factor
47 Adjusting for a known confounding factor Mole rats are the only known mammals with distinct social castes. - A single queen and a small number of males are the only reproducing individuals in a colony. - Workers gather food, defend the colony, care for the young, and maintain the burrows. - Two worker castes in the Damaraland mole rat: - Frequent workers : do almost all of the work in the colony - Infrequent workers : do little work except on rare occasions after rains
48 Adjusting for a known confounding factor To assess the physiological differences between the two types of workers, researchers compared daily energy expenditures of wild mole rats during a dry season. Known noise factor: Energy expenditure appears to vary with body mass in both groups, but infrequent workers are heavier than frequent workers Research question: How different is mean daily energy expenditure between the two groups when adjusted for differences in body mass?
49 Data
50 Data
51 Model: yy~tt + xx H0: Castes do not differ in energy expenditure yy~xx H1: Castes differ in energy expenditure yy~tt + xx
52 Fitting the model to data
53 Multi-factor designs
54 Multiple factors Experiments with more than one factor influencing the counts can be analyzed using design formula that include the additional variables. In fact, DESeq2 can analyze any possible experimental design that can be expressed with fixed effects terms (multiple factors, designs with interactions, designs with continuous variables, splines, and so on are all possible). By adding variables to the design, one can control for additional variation in the counts. For example, if the condition samples are balanced across experimental batches, by including the batch factor to the design, one can increase the sensitivity for finding differences due to condition. There are multiple ways to analyze experiments when the additional variables are of interest and not just controlling factors.
55 Including type
56 Accounting for type We can account for the different types of sequencing, and get a clearer picture of the differences attributable to the treatment. As condition is the variable of interest, we put it at the end of the formula. Thus the results function will by default pull the condition results unless contrast or name arguments are specified. Then we can rerun DESeq.
57 Accounting for type
58 Accounting for type
59 Accounting for type
60 Accounting for type It is also possible to retrieve the log2 fold changes, p values and adjusted p values of the type variable. The contrast argument of the function results takes a character vector of length three: the name of the variable, the name of the factor level for the numerator of the log2 ratio, and the name of the factor level for the denominator.
61 Accounting for type
RNA-seq. Design of experiments
 RNA-seq Design of experiments Experimental design Introduction An experiment is a process or study that results in the collection of data. Statistical experiments are conducted in situations in which researchers
Lecture 21. RNA-seq: Advanced analysis
 Lecture 21 RNA-seq: Advanced analysis Experimental design Introduction An experiment is a process or study that results in the collection of data. Statistical experiments are conducted in situations in
Unit 1 Exploring and Understanding Data
 Unit 1 Exploring and Understanding Data Area Principle Bar Chart Boxplot Conditional Distribution Dotplot Empirical Rule Five Number Summary Frequency Distribution Frequency Polygon Histogram Interquartile
9 research designs likely for PSYC 2100
 9 research designs likely for PSYC 2100 1) 1 factor, 2 levels, 1 group (one group gets both treatment levels) related samples t-test (compare means of 2 levels only) 2) 1 factor, 2 levels, 2 groups (one
Ecological Statistics
 A Primer of Ecological Statistics Second Edition Nicholas J. Gotelli University of Vermont Aaron M. Ellison Harvard Forest Sinauer Associates, Inc. Publishers Sunderland, Massachusetts U.S.A. Brief Contents
2.75: 84% 2.5: 80% 2.25: 78% 2: 74% 1.75: 70% 1.5: 66% 1.25: 64% 1.0: 60% 0.5: 50% 0.25: 25% 0: 0%
 Capstone Test (will consist of FOUR quizzes and the FINAL test grade will be an average of the four quizzes). Capstone #1: Review of Chapters 1-3 Capstone #2: Review of Chapter 4 Capstone #3: Review of
Principles of Experimental Design
 Principles of Experimental Design Bret Hanlon and Bret Larget Department of Statistics University of Wisconsin Madison November 15, 2011 Designing Experiments 1 / 31 Experimental Design Many interesting
Principles of Experimental Design
 Principles of Experimental Design Bret Hanlon and Bret Larget Department of Statistics University of Wisconsin Madison November 15, 2011 Designing Experiments 1 / 31 Experimental Design Many interesting
Study of cigarette sales in the United States Ge Cheng1, a,
 2nd International Conference on Economics, Management Engineering and Education Technology (ICEMEET 2016) 1Department Study of cigarette sales in the United States Ge Cheng1, a, of pure mathematics and
Analysis of Environmental Data Conceptual Foundations: En viro n m e n tal Data
 Analysis of Environmental Data Conceptual Foundations: En viro n m e n tal Data 1. Purpose of data collection...................................................... 2 2. Samples and populations.......................................................
IAPT: Regression. Regression analyses
 Regression analyses IAPT: Regression Regression is the rather strange name given to a set of methods for predicting one variable from another. The data shown in Table 1 and come from a student project
Analysis of Rheumatoid Arthritis Data using Logistic Regression and Penalized Approach
 University of South Florida Scholar Commons Graduate Theses and Dissertations Graduate School November 2015 Analysis of Rheumatoid Arthritis Data using Logistic Regression and Penalized Approach Wei Chen
Lecture 1 An introduction to statistics in Ichthyology and Fisheries Science
 Lecture 1 An introduction to statistics in Ichthyology and Fisheries Science What is statistics and why do we need it? Statistics attempts to make inferences about unknown values that are common to a population
Business Statistics Probability
 Business Statistics The following was provided by Dr. Suzanne Delaney, and is a comprehensive review of Business Statistics. The workshop instructor will provide relevant examples during the Skills Assessment
Experimental Studies. Statistical techniques for Experimental Data. Experimental Designs can be grouped. Experimental Designs can be grouped
 Experimental Studies Statistical techniques for Experimental Data Require appropriate manipulations and controls Many different designs Consider an overview of the designs Examples of some of the analyses
Describe what is meant by a placebo Contrast the double-blind procedure with the single-blind procedure Review the structure for organizing a memo
 Business Statistics The following was provided by Dr. Suzanne Delaney, and is a comprehensive review of Business Statistics. The workshop instructor will provide relevant examples during the Skills Assessment
Chapter 1: Exploring Data
 Chapter 1: Exploring Data Key Vocabulary:! individual! variable! frequency table! relative frequency table! distribution! pie chart! bar graph! two-way table! marginal distributions! conditional distributions!
Understandable Statistics
 Understandable Statistics correlated to the Advanced Placement Program Course Description for Statistics Prepared for Alabama CC2 6/2003 2003 Understandable Statistics 2003 correlated to the Advanced Placement
QA 605 WINTER QUARTER ACADEMIC YEAR
 Instructor: Office: James J. Cochran 117A CAB Telephone: (318) 257-3445 Hours: e-mail: URL: QA 605 WINTER QUARTER 2006-2007 ACADEMIC YEAR Tuesday & Thursday 8:00 a.m. 10:00 a.m. Wednesday 8:00 a.m. noon
Name: emergency please discuss this with the exam proctor. 6. Vanderbilt s academic honor code applies.
 Name: Biostatistics 1 st year Comprehensive Examination: Applied in-class exam May 28 th, 2015: 9am to 1pm Instructions: 1. There are seven questions and 12 pages. 2. Read each question carefully. Answer
Readings: Textbook readings: OpenStax - Chapters 1 13 (emphasis on Chapter 12) Online readings: Appendix D, E & F
 Online readings: Appendix D, E & F") Readings: Textbook readings: OpenStax - Chapters 1 13 (emphasis on Chapter 12) Online readings: Appendix D, E & F Plous Chapters 17 & 18 Chapter 17: Social Influences Chapter 18: Group Judgments and Decisions
Readings: Textbook readings: OpenStax - Chapters 1 13 (emphasis on Chapter 12) Online readings: Appendix D, E & F Plous Chapters 17 & 18 Chapter 17: Social Influences Chapter 18: Group Judgments and Decisions
BIOL 458 BIOMETRY Lab 7 Multi-Factor ANOVA
 BIOL 458 BIOMETRY Lab 7 Multi-Factor ANOVA PART 1: Introduction to Factorial ANOVA ingle factor or One - Way Analysis of Variance can be used to test the null hypothesis that k or more treatment or group
Package AbsFilterGSEA
 Type Package Package AbsFilterGSEA September 21, 2017 Title Improved False Positive Control of Gene-Permuting GSEA with Absolute Filtering Version 1.5.1 Author Sora Yoon Maintainer
Simple Linear Regression the model, estimation and testing
 Simple Linear Regression the model, estimation and testing Lecture No. 05 Example 1 A production manager has compared the dexterity test scores of five assembly-line employees with their hourly productivity.
User Guide. Association analysis. Input
 User Guide TFEA.ChIP is a tool to estimate transcription factor enrichment in a set of differentially expressed genes using data from ChIP-Seq experiments performed in different tissues and conditions.
Still important ideas
 Readings: OpenStax - Chapters 1 13 & Appendix D & E (online) Plous Chapters 17 & 18 - Chapter 17: Social Influences - Chapter 18: Group Judgments and Decisions Still important ideas Contrast the measurement
Where does "analysis" enter the experimental process?
 Lecture Topic : ntroduction to the Principles of Experimental Design Experiment: An exercise designed to determine the effects of one or more variables (treatments) on one or more characteristics (response
Problem 1) Match the terms to their definitions. Every term is used exactly once. (In the real midterm, there are fewer terms).
 Match the terms to their definitions. Every term is used exactly once. (In the real midterm, there are fewer terms).") Problem 1) Match the terms to their definitions. Every term is used exactly once. (In the real midterm, there are fewer terms). 1. Bayesian Information Criterion 2. Cross-Validation 3. Robust 4. Imputation
Problem 1) Match the terms to their definitions. Every term is used exactly once. (In the real midterm, there are fewer terms). 1. Bayesian Information Criterion 2. Cross-Validation 3. Robust 4. Imputation
Biostatistics 2 nd year Comprehensive Examination. Due: May 31 st, 2013 by 5pm. Instructions:
 Biostatistics 2 nd year Comprehensive Examination Due: May 31 st, 2013 by 5pm. Instructions: 1. The exam is divided into two parts. There are 6 questions in section I and 2 questions in section II. 2.
Statistics is the science of collecting, organizing, presenting, analyzing, and interpreting data to assist in making effective decisions
 Readings: OpenStax Textbook - Chapters 1 5 (online) Appendix D & E (online) Plous - Chapters 1, 5, 6, 13 (online) Introductory comments Describe how familiarity with statistical methods can - be associated
Statistics 2. RCBD Review. Agriculture Innovation Program
 Statistics 2. RCBD Review 2014. Prepared by Lauren Pincus With input from Mark Bell and Richard Plant Agriculture Innovation Program 1 Table of Contents Questions for review... 3 Answers... 3 Materials
Assignment #6. Chapter 10: 14, 15 Chapter 11: 14, 18. Due tomorrow Nov. 6 th by 2pm in your TA s homework box
 Assignment #6 Chapter 10: 14, 15 Chapter 11: 14, 18 Due tomorrow Nov. 6 th by 2pm in your TA s homework box Assignment #7 Chapter 12: 18, 24 Chapter 13: 28 Due next Friday Nov. 13 th by 2pm in your TA
Chapter 8 Statistical Principles of Design. Fall 2010
 Chapter 8 Statistical Principles of Design Fall 2010 Experimental Design Many interesting questions in biology involve relationships between response variables and one or more explanatory variables. Biology
Table of Contents. Plots. Essential Statistics for Nursing Research 1/12/2017
 Essential Statistics for Nursing Research Kristen Carlin, MPH Seattle Nursing Research Workshop January 30, 2017 Table of Contents Plots Descriptive statistics Sample size/power Correlations Hypothesis
Statistical Techniques. Meta-Stat provides a wealth of statistical tools to help you examine your data. Overview
 7 Applying Statistical Techniques Meta-Stat provides a wealth of statistical tools to help you examine your data. Overview... 137 Common Functions... 141 Selecting Variables to be Analyzed... 141 Deselecting
STATISTICAL CONCLUSION VALIDITY
 Validity 1 The attached checklist can help when one is evaluating the threats to validity of a study. VALIDITY CHECKLIST Recall that these types are only illustrative. There are many more. INTERNAL VALIDITY
Biostatistics for Med Students. Lecture 1
 Biostatistics for Med Students Lecture 1 John J. Chen, Ph.D. Professor & Director of Biostatistics Core UH JABSOM JABSOM MD7 February 14, 2018 Lecture note: http://biostat.jabsom.hawaii.edu/education/training.html
Lec 02: Estimation & Hypothesis Testing in Animal Ecology
 Lec 02: Estimation & Hypothesis Testing in Animal Ecology Parameter Estimation from Samples Samples We typically observe systems incompletely, i.e., we sample according to a designed protocol. We then
Still important ideas
 Readings: OpenStax - Chapters 1 11 + 13 & Appendix D & E (online) Plous - Chapters 2, 3, and 4 Chapter 2: Cognitive Dissonance, Chapter 3: Memory and Hindsight Bias, Chapter 4: Context Dependence Still
Describe what is meant by a placebo Contrast the double-blind procedure with the single-blind procedure Review the structure for organizing a memo
 Please note the page numbers listed for the Lind book may vary by a page or two depending on which version of the textbook you have. Readings: Lind 1 11 (with emphasis on chapters 10, 11) Please note chapter
INTRODUCTION TO STATISTICS
 Basic Statistics Introduction to Statistics Basic Statistical Formulas Commonly used Ecological Equations INTRODUCTION TO STATISTICS Statistics is the branch of mathematics that deals with the techniques
lab exam lab exam Experimental Design Experimental Design when: Nov 27 - Dec 1 format: length = 1 hour each lab section divided in two
 lab exam when: Nov 27 - Dec 1 length = 1 hour each lab section divided in two register for the exam in your section so there is a computer reserved for you If you write in the 1st hour, you can t leave
MULTIPLE REGRESSION OF CPS DATA
 MULTIPLE REGRESSION OF CPS DATA A further inspection of the relationship between hourly wages and education level can show whether other factors, such as gender and work experience, influence wages. Linear
Hypothesis Testing. Richard S. Balkin, Ph.D., LPC-S, NCC
 Hypothesis Testing Richard S. Balkin, Ph.D., LPC-S, NCC Overview When we have questions about the effect of a treatment or intervention or wish to compare groups, we use hypothesis testing Parametric statistics
CHILD HEALTH AND DEVELOPMENT STUDY
 CHILD HEALTH AND DEVELOPMENT STUDY 9. Diagnostics In this section various diagnostic tools will be used to evaluate the adequacy of the regression model with the five independent variables developed in
On the purpose of testing:
 Why Evaluation & Assessment is Important Feedback to students Feedback to teachers Information to parents Information for selection and certification Information for accountability Incentives to increase
Application of Local Control Strategy in analyses of the effects of Radon on Lung Cancer Mortality for 2,881 US Counties
 Application of Local Control Strategy in analyses of the effects of Radon on Lung Cancer Mortality for 2,881 US Counties Bob Obenchain, Risk Benefit Statistics, August 2015 Our motivation for using a Cut-Point
Use of the Quantitative-Methods Approach in Scientific Inquiry. Du Feng, Ph.D. Professor School of Nursing University of Nevada, Las Vegas
 Use of the Quantitative-Methods Approach in Scientific Inquiry Du Feng, Ph.D. Professor School of Nursing University of Nevada, Las Vegas The Scientific Approach to Knowledge Two Criteria of the Scientific
CHAPTER 3 METHOD AND PROCEDURE
 CHAPTER 3 METHOD AND PROCEDURE Previous chapter namely Review of the Literature was concerned with the review of the research studies conducted in the field of teacher education, with special reference
CRITERIA FOR USE. A GRAPHICAL EXPLANATION OF BI-VARIATE (2 VARIABLE) REGRESSION ANALYSISSys
 REGRESSION ANALYSISSys") Multiple Regression Analysis 1 CRITERIA FOR USE Multiple regression analysis is used to test the effects of n independent (predictor) variables on a single dependent (criterion) variable. Regression tests
Multiple Regression Analysis 1 CRITERIA FOR USE Multiple regression analysis is used to test the effects of n independent (predictor) variables on a single dependent (criterion) variable. Regression tests
EXECUTIVE SUMMARY DATA AND PROBLEM
 EXECUTIVE SUMMARY Every morning, almost half of Americans start the day with a bowl of cereal, but choosing the right healthy breakfast is not always easy. Consumer Reports is therefore calculated by an
RNA-Seq Preparation Comparision Summary: Lexogen, Standard, NEB
 RNA-Seq Preparation Comparision Summary: Lexogen, Standard, NEB CSF-NGS January 22, 214 Contents 1 Introduction 1 2 Experimental Details 1 3 Results And Discussion 1 3.1 ERCC spike ins............................................
VARIABLES AND MEASUREMENT
 ARTHUR SYC 204 (EXERIMENTAL SYCHOLOGY) 16A LECTURE NOTES [01/29/16] VARIABLES AND MEASUREMENT AGE 1 Topic #3 VARIABLES AND MEASUREMENT VARIABLES Some definitions of variables include the following: 1.
Diurnal Pattern of Reaction Time: Statistical analysis
 Diurnal Pattern of Reaction Time: Statistical analysis Prepared by: Alison L. Gibbs, PhD, PStat Prepared for: Dr. Principal Investigator of Reaction Time Project January 11, 2015 Summary: This report gives
Identification of Tissue Independent Cancer Driver Genes
 Identification of Tissue Independent Cancer Driver Genes Alexandros Manolakos, Idoia Ochoa, Kartik Venkat Supervisor: Olivier Gevaert Abstract Identification of genomic patterns in tumors is an important
Readings: Textbook readings: OpenStax - Chapters 1 11 Online readings: Appendix D, E & F Plous Chapters 10, 11, 12 and 14
 Readings: Textbook readings: OpenStax - Chapters 1 11 Online readings: Appendix D, E & F Plous Chapters 10, 11, 12 and 14 Still important ideas Contrast the measurement of observable actions (and/or characteristics)
MULTIPLE LINEAR REGRESSION 24.1 INTRODUCTION AND OBJECTIVES OBJECTIVES
 24 MULTIPLE LINEAR REGRESSION 24.1 INTRODUCTION AND OBJECTIVES In the previous chapter, simple linear regression was used when you have one independent variable and one dependent variable. This chapter
Role of Statistics in Research
 Role of Statistics in Research Role of Statistics in research Validity Will this study help answer the research question? Analysis What analysis, & how should this be interpreted and reported? Efficiency
RNA-seq: filtering, quality control and visualisation. COMBINE RNA-seq Workshop
 RNA-seq: filtering, quality control and visualisation COMBINE RNA-seq Workshop QC and visualisation (part 1) Slide taken from COMBINE RNAseq workshop on 23/09/2016 RNA-seq of Mouse mammary gland Basal
Hierarchical Linear Models: Applications to cross-cultural comparisons of school culture
 Hierarchical Linear Models: Applications to cross-cultural comparisons of school culture Magdalena M.C. Mok, Macquarie University & Teresa W.C. Ling, City Polytechnic of Hong Kong Paper presented at the
Threats and Analysis. Shawn Cole. Harvard Business School
 Threats and Analysis Shawn Cole Harvard Business School Course Overview 1. What is Evaluation? 2. Outcomes, Impact, and Indicators 3. Why Randomize? 4. How to Randomize? 5. Sampling and Sample Size 6.
UNIVERSITY of PENNSYLVANIA CIS 520: Machine Learning Final, Fall 2014
 UNIVERSITY of PENNSYLVANIA CIS 520: Machine Learning Final, Fall 2014 Exam policy: This exam allows two one-page, two-sided cheat sheets (i.e. 4 sides); No other materials. Time: 2 hours. Be sure to write
Intro to SPSS. Using SPSS through WebFAS
 Intro to SPSS Using SPSS through WebFAS http://www.yorku.ca/computing/students/labs/webfas/ Try it early (make sure it works from your computer) If you need help contact UIT Client Services Voice: 416-736-5800
Statistical analysis supporting the development of the guidance on dermal absorption
 Statistical analysis supporting the development of the guidance on dermal absorption Peter Craig (Gilles Guillot, EFSA) Durham University United Kingdom 27 September, 2017 Variability of percentage absorbed
Multiple Regression. James H. Steiger. Department of Psychology and Human Development Vanderbilt University
 Multiple Regression James H. Steiger Department of Psychology and Human Development Vanderbilt University James H. Steiger (Vanderbilt University) Multiple Regression 1 / 19 Multiple Regression 1 The Multiple
Correlation and regression
 PG Dip in High Intensity Psychological Interventions Correlation and regression Martin Bland Professor of Health Statistics University of York http://martinbland.co.uk/ Correlation Example: Muscle strength
Randomized Block Designs 1
 Randomized Block Designs 1 STA305 Winter 2014 1 See last slide for copyright information. 1 / 1 Background Reading Optional Photocopy 2 from an old textbook; see course website. It s only four pages. The
(C) Jamalludin Ab Rahman
 Jamalludin Ab Rahman") SPSS Note The GLM Multivariate procedure is based on the General Linear Model procedure, in which factors and covariates are assumed to have a linear relationship to the dependent variable. Factors. Categorical
SPSS Note The GLM Multivariate procedure is based on the General Linear Model procedure, in which factors and covariates are assumed to have a linear relationship to the dependent variable. Factors. Categorical
Stat Wk 9: Hypothesis Tests and Analysis
 Stat 342 - Wk 9: Hypothesis Tests and Analysis Crash course on ANOVA, proc glm Stat 342 Notes. Week 9 Page 1 / 57 Crash Course: ANOVA AnOVa stands for Analysis Of Variance. Sometimes it s called ANOVA,
Describe what is meant by a placebo Contrast the double-blind procedure with the single-blind procedure Review the structure for organizing a memo
 Please note the page numbers listed for the Lind book may vary by a page or two depending on which version of the textbook you have. Readings: Lind 1 11 (with emphasis on chapters 5, 6, 7, 8, 9 10 & 11)
Statistics and Probability
 Statistics and a single count or measurement variable. S.ID.1: Represent data with plots on the real number line (dot plots, histograms, and box plots). S.ID.2: Use statistics appropriate to the shape
chapter 1 - fig. 2 Mechanism of transcriptional control by ppar agonists.
 chapter 1 - fig. 1 The -omics subdisciplines. chapter 1 - fig. 2 Mechanism of transcriptional control by ppar agonists. 201 figures chapter 1 chapter 2 - fig. 1 Schematic overview of the different steps
CHAPTER TWO REGRESSION
 CHAPTER TWO REGRESSION 2.0 Introduction The second chapter, Regression analysis is an extension of correlation. The aim of the discussion of exercises is to enhance students capability to assess the effect
Clincial Biostatistics. Regression
 Regression analyses Clincial Biostatistics Regression Regression is the rather strange name given to a set of methods for predicting one variable from another. The data shown in Table 1 and come from a
Caffeine & Calories in Soda. Statistics. Anthony W Dick
 1 Caffeine & Calories in Soda Statistics Anthony W Dick 2 Caffeine & Calories in Soda Description of Experiment Does the caffeine content in soda have anything to do with the calories? This is the question
Part 8 Logistic Regression
 1 Quantitative Methods for Health Research A Practical Interactive Guide to Epidemiology and Statistics Practical Course in Quantitative Data Handling SPSS (Statistical Package for the Social Sciences)
REGRESSION MODELLING IN PREDICTING MILK PRODUCTION DEPENDING ON DAIRY BOVINE LIVESTOCK
 REGRESSION MODELLING IN PREDICTING MILK PRODUCTION DEPENDING ON DAIRY BOVINE LIVESTOCK Agatha POPESCU University of Agricultural Sciences and Veterinary Medicine Bucharest, 59 Marasti, District 1, 11464,
WDHS Curriculum Map Probability and Statistics. What is Statistics and how does it relate to you?
 WDHS Curriculum Map Probability and Statistics Time Interval/ Unit 1: Introduction to Statistics 1.1-1.3 2 weeks S-IC-1: Understand statistics as a process for making inferences about population parameters
Results. NeuRA Worldwide incidence April 2016
 Introduction The incidence of schizophrenia refers to how many new cases there are per population in a specified time period. It is different from prevalence, which refers to how many existing cases there
HOW STATISTICS IMPACT PHARMACY PRACTICE?
 HOW STATISTICS IMPACT PHARMACY PRACTICE? CPPD at NCCR 13 th June, 2013 Mohamed Izham M.I., PhD Professor in Social & Administrative Pharmacy Learning objective.. At the end of the presentation pharmacists
investigate. educate. inform.
 investigate. educate. inform. Research Design What drives your research design? The battle between Qualitative and Quantitative is over Think before you leap What SHOULD drive your research design. Advanced
Abstract Title Page Not included in page count. Title: Analyzing Empirical Evaluations of Non-experimental Methods in Field Settings
 Abstract Title Page Not included in page count. Title: Analyzing Empirical Evaluations of Non-experimental Methods in Field Settings Authors and Affiliations: Peter M. Steiner, University of Wisconsin-Madison
Chapter 11: Advanced Remedial Measures. Weighted Least Squares (WLS)
") Chapter : Advanced Remedial Measures Weighted Least Squares (WLS) When the error variance appears nonconstant, a transformation (of Y and/or X) is a quick remedy. But it may not solve the problem, or it
Chapter : Advanced Remedial Measures Weighted Least Squares (WLS) When the error variance appears nonconstant, a transformation (of Y and/or X) is a quick remedy. But it may not solve the problem, or it
Exercises: Differential Methylation
 Exercises: Differential Methylation Version 2018-04 Exercises: Differential Methylation 2 Licence This manual is 2014-18, Simon Andrews. This manual is distributed under the creative commons Attribution-Non-Commercial-Share
IE 361 Module 31. Patterns on Control Charts Part 1. Reading: Section 3.4 Statistical Methods for Quality Assurance. ISU and Analytics Iowa LLC
 IE 361 Module 31 Patterns on Control Charts Part 1 Reading: Section 3.4 Statistical Methods for Quality Assurance ISU and Analytics Iowa LLC (ISU and Analytics Iowa LLC) IE 361 Module 31 1 / 9 (and Other
How to analyze correlated and longitudinal data?
 How to analyze correlated and longitudinal data? Niloofar Ramezani, University of Northern Colorado, Greeley, Colorado ABSTRACT Longitudinal and correlated data are extensively used across disciplines
The essential focus of an experiment is to show that variance can be produced in a DV by manipulation of an IV.
 EXPERIMENTAL DESIGNS I: Between-Groups Designs There are many experimental designs. We begin this week with the most basic, where there is a single IV and where participants are divided into two or more
Statistics is the science of collecting, organizing, presenting, analyzing, and interpreting data to assist in making effective decisions
 Readings: OpenStax Textbook - Chapters 1 5 (online) Appendix D & E (online) Plous - Chapters 1, 5, 6, 13 (online) Introductory comments Describe how familiarity with statistical methods can - be associated
6. Unusual and Influential Data
 Sociology 740 John ox Lecture Notes 6. Unusual and Influential Data Copyright 2014 by John ox Unusual and Influential Data 1 1. Introduction I Linear statistical models make strong assumptions about the
BOOTSTRAPPING CONFIDENCE LEVELS FOR HYPOTHESES ABOUT QUADRATIC (U-SHAPED) REGRESSION MODELS
 REGRESSION MODELS") BOOTSTRAPPING CONFIDENCE LEVELS FOR HYPOTHESES ABOUT QUADRATIC (U-SHAPED) REGRESSION MODELS 12 June 2012 Michael Wood University of Portsmouth Business School SBS Department, Richmond Building Portland
BOOTSTRAPPING CONFIDENCE LEVELS FOR HYPOTHESES ABOUT QUADRATIC (U-SHAPED) REGRESSION MODELS 12 June 2012 Michael Wood University of Portsmouth Business School SBS Department, Richmond Building Portland
Daniel Boduszek University of Huddersfield
 Daniel Boduszek University of Huddersfield d.boduszek@hud.ac.uk Introduction to Multiple Regression (MR) Types of MR Assumptions of MR SPSS procedure of MR Example based on prison data Interpretation of
Lesson 9: Two Factor ANOVAS
 Published on Agron 513 (https://courses.agron.iastate.edu/agron513) Home > Lesson 9 Lesson 9: Two Factor ANOVAS Developed by: Ron Mowers, Marin Harbur, and Ken Moore Completion Time: 1 week Introduction
Find the slope of the line that goes through the given points. 1) (-9, -68) and (8, 51) 1)
 (-9, -68) and (8, 51) 1)") Math 125 Semester Review Problems Name Find the slope of the line that goes through the given points. 1) (-9, -68) and (8, 51) 1) Solve the inequality. Graph the solution set, and state the solution set
Math 125 Semester Review Problems Name Find the slope of the line that goes through the given points. 1) (-9, -68) and (8, 51) 1) Solve the inequality. Graph the solution set, and state the solution set
Statistical reports Regression, 2010
 Statistical reports Regression, 2010 Niels Richard Hansen June 10, 2010 This document gives some guidelines on how to write a report on a statistical analysis. The document is organized into sections that
Completely randomized designs, Factors, Factorials, and Blocking
 Completely randomized designs, Factors, Factorials, and Blocking STAT:5201 Week 2: Lecture 1 1 / 35 Completely Randomized Design (CRD) Simplest design set-up Treatments are randomly assigned to EUs Easiest
Design of Experiments & Introduction to Research
 Design of Experiments & Introduction to Research 1 Design of Experiments Introduction to Research Definition and Purpose Scientific Method Research Project Paradigm Structure of a Research Project Types
CONSORT 2010 checklist of information to include when reporting a randomised trial*
 CONSORT 2010 checklist of information to include when reporting a randomised trial* Section/Topic Title and abstract Introduction Background and objectives Item No Checklist item 1a Identification as a
C-1: Variables which are measured on a continuous scale are described in terms of three key characteristics central tendency, variability, and shape.
 MODULE 02: DESCRIBING DT SECTION C: KEY POINTS C-1: Variables which are measured on a continuous scale are described in terms of three key characteristics central tendency, variability, and shape. C-2:
Research Methods in Forest Sciences: Learning Diary. Yoko Lu December Research process
 Research Methods in Forest Sciences: Learning Diary Yoko Lu 285122 9 December 2016 1. Research process It is important to pursue and apply knowledge and understand the world under both natural and social