Research Methods I ROB SEMMENS CS 376 WITH SIGNIFICANT INPUT FROM MICHAEL BERNSTEIN AND DAN SCHWARTZ
|
|
|
- Sabina Watkins
- 6 years ago
- Views:
Transcription

1 Research Methods I ROB SEMMENS CS 376 WITH SIGNIFICANT INPUT FROM MICHAEL BERNSTEIN AND DAN SCHWARTZ
2 Folks, do me a solid Put your last names in the file name. And do this on every other assignment in your class-taking lives. Your TA s prefer.pdf files
3 Abstracts Project Abstract Grading is done Let s talk about how to talk about related work Previous research has shown that novice undergraduate students do not draw visualizations to help them in faux medical diagnosis problem solving task. <here s the key> This study extends this work by demonstrating that they will also not do this in an authentic engineering project scheduling task found in many engineering textbooks. Furthermore
4 Watch your language! competence!= efficacy!= ability (perhaps) Define the terms you need to, then stick with them throughout
5 Scoping Research Methods Analysis 5
6 Goals of Research Social science differs from physical science. Argument over linear accelerators. Creating a world that only exists in accelerator. Therefore, it is not real. A strange argument for human affairs. We largely create our social world. Legal system, economics, schools. More types of social-scientific knowledge.
7 Three Vectors of Social Scientific Knowledge Interpretive
8 Predictive Knowledge Goal Ascertain the regularities of social reality. Criterion Identification of conditions that replicate a given outcome. Proto-typical instances: Finding correlation between achievement and SES Forecasting teacher retention Determining robustness of an instructional treatment Isolating a cause of autism Typical Issues Hidden factors * causality * generalization
9 Interpretive Knowledge Geertz, 1973 Believing, with Max Weber, that man is an animal suspended in webs of significance he himself has spun, I take culture to be those webs, and the analysis of it to be therefore not an experimental science in search of law but an interpretive one in search of meaning. Goal Insight on the meanings and signs that organize social reality. (Like understanding a text rather than predicting an outcome.) Criterion An account of words and deeds that could eventually be accepted by the subject.
10 Interpretive Knowledge Prototypical instances Describing how different cultures experience school. Detailing the construction of classroom identities. Contrasting children s views of mathematics. Characterizing a moment of epiphany. Detailing moment-to-moment interactions. Issues Vantage/assumptions of researcher * Do readers of work experience same interpretation.* Another subtext? The interpretive endeavor takes a special knack: I never knew how badly you understood me until you started setting me up on blind dates.
11 Three Vectors of Social Scientific Knowledge Interpretive
12 Praxis Knowledge G. H. Mead, 1899 In society, we are the forces that are being investigated, and if we advance beyond the mere description of the phenomena of the social world to the attempt at reform, we seem to involve the possibility of changing what at the same time we assume to be necessarily fixed. Goal Determine which aspects of social reality are fixed and which are mutable. Criterion Evidence of precipitating a new social reality.
13 Praxis Knowledge An unusual view: Praxis knowledge shows that what was assumed or thought to be fixed can be changed. In other words, a theory is true to the extent that it can change the world to fit it. Examples Proactive political theories (communist manifesto) The contact hypothesis and busing Demonstrations of excellence in downtrodden places. School reform effort in New York City. Design experiments Issues Really new? * Really a change?
14 Praxis is explicitly value laden If the goal is change, praxis is most direct. Interpretation and prediction leave change to others. I reveal interpretations. My papers will make others change. I find the laws, let the engineers decide how to use them. These require an unstudied link between theory and change. If the goal of research is change, then it has the burden to decide what change to make.
15 Value Laden Research Doesn t wanting and trying to make a particular outcome violate scientific principles of being dispassionate and objective? No. Asserting values and desired outcomes does not override the requirements of truth and integrity. Doesn t this mean you are imposing your values? Yes! And this is where vigilance is necessary. The IRB helps Know the setting Return value to participants Don t waste people s time pilot! Look for negative consequences
16 Scoping Research Methods Analysis 18
17 Experiment Respondent Field Theoretical From McGrath, Methodology Matters 19

18 Experiment Respondent Field Theoretical From McGrath, Methodology Matters 20
19 Choosing a Method The research question drives the method! Interpretive Description of behavior Predictive/Praxis Leads to Operational Definitions of Hypotheses May build to theory Variables may not be identified before data collection Tests theory Variables and levels identified before data collection Statistics often not used Statistics almost always used Methods are technical details not belief systems!
20 However, method triangulation All methods are flawed Thus, your argument becomes far stronger if you can demonstrate the same phenomenon using multiple methods Complement your statistics with semi-structured interviews Complement qualitative work with primary source evidence or log data 22
21 Becoming A Bartender The Role of External Memory Cues by King Beach selected an occupation which intuitively seemed to place heavy demands on memory Enrolled in the course! Observations Interview with Instructors This motivated the construction of the experimental hypothesis
22 Used standard bar glasses Study Design (cocktail, rock, collins, champagne) count backwards from 40 by threes Used opaque glasses, all the same shape count backwards from 40 by threes Trial 1 Trial 2 Trial 3 Trial 4 Trial 5 Trial 6 Bartending School Instructors n=2 Bartending School Graduates n = 10 Bartending School Students n = 10 Make four Make four Make four drinks, as drinks, quickly as drinks, as and quickly accurately and quickly and as accurately possible as accurately as possible possible Drinks called Drinks for called Drinks called different for different for different glass shapes glass shapes glass shapes Drink names Drink names Drink names did not did not did not include include include ingredients ingredients ingredients 15 min break. Read a passage about cocktail waitresses Make four Make four Make four drinks, as drinks, quickly as drinks, as and quickly accurately and quickly and as accurately possible as accurately as possible possible Drinks called Drinks for called Drinks called different for different for different glass shapes glass shapes glass shapes Drink names Drink names Drink names did not did not did not include include include ingredients ingredients ingredients
23 Dependent Variables Time to complete each drill Number of common ingredients poured at the same time Number of drink errors (wrong drink, but made correctly) Number of ingredient errors (right drink, but made incorrectly) Frequency of overt rehearsal Looks at mixology book Looks into glasses Glass position
24 Findings Instructors faster and more accurate than graduates, who were faster and more accurate than students Counting backwards caused accuracy problems for students, but not graduates or instructors Instructors poured the common ingredients more frequently Graduates made many more errors using the black glasses instead of the regular glasses, no difference for novices or experts Graduates looked in the glass much more when they were black, novices and experts did not
25 Variables Independent What you manipulate Also called a predictor variable, or stimulus, or factor Dependent What happens as the result of the manipulation Also called the response variable
26 Variables & Operational Definitions Variable Any event, situation, behavior, or characteristic that varies Must have two or more levels Continuous vs. Categorical Operational definition A set of procedures used to measure or manipulate a variable Construct validity Does the operational definition fit the variable in question? Are you measuring what you think you re measuring? 28
27 Nonexperimental methods Correlational studies: still predictive No claim direction of cause and effect Stress at home Stress at work? Stress at work Stress at home There still some reason to think that the two variables are related 29

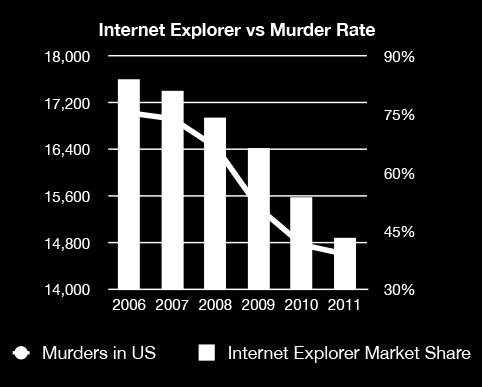
28 Correlated variables are not causally related 30
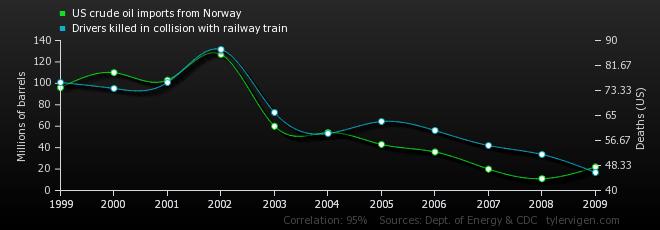
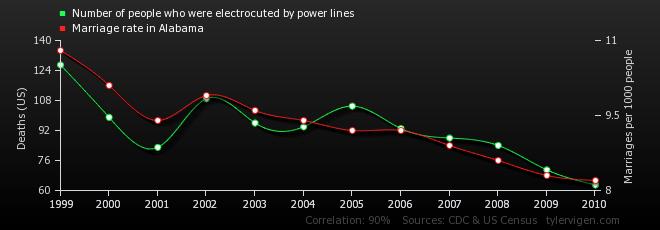
29 31

30 Correlated variables are not causally related 32
31 33
32 The third variable problem Another extraneous variable may be related to both variables in question. The third variable is a confounding factor or confound When we can identify one that will for sure have an effect on the DV, we control for it 34
33 Experimental methods Important difference between experimental and nonexperimental studies? Randomization Assigning participants to groups at random Helps to alleviate the third variable problem because an extraneous variable is just as likely to affect one group as the other group Random does not mean chaos! Random also does not mean the experimenter s best guess at creating random groups! 35
34 Framing an evaluation The difficulty: defining and isolating the construct that you are trying to maximize It is tempting to aim for something easy: time, task completion, number of clicks But, testing the easily quantifiable could miss the point. 36
35 Construct Validity It pays the bills! The construct validity of organizational commitment has recently been investigated in several studies. The authors of these studies have concluded that organizational commitment is a valid construct, sufficiently distinct from job satisfaction. Our re-analysis of data reported in these studies, however, suggests that the construct validity evidence is unconvincing. Analysis of meta-analytic results cast further doubt on the discriminant validity of organizational commitment as typically measured. Based on these findings, suggestions for future research are offered.
36 Types of Measures Counts, categorical, binomial People who did it or didn t do it Ordinal 1 st place, 2 nd place, 3 rd place Likert scale Interval/ratio Test score Reaction time Likert scale again (Oh, I hate you survey!) This is determined in study design, (not after data
37 Scoping Research Methods Analysis 42
38 What Test to Run? Interval/Ratio (Normality assumed) Interval/Ratio (Normality not assumed), Ordinal Dichotomy (Binomial) Compare two unpaired Unpaired t test Mann-Whitney test Fisher's test groups Compare two paired groups Paired t test Wilcoxon test McNemar's test Compare more than two ANOVA Kruskal-Wallis test Chi-square test unmatched groups Compare more than two Repeated-measures ANOVA Friedman test Cochran's Q test matched groups Find relationship between Pearson correlation Spearman correlation Cramer's V two variables Predict a value with one independent variable Linear/Non-linear regression Non-parametric regression Logistic regression Predict a value with multiple independent variables or binomial variables Multiple linear/non-linear regression Multiple logistic regression
39 Always follow every step! 1. Visualize the data 2. Compute descriptive statistics (e.g., mean) 3. Remove outliers >2 standard deviations from the mean 4. Check for heteroskedasticity and non-normal data Easiest to check by visualizing the data If there s a problem, try a log, square root, or reciprocal transform Our tests are typically robust against non-normal data, but not against heteroskedasticity 5. Run statistical test 6. Run any posthoc tests if necessary 44
40 Hypothesis Testing
41 Anatomy of a statistical test If your change had no effect, what would the world look like? No difference in means No slope in relationship This is known as the null hypothesis 46
42 Anatomy of a statistical test Given the difference you observed, how likely is it to have occurred by chance? Probability of seeing a mean difference at least this large, by chance, is Probability of seeing a slope at least this large, by chance, is
43 Errors Difference exists? Y N Y True positive Type 1 error publish false findings Difference detected? N Type 2 error get more data? True negative 48
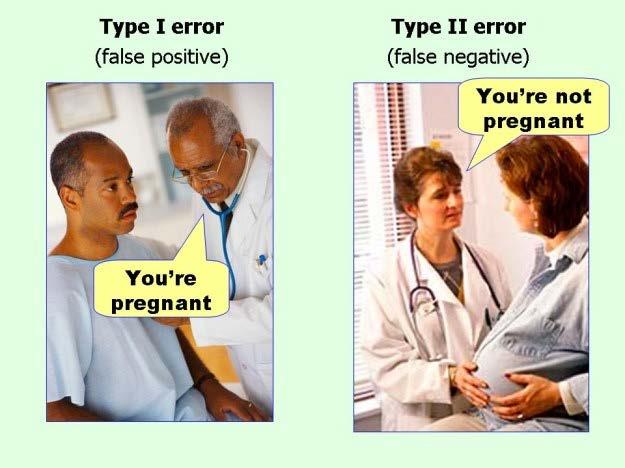
44 Errors 49
45 p-value The probability of seeing the observed difference by chance In other words, P(Type I error) Typically accepted levels: 0.05, 0.01,
46 Comparing two populations: counts
47 Count or occurrence data Fifteen people completed the trial with the control interface, and twenty two completed it with the augmented interface. control augmented success 5 22 failure
48 Pearson s chi-square test for independence Determine the expected number of outcomes for each cell control augmented total success failure total Expected is (row total)*(column total) / overall total. Upper left: expected is 27*40/80 =
49 Calculating a chi-square statistic e.g., (5-13.5) 2 / 13.5 = 5.35 Sum this value over all possible outcomes 54
50 How many degrees of freedom? If we know there are a total of 40 participants 5?????? 18 We get (rows - 1) * (columns -1) degrees of freedom. So, if it s a two-by-two design, one degree of freedom. 55
51 Result: chi-square distribution Probability Very likely =1.8 Very unlikely chi-square statistic with one degree of freed
52 Pearson s chi-square test for independence chisq.test (HCI R tutorial at 57
53 Comparing two populations: means
54 Normally distributed data std. dev. mean 59
55 t-test: do they have the same mean? likely have different means likely have the same mean (null hypothesis) 60

56 Numbers that matter: Difference in means larger means more significant Variance in each group larger means less significant Number of samples larger means more significant 61
57 Example t distribution 0.4 Very likely Probability Very unlikely Very unlikely t statistic with 18 degrees of freedom 62
58 How many degrees of freedom? If we know the mean of N numbers, then only N-1 of those numbers can change. We have two means, so a t-test has N-2 degrees of freedom. 63
59 Running the test in R Use t.test (HCI R tutorial at 64
60 Presenting the result A t-test comparing the expert-rated scores of designs with the control (mean=2.0, std. dev=0.5) to the designs with the augmented condition (mean=3.4, std. dev=0.4) is significant (t(18)=2.2, p<.05). 65
61 Within-subjects study designs It can be easier to statistically detect a difference if the participants try both alternatives. Why? 66
62 Paired t-test Control Augmented Difference A paired test controls for individual-level differences
63 Unpaired vs. paired t-test Do two normal distributions have the same mean? Paired t-test: does the distribution of (after - before) have mean = 0? 68

64 Paired t-test Is the mean of that difference significantly different from zero? 69
65 Running a paired t-test in R Why no longer significant? (Hint: look at the degrees of freedom df ) Ten participants. If we had twenty rows like before, much 70
66 ANOVA
67 t-test: compare two means Do people fix more bugs with our IDE bug suggestion callouts? 77
68 ANOVA: compare N means Do people fix more bugs with our IDE bug suggestion callouts, with warnings, or with nothing? 78
69 Rough intuition for ANOVA test How much of the total variation can be accounted for by looking at the means of each condition? deviation of total deviation deviation of factor from grand mean mean from grand mean response from 83 factor mean
70 ANalysis Of VAriance (ANOVA) Degrees of freedom: how many values can vary? (Using n and r) Degrees of freedom in individual data points: n - 1 Degrees of freedom in factor level averages: r - 1 Combined: n - r 85
71 Finally: run the test! How large is the value we constructed from the F distribution? Test if factor error ( what s left ) 3 factor levels hopefully F(2,21) p < observationstop >> bottom 88
72 Reporting an ANOVA A one-way ANOVA revealed a significant difference in the effect of news feed source on number of likes (F(2, 21)=12.1, p<.001). 89
73 Summary p-values encode our desired probability of a false positive Chi-square test compares count or rate data t-test compares two means Paired t-test compares means within subjects ANOVA compares more than two means 90
Research Analysis MICHAEL BERNSTEIN CS 376
 Research Analysis MICHAEL BERNSTEIN CS 376 Last time What is a statistical test? Chi-square t-test Paired t-test 2 Today ANOVA Posthoc tests Two-way ANOVA Repeated measures ANOVA 3 Recall: hypothesis testing
HOW STATISTICS IMPACT PHARMACY PRACTICE?
 HOW STATISTICS IMPACT PHARMACY PRACTICE? CPPD at NCCR 13 th June, 2013 Mohamed Izham M.I., PhD Professor in Social & Administrative Pharmacy Learning objective.. At the end of the presentation pharmacists
Statistical analysis DIANA SAPLACAN 2017 * SLIDES ADAPTED BASED ON LECTURE NOTES BY ALMA LEORA CULEN
 Statistical analysis DIANA SAPLACAN 2017 * SLIDES ADAPTED BASED ON LECTURE NOTES BY ALMA LEORA CULEN Vs. 2 Background 3 There are different types of research methods to study behaviour: Descriptive: observations,
Psychology Research Process
 Psychology Research Process Logical Processes Induction Observation/Association/Using Correlation Trying to assess, through observation of a large group/sample, what is associated with what? Examples:
The Logic of Data Analysis Using Statistical Techniques M. E. Swisher, 2016
 The Logic of Data Analysis Using Statistical Techniques M. E. Swisher, 2016 This course does not cover how to perform statistical tests on SPSS or any other computer program. There are several courses
Quantitative Methods in Computing Education Research (A brief overview tips and techniques)
") Quantitative Methods in Computing Education Research (A brief overview tips and techniques) Dr Judy Sheard Senior Lecturer Co-Director, Computing Education Research Group Monash University judy.sheard@monash.edu
Quantitative Methods in Computing Education Research (A brief overview tips and techniques) Dr Judy Sheard Senior Lecturer Co-Director, Computing Education Research Group Monash University judy.sheard@monash.edu
Psychology Research Process
 Psychology Research Process Logical Processes Induction Observation/Association/Using Correlation Trying to assess, through observation of a large group/sample, what is associated with what? Examples:
Analysis and Interpretation of Data Part 1
 Analysis and Interpretation of Data Part 1 DATA ANALYSIS: PRELIMINARY STEPS 1. Editing Field Edit Completeness Legibility Comprehensibility Consistency Uniformity Central Office Edit 2. Coding Specifying
Analysis of Variance (ANOVA)
") Research Methods and Ethics in Psychology Week 4 Analysis of Variance (ANOVA) One Way Independent Groups ANOVA Brief revision of some important concepts To introduce the concept of familywise error rate.
Research Methods and Ethics in Psychology Week 4 Analysis of Variance (ANOVA) One Way Independent Groups ANOVA Brief revision of some important concepts To introduce the concept of familywise error rate.
Describe what is meant by a placebo Contrast the double-blind procedure with the single-blind procedure Review the structure for organizing a memo
 Business Statistics The following was provided by Dr. Suzanne Delaney, and is a comprehensive review of Business Statistics. The workshop instructor will provide relevant examples during the Skills Assessment
MULTIPLE LINEAR REGRESSION 24.1 INTRODUCTION AND OBJECTIVES OBJECTIVES
 24 MULTIPLE LINEAR REGRESSION 24.1 INTRODUCTION AND OBJECTIVES In the previous chapter, simple linear regression was used when you have one independent variable and one dependent variable. This chapter
Business Statistics Probability
 Business Statistics The following was provided by Dr. Suzanne Delaney, and is a comprehensive review of Business Statistics. The workshop instructor will provide relevant examples during the Skills Assessment
What you should know before you collect data. BAE 815 (Fall 2017) Dr. Zifei Liu
 Dr. Zifei Liu") What you should know before you collect data BAE 815 (Fall 2017) Dr. Zifei Liu Zifeiliu@ksu.edu Types and levels of study Descriptive statistics Inferential statistics How to choose a statistical test
What you should know before you collect data BAE 815 (Fall 2017) Dr. Zifei Liu Zifeiliu@ksu.edu Types and levels of study Descriptive statistics Inferential statistics How to choose a statistical test
STA 3024 Spring 2013 EXAM 3 Test Form Code A UF ID #
 STA 3024 Spring 2013 Name EXAM 3 Test Form Code A UF ID # Instructions: This exam contains 34 Multiple Choice questions. Each question is worth 3 points, for a total of 102 points (there are TWO bonus
Unit 1 Exploring and Understanding Data
 Unit 1 Exploring and Understanding Data Area Principle Bar Chart Boxplot Conditional Distribution Dotplot Empirical Rule Five Number Summary Frequency Distribution Frequency Polygon Histogram Interquartile
isc ove ring i Statistics sing SPSS
 isc ove ring i Statistics sing SPSS S E C O N D! E D I T I O N (and sex, drugs and rock V roll) A N D Y F I E L D Publications London o Thousand Oaks New Delhi CONTENTS Preface How To Use This Book Acknowledgements
AMSc Research Methods Research approach IV: Experimental [2]
![AMSc Research Methods Research approach IV: Experimental [2]](/thumbs/96/127502980.jpg "AMSc Research Methods Research approach IV: Experimental [2]") AMSc Research Methods Research approach IV: Experimental [2] Marie-Luce Bourguet mlb@dcs.qmul.ac.uk Statistical Analysis 1 Statistical Analysis Descriptive Statistics : A set of statistical procedures
AMSc Research Methods Research approach IV: Experimental [2] Marie-Luce Bourguet mlb@dcs.qmul.ac.uk Statistical Analysis 1 Statistical Analysis Descriptive Statistics : A set of statistical procedures
Doctoral Dissertation Boot Camp Quantitative Methods Kamiar Kouzekanani, PhD January 27, The Scientific Method of Problem Solving
 Doctoral Dissertation Boot Camp Quantitative Methods Kamiar Kouzekanani, PhD January 27, 2018 The Scientific Method of Problem Solving The conceptual phase Reviewing the literature, stating the problem,
Statistics as a Tool. A set of tools for collecting, organizing, presenting and analyzing numerical facts or observations.
 Statistics as a Tool A set of tools for collecting, organizing, presenting and analyzing numerical facts or observations. Descriptive Statistics Numerical facts or observations that are organized describe
SUMMER 2011 RE-EXAM PSYF11STAT - STATISTIK
 SUMMER 011 RE-EXAM PSYF11STAT - STATISTIK Full Name: Årskortnummer: Date: This exam is made up of three parts: Part 1 includes 30 multiple choice questions; Part includes 10 matching questions; and Part
Figure: Presentation slides:
 Joni Lakin David Shannon Margaret Ross Abbot Packard Auburn University Auburn University Auburn University University of West Georgia Figure: http://www.auburn.edu/~jml0035/eera_chart.pdf Presentation
Selecting the Right Data Analysis Technique
 Selecting the Right Data Analysis Technique Levels of Measurement Nominal Ordinal Interval Ratio Discrete Continuous Continuous Variable Borgatta and Bohrnstedt state that "the most of central constructs
Chapter 11. Experimental Design: One-Way Independent Samples Design
 11-1 Chapter 11. Experimental Design: One-Way Independent Samples Design Advantages and Limitations Comparing Two Groups Comparing t Test to ANOVA Independent Samples t Test Independent Samples ANOVA Comparing
Describe what is meant by a placebo Contrast the double-blind procedure with the single-blind procedure Review the structure for organizing a memo
 Please note the page numbers listed for the Lind book may vary by a page or two depending on which version of the textbook you have. Readings: Lind 1 11 (with emphasis on chapters 10, 11) Please note chapter
CHAPTER ONE CORRELATION
 CHAPTER ONE CORRELATION 1.0 Introduction The first chapter focuses on the nature of statistical data of correlation. The aim of the series of exercises is to ensure the students are able to use SPSS to
THE STATSWHISPERER. Introduction to this Issue. Doing Your Data Analysis INSIDE THIS ISSUE
 Spring 20 11, Volume 1, Issue 1 THE STATSWHISPERER The StatsWhisperer Newsletter is published by staff at StatsWhisperer. Visit us at: www.statswhisperer.com Introduction to this Issue The current issue
Research Manual STATISTICAL ANALYSIS SECTION. By: Curtis Lauterbach 3/7/13
 Research Manual STATISTICAL ANALYSIS SECTION By: Curtis Lauterbach 3/7/13 TABLE OF CONTENTS INTRODUCTION 1 STATISTICAL ANALYSIS 1 Overview 1 Dependent Variable 1 Independent Variable 1 Interval 1 Ratio
Business Research Methods. Introduction to Data Analysis
 Business Research Methods Introduction to Data Analysis Data Analysis Process STAGES OF DATA ANALYSIS EDITING CODING DATA ENTRY ERROR CHECKING AND VERIFICATION DATA ANALYSIS Introduction Preparation of
Still important ideas
 Readings: OpenStax - Chapters 1 13 & Appendix D & E (online) Plous Chapters 17 & 18 - Chapter 17: Social Influences - Chapter 18: Group Judgments and Decisions Still important ideas Contrast the measurement
Formulating Research Questions and Designing Studies. Research Series Session I January 4, 2017
 Formulating Research Questions and Designing Studies Research Series Session I January 4, 2017 Course Objectives Design a research question or problem Differentiate between the different types of research
Assignment #6. Chapter 10: 14, 15 Chapter 11: 14, 18. Due tomorrow Nov. 6 th by 2pm in your TA s homework box
 Assignment #6 Chapter 10: 14, 15 Chapter 11: 14, 18 Due tomorrow Nov. 6 th by 2pm in your TA s homework box Assignment #7 Chapter 12: 18, 24 Chapter 13: 28 Due next Friday Nov. 13 th by 2pm in your TA
Prepared by: Assoc. Prof. Dr Bahaman Abu Samah Department of Professional Development and Continuing Education Faculty of Educational Studies
 Prepared by: Assoc. Prof. Dr Bahaman Abu Samah Department of Professional Development and Continuing Education Faculty of Educational Studies Universiti Putra Malaysia Serdang At the end of this session,
Chapter 11 Nonexperimental Quantitative Research Steps in Nonexperimental Research
 Chapter 11 Nonexperimental Quantitative Research (Reminder: Don t forget to utilize the concept maps and study questions as you study this and the other chapters.) Nonexperimental research is needed because
Online Introduction to Statistics
 APPENDIX Online Introduction to Statistics CHOOSING THE CORRECT ANALYSIS To analyze statistical data correctly, you must choose the correct statistical test. The test you should use when you have interval
Statistical questions for statistical methods
 Statistical questions for statistical methods Unpaired (two-sample) t-test DECIDE: Does the numerical outcome have a relationship with the categorical explanatory variable? Is the mean of the outcome the
AP Psychology -- Chapter 02 Review Research Methods in Psychology
 AP Psychology -- Chapter 02 Review Research Methods in Psychology 1. In the opening vignette, to what was Alicia's condition linked? The death of her parents and only brother 2. What did Pennebaker s study
POLS 5377 Scope & Method of Political Science. Correlation within SPSS. Key Questions: How to compute and interpret the following measures in SPSS
 POLS 5377 Scope & Method of Political Science Week 15 Measure of Association - 2 Correlation within SPSS 2 Key Questions: How to compute and interpret the following measures in SPSS Ordinal Variable Gamma
Research Manual COMPLETE MANUAL. By: Curtis Lauterbach 3/7/13
 Research Manual COMPLETE MANUAL By: Curtis Lauterbach 3/7/13 TABLE OF CONTENTS INTRODUCTION 1 RESEARCH DESIGN 1 Validity 1 Reliability 1 Within Subjects 1 Between Subjects 1 Counterbalancing 1 Table 1.
Choosing the Correct Statistical Test
 Choosing the Correct Statistical Test T racie O. Afifi, PhD Departments of Community Health Sciences & Psychiatry University of Manitoba Department of Community Health Sciences COLLEGE OF MEDICINE, FACULTY
Overview of Non-Parametric Statistics
 Overview of Non-Parametric Statistics LISA Short Course Series Mark Seiss, Dept. of Statistics April 7, 2009 Presentation Outline 1. Homework 2. Review of Parametric Statistics 3. Overview Non-Parametric
Basic Biostatistics. Chapter 1. Content
 Chapter 1 Basic Biostatistics Jamalludin Ab Rahman MD MPH Department of Community Medicine Kulliyyah of Medicine Content 2 Basic premises variables, level of measurements, probability distribution Descriptive
Political Science 15, Winter 2014 Final Review
 Political Science 15, Winter 2014 Final Review The major topics covered in class are listed below. You should also take a look at the readings listed on the class website. Studying Politics Scientifically
Evaluation: Scientific Studies. Title Text
 Evaluation: Scientific Studies Title Text 1 Evaluation Beyond Usability Tests 2 Usability Evaluation (last week) Expert tests / walkthroughs Usability Tests with users Main goal: formative identify usability
Announcement. Homework #2 due next Friday at 5pm. Midterm is in 2 weeks. It will cover everything through the end of next week (week 5).
.") Announcement Homework #2 due next Friday at 5pm. Midterm is in 2 weeks. It will cover everything through the end of next week (week 5). Political Science 15 Lecture 8: Descriptive Statistics (Part 1) Data
Announcement Homework #2 due next Friday at 5pm. Midterm is in 2 weeks. It will cover everything through the end of next week (week 5). Political Science 15 Lecture 8: Descriptive Statistics (Part 1) Data
15.301/310, Managerial Psychology Prof. Dan Ariely Recitation 8: T test and ANOVA
 15.301/310, Managerial Psychology Prof. Dan Ariely Recitation 8: T test and ANOVA Statistics does all kinds of stuff to describe data Talk about baseball, other useful stuff We can calculate the probability.
Chapter Eight: Multivariate Analysis
 Chapter Eight: Multivariate Analysis Up until now, we have covered univariate ( one variable ) analysis and bivariate ( two variables ) analysis. We can also measure the simultaneous effects of two or
11/18/2013. Correlational Research. Correlational Designs. Why Use a Correlational Design? CORRELATIONAL RESEARCH STUDIES
 Correlational Research Correlational Designs Correlational research is used to describe the relationship between two or more naturally occurring variables. Is age related to political conservativism? Are
04/12/2014. Research Methods in Psychology. Chapter 6: Independent Groups Designs. What is your ideas? Testing
 Research Methods in Psychology Chapter 6: Independent Groups Designs 1 Why Psychologists Conduct Experiments? What is your ideas? 2 Why Psychologists Conduct Experiments? Testing Hypotheses derived from
Evaluation: Controlled Experiments. Title Text
 Evaluation: Controlled Experiments Title Text 1 Outline Evaluation beyond usability tests Controlled Experiments Other Evaluation Methods 2 Evaluation Beyond Usability Tests 3 Usability Evaluation (last
Research Approaches Quantitative Approach. Research Methods vs Research Design
 Research Approaches Quantitative Approach DCE3002 Research Methodology Research Methods vs Research Design Both research methods as well as research design are crucial for successful completion of any
Still important ideas
 Readings: OpenStax - Chapters 1 11 + 13 & Appendix D & E (online) Plous - Chapters 2, 3, and 4 Chapter 2: Cognitive Dissonance, Chapter 3: Memory and Hindsight Bias, Chapter 4: Context Dependence Still
Chapter 7: Descriptive Statistics
 Chapter Overview Chapter 7 provides an introduction to basic strategies for describing groups statistically. Statistical concepts around normal distributions are discussed. The statistical procedures of
Designing Experiments... Or how many times and ways can I screw that up?!?
 www.geo.uzh.ch/microsite/icacogvis/ Designing Experiments... Or how many times and ways can I screw that up?!? Amy L. Griffin AutoCarto 2012, Columbus, OH Outline When do I need to run an experiment and
Homework Exercises for PSYC 3330: Statistics for the Behavioral Sciences
 Homework Exercises for PSYC 3330: Statistics for the Behavioral Sciences compiled and edited by Thomas J. Faulkenberry, Ph.D. Department of Psychological Sciences Tarleton State University Version: July
Readings: Textbook readings: OpenStax - Chapters 1 13 (emphasis on Chapter 12) Online readings: Appendix D, E & F
 Online readings: Appendix D, E & F") Readings: Textbook readings: OpenStax - Chapters 1 13 (emphasis on Chapter 12) Online readings: Appendix D, E & F Plous Chapters 17 & 18 Chapter 17: Social Influences Chapter 18: Group Judgments and Decisions
Readings: Textbook readings: OpenStax - Chapters 1 13 (emphasis on Chapter 12) Online readings: Appendix D, E & F Plous Chapters 17 & 18 Chapter 17: Social Influences Chapter 18: Group Judgments and Decisions
Correlational Research. Correlational Research. Stephen E. Brock, Ph.D., NCSP EDS 250. Descriptive Research 1. Correlational Research: Scatter Plots
 Correlational Research Stephen E. Brock, Ph.D., NCSP California State University, Sacramento 1 Correlational Research A quantitative methodology used to determine whether, and to what degree, a relationship
Collecting & Making Sense of
 Collecting & Making Sense of Quantitative Data Deborah Eldredge, PhD, RN Director, Quality, Research & Magnet Recognition i Oregon Health & Science University Margo A. Halm, RN, PhD, ACNS-BC, FAHA Director,
investigate. educate. inform.
 investigate. educate. inform. Research Design What drives your research design? The battle between Qualitative and Quantitative is over Think before you leap What SHOULD drive your research design. Advanced
Empirical Research Methods for Human-Computer Interaction. I. Scott MacKenzie Steven J. Castellucci
 Empirical Research Methods for Human-Computer Interaction I. Scott MacKenzie Steven J. Castellucci 1 Topics The what, why, and how of empirical research Group participation in a real experiment Observations
Choosing an Approach for a Quantitative Dissertation: Strategies for Various Variable Types
 Choosing an Approach for a Quantitative Dissertation: Strategies for Various Variable Types Kuba Glazek, Ph.D. Methodology Expert National Center for Academic and Dissertation Excellence Outline Thesis
Designing Psychology Experiments: Data Analysis and Presentation
 Data Analysis and Presentation Review of Chapter 4: Designing Experiments Develop Hypothesis (or Hypotheses) from Theory Independent Variable(s) and Dependent Variable(s) Operational Definitions of each
LEARNING. Learning. Type of Learning Experiences Related Factors
 LEARNING DEFINITION: Learning can be defined as any relatively permanent change in behavior or modification in behavior or behavior potentials that occur as a result of practice or experience. According
To open a CMA file > Download and Save file Start CMA Open file from within CMA
 Example name Effect size Analysis type Level Tamiflu Symptom relief Mean difference (Hours to relief) Basic Basic Reference Cochrane Figure 4 Synopsis We have a series of studies that evaluated the effect
Human-Computer Interaction IS4300. I6 Swing Layout Managers due now
 Human-Computer Interaction IS4300 1 I6 Swing Layout Managers due now You have two choices for requirements: 1) try to duplicate the functionality of an existing applet; or, 2) create your own (ideally
Your Task: Find a ZIP code in Seattle where the crime rate is worse than you would expect and better than you would expect.
 Forensic Geography Lab: Regression Part 1 Payday Lending and Crime Seattle, Washington Background Regression analyses are in many ways the Gold Standard among analytic techniques for undergraduates (and
Measuring the User Experience
 Measuring the User Experience Collecting, Analyzing, and Presenting Usability Metrics Chapter 2 Background Tom Tullis and Bill Albert Morgan Kaufmann, 2008 ISBN 978-0123735584 Introduction Purpose Provide
Analysis of Variance: repeated measures
 Analysis of Variance: repeated measures Tests for comparing three or more groups or conditions: (a) Nonparametric tests: Independent measures: Kruskal-Wallis. Repeated measures: Friedman s. (b) Parametric
Two-Way Independent ANOVA
 Two-Way Independent ANOVA Analysis of Variance (ANOVA) a common and robust statistical test that you can use to compare the mean scores collected from different conditions or groups in an experiment. There
RESEARCH METHODS. A Process of Inquiry. tm HarperCollinsPublishers ANTHONY M. GRAZIANO MICHAEL L RAULIN
 RESEARCH METHODS A Process of Inquiry ANTHONY M. GRAZIANO MICHAEL L RAULIN STA TE UNIVERSITY OF NEW YORK A T BUFFALO tm HarperCollinsPublishers CONTENTS Instructor's Preface xv Student's Preface xix 1
Chapter 1: Explaining Behavior
 Chapter 1: Explaining Behavior GOAL OF SCIENCE is to generate explanations for various puzzling natural phenomenon. - Generate general laws of behavior (psychology) RESEARCH: principle method for acquiring
Problem #1 Neurological signs and symptoms of ciguatera poisoning as the start of treatment and 2.5 hours after treatment with mannitol.
 Ho (null hypothesis) Ha (alternative hypothesis) Problem #1 Neurological signs and symptoms of ciguatera poisoning as the start of treatment and 2.5 hours after treatment with mannitol. Hypothesis: Ho:
MS&E 226: Small Data
 MS&E 226: Small Data Lecture 10: Introduction to inference (v2) Ramesh Johari ramesh.johari@stanford.edu 1 / 17 What is inference? 2 / 17 Where did our data come from? Recall our sample is: Y, the vector
Inferential Statistics
 Inferential Statistics and t - tests ScWk 242 Session 9 Slides Inferential Statistics Ø Inferential statistics are used to test hypotheses about the relationship between the independent and the dependent
Day 11: Measures of Association and ANOVA
 Day 11: Measures of Association and ANOVA Daniel J. Mallinson School of Public Affairs Penn State Harrisburg mallinson@psu.edu PADM-HADM 503 Mallinson Day 11 November 2, 2017 1 / 45 Road map Measures of
Study Guide #2: MULTIPLE REGRESSION in education
 Study Guide #2: MULTIPLE REGRESSION in education What is Multiple Regression? When using Multiple Regression in education, researchers use the term independent variables to identify those variables that
Readings: Textbook readings: OpenStax - Chapters 1 11 Online readings: Appendix D, E & F Plous Chapters 10, 11, 12 and 14
 Readings: Textbook readings: OpenStax - Chapters 1 11 Online readings: Appendix D, E & F Plous Chapters 10, 11, 12 and 14 Still important ideas Contrast the measurement of observable actions (and/or characteristics)
CHAPTER VI RESEARCH METHODOLOGY
 CHAPTER VI RESEARCH METHODOLOGY 6.1 Research Design Research is an organized, systematic, data based, critical, objective, scientific inquiry or investigation into a specific problem, undertaken with the
POST GRADUATE DIPLOMA IN BIOETHICS (PGDBE) Term-End Examination June, 2016 MHS-014 : RESEARCH METHODOLOGY
 Term-End Examination June, 2016 MHS-014 : RESEARCH METHODOLOGY") No. of Printed Pages : 12 MHS-014 POST GRADUATE DIPLOMA IN BIOETHICS (PGDBE) Term-End Examination June, 2016 MHS-014 : RESEARCH METHODOLOGY Time : 2 hours Maximum Marks : 70 PART A Attempt all questions.
No. of Printed Pages : 12 MHS-014 POST GRADUATE DIPLOMA IN BIOETHICS (PGDBE) Term-End Examination June, 2016 MHS-014 : RESEARCH METHODOLOGY Time : 2 hours Maximum Marks : 70 PART A Attempt all questions.
One-Way ANOVAs t-test two statistically significant Type I error alpha null hypothesis dependant variable Independent variable three levels;
 1 One-Way ANOVAs We have already discussed the t-test. The t-test is used for comparing the means of two groups to determine if there is a statistically significant difference between them. The t-test
Chapter 1: Review of Basic Concepts
 Chapter 1: Review of Basic Concepts Multiple Choice 1. A researcher uses a six-sided dice to determine group membership. The sampling method being used is: a. random sample. b. stratified sample. c. convenience
Reflection Questions for Math 58B
 Reflection Questions for Math 58B Johanna Hardin Spring 2017 Chapter 1, Section 1 binomial probabilities 1. What is a p-value? 2. What is the difference between a one- and two-sided hypothesis? 3. What
Collecting & Making Sense of
 Collecting & Making Sense of Quantitative Data Deborah Eldredge, PhD, RN Director, Quality, Research & Magnet Recognition i Oregon Health & Science University Margo A. Halm, RN, PhD, ACNS-BC, FAHA Director,
(CORRELATIONAL DESIGN AND COMPARATIVE DESIGN)
") UNIT 4 OTHER DESIGNS (CORRELATIONAL DESIGN AND COMPARATIVE DESIGN) Quasi Experimental Design Structure 4.0 Introduction 4.1 Objectives 4.2 Definition of Correlational Research Design 4.3 Types of Correlational
UNIT 4 OTHER DESIGNS (CORRELATIONAL DESIGN AND COMPARATIVE DESIGN) Quasi Experimental Design Structure 4.0 Introduction 4.1 Objectives 4.2 Definition of Correlational Research Design 4.3 Types of Correlational
A Brief (very brief) Overview of Biostatistics. Jody Kreiman, PhD Bureau of Glottal Affairs
 Overview of Biostatistics. Jody Kreiman, PhD Bureau of Glottal Affairs") A Brief (very brief) Overview of Biostatistics Jody Kreiman, PhD Bureau of Glottal Affairs What We ll Cover Fundamentals of measurement Parametric versus nonparametric tests Descriptive versus inferential
A Brief (very brief) Overview of Biostatistics Jody Kreiman, PhD Bureau of Glottal Affairs What We ll Cover Fundamentals of measurement Parametric versus nonparametric tests Descriptive versus inferential
Research Landscape. Qualitative = Constructivist approach. Quantitative = Positivist/post-positivist approach Mixed methods = Pragmatist approach
 Empirical Methods Research Landscape Qualitative = Constructivist approach Build theory from data Quantitative = Positivist/post-positivist approach Mixed methods = Pragmatist approach Experimental Analysis
One-Way Independent ANOVA
 One-Way Independent ANOVA Analysis of Variance (ANOVA) is a common and robust statistical test that you can use to compare the mean scores collected from different conditions or groups in an experiment.
Psychology 205, Revelle, Fall 2014 Research Methods in Psychology Mid-Term. Name:
 Name: 1. (2 points) What is the primary advantage of using the median instead of the mean as a measure of central tendency? It is less affected by outliers. 2. (2 points) Why is counterbalancing important
Evidence-Based Medicine Journal Club. A Primer in Statistics, Study Design, and Epidemiology. August, 2013
 Evidence-Based Medicine Journal Club A Primer in Statistics, Study Design, and Epidemiology August, 2013 Rationale for EBM Conscientious, explicit, and judicious use Beyond clinical experience and physiologic
Chapter Eight: Multivariate Analysis
 Chapter Eight: Multivariate Analysis Up until now, we have covered univariate ( one variable ) analysis and bivariate ( two variables ) analysis. We can also measure the simultaneous effects of two or
Statistics Guide. Prepared by: Amanda J. Rockinson- Szapkiw, Ed.D.
 This guide contains a summary of the statistical terms and procedures. This guide can be used as a reference for course work and the dissertation process. However, it is recommended that you refer to statistical
Lessons in biostatistics
 Lessons in biostatistics The test of independence Mary L. McHugh Department of Nursing, School of Health and Human Services, National University, Aero Court, San Diego, California, USA Corresponding author:
Statistics is the science of collecting, organizing, presenting, analyzing, and interpreting data to assist in making effective decisions
 Readings: OpenStax Textbook - Chapters 1 5 (online) Appendix D & E (online) Plous - Chapters 1, 5, 6, 13 (online) Introductory comments Describe how familiarity with statistical methods can - be associated
Learning Objectives 9/9/2013. Hypothesis Testing. Conflicts of Interest. Descriptive statistics: Numerical methods Measures of Central Tendency
 Conflicts of Interest I have no conflict of interest to disclose Biostatistics Kevin M. Sowinski, Pharm.D., FCCP Last-Chance Ambulatory Care Webinar Thursday, September 5, 2013 Learning Objectives For
Basic Steps in Planning Research. Dr. P.J. Brink and Dr. M.J. Wood
 Basic Steps in Planning Research Dr. P.J. Brink and Dr. M.J. Wood Research Levels Level 1: There is little or no literature available on the topic or on the population. The purpose is to describe what
9/4/2013. Decision Errors. Hypothesis Testing. Conflicts of Interest. Descriptive statistics: Numerical methods Measures of Central Tendency
 Conflicts of Interest I have no conflict of interest to disclose Biostatistics Kevin M. Sowinski, Pharm.D., FCCP Pharmacotherapy Webinar Review Course Tuesday, September 3, 2013 Descriptive statistics:
The Scientific Method
 The Scientific Method Objectives 1. To understand the central role of hypothesis testing in the modern scientific process. 2. To design and conduct an experiment using the scientific method. 3. To learn
Who? What? What do you want to know? What scope of the product will you evaluate?
 Usability Evaluation Why? Organizational perspective: To make a better product Is it usable and useful? Does it improve productivity? Reduce development and support costs Designer & developer perspective:
Research Methods 1 Handouts, Graham Hole,COGS - version 1.0, September 2000: Page 1:
 Research Methods 1 Handouts, Graham Hole,COGS - version 10, September 000: Page 1: T-TESTS: When to use a t-test: The simplest experimental design is to have two conditions: an "experimental" condition
Stepwise method Modern Model Selection Methods Quantile-Quantile plot and tests for normality
 Week 9 Hour 3 Stepwise method Modern Model Selection Methods Quantile-Quantile plot and tests for normality Stat 302 Notes. Week 9, Hour 3, Page 1 / 39 Stepwise Now that we've introduced interactions,
Do not write your name on this examination all 40 best
 Student #: Do not write your name on this examination Research in Psychology I; Final Exam Fall 200 Instructor: Jeff Aspelmeier NOTE: THIS EXAMINATION MAY NOT BE RETAINED BY STUDENTS This exam is worth