Research Analysis MICHAEL BERNSTEIN CS 376
|
|
|
- Kelly Boyd
- 6 years ago
- Views:
Transcription

1 Research Analysis MICHAEL BERNSTEIN CS 376
2 Last time What is a statistical test? Chi-square t-test Paired t-test 2
3 Today ANOVA Posthoc tests Two-way ANOVA Repeated measures ANOVA 3
4 Recall: hypothesis testing
5 Anatomy of a statistical test If your change had no effect, what would the world look like? No difference in means No slope in relationship This is known as the null hypothesis 5
6 Anatomy of a statistical test Given the difference you observed, how likely is it to have occurred by chance? Probability of seeing a mean difference at least this large, by chance, is Probability of seeing a slope at least this large, by chance, is
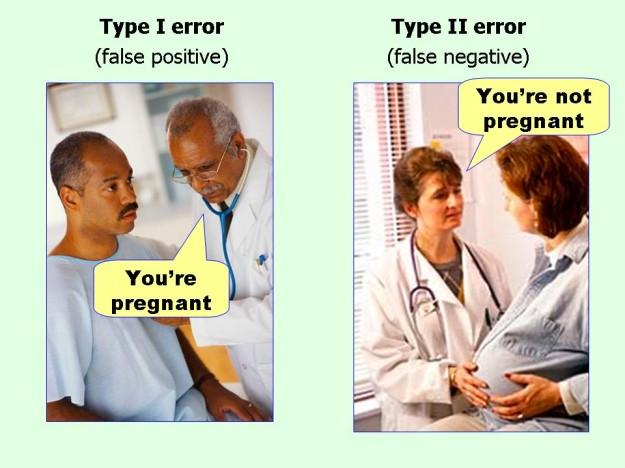
7 Errors Difference exists? Y N Y True positive Type 1 error publish false findings Difference detected? N Type 2 error get more data? True negative 7
8 Errors 8
9 p-value The probability of seeing the observed difference by chance In other words, P(Type I error) Typically accepted levels: 0.05, 0.01,
10 ANOVA
11 t-test: compare two means Do people fix more bugs with our IDE bug suggestion callouts? 11
12 ANOVA: compare N means Do people fix more bugs with our IDE bug suggestion callouts, with warnings, or with nothing? 12
13 Rough intuition for ANOVA test How much of the total variation can be accounted for by looking at the means of each condition? Ȳ 2 Ȳ 2 Ȳ Ȳ Ȳ Ȳ 1 1 total deviation from grand mean deviation of factor mean from grand mean deviation of response from factor mean 13
14 ANalysis Of VAriance (ANOVA) Degrees of freedom: how many values can vary? (Using n and r) Degrees of freedom in individual data points: n - 1 Degrees of freedom in factor level averages: r - 1 Combined: n - r 14
15 Finally: run the test! How large is the value we constructed from the F distribution? Test if F >F(1 ; r 1,n r) factor error ( what s left ) 3 factor levels hopefully F(2,21) p < observations top >> bottom 15
16 Reporting an ANOVA A one-way ANOVA revealed a significant difference in the effect of news feed source on number of likes (F(2, 21)=12.1, p<.001). 16
17 Posthoc tests
18 ANOVA! Are we done no Significant means One of the µ i are different. That s not very helpful: There is some difference between populating the Facebook news feed with friends vs. strangers vs. only Michael s status updates 18
19 Estimating pairwise differences Which pairs of factor levels are different from each other? Mean likes Friend feed Stranger feed Michael feed 19
20 Roughly: we do pairwise t-tests 90.0 Mean likes t >t(1 ; n r) t >t(1 ; n r) t >t(1 ; n r) Friend feed Stranger feed Michael feed 20
21 But familywise error! =.05 implies a.95 probability of being correct If we do m tests, the actual probability of being correct is now: m = <.95 21
22 Bonferroni correction Avoid familywise error by adjusting to be more conservative Divide by the number of comparisons you make 4 tests at =.05 implies using =.0125 Conservative but accurate method of compensating for multiple tests 22
23 Bonferroni correction 23
24 Tukey test Less conservative than Bonferroni Compares all pairs of factor level means 24
25 Reporting Posthoc tests using Bonferroni correction revealed that friend feed and Michael feed were significantly better than a stranger feed (p<.05), but the two were not significantly different from each other (p=.32). 25
26 Two-way ANOVA
27 Crossed study designs Suppose you wanted to measure the impact of two factors on total likes on Facebook: Strong ties vs. weak ties in your news feed Presence of a reminder of the last time you liked each friend s content (e.g., You last liked a story from John Hennessy in January ) This is a 2 x 2 study: two factor levels for each factor {tie strength, reminder} 27
28 Interaction effects Sometimes the basic model doesn t capture subtle interactions between factors Data: People who see strong ties and have a reminder are especially active Result: Grand mean 8, strong tie mean 11, reminder mean 7, but mean in this cell is 20 28
29 Two-factor ANOVA test Test for main effects and interaction factor or interaction SS MS F p Main effects are significant, but interaction effect is also significant 29
30 Significant interaction? Significant interactions mean that you can t just report the main effects the story is more complicated Inspect to figure it out: Pen Touch Technique A Technique B Technique C The slower techniques (B, C) harm Touch more than Pen 30
31 Repeated measures ANOVA
32 Within-subjects studies Control for individual variation using the mean response for each participant Before: we found the mean effect of each treatment Now: we find the mean effect of each participant 32
33 Repeated measures in R repeated measures error term effect of subtracting out the participant means remaining main effects 33
34 All together now
35 Always follow every step! 1. Visualize the data 2. Compute descriptive statistics (e.g., mean) 3. Remove outliers >2 standard deviations from the mean 4. Check for heteroskedasticity and non-normal data Try log, square root, or reciprocal transform ANOVA is robust against non-normal data, but not against heteroskedasticity 5. Run statistical test 6. Run any posthoc tests if necessary 35
Research Methods I ROB SEMMENS CS 376 WITH SIGNIFICANT INPUT FROM MICHAEL BERNSTEIN AND DAN SCHWARTZ
 Research Methods I ROB SEMMENS CS 376 WITH SIGNIFICANT INPUT FROM MICHAEL BERNSTEIN AND DAN SCHWARTZ Folks, do me a solid Put your last names in the file name. And do this on every other assignment in
Math Section MW 1-2:30pm SR 117. Bekki George 206 PGH
 Math 3339 Section 21155 MW 1-2:30pm SR 117 Bekki George bekki@math.uh.edu 206 PGH Office Hours: M 11-12:30pm & T,TH 10:00 11:00 am and by appointment More than Two Independent Samples: Single Factor Analysis
Analysis of Variance (ANOVA)
") Research Methods and Ethics in Psychology Week 4 Analysis of Variance (ANOVA) One Way Independent Groups ANOVA Brief revision of some important concepts To introduce the concept of familywise error rate.
Research Methods and Ethics in Psychology Week 4 Analysis of Variance (ANOVA) One Way Independent Groups ANOVA Brief revision of some important concepts To introduce the concept of familywise error rate.
Comparing 3 Means- ANOVA
 Comparing 3 Means- ANOVA Evaluation Methods & Statistics- Lecture 7 Dr Benjamin Cowan Research Example- Theory of Planned Behaviour Ajzen & Fishbein (1981) One of the most prominent models of behaviour
STA 3024 Spring 2013 EXAM 3 Test Form Code A UF ID #
 STA 3024 Spring 2013 Name EXAM 3 Test Form Code A UF ID # Instructions: This exam contains 34 Multiple Choice questions. Each question is worth 3 points, for a total of 102 points (there are TWO bonus
Chapter 12: Introduction to Analysis of Variance
 Chapter 12: Introduction to Analysis of Variance of Variance Chapter 12 presents the general logic and basic formulas for the hypothesis testing procedure known as analysis of variance (ANOVA). The purpose
Stat Wk 9: Hypothesis Tests and Analysis
 Stat 342 - Wk 9: Hypothesis Tests and Analysis Crash course on ANOVA, proc glm Stat 342 Notes. Week 9 Page 1 / 57 Crash Course: ANOVA AnOVa stands for Analysis Of Variance. Sometimes it s called ANOVA,
8/28/2017. If the experiment is successful, then the model will explain more variance than it can t SS M will be greater than SS R
 PSY 5101: Advanced Statistics for Psychological and Behavioral Research 1 If the ANOVA is significant, then it means that there is some difference, somewhere but it does not tell you which means are different
ANOVA in SPSS (Practical)
") ANOVA in SPSS (Practical) Analysis of Variance practical In this practical we will investigate how we model the influence of a categorical predictor on a continuous response. Centre for Multilevel Modelling
ANOVA in SPSS (Practical) Analysis of Variance practical In this practical we will investigate how we model the influence of a categorical predictor on a continuous response. Centre for Multilevel Modelling
Statistics for EES Factorial analysis of variance
 Statistics for EES Factorial analysis of variance Dirk Metzler http://evol.bio.lmu.de/_statgen 1. July 2013 1 ANOVA and F-Test 2 Pairwise comparisons and multiple testing 3 Non-parametric: The Kruskal-Wallis
SUMMER 2011 RE-EXAM PSYF11STAT - STATISTIK
 SUMMER 011 RE-EXAM PSYF11STAT - STATISTIK Full Name: Årskortnummer: Date: This exam is made up of three parts: Part 1 includes 30 multiple choice questions; Part includes 10 matching questions; and Part
The normal curve and standardisation. Percentiles, z-scores
 The normal curve and standardisation Percentiles, z-scores The normal curve Frequencies (histogram) Characterised by: Central tendency Mean Median Mode uni, bi, multi Positively skewed, negatively skewed
ANOVA. Thomas Elliott. January 29, 2013
 ANOVA Thomas Elliott January 29, 2013 ANOVA stands for analysis of variance and is one of the basic statistical tests we can use to find relationships between two or more variables. ANOVA compares the
Analysis of Variance (ANOVA) Program Transcript
 Program Transcript") Analysis of Variance (ANOVA) Program Transcript DR. JENNIFER ANN MORROW: Welcome to Analysis of Variance. My name is Dr. Jennifer Ann Morrow. In today's demonstration, I'll review with you the definition
Analysis of Variance (ANOVA) Program Transcript DR. JENNIFER ANN MORROW: Welcome to Analysis of Variance. My name is Dr. Jennifer Ann Morrow. In today's demonstration, I'll review with you the definition
15.301/310, Managerial Psychology Prof. Dan Ariely Recitation 8: T test and ANOVA
 15.301/310, Managerial Psychology Prof. Dan Ariely Recitation 8: T test and ANOVA Statistics does all kinds of stuff to describe data Talk about baseball, other useful stuff We can calculate the probability.
An Introduction to Bayesian Statistics
 An Introduction to Bayesian Statistics Robert Weiss Department of Biostatistics UCLA Fielding School of Public Health robweiss@ucla.edu Sept 2015 Robert Weiss (UCLA) An Introduction to Bayesian Statistics
appstats26.notebook April 17, 2015
 Chapter 26 Comparing Counts Objective: Students will interpret chi square as a test of goodness of fit, homogeneity, and independence. Goodness of Fit A test of whether the distribution of counts in one
Previously, when making inferences about the population mean,, we were assuming the following simple conditions:
 Chapter 17 Inference about a Population Mean Conditions for inference Previously, when making inferences about the population mean,, we were assuming the following simple conditions: (1) Our data (observations)
One-Way Independent ANOVA
 One-Way Independent ANOVA Analysis of Variance (ANOVA) is a common and robust statistical test that you can use to compare the mean scores collected from different conditions or groups in an experiment.
Notes for laboratory session 2
 Notes for laboratory session 2 Preliminaries Consider the ordinary least-squares (OLS) regression of alcohol (alcohol) and plasma retinol (retplasm). We do this with STATA as follows:. reg retplasm alcohol
Small Group Presentations
 Admin Assignment 1 due next Tuesday at 3pm in the Psychology course centre. Matrix Quiz during the first hour of next lecture. Assignment 2 due 13 May at 10am. I will upload and distribute these at the
Problem #1 Neurological signs and symptoms of ciguatera poisoning as the start of treatment and 2.5 hours after treatment with mannitol.
 Ho (null hypothesis) Ha (alternative hypothesis) Problem #1 Neurological signs and symptoms of ciguatera poisoning as the start of treatment and 2.5 hours after treatment with mannitol. Hypothesis: Ho:
One-Way ANOVAs t-test two statistically significant Type I error alpha null hypothesis dependant variable Independent variable three levels;
 1 One-Way ANOVAs We have already discussed the t-test. The t-test is used for comparing the means of two groups to determine if there is a statistically significant difference between them. The t-test
Chapter 9. Factorial ANOVA with Two Between-Group Factors 10/22/ Factorial ANOVA with Two Between-Group Factors
 Chapter 9 Factorial ANOVA with Two Between-Group Factors 10/22/2001 1 Factorial ANOVA with Two Between-Group Factors Recall that in one-way ANOVA we study the relation between one criterion variable and
MEA DISCUSSION PAPERS
 Inference Problems under a Special Form of Heteroskedasticity Helmut Farbmacher, Heinrich Kögel 03-2015 MEA DISCUSSION PAPERS mea Amalienstr. 33_D-80799 Munich_Phone+49 89 38602-355_Fax +49 89 38602-390_www.mea.mpisoc.mpg.de
Content. Basic Statistics and Data Analysis for Health Researchers from Foreign Countries. Research question. Example Newly diagnosed Type 2 Diabetes
 Content Quantifying association between continuous variables. Basic Statistics and Data Analysis for Health Researchers from Foreign Countries Volkert Siersma siersma@sund.ku.dk The Research Unit for General
A Brief (very brief) Overview of Biostatistics. Jody Kreiman, PhD Bureau of Glottal Affairs
 Overview of Biostatistics. Jody Kreiman, PhD Bureau of Glottal Affairs") A Brief (very brief) Overview of Biostatistics Jody Kreiman, PhD Bureau of Glottal Affairs What We ll Cover Fundamentals of measurement Parametric versus nonparametric tests Descriptive versus inferential
A Brief (very brief) Overview of Biostatistics Jody Kreiman, PhD Bureau of Glottal Affairs What We ll Cover Fundamentals of measurement Parametric versus nonparametric tests Descriptive versus inferential
Comparing multiple proportions
 Comparing multiple proportions February 24, 2017 psych10.stanford.edu Announcements / Action Items Practice and assessment problem sets will be posted today, might be after 5 PM Reminder of OH switch today
HS Exam 1 -- March 9, 2006
 Please write your name on the back. Don t forget! Part A: Short answer, multiple choice, and true or false questions. No use of calculators, notes, lab workbooks, cell phones, neighbors, brain implants,
Samples, Sample Size And Sample Error. Research Methodology. How Big Is Big? Estimating Sample Size. Variables. Variables 2/25/2018
 Research Methodology Samples, Sample Size And Sample Error Sampling error = difference between sample and population characteristics Reducing sampling error is the goal of any sampling technique As sample
Analysis of Variance: repeated measures
 Analysis of Variance: repeated measures Tests for comparing three or more groups or conditions: (a) Nonparametric tests: Independent measures: Kruskal-Wallis. Repeated measures: Friedman s. (b) Parametric
Week 8 Hour 1: More on polynomial fits. The AIC. Hour 2: Dummy Variables what are they? An NHL Example. Hour 3: Interactions. The stepwise method.
 Week 8 Hour 1: More on polynomial fits. The AIC Hour 2: Dummy Variables what are they? An NHL Example Hour 3: Interactions. The stepwise method. Stat 302 Notes. Week 8, Hour 1, Page 1 / 34 Human growth
INTENDED LEARNING OUTCOMES
 FACTORIAL ANOVA INTENDED LEARNING OUTCOMES Revise factorial ANOVA (from our last lecture) Discuss degrees of freedom in factorial ANOVA Recognise main effects and interactions Discuss simple effects QUICK
AMSc Research Methods Research approach IV: Experimental [2]
![AMSc Research Methods Research approach IV: Experimental [2]](/thumbs/96/127502980.jpg "AMSc Research Methods Research approach IV: Experimental [2]") AMSc Research Methods Research approach IV: Experimental [2] Marie-Luce Bourguet mlb@dcs.qmul.ac.uk Statistical Analysis 1 Statistical Analysis Descriptive Statistics : A set of statistical procedures
AMSc Research Methods Research approach IV: Experimental [2] Marie-Luce Bourguet mlb@dcs.qmul.ac.uk Statistical Analysis 1 Statistical Analysis Descriptive Statistics : A set of statistical procedures
Assignment #6. Chapter 10: 14, 15 Chapter 11: 14, 18. Due tomorrow Nov. 6 th by 2pm in your TA s homework box
 Assignment #6 Chapter 10: 14, 15 Chapter 11: 14, 18 Due tomorrow Nov. 6 th by 2pm in your TA s homework box Assignment #7 Chapter 12: 18, 24 Chapter 13: 28 Due next Friday Nov. 13 th by 2pm in your TA
Study Guide for the Final Exam
 Study Guide for the Final Exam When studying, remember that the computational portion of the exam will only involve new material (covered after the second midterm), that material from Exam 1 will make
Unit 1 Exploring and Understanding Data
 Unit 1 Exploring and Understanding Data Area Principle Bar Chart Boxplot Conditional Distribution Dotplot Empirical Rule Five Number Summary Frequency Distribution Frequency Polygon Histogram Interquartile
Tutorial 3: MANOVA. Pekka Malo 30E00500 Quantitative Empirical Research Spring 2016
 Tutorial 3: Pekka Malo 30E00500 Quantitative Empirical Research Spring 2016 Step 1: Research design Adequacy of sample size Choice of dependent variables Choice of independent variables (treatment effects)
Chapter 11. Experimental Design: One-Way Independent Samples Design
 11-1 Chapter 11. Experimental Design: One-Way Independent Samples Design Advantages and Limitations Comparing Two Groups Comparing t Test to ANOVA Independent Samples t Test Independent Samples ANOVA Comparing
STAT 113: PAIRED SAMPLES (MEAN OF DIFFERENCES)
") STAT 113: PAIRED SAMPLES (MEAN OF DIFFERENCES) In baseball after a player gets a hit, they need to decide whether to stop at first base, or try to stretch their hit from a single to a double. Does the
STAT 113: PAIRED SAMPLES (MEAN OF DIFFERENCES) In baseball after a player gets a hit, they need to decide whether to stop at first base, or try to stretch their hit from a single to a double. Does the
Regression Including the Interaction Between Quantitative Variables
 Regression Including the Interaction Between Quantitative Variables The purpose of the study was to examine the inter-relationships among social skills, the complexity of the social situation, and performance
Repeated Measures ANOVA and Mixed Model ANOVA. Comparing more than two measurements of the same or matched participants
 Repeated Measures ANOVA and Mixed Model ANOVA Comparing more than two measurements of the same or matched participants Data files Fatigue.sav MentalRotation.sav AttachAndSleep.sav Attitude.sav Homework:
Business Statistics Probability
 Business Statistics The following was provided by Dr. Suzanne Delaney, and is a comprehensive review of Business Statistics. The workshop instructor will provide relevant examples during the Skills Assessment
Title: A robustness study of parametric and non-parametric tests in Model-Based Multifactor Dimensionality Reduction for epistasis detection
 Author's response to reviews Title: A robustness study of parametric and non-parametric tests in Model-Based Multifactor Dimensionality Reduction for epistasis detection Authors: Jestinah M Mahachie John
Chapter 3: Examining Relationships
 Name Date Per Key Vocabulary: response variable explanatory variable independent variable dependent variable scatterplot positive association negative association linear correlation r-value regression
Standard Deviation and Standard Error Tutorial. This is significantly important. Get your AP Equations and Formulas sheet
 Standard Deviation and Standard Error Tutorial This is significantly important. Get your AP Equations and Formulas sheet The Basics Let s start with a review of the basics of statistics. Mean: What most
Part I: Alcohol Metabolization Explore and Explain
 Name Date Part I: Alcohol Metabolization Explore and Explain Just like any other type of food or beverage, alcohol is digested and then metabolized by the body. When a substance is metabolized by the body,
Biology 345: Biometry Fall 2005 SONOMA STATE UNIVERSITY Lab Exercise 8 One Way ANOVA and comparisons among means Introduction
 Biology 345: Biometry Fall 2005 SONOMA STATE UNIVERSITY Lab Exercise 8 One Way ANOVA and comparisons among means Introduction In this exercise, we will conduct one-way analyses of variance using two different
CHAPTER ONE CORRELATION
 CHAPTER ONE CORRELATION 1.0 Introduction The first chapter focuses on the nature of statistical data of correlation. The aim of the series of exercises is to ensure the students are able to use SPSS to
Investigating the robustness of the nonparametric Levene test with more than two groups
 Psicológica (2014), 35, 361-383. Investigating the robustness of the nonparametric Levene test with more than two groups David W. Nordstokke * and S. Mitchell Colp University of Calgary, Canada Testing
MMI 409 Spring 2009 Final Examination Gordon Bleil. 1. Is there a difference in depression as a function of group and drug?
 MMI 409 Spring 2009 Final Examination Gordon Bleil Table of Contents Research Scenario and General Assumptions Questions for Dataset (Questions are hyperlinked to detailed answers) 1. Is there a difference
Common Statistical Issues in Biomedical Research
 Common Statistical Issues in Biomedical Research Howard Cabral, Ph.D., M.P.H. Boston University CTSI Boston University School of Public Health Department of Biostatistics May 15, 2013 1 Overview of Basic
Practical Statistical Reasoning in Clinical Trials
 Seminar Series to Health Scientists on Statistical Concepts 2011-2012 Practical Statistical Reasoning in Clinical Trials Paul Wakim, PhD Center for the National Institute on Drug Abuse 10 January 2012
Biostatistics 3. Developed by Pfizer. March 2018
 BROUGHT TO YOU BY Biostatistics 3 Developed by Pfizer March 2018 This learning module is intended for UK healthcare professionals only. Job bag: PP-GEP-GBR-0986 Date of preparation March 2018. Agenda I.
Profile Analysis. Intro and Assumptions Psy 524 Andrew Ainsworth
 Profile Analysis Intro and Assumptions Psy 524 Andrew Ainsworth Profile Analysis Profile analysis is the repeated measures extension of MANOVA where a set of DVs are commensurate (on the same scale). Profile
Behavioral Data Mining. Lecture 4 Measurement
 Behavioral Data Mining Lecture 4 Measurement Outline Hypothesis testing Parametric statistical tests Non-parametric tests Precision-Recall plots ROC plots Hardware update Icluster machines are ready for
Day 11: Measures of Association and ANOVA
 Day 11: Measures of Association and ANOVA Daniel J. Mallinson School of Public Affairs Penn State Harrisburg mallinson@psu.edu PADM-HADM 503 Mallinson Day 11 November 2, 2017 1 / 45 Road map Measures of
Kidane Tesfu Habtemariam, MASTAT, Principle of Stat Data Analysis Project work
 1 1. INTRODUCTION Food label tells the extent of calories contained in the food package. The number tells you the amount of energy in the food. People pay attention to calories because if you eat more
Undesirable Optimality Results in Multiple Testing? Charles Lewis Dorothy T. Thayer
 Undesirable Optimality Results in Multiple Testing? Charles Lewis Dorothy T. Thayer 1 Intuitions about multiple testing: - Multiple tests should be more conservative than individual tests. - Controlling
Levene Statistic df1 df2 Sig
 Activity #: Follow-up ests (Bonferroni method) ection 1. Resources: handicap.sav he U.. Vocational Rehabilitation Act of 19 prohibited discrimination against people with physical disabilities. he act defined
Basic Statistics and Data Analysis in Work psychology: Statistical Examples
 Basic Statistics and Data Analysis in Work psychology: Statistical Examples WORK PSYCHOLOGY INTRODUCTION In this chapter we examine a topic which is given too little coverage in most texts of this kind,
(C) Jamalludin Ab Rahman
 Jamalludin Ab Rahman") SPSS Note The GLM Multivariate procedure is based on the General Linear Model procedure, in which factors and covariates are assumed to have a linear relationship to the dependent variable. Factors. Categorical
SPSS Note The GLM Multivariate procedure is based on the General Linear Model procedure, in which factors and covariates are assumed to have a linear relationship to the dependent variable. Factors. Categorical
Hypothesis Testing. Richard S. Balkin, Ph.D., LPC-S, NCC
 Hypothesis Testing Richard S. Balkin, Ph.D., LPC-S, NCC Overview When we have questions about the effect of a treatment or intervention or wish to compare groups, we use hypothesis testing Parametric statistics
Comparison of two means
 1 Comparison of two means Most studies are comparative in that they compare outcomes from one group with outcomes from another, for example the mean blood pressure in reponse to two different treatments.
Online Introduction to Statistics
 APPENDIX Online Introduction to Statistics CHOOSING THE CORRECT ANALYSIS To analyze statistical data correctly, you must choose the correct statistical test. The test you should use when you have interval
Math 261 Exam I Spring Name:
 Math 261 Exam I Spring 2008 Name: Instructions: Write your answers clearly on the exam paper. Show work to receive partial credit. Use the back of the page if you need more space but please note that you
Nonparametric Linkage Analysis. Nonparametric Linkage Analysis
 Limitations of Parametric Linkage Analysis We previously discued parametric linkage analysis Genetic model for the disease must be specified: allele frequency parameters and penetrance parameters Lod scores
Sheila Barron Statistics Outreach Center 2/8/2011
 Sheila Barron Statistics Outreach Center 2/8/2011 What is Power? When conducting a research study using a statistical hypothesis test, power is the probability of getting statistical significance when
STP 231 Example FINAL
 STP 231 Example FINAL Instructor: Ela Jackiewicz Honor Statement: I have neither given nor received information regarding this exam, and I will not do so until all exams have been graded and returned.
Overview of Lecture. Survey Methods & Design in Psychology. Correlational statistics vs tests of differences between groups
 Survey Methods & Design in Psychology Lecture 10 ANOVA (2007) Lecturer: James Neill Overview of Lecture Testing mean differences ANOVA models Interactions Follow-up tests Effect sizes Parametric Tests
Chapter 8: Estimating with Confidence
 Chapter 8: Estimating with Confidence Key Vocabulary: point estimator point estimate confidence interval margin of error interval confidence level random normal independent four step process level C confidence
Still important ideas
 Readings: OpenStax - Chapters 1 11 + 13 & Appendix D & E (online) Plous - Chapters 2, 3, and 4 Chapter 2: Cognitive Dissonance, Chapter 3: Memory and Hindsight Bias, Chapter 4: Context Dependence Still
PSY 216: Elementary Statistics Exam 4
 Name: PSY 16: Elementary Statistics Exam 4 This exam consists of multiple-choice questions and essay / problem questions. For each multiple-choice question, circle the one letter that corresponds to the
Supplementary Material. other ethnic backgrounds. All but six of the yoked pairs were matched on ethnicity. Results
 Supplementary Material S1 Methodological Details Participants The sample was 80% Caucasian, 16.7% Asian or Asian American, and 3.3% from other ethnic backgrounds. All but six of the yoked pairs were matched
Testing Means. Related-Samples t Test With Confidence Intervals. 6. Compute a related-samples t test and interpret the results.
 10 Learning Objectives Testing Means After reading this chapter, you should be able to: Related-Samples t Test With Confidence Intervals 1. Describe two types of research designs used when we select related
Section 3.2 Least-Squares Regression
 Section 3.2 Least-Squares Regression Linear relationships between two quantitative variables are pretty common and easy to understand. Correlation measures the direction and strength of these relationships.
Reliability of Ordination Analyses
 Reliability of Ordination Analyses Objectives: Discuss Reliability Define Consistency and Accuracy Discuss Validation Methods Opening Thoughts Inference Space: What is it? Inference space can be defined
CHAPTER OBJECTIVES - STUDENTS SHOULD BE ABLE TO:
 3 Chapter 8 Introducing Inferential Statistics CHAPTER OBJECTIVES - STUDENTS SHOULD BE ABLE TO: Explain the difference between descriptive and inferential statistics. Define the central limit theorem and
C-1: Variables which are measured on a continuous scale are described in terms of three key characteristics central tendency, variability, and shape.
 MODULE 02: DESCRIBING DT SECTION C: KEY POINTS C-1: Variables which are measured on a continuous scale are described in terms of three key characteristics central tendency, variability, and shape. C-2:
FORM C Dr. Sanocki, PSY 3204 EXAM 1 NAME
 PSYCH STATS OLD EXAMS, provided for self-learning. LEARN HOW TO ANSWER the QUESTIONS; memorization of answers won t help. All answers are in the textbook or lecture. Instructors can provide some clarification
Political Science 15, Winter 2014 Final Review
 Political Science 15, Winter 2014 Final Review The major topics covered in class are listed below. You should also take a look at the readings listed on the class website. Studying Politics Scientifically
Statistical questions for statistical methods
 Statistical questions for statistical methods Unpaired (two-sample) t-test DECIDE: Does the numerical outcome have a relationship with the categorical explanatory variable? Is the mean of the outcome the
Announcement. Homework #2 due next Friday at 5pm. Midterm is in 2 weeks. It will cover everything through the end of next week (week 5).
.") Announcement Homework #2 due next Friday at 5pm. Midterm is in 2 weeks. It will cover everything through the end of next week (week 5). Political Science 15 Lecture 8: Descriptive Statistics (Part 1) Data
Announcement Homework #2 due next Friday at 5pm. Midterm is in 2 weeks. It will cover everything through the end of next week (week 5). Political Science 15 Lecture 8: Descriptive Statistics (Part 1) Data
Use the above variables and any you might need to construct to specify the MODEL A/C comparisons you would use to ask the following questions.
 Fall, 2002 Grad Stats Final Exam There are four questions on this exam, A through D, and each question has multiple sub-questions. Unless otherwise indicated, each sub-question is worth 3 points. Question
MENDELIAN GENETICS. MENDEL RULE AND LAWS Please read and make sure you understand the following instructions and knowledge before you go on.
 MENDELIAN GENETICS Objectives Upon completion of this lab, students should: 1. Understand the principles and terms used in Mendelian genetics. 2. Know how to complete a Punnett square to estimate phenotypic
AP Statistics. Semester One Review Part 1 Chapters 1-5
 AP Statistics Semester One Review Part 1 Chapters 1-5 AP Statistics Topics Describing Data Producing Data Probability Statistical Inference Describing Data Ch 1: Describing Data: Graphically and Numerically
Objectives. Quantifying the quality of hypothesis tests. Type I and II errors. Power of a test. Cautions about significance tests
 Objectives Quantifying the quality of hypothesis tests Type I and II errors Power of a test Cautions about significance tests Designing Experiments based on power Evaluating a testing procedure The testing
Overview of Non-Parametric Statistics
 Overview of Non-Parametric Statistics LISA Short Course Series Mark Seiss, Dept. of Statistics April 7, 2009 Presentation Outline 1. Homework 2. Review of Parametric Statistics 3. Overview Non-Parametric
Appraisal of Statistical Practices in HRI vis-á-vis the T-Test for Likert Items/Scales
 Appraisal of Statistical Practices in HRI vis-á-vis the T-Test for Likert Items/Scales Matthew Gombolay and Ankit Shah Massachusetts Institute of Technology 77 Massachusetts Avenue Cambridge, MA 02139
Applied Statistical Analysis EDUC 6050 Week 4
 Applied Statistical Analysis EDUC 6050 Week 4 Finding clarity using data Today 1. Hypothesis Testing with Z Scores (continued) 2. Chapters 6 and 7 in Book 2 Review! = $ & '! = $ & ' * ) 1. Which formula
Title:Mixed-strain Housing for Female C57BL/6, DBA/2, and BALB/c Mice: Validating a Split-plot Design that promotes Refinement and Reduction
 Author's response to reviews Title:Mixed-strain Housing for Female C57BL/6, DBA/2, and BALB/c Mice: Validating a Split-plot Design that promotes Refinement and Reduction Authors: Michael Walker Mr (mwalk04@uoguelph.ca)
Theoretical Exam. Monday 15 th, Instructor: Dr. Samir Safi. 1. Write your name, student ID and section number.
 بسم االله الرحمن الرحيم COMPUTER & DATA ANALYSIS Theoretical Exam FINAL THEORETICAL EXAMINATION Monday 15 th, 2007 Instructor: Dr. Samir Safi Name: ID Number: Instructor: INSTRUCTIONS: 1. Write your name,
PSYCHOLOGY 320L Problem Set #4: Estimating Sample Size, Post Hoc Tests, and Two-Factor ANOVA
 PSYCHOLOGY 320L Problem Set #4: Estimating Sample Size, Post Hoc Tests, and Two-Factor ANOVA Name: Score: 1. Suppose you are planning an experiment for a class project with a group of students and you
Final Exam Practice Test
 Final Exam Practice Test The t distribution and z-score distributions are located in the back of your text book (the appendices) You will be provided with a new copy of each during your final exam True
To open a CMA file > Download and Save file Start CMA Open file from within CMA
 Example name Effect size Analysis type Level Tamiflu Hospitalized Risk ratio Basic Basic Synopsis The US government has spent 1.4 billion dollars to stockpile Tamiflu, in anticipation of a possible flu
EPS 625 INTERMEDIATE STATISTICS TWO-WAY ANOVA IN-CLASS EXAMPLE (FLEXIBILITY)
") EPS 625 INTERMEDIATE STATISTICS TO-AY ANOVA IN-CLASS EXAMPLE (FLEXIBILITY) A researcher conducts a study to evaluate the effects of the length of an exercise program on the flexibility of female and male
EPS 625 INTERMEDIATE STATISTICS TO-AY ANOVA IN-CLASS EXAMPLE (FLEXIBILITY) A researcher conducts a study to evaluate the effects of the length of an exercise program on the flexibility of female and male
CHAPTER TWO REGRESSION
 CHAPTER TWO REGRESSION 2.0 Introduction The second chapter, Regression analysis is an extension of correlation. The aim of the discussion of exercises is to enhance students capability to assess the effect
04/12/2014. Research Methods in Psychology. Chapter 6: Independent Groups Designs. What is your ideas? Testing
 Research Methods in Psychology Chapter 6: Independent Groups Designs 1 Why Psychologists Conduct Experiments? What is your ideas? 2 Why Psychologists Conduct Experiments? Testing Hypotheses derived from
RenTip133 11/25/16 Evaluating Feed Additives for Dairy Cows
 RenTip133 11/25/16 Evaluating Feed Additives for Dairy Cows There are many products on the market today with a lot of sales people telling very convincing stories about their product. Sense much of these
Overview. Goals of Interpretation. Methodology. Reasons to Read and Evaluate
 Overview Critical Literature Evaluation and Biostatistics Ahl Ashley N. Lewis, PharmD, BCPS Clinical Specialist, Drug Information UNC Hospitals Background Review of basic statistics Statistical tests Clinical